Heterochromatin assembly and transcriptome repression by Set1 in coordination with a class II histone deacetylase
- Boston College, United States
Figures
Figure 1
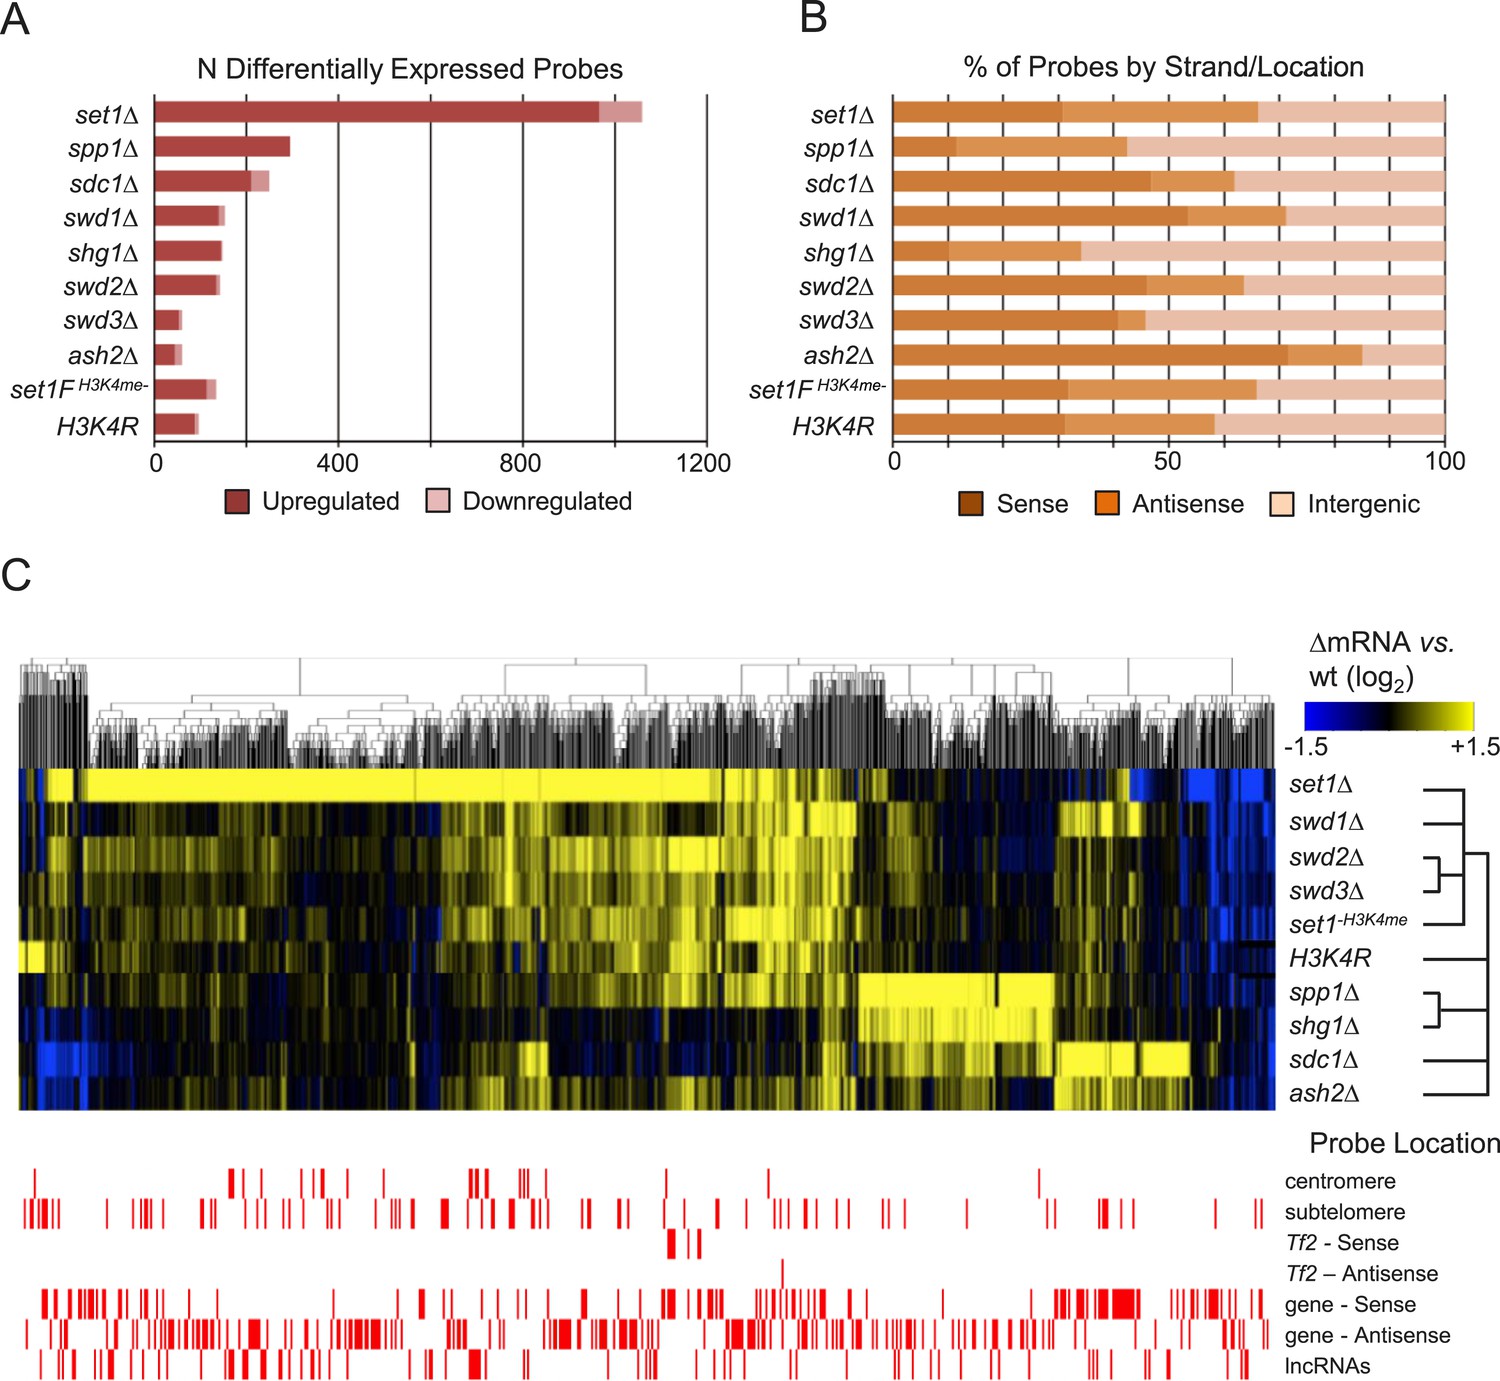
Set1/COMPASS subunits act primarily as transcriptional repressors.
(A) Counts and (B) percentage of probes by matching feature strand/position of differentially expressed probes from custom 44,000-probe tiling microarrays. Significantly changed probes were defined as absolute log2 fold-changes ≥ 1.5, false discovery rate (FDR)-adjusted p values <0.05 from duplicate arrays. (C) Hierarchical clustering of differentially expressed probes (absolute log2 fold-change vs wild-type ≥1.5, p < 0.05) in Set1C/H3K4me mutant strains. Probes showing significant expression changes in the indicated mutant versus wild-type strains were clustered using the HOPACH algorithm. The bottom panel shows the positions of probes matching repetitive centromeric, subtelomeric (100,000 bp end sequences of all chromosomes), Tf2 retrotransposons, the sense or antisense strands of annotated protein coding genes, or intergenic long noncoding RNAs (lncRNAs).
-
Figure 1—source data 1
Gene ontology (GO) enrichment in Set1C/COMPASS mutant expression profiling microarrays.
GO term mappings were obtained from www.pombase.org. Enrichment analysis was performed using the R/Bioconductor GOstats package for known transcripts displaying statistically significant changes in the indicated mutant vs wild-type strain (absolute log2 fold-change > 1.5, FDR-adjusted p-value < 0.05). Only significantly enriched GO terms (p < 0.05) are included. See file header for complete column descriptions.
- https://doi.org/10.7554/eLife.04506.004
-
Figure 1—source data 2
Comparative analysis of common enriched GO terms in Set1C/COMPASS mutant expression profiling microarrays.
p-value data for Sense strand gene sets from Figure 1—source data 1 were retabulated to facilitate comparison of GO enrichment between Set1C/COMPASS mutants. min_Pvalue denotes the minimum p-value across all experiments.
- https://doi.org/10.7554/eLife.04506.027
Figure 2 with 2 supplements

Set1 localizes to lowly expressed and repressed loci.
(A and B) Enrichment of Set1 and RNA polymerase II (Pol II) determined by chromatin immunoprecipitation (ChIP)–chip displaying significant Set1 enrichment at highly transcribed genes (A) and repressed genes (B). Positions of genomic features on forward (top) and reverse strands (bottom), top panel. Black bars denote protein coding gene open reading frames (ORFs); white, associated untranslated regions (UTRs); orange, noncoding RNAs. Pol II ChIP–chip data was derived from Chen et al. (2008). (C) Set1 enrichment relative to transcript abundance and Pol II occupancy. Comparisons of RNA-seq expression levels (blue), Pol II ChIP-seq enrichment (green) and Set1 ChIP–chip enrichment (red) at loci showing significant Set1 enrichment (N = 290 transcripts with nonoverlapping annotated features). Processed RNA-Seq FPKM data were obtained from Rhind et al. (2011) and Pol II ChIP-seq data from Zaratiegui et al. (2010). The horizontal red line denotes mean expression for all Schizosaccharomyces pombe transcripts (Rhind et al., 2011). (D) Gene ontology (GO) analysis of Set1-bound transcripts by expression level quintile. Representative GO terms were significantly enriched (p ≤ 1 × 10⁻⁵, hypergeometric test) and found exclusively in quintiles of highly expressed (top panel) versus lowly expressed genes (bottom panel). See Figure 2—source data 1 for a complete list of all significantly enriched GO terms/quintile.
-
Figure 2—source data 1
Gene ontology (GO) enrichment of Set1-localized transcripts (ChIP-chip) by target expression level.
Set1-targeted transcripts (see Figure 2C) were rank ordered by absolute expression level and divided into quintiles. GO analysis of each quintile was performed as for Figure 1—source data 1.
- https://doi.org/10.7554/eLife.04506.006
Figure 2—figure supplement 1
Set1 localization at active and repressed loci.
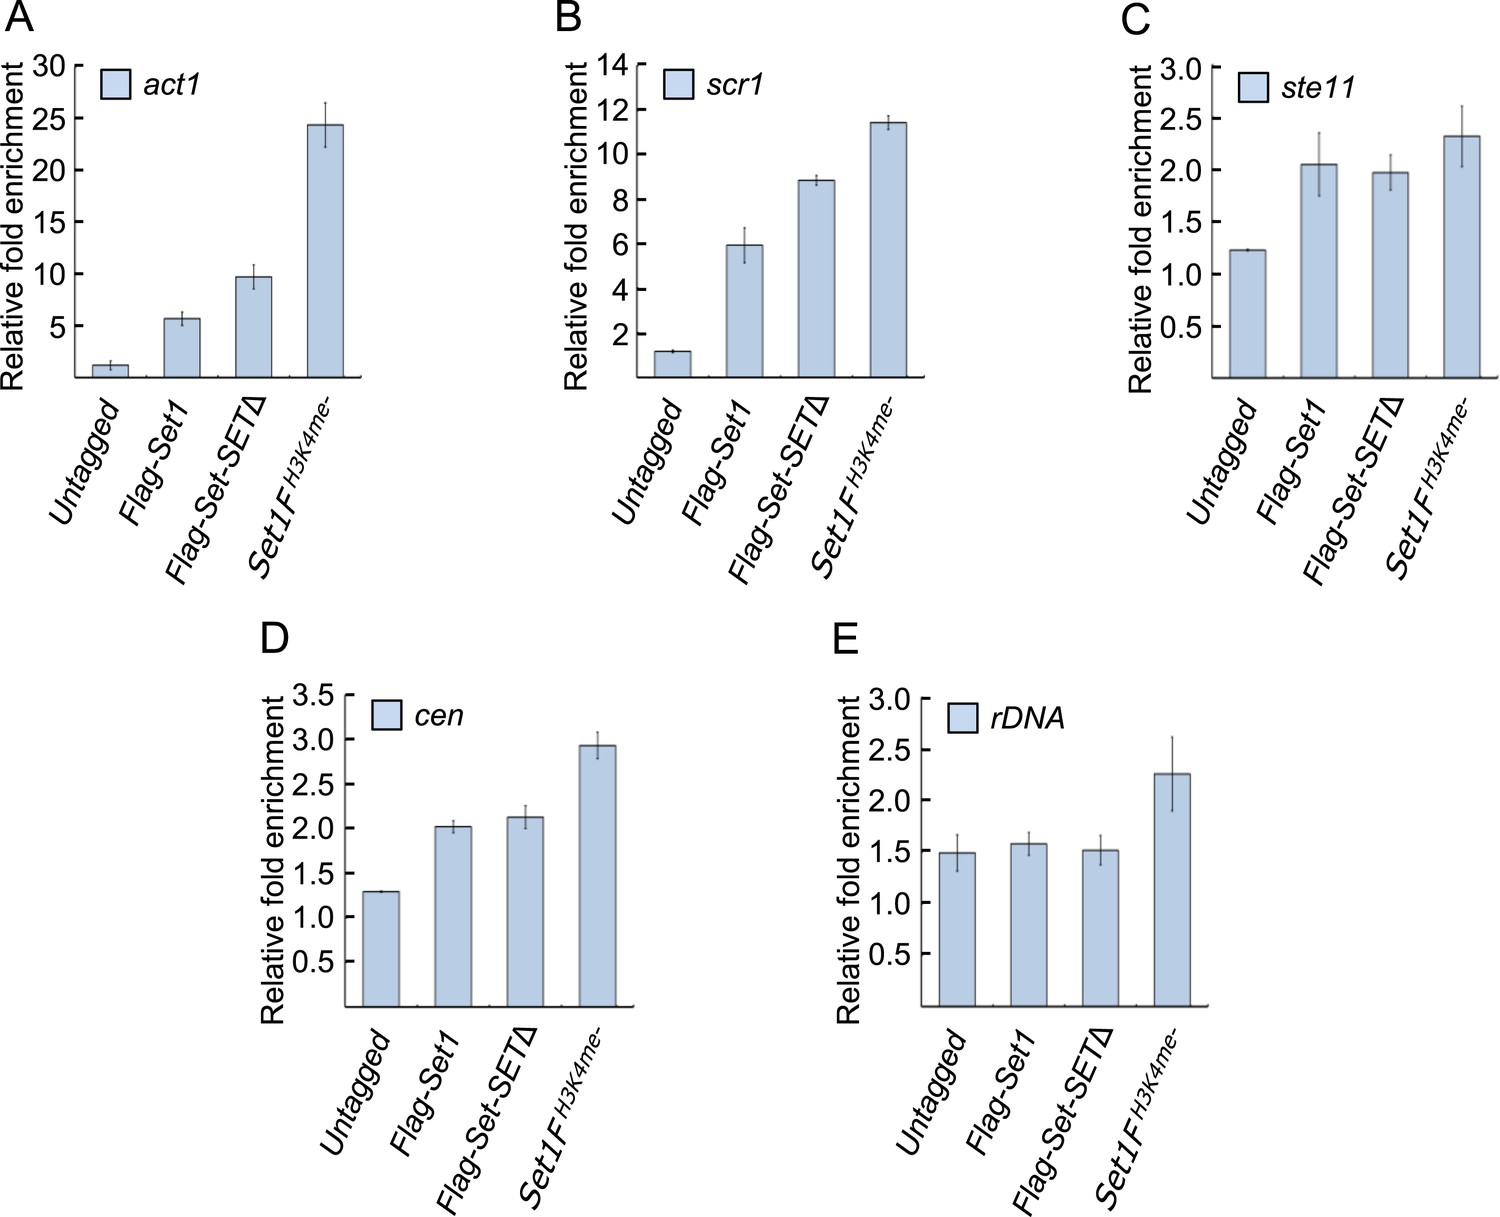
Localization of FLAG-set1 or Set1 mutants deficient in H3K4me (set1FH3K4me−), or lacking the catalytic domain (set1-SETΔ) at (A) the housekeeping gene act1, (B and C) repressed genes scr1 and ste11, (D) pericentromeric (cen), or (E) rDNA array was assessed by chromatin immunoprecipitation (ChIP) followed by qPCR. Relative ChIP fold enrichment to input (whole cell extract) was calculated using the 2−ΔΔCt method after normalization by primers corresponding to mitochondrial DNA (Lorenz et al., 2012). (SD, error bars; n = 3 qPCR replicates.) Untagged corresponds to a wild-type strain that did not express any FLAG tagged protein.
Figure 2—figure supplement 2
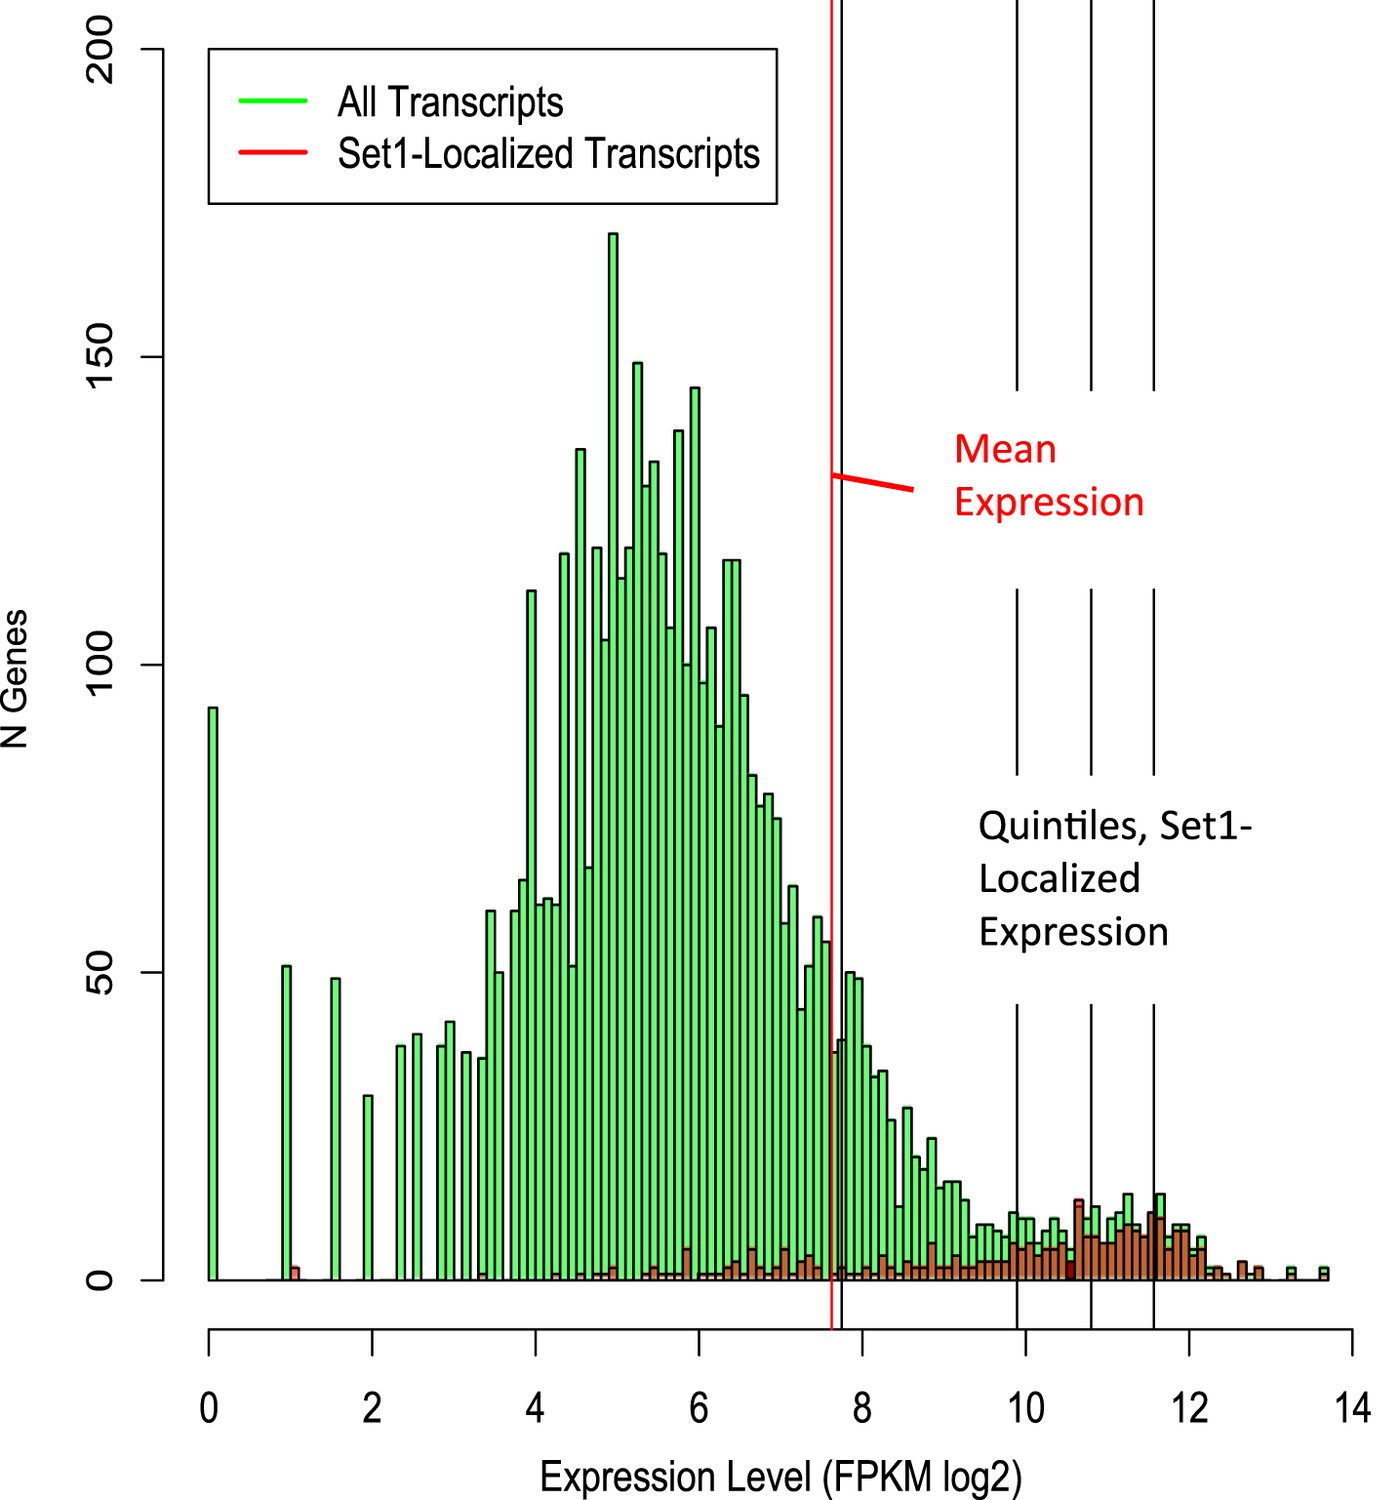
Distribution of Set1-localized versus all Schizosaccharomyces pombe transcripts by absolute expression level.
Histogram showing number of genes by expression level (green bars), overlaid with Set1-bound transcripts (red bars). The red vertical line denotes mean log2 FPKM, all S. pombe transcripts; black lines denote quintiles of Set1-bound genes with RNA-Seq transcripts. Processed RNA-Seq FPKM data were obtained from (Rhind et al., 2011).
Figure 3 with 4 supplements
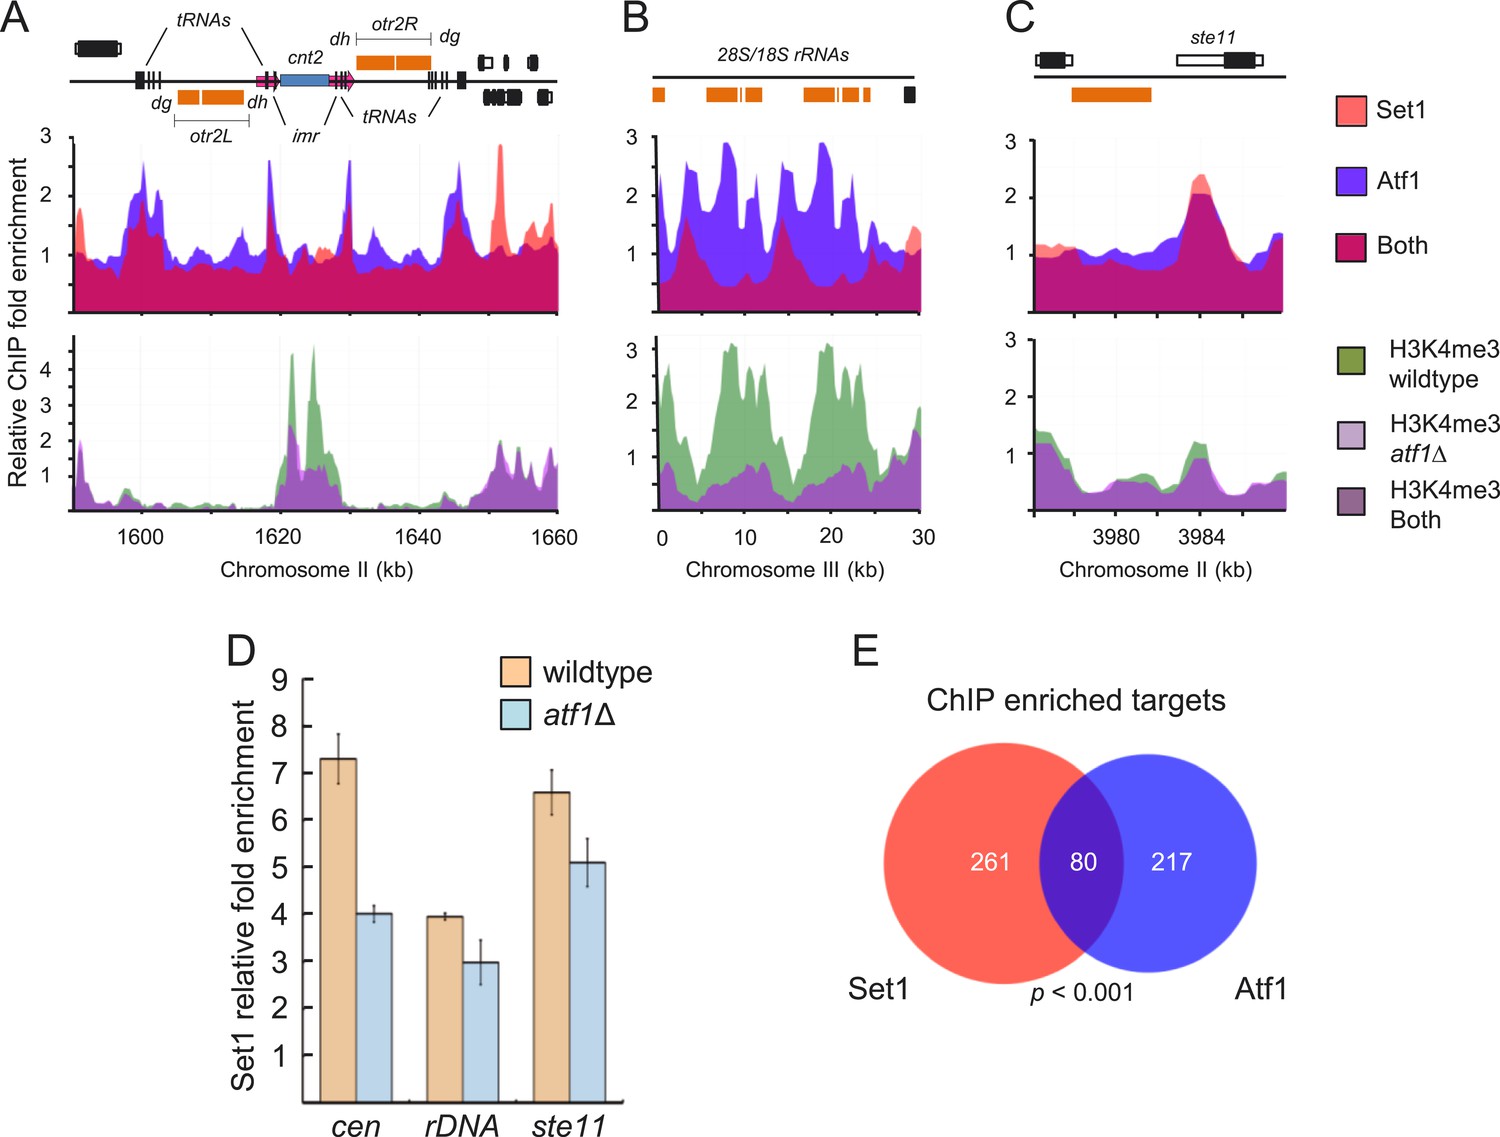
Atf1 mediates recruitment of Set1 to centromeres, rDNA, and ste11 and contributes to H3K4 methylation.
(A) Colocalization of Atf1 and Set1 (upper panels) at centromere II, (B) rDNA array, and (C) the promoter of the developmental regulator ste11. Enrichment of H3K4me3 (A–C, lower panels) and Set1 (D) at the aforementioned loci in wild-type and atf1Δ cells. Enrichment of Set1, Atf1 and H3K4me3 at indicated loci (A–C) was done by chromatin immunoprecipitation (ChIP)–chip. (E) Set1 and Atf1 regulate a common set of targets. Venn diagram of Atf1 and Set1 ChIP–chip peaks. Peaks were deemed overlapping if found within 1 kb of each other. The p value was determined by a hypergeometric test with population size N = 3667 Schizosaccharomyces pombe intergenic regions.
-
Figure 3—source data 1
Differential enrichment of H3K4me3 levels in atf1Δ vs. wild-type cells.
Comparative statistical analysis of H3K4me3/input ChIP-chip enrichment levels in wild-type vs. atf1Δ microarray experiments was performed using the R/Bioconductor limma package (see Materials and Methods). Shown are significantly changed microarray probes, probe chromosomal position, corresponding genomic feature, log2 fold change in wild-type vs. atf1Δ experiments and FDR-adjusted p-value.
- https://doi.org/10.7554/eLife.04506.010
Figure 3—figure supplement 1
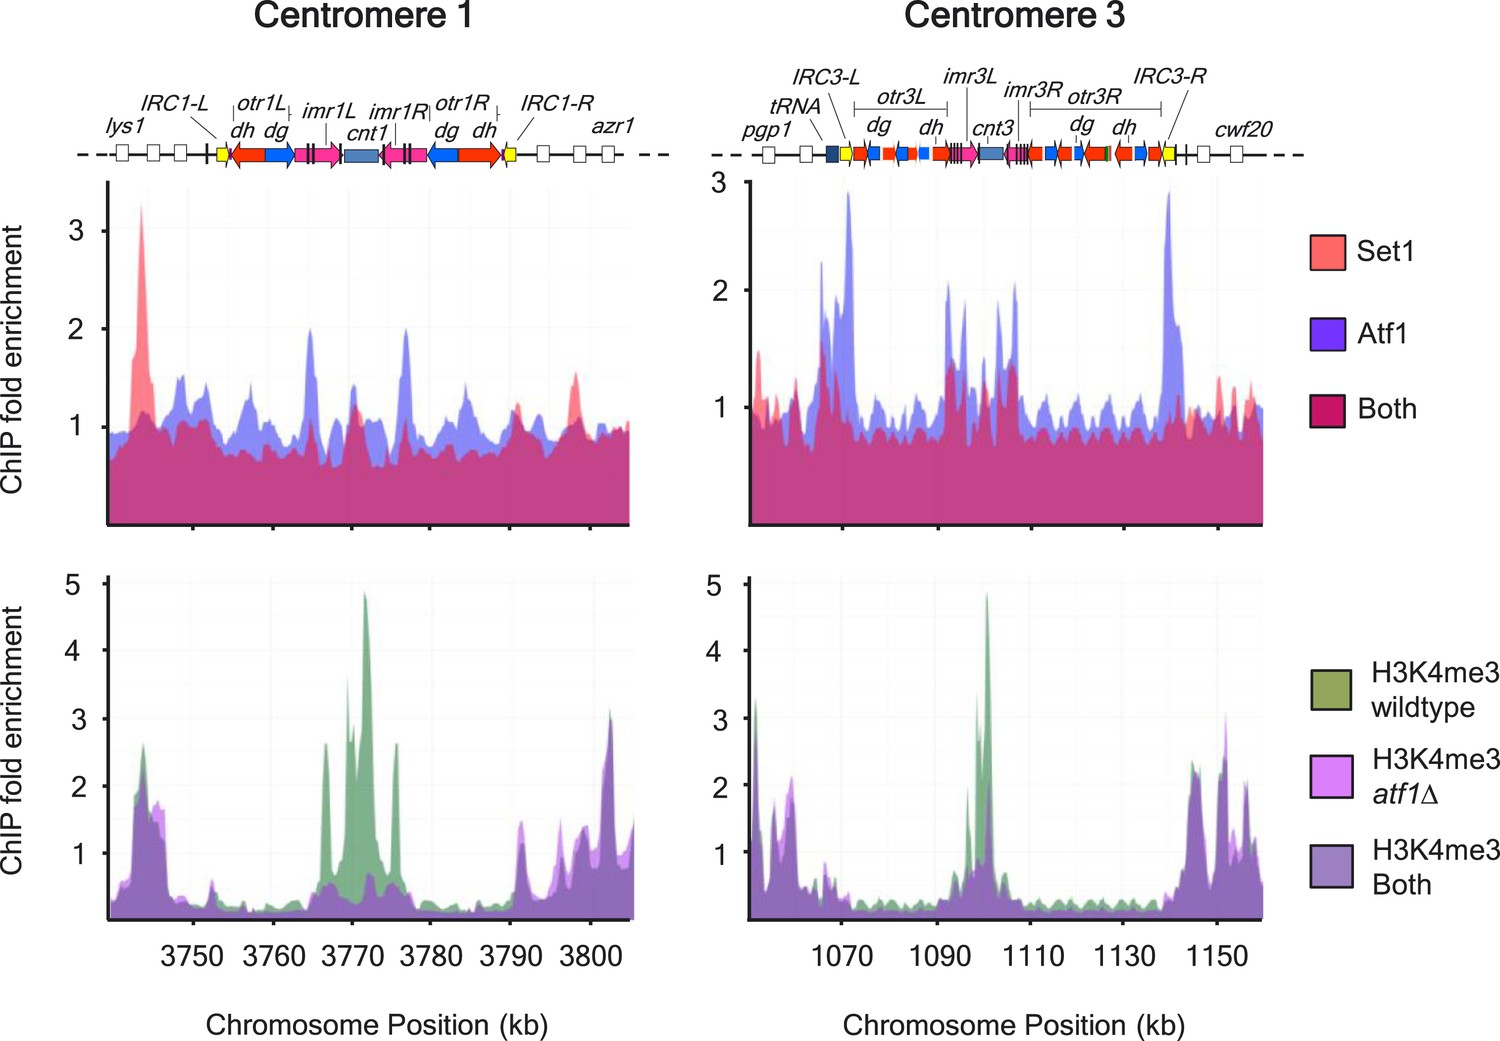
Colocalization of Set1 and Atf1 at centromeres I and III.
Colocalization of Atf1 and Set1 (upper panels) at centromeres I and III (upper panels). Reduced H3K4me3 levels at centromere central cores in atf1Δ cells (lower panels). Enrichment of Set1, Atf1, and H3K4me3 was analyzed by chromatin immunoprecipitation (ChIP)–chip.
Figure 3—figure supplement 2
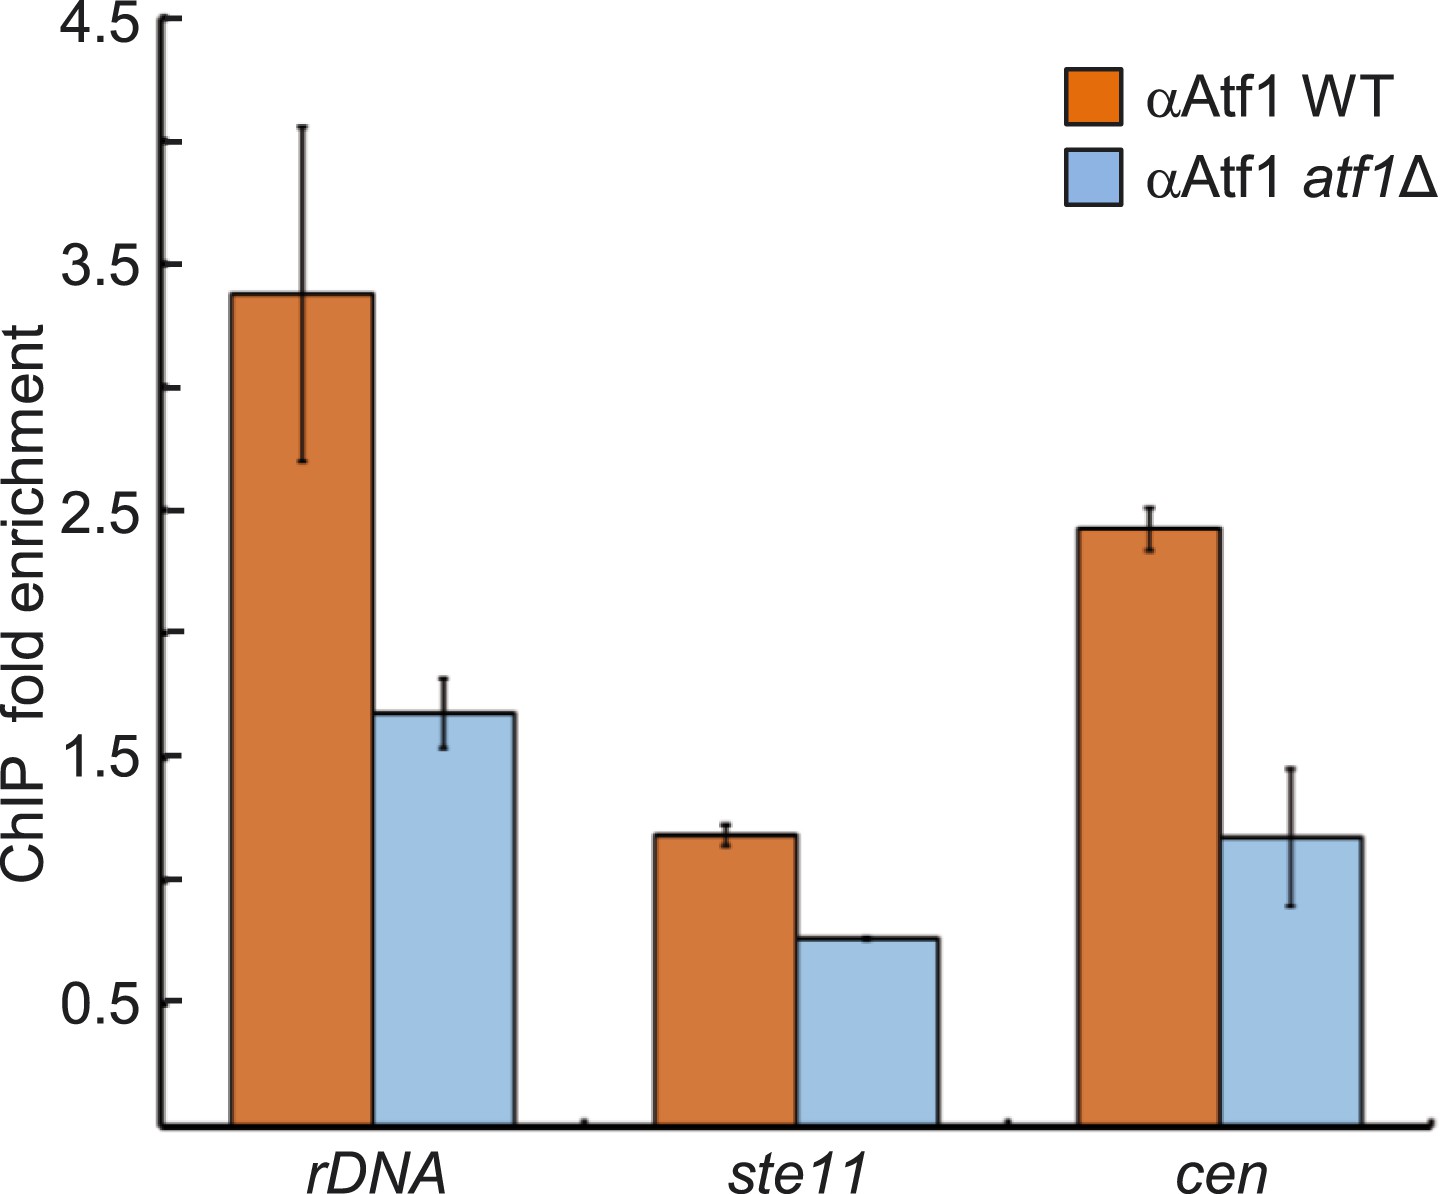
Enrichment of Atf1 at repressed loci.
Confirmation of Atf1 binding at the rDNA array, ste11, and pericentromeric heterochromatin (dg) was carried out by chromatin immunoprecipitation (ChIP) followed by qPCR. ChIP fold enrichment was calculated relative to input after normalization by primers corresponding to the act1 promoter. (SD, error bars; n = 3 triplicates.)
Figure 3—figure supplement 3
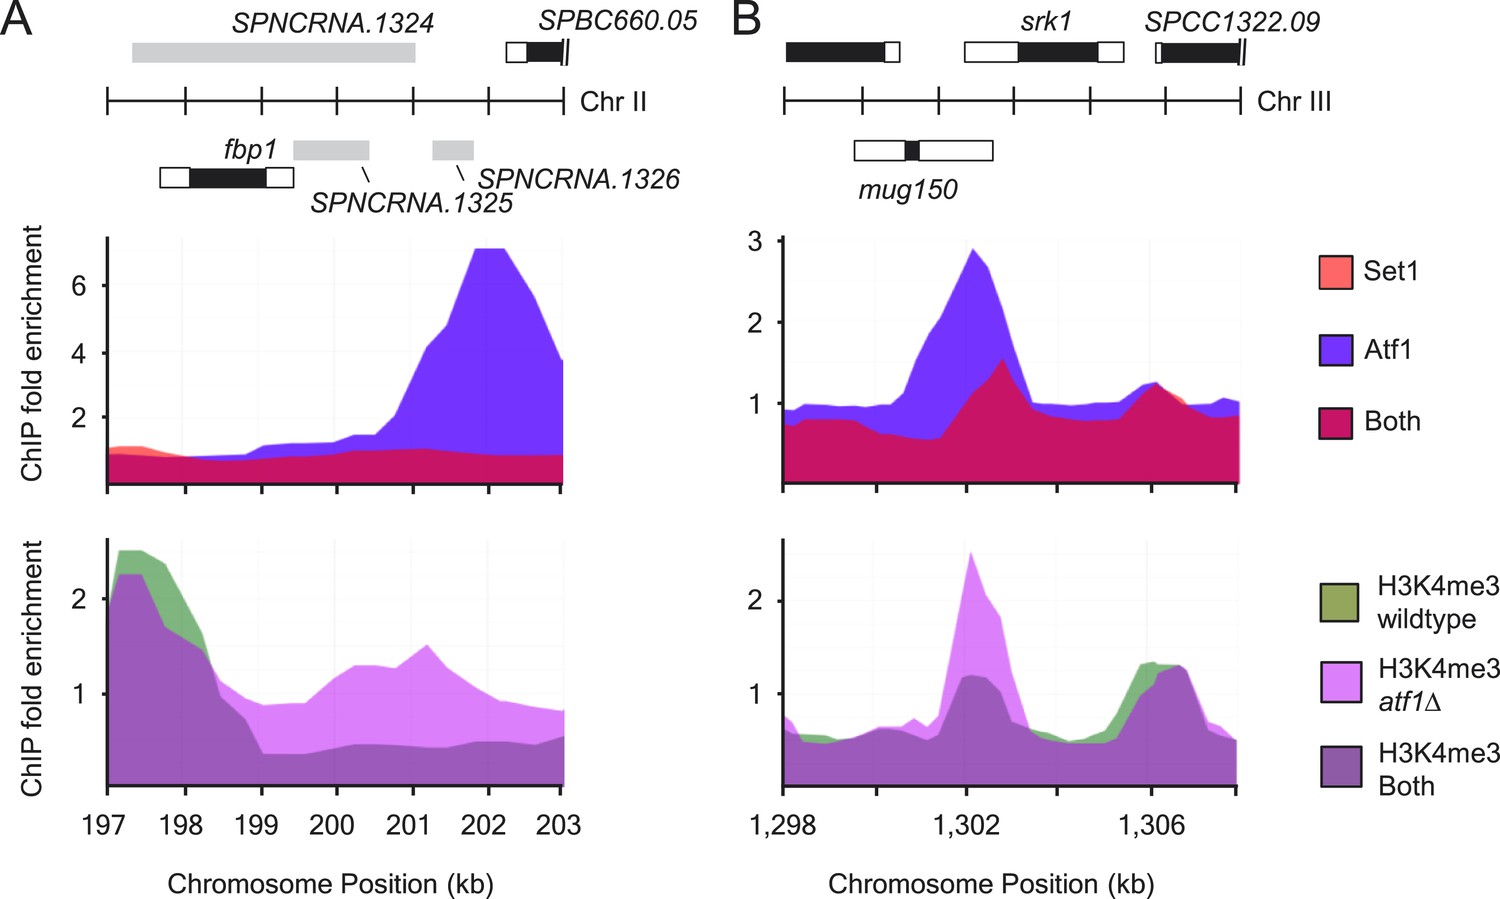
Atf1 acts as a transcriptional repressor.
(A and B) Distributions of Atf1 and Set1 at (A) fbp1 and (B) srk1 (upper panels). Increased H3K4me3 levels at fbp1 and srk1 in atf1Δ cells (lower panels). Enrichment of Set1, Atf1, and H3K4me3 was determined by chromatin immunoprecipitation (ChIP)–chip.
Figure 3—figure supplement 4
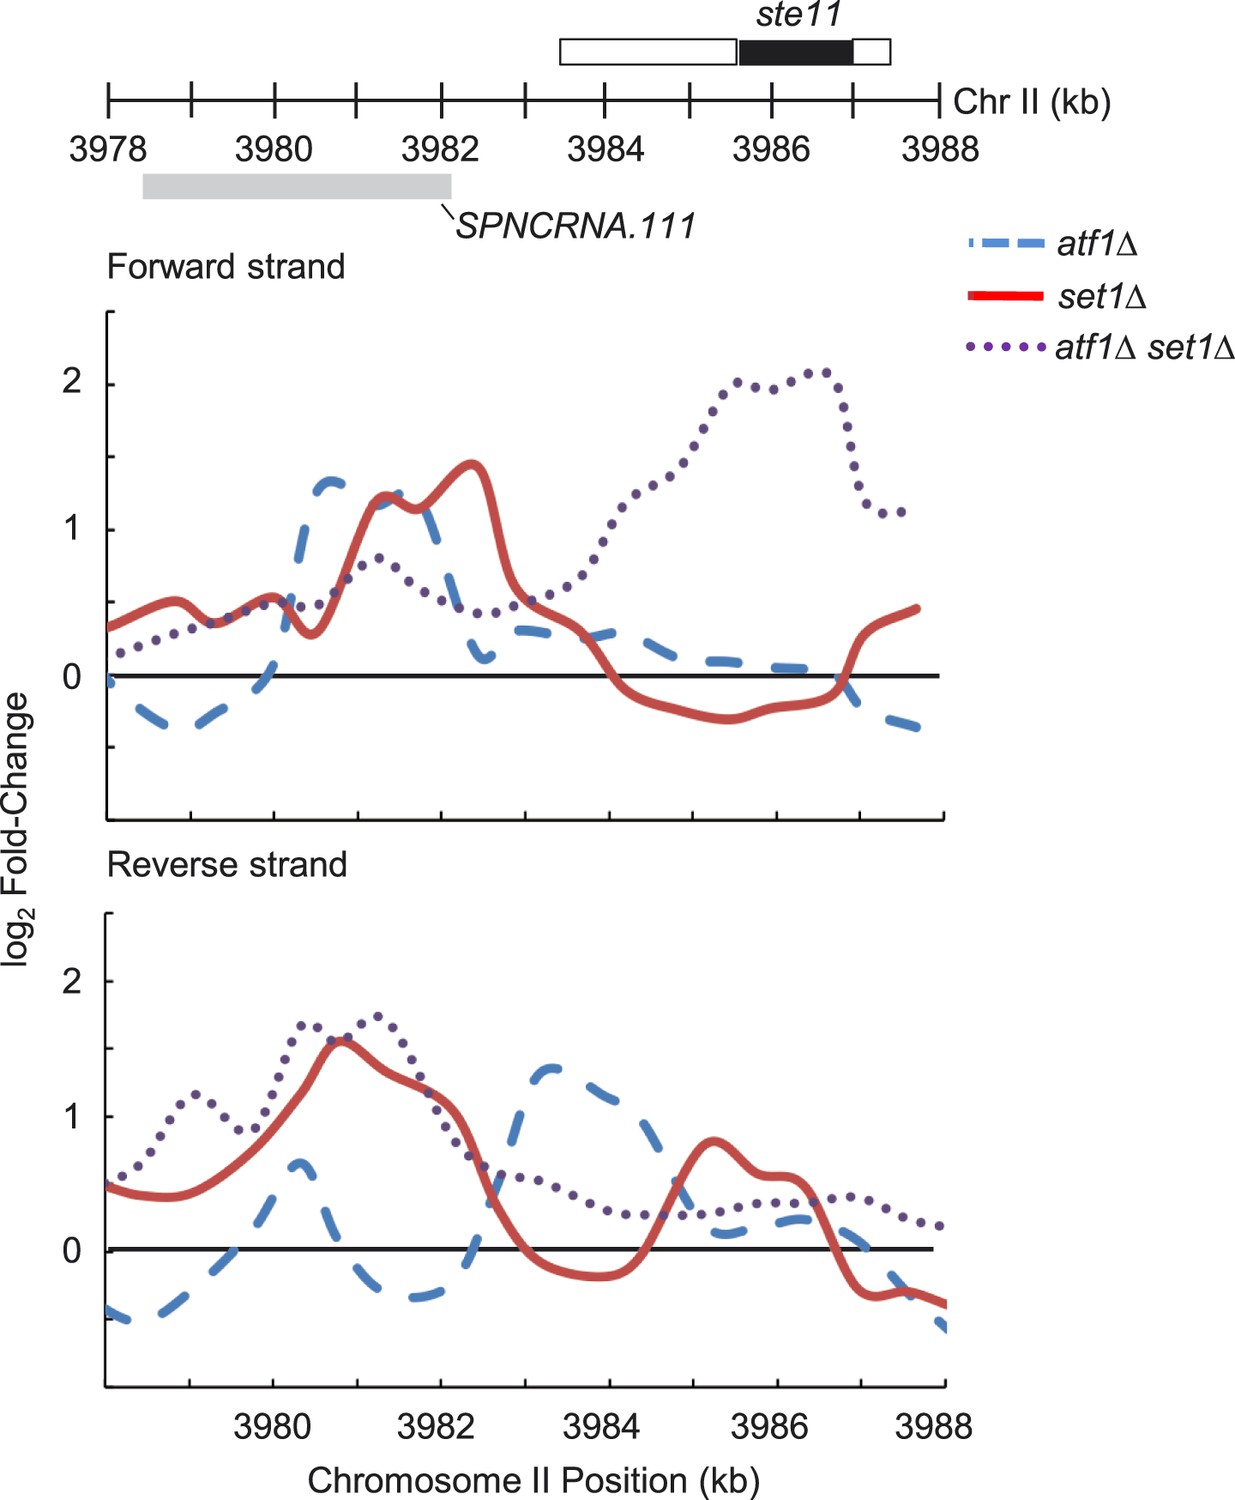
Derepression of ste11 in mutants deficient in both atf1 and set1.
Expression changes on forward and reverse strands at the ste11 locus in atf1Δ (blue dashed lines), set1Δ (red solid lines), and atf1Δ set1Δ (dotted purple lines) mutants. Tiling microarray probes corresponding to both forward and reverse strands from each window were binned into ∼600 bp windows, and log2 fold-changes of mutant versus wild-type from duplicate arrays for each mutant strain in each window were averaged. Data smoothing was performed using a three-consecutive-probe window moving average.
Figure 4 with 2 supplements
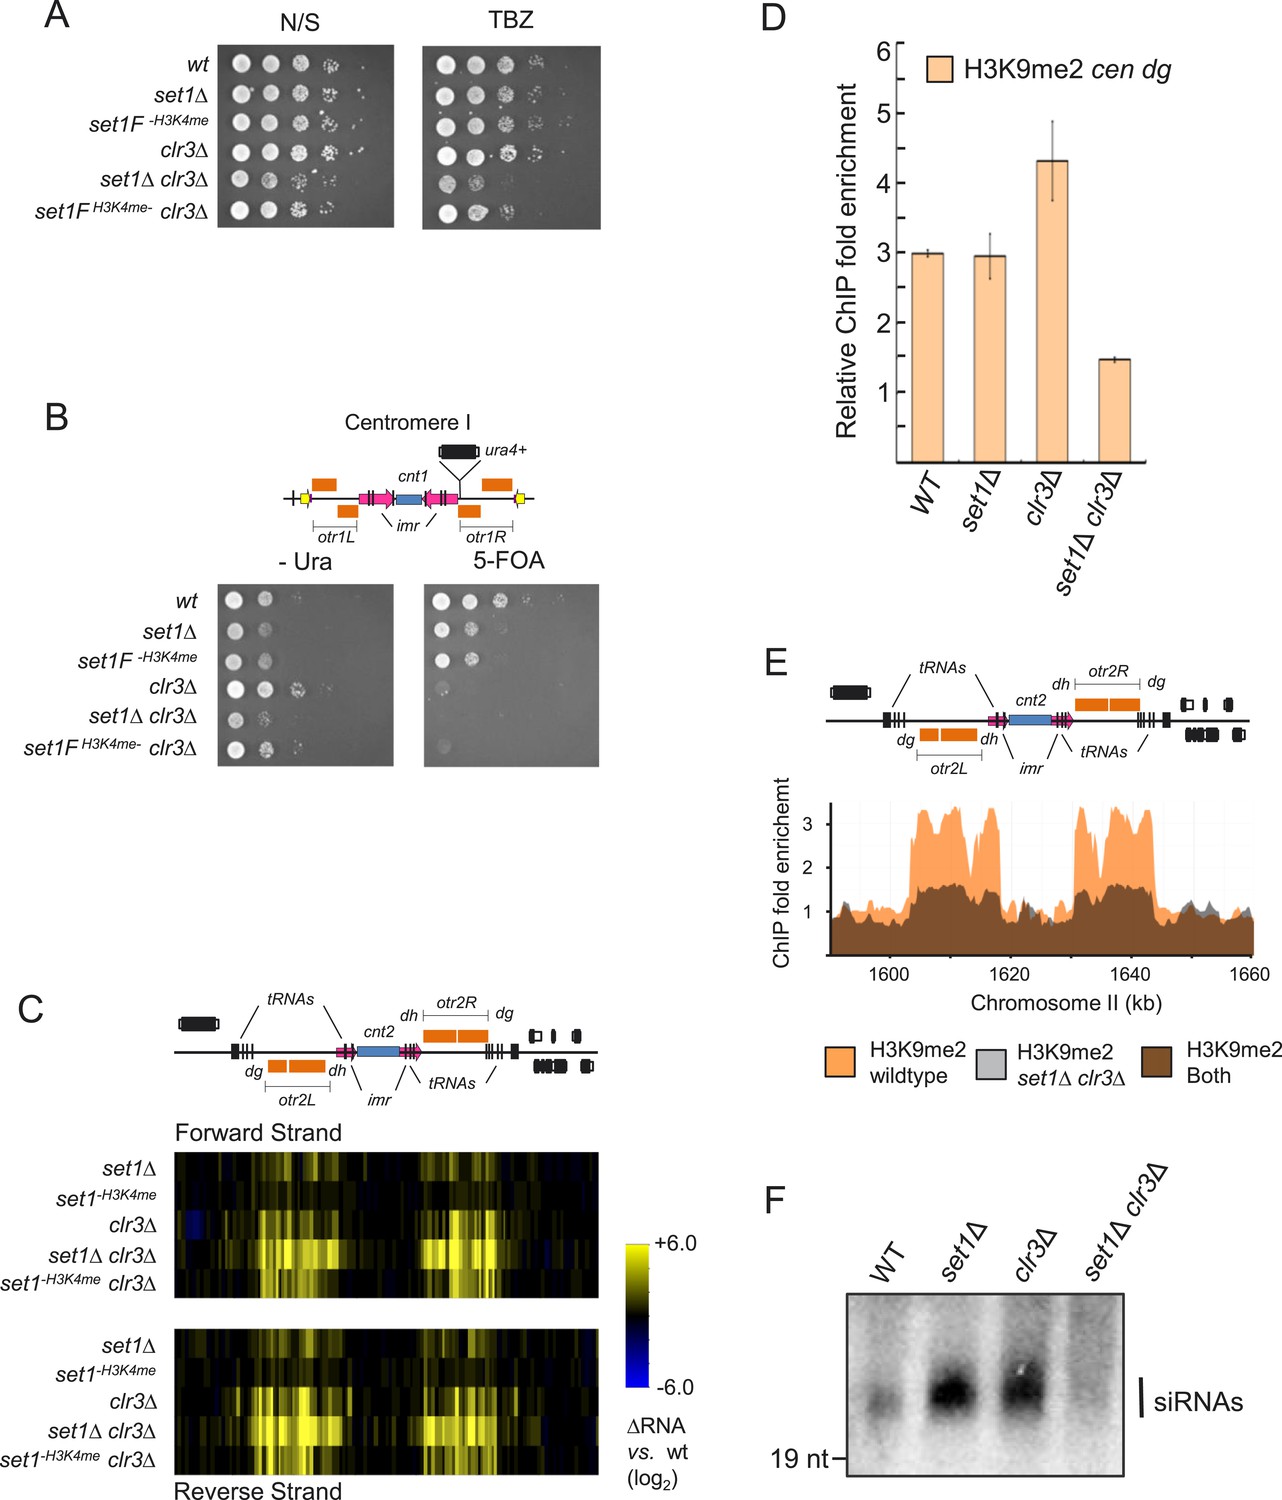
Set1 and the class II HDAC Clr3 cooperates in heterochromatic silencing and heterochromatin formation.
(A) Serial dilution analysis (SDA) of set1 and clr3 mutant strains in nonselective (N/S) media or in the presence of the tubulin inhibitor thiabendazole (TBZ), (B) uracil minus media (−Ura) or in the presence of the uracil counter selective drug 5-fluoroorotic acid (5-FOA). (C) Transcription of forward and reverse strands at centromere II in indicated mutant strains was analyzed by microarrays. (D) H3K9 dimethylation (H3K9me2) in strains deficient for set1 and clr3 at the pericentromeric dg repeat. H3K9me2 enrichment at the dg repeat in indicated strains was carried out by chromatin immunoprecipitation (ChIP) and quantified by qPCR. (E) H3K9me2 distribution across the entire centromere II in wild-type and set1Δ clr3Δ strains. H3K9me2 at centromere II was assayed by ChIP–chip. (F) siRNA levels in wild-type, set1 and clr3 mutant strains. Detection of siRNAs was carried out by a northern blot using a probe specific for pericentromeric dg repeats.
Figure 4—figure supplement 1

Pol II and Swi6 localization at pericentromeres in set1 and clr3 mutants.
(A) Pol II and (B) Swi6 levels at the pericentromeric repeat dg in wild-type, set1Δ, clr3Δ, or set1Δ clr3Δ mutants were analyzed by chromatin immunoprecipitation (ChIP) followed by qPCR. ChIP fold enrichment was calculated relative to input after normalization by primers corresponding to the act1 promoter. (SD, error bars; n = 3 triplicates.)
Figure 4—figure supplement 2

H3K9me2 defects at centromeres I and III, mating type locus and subtelomeric regions in a strain deficient for both set1 and clr3.
(A) H3K9me2 distribution across major heterochromatin domains including centromeres I and III, (B) subtelomeres I, and (C) the silent mating type region was assayed by chromatin immunoprecipitation (ChIP)–chip in wild-type and set1Δ clr3Δ strains.
Figure 5 with 4 supplements
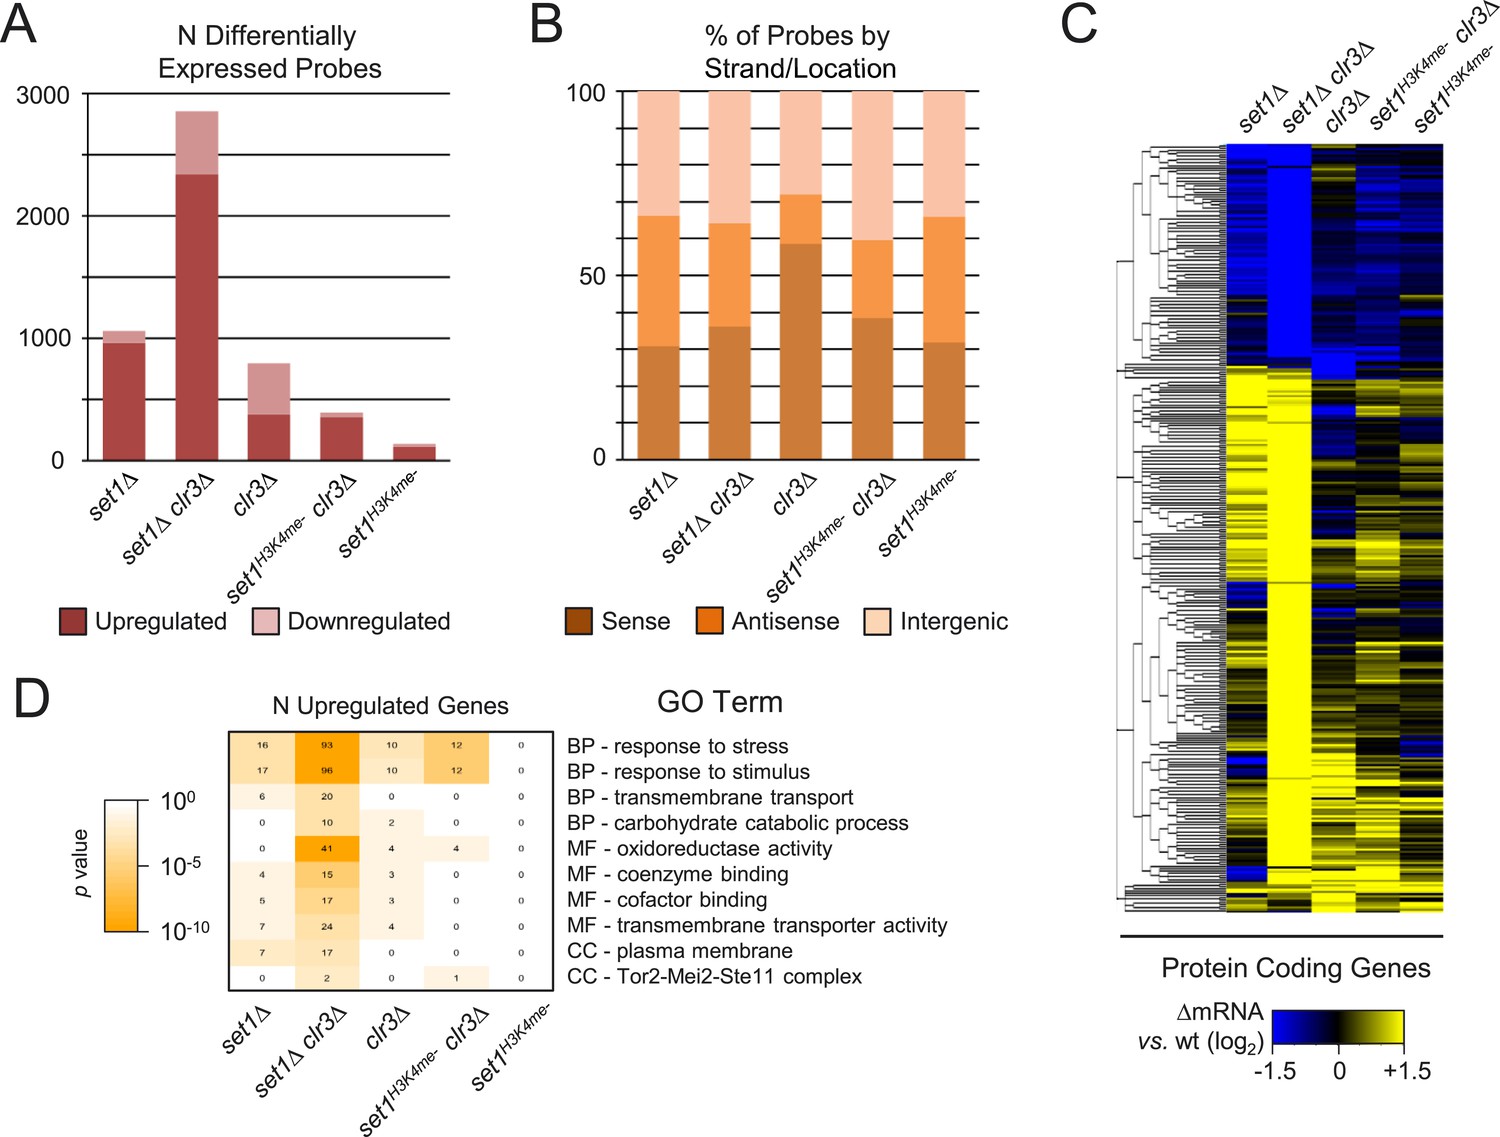
Upregulation of a large fraction of the transcriptome in a strain deficient for both set1 and clr3.
(A) Counts and (B) percentage of probes matching feature strand/position in indicated mutant strains were analyzed similarly to Figure 2A and B. (C) Hierarchical clustering of significantly changed protein coding genes in set1 and clr3 mutant gene expression profiles (n = 346). Sense strand probes from two microarray experiments were averaged and clustered as in Figure 2C. (D) Gene ontology (GO) analysis of upregulated transcripts in set1 and clr3 mutant gene expression microarrays. Representative GO terms from biological process (‘BP’), molecular function (‘MF’), and cellular component (‘CC’) ontologies displaying most significant enrichment (right panel) and corresponding number of upregulated genes (left panel) in indicated mutant strains; all enriched terms are listed in Figure 5—source data 1 p values, hypergeometric test.
-
Figure 5—source data 1
Gene ontology (GO) term enrichment in set1/clr3 mutant expression profiling microarrays.
GO term enrichment analysis was performed similar to Figure 1—source data 1 for the sets of significantly changed sense strand transcripts in the indicated mutant vs. wild-type experiment (see Figure 5D).
- https://doi.org/10.7554/eLife.04506.019
Figure 5—figure supplement 1
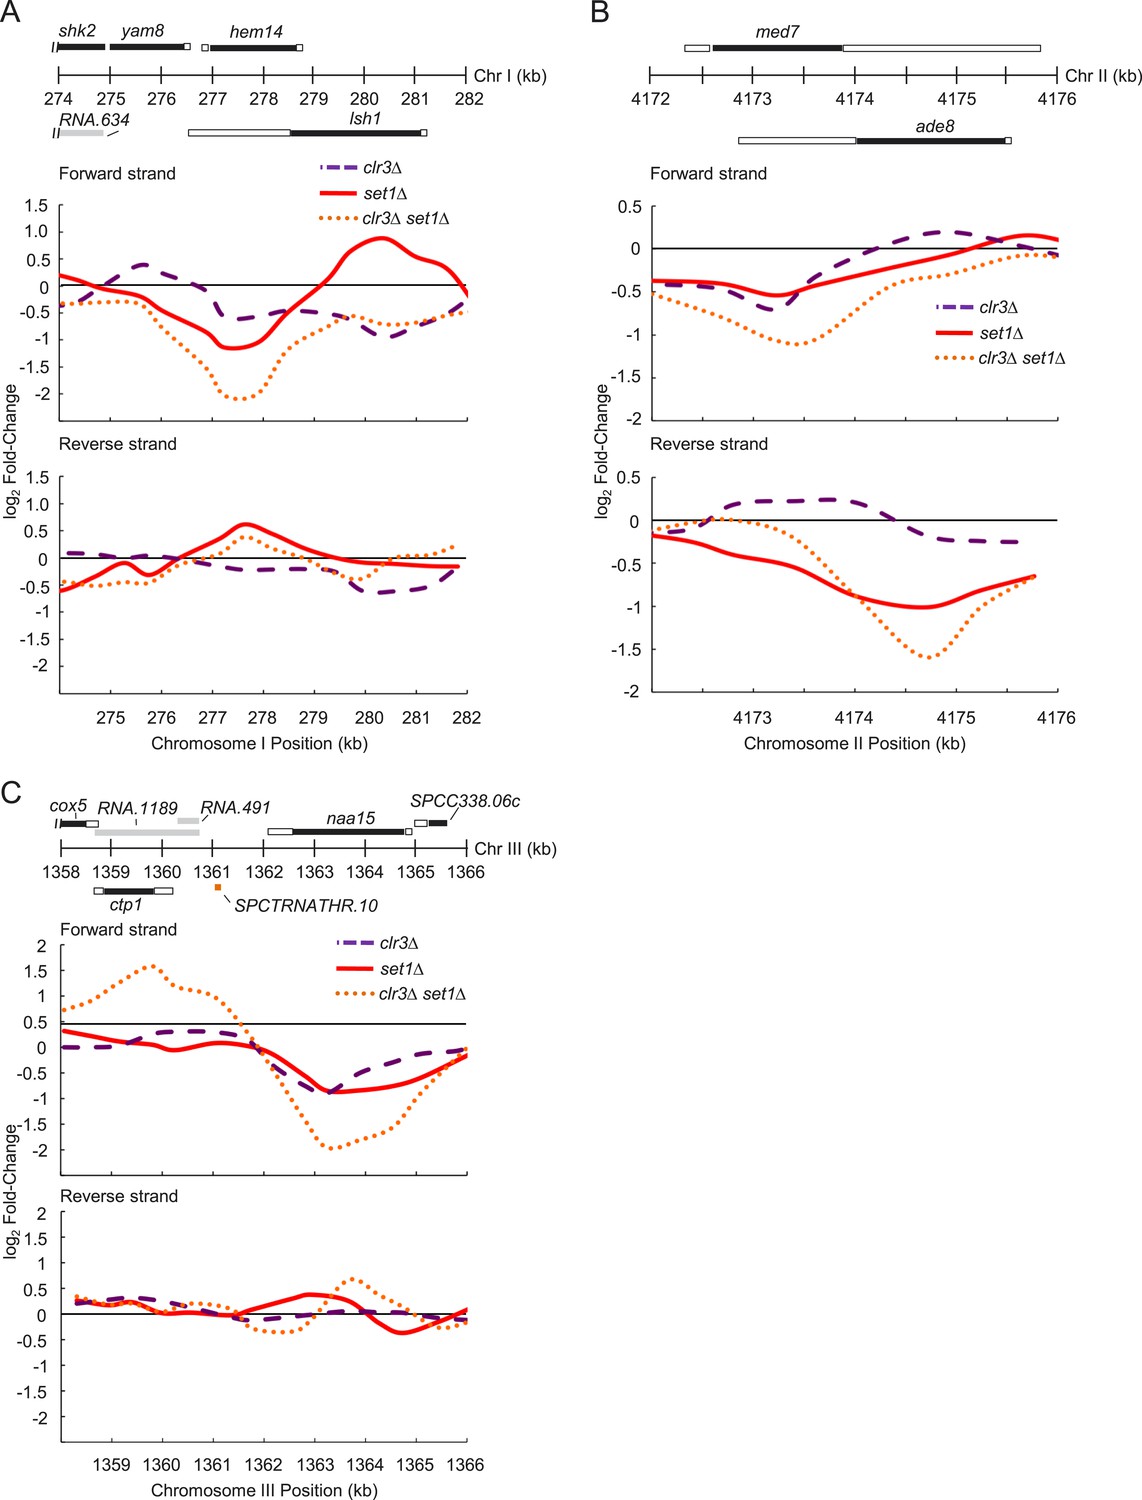
Representative genes whose expression requires set1 and clr3.
(A) Expression changes on forward and reverse strands at hem14, (B) med7, (C) and naa15 gene loci in clr3Δ (purple dashed lines), set1Δ (red solid lines), and clr3Δ set1Δ (dotted orange lines) mutants. Expression analysis was performed similarly to Figure 3—figure supplement 2. Positions of genomic features on forward (top) and reverse strands (bottom), top panel. Black bars denote protein coding gene open reading frames (ORFs); white, associated untranslated regions (UTRs); gray, noncoding RNAs; orange tRNA.
Figure 5—figure supplement 2
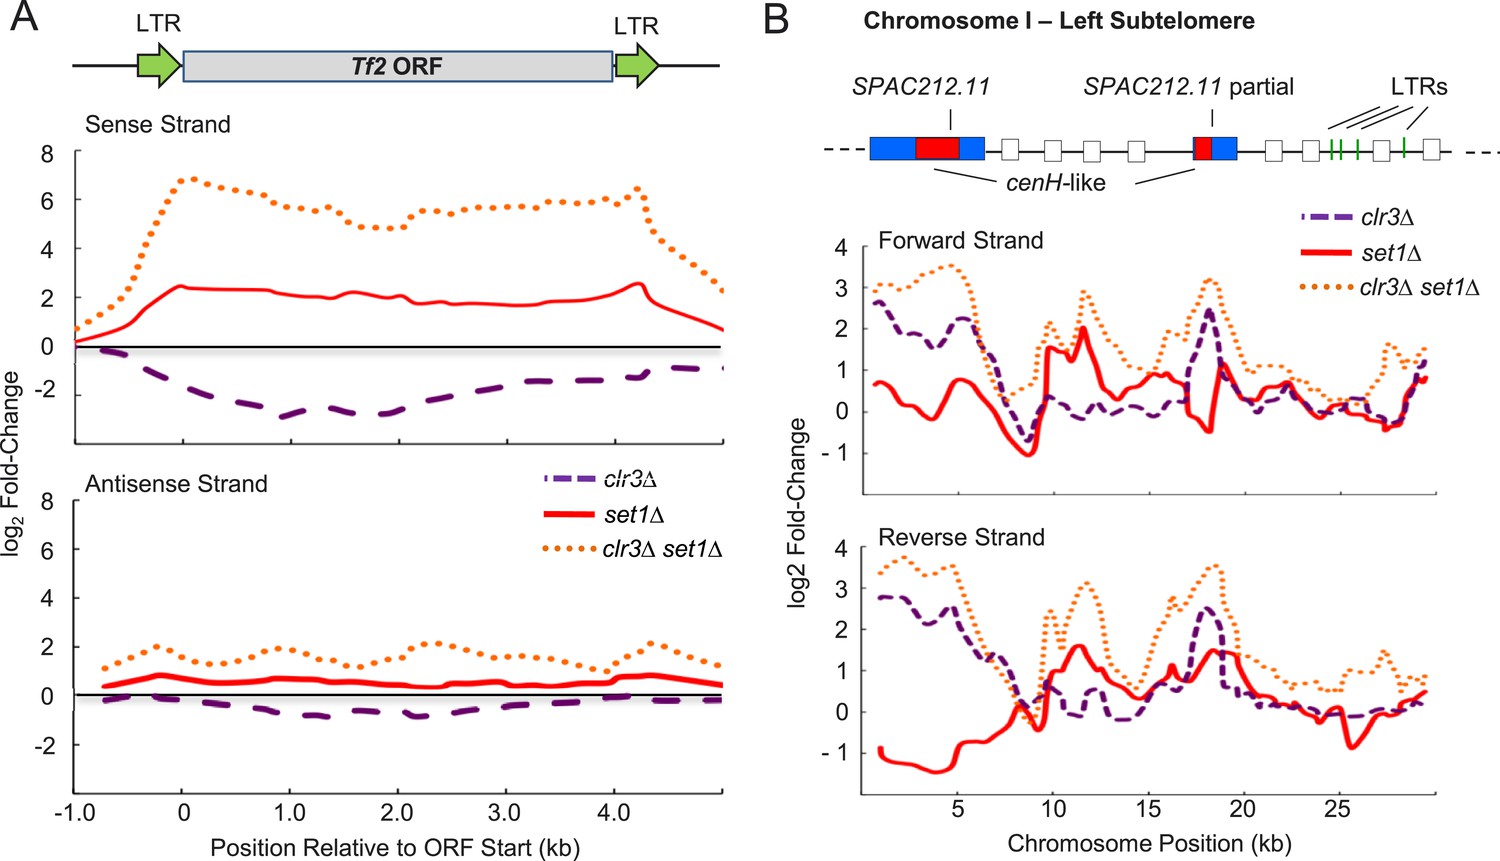
Synergistic upregulation of Tf2s and subtelomeric regions in strain deficient for both set1 and clr3.
(A) Expression changes on forward and reverse strands at the Tf2 retrotransposons and (B) the chromosome I left subtelomere in clr3Δ (purple dashed lines), set1Δ (red solid lines), and clr3Δ set1Δ (dotted orange lines) mutants. Expressions were from tiling array analysis similar to Figure 3—figure supplement 2.
Figure 5—figure supplement 3
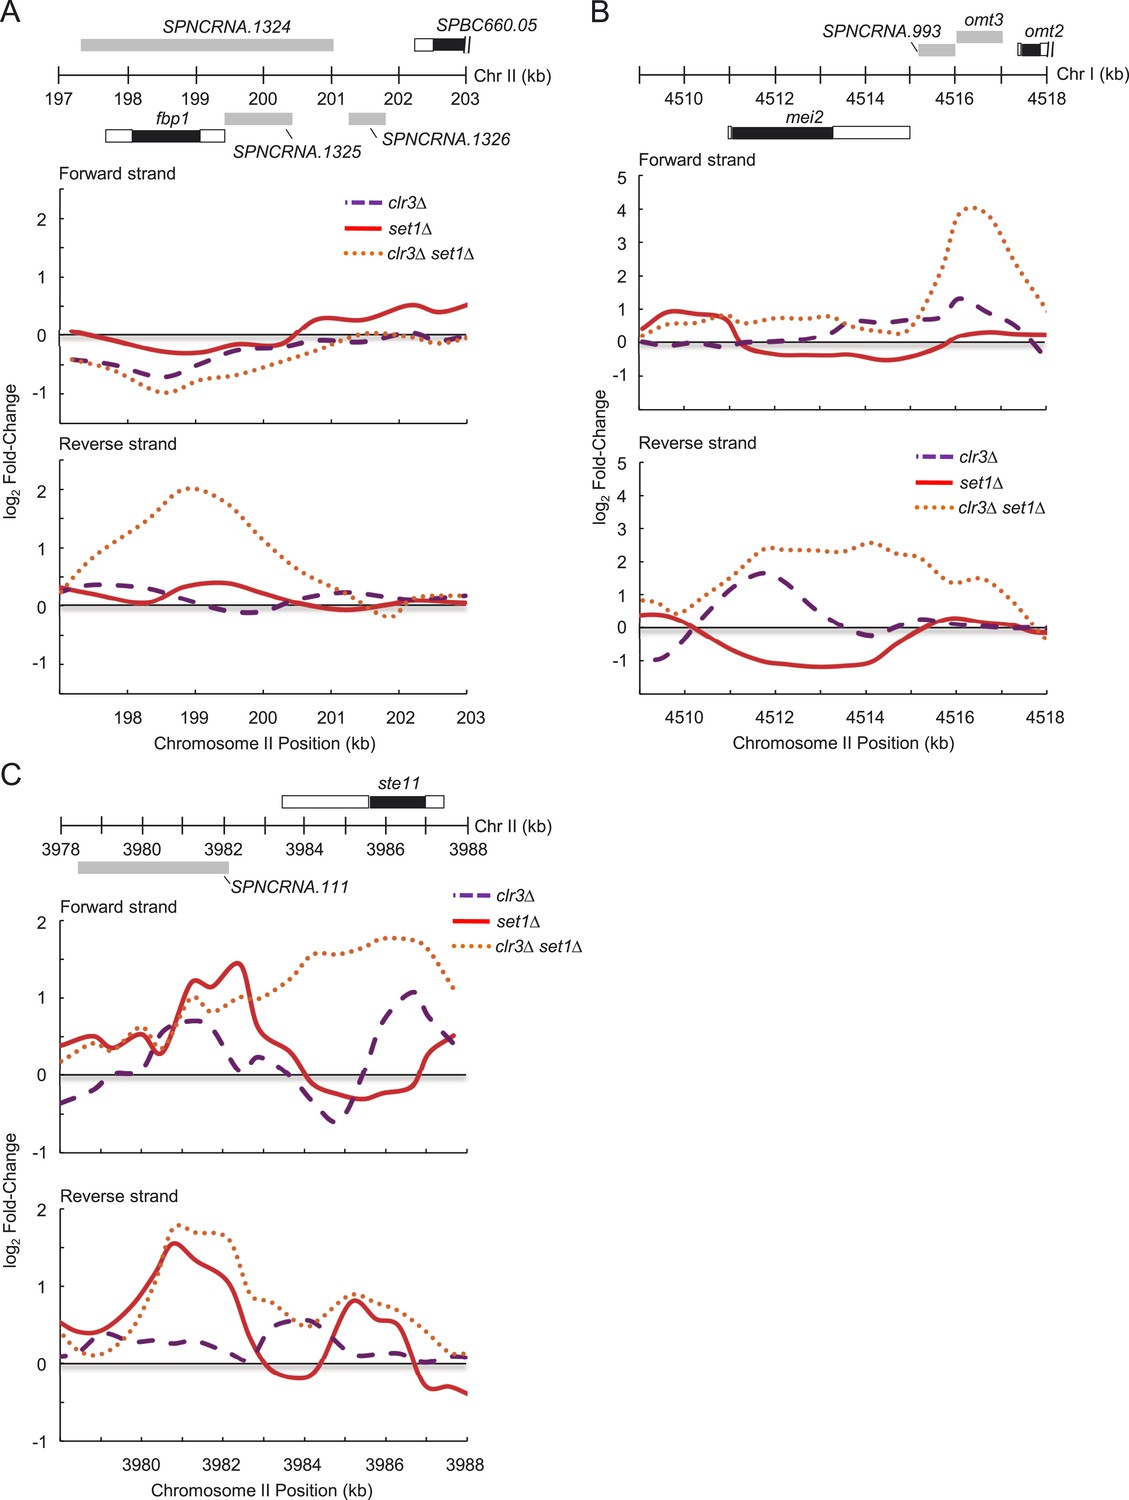
Set1 and Clr3 cooperate to control genes involved in the core environmental stress response.
(A) Expression changes on forward and reverse strands at fbp1, (B) mei2, and (C) ste11 gene loci in clr3Δ (purple dashed lines), set1Δ (red solid lines), and clr3Δ set1Δ (dotted orange lines) mutants. Expressions were from tiling array analysis similar to Figure 3—figure supplement 2. Positions of genomic features on forward (top) and reverse strands (bottom), top panel. Black bars denote protein coding gene open reading frames (ORFs); white, associated untranslated regions (UTRs); gray, noncoding RNAs.
Figure 5—figure supplement 4
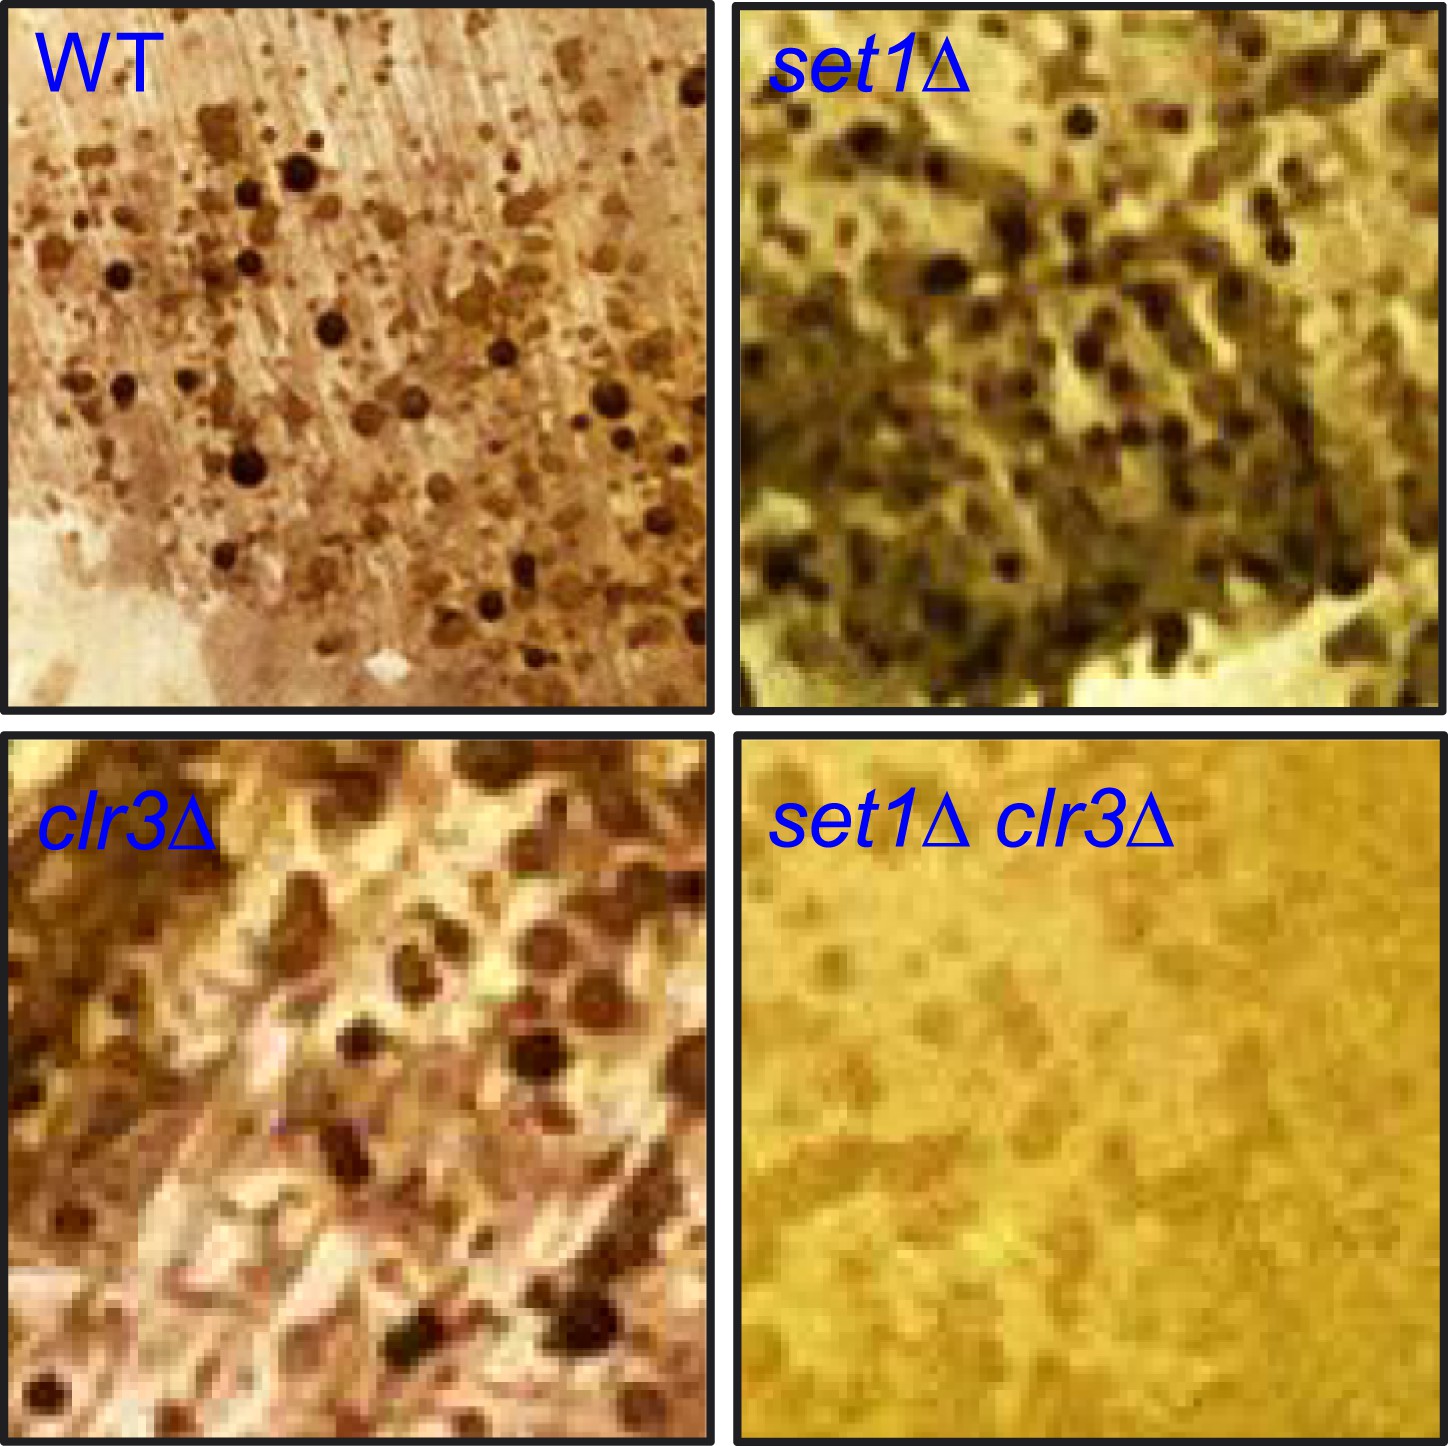
Cooperation between Set1 and Clr3 in development.
Diploid cells homozygous for wild-type (WT), set1Δ, clr3Δ, or set1Δ clr3Δ were streaked onto EMM medium to induce meiotic entry and allowed to complete meiosis at 26°C for four days. Cells were subsequently exposed briefly to iodine vapour, which efficiently stains meiotic products (haploid spores) dark brown.
Figure 6
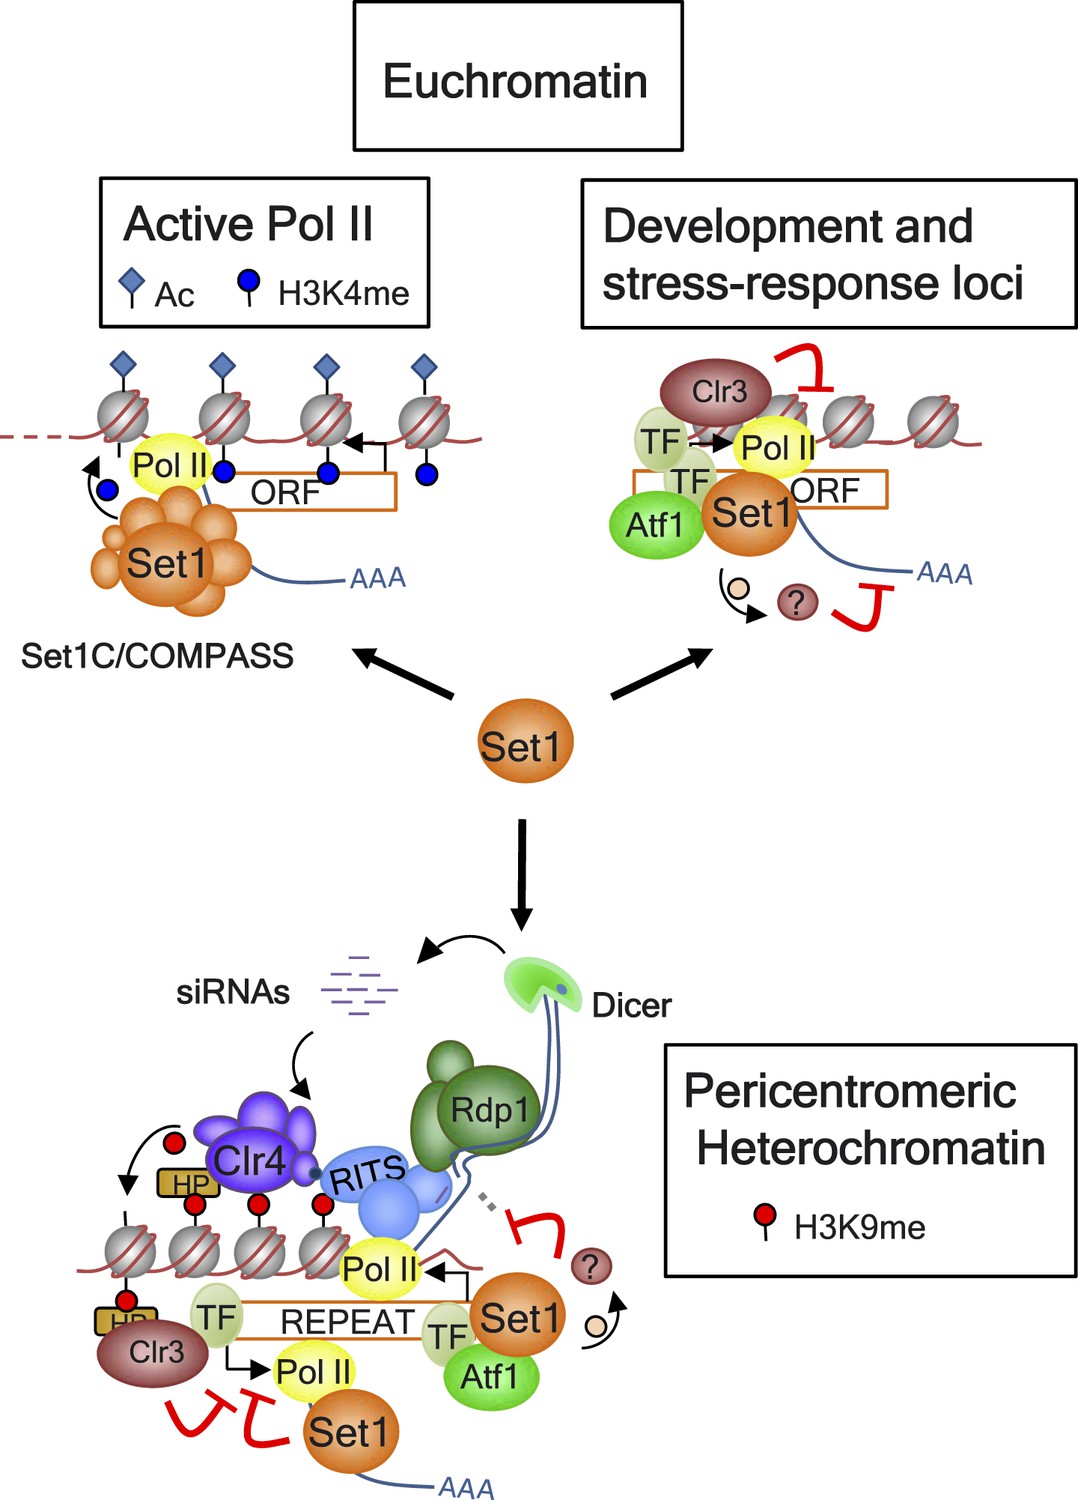
Model for Set1 functions at euchromatin and heterochromatin domains.
At euchromatin domains, the Set1C/COMPASS complex is recruited to active Pol II genes and provides the H3K4me marks. Set1 is also recruited to certain lowly expressed and repressed genes associated with developmental and stress-response pathways in part by Atf1, other transcription factors (TFs), and probably transcriptionally poised Pol II. Set1 acts in a parallel pathway with the histone deacetylase (HDAC) Clr3 to impose transcriptional repression at these loci. At a heterochromatin domain such as the pericentromeric region, Atf1 and probably other unidentified TFs mediate the recruitment of Set1 to sites enriched for tRNAs known to act as boundary elements. Set1 coordinates with Clr3 in the establishment of SUV39H1/Clr4-mediated H3K9me/HP1 (HP: Swi6 and Chp2) heterochromatin and suppression of bidirectional transcription independently of H3K4me and the other Set1C subunits. Set1-mediated silencing could occur via methylation of nonhistone substrate(s) through the same or different pathways from those of RNAi (i.e., RITS, Rdp1, Dicer) or the exosome (not shown).
Download links
A two-part list of links to download the article, or parts of the article, in various formats.
Downloads (link to download the article as PDF)
Open citations (links to open the citations from this article in various online reference manager services)
Cite this article (links to download the citations from this article in formats compatible with various reference manager tools)
Heterochromatin assembly and transcriptome repression by Set1 in coordination with a class II histone deacetylase
eLife 3:e04506.
https://doi.org/10.7554/eLife.04506


