The long non-coding RNA Dali is an epigenetic regulator of neural differentiation
- University of Oxford, United Kingdom
Figures
Figure 1 with 2 supplements

Conservation and expression within the Dali and Pou3f3 loci.
(A) Schematic illustration of the mouse Pou3f3 genomic region showing coding and non-coding transcripts, enhancer elements from Vista Enhancer Browser (Visel et al., 2007), CpG islands, and published genomic deletions (Sauvageau et al., 2013). (B) Conservation and relative sizes of Dali transcripts in mouse and human confirmed by RACE. (C) Dali and (D) Pou3f3 are co-expressed temporally and spatially in the developing mouse brain. DVZ: Dorsal ventricular zone; LVZ: Lateral ventricular zone; DCP: Dorsal cortical plate; LCP: Lateral cortical plate; PP: pre-plate. The levels of Dali, Pou3f3 were measured by qRT-PCR. Results are normalised to Gapdh and presented relative to expression in E9.0 sample (set arbitrarily to 1). Mean ± s.e., n = 3 (technical replicates). (E and F) Similarly to Pou3f3, Dali is up-regulated during neuronal differentiation of mouse ES cells. Neuronal differentiation of mouse ES cells was induced using RA. The levels of Dali and Pou3f3 were measured by qRT-PCR. Results are presented relative to an Idh1 reference gene which does not change significantly during differentiation. Mean ± s.e., n = 3. (G and H) Dali is a chromatin associated transcript. The relative amounts of Dali (G) and a control mRNA (Gapdh) (H) in the indicated fractions were measured by qRT-PCR. Mean values ± s.e. of three independent experiments.
Figure 1—figure supplement 1
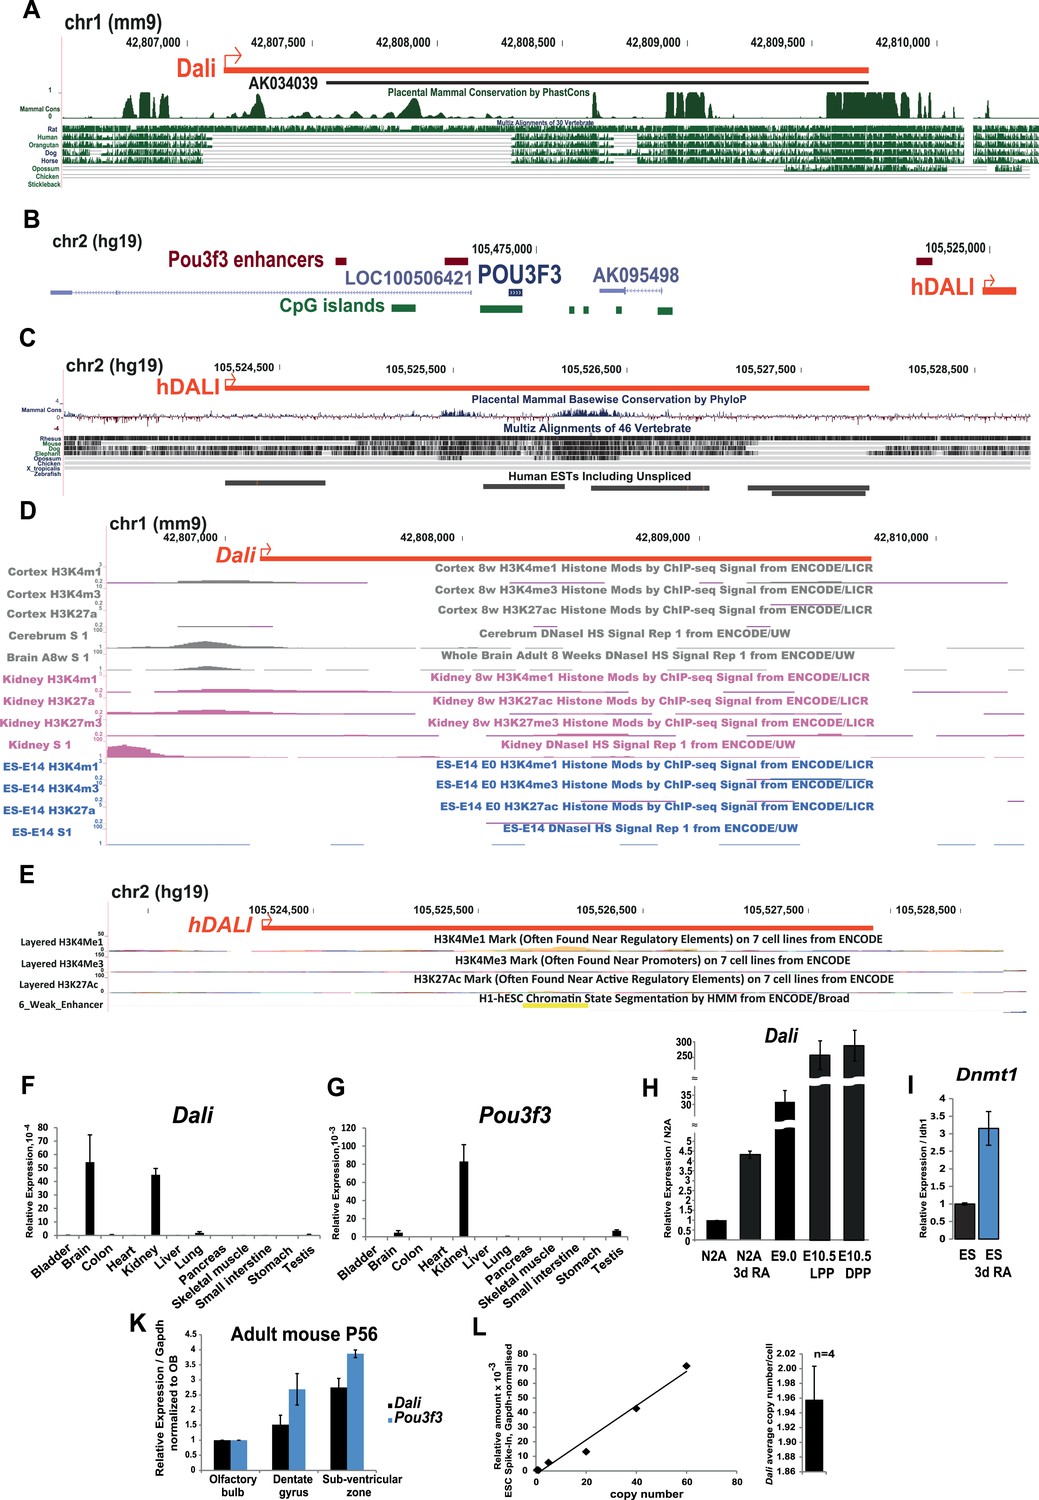
Analysis of the mouse and human Dali loci.
(A) A detailed view of the mouse Dali locus (red) indicating regions of vertebrate DNA sequence conservation. Full-length Dali transcript was mapped using Rapid Amplification of cDNA Ends (RACE) in mouse neuroblastoma N2A cells. Promoter region appears to be most conserved. Within the transcript body, highly conserved patches are interspersed with regions or more divergent sequence. (B) Schematic illustration of the human POU3F3 genomic region showing coding and non-coding transcripts, enhancer elements (Vista Enhancer Browser) and conserved genomic location and transcriptional orientation of DALI relative to POU3F3. Human DALI ortholog exhibits conserved genomic location and transcriptional orientation relative to POU3F3. (C) A detailed view of the human DALI locus (red) confirmed by RACE indicating regions of vertebrate DNA sequence conservation. (D) Promoter region of Dali in mouse is associated with DNase I hypersensitivity sites in tissues expressing Dali (kidney and brain) but not in ES cells where the Dali locus is silent. (E) DALI locus in human is annotated as a poised (or weak) enhancer by the ENCODE project 1. (F and G) Dali is a brain-expressed lncRNA. Dali and Pou3f3 expression levels were measured in a panel of adult mouse tissues by quantitative RT-PCR (qRT-PCR). Results were normalized by the average value of Gapdh and Tbp reference genes. Mean values ± standard error (s.e.) shown, n = 3 replicates. (H) Dali levels in the developing mouse brain even at the earliest stages when it is detected (E9.0 and E10.5) are much higher than in both proliferating and differentiated N2A cells. LPP = Lateral pre-plate; DPP = Dorsal pre-plate. (I) Similar to Dali and Pou3f3, Dnmt1 is also up-regulated at day 4 of RA-induced neuronal differentiation of ES cells. Mean values ± s.e, n = 3. (K) Dali and Pou3f3 are co-expressed temporally and spa ally in the adult mouse brain (P56) in three regions of adult neurogenesis, that is olfactory bulb, dentate gyrus and sub-ventricular zone. The relative levels of Dali and Pou3f3 were measured in samples obtained by dissecting indicated regions from a single male adult mouse brain per sample using RT-qPCR. Measurements were normalised using Gapdh and presented relative to expression in the olfactory bulb samples (set arbitrarily to 1). Mean values ± s.e, n = 2. (L) Dali is expressed at an estimated 2.0 ± 0.4 copies per cell in N2A cells. We constructed a standard curve of known Dali copy number by spiking in vitro transcribed Dali transcripts into RNA from ES cells, which do not express Dali (left). Mean Dali expression per cell was calculated from four independent RT-qPCR experiments using RNA extracted from a defined number of cells. This value was used to estimate Dali copy number form the standard curve. Mean copy number per cell ± s.e. is shown (right).
Figure 1—figure supplement 2
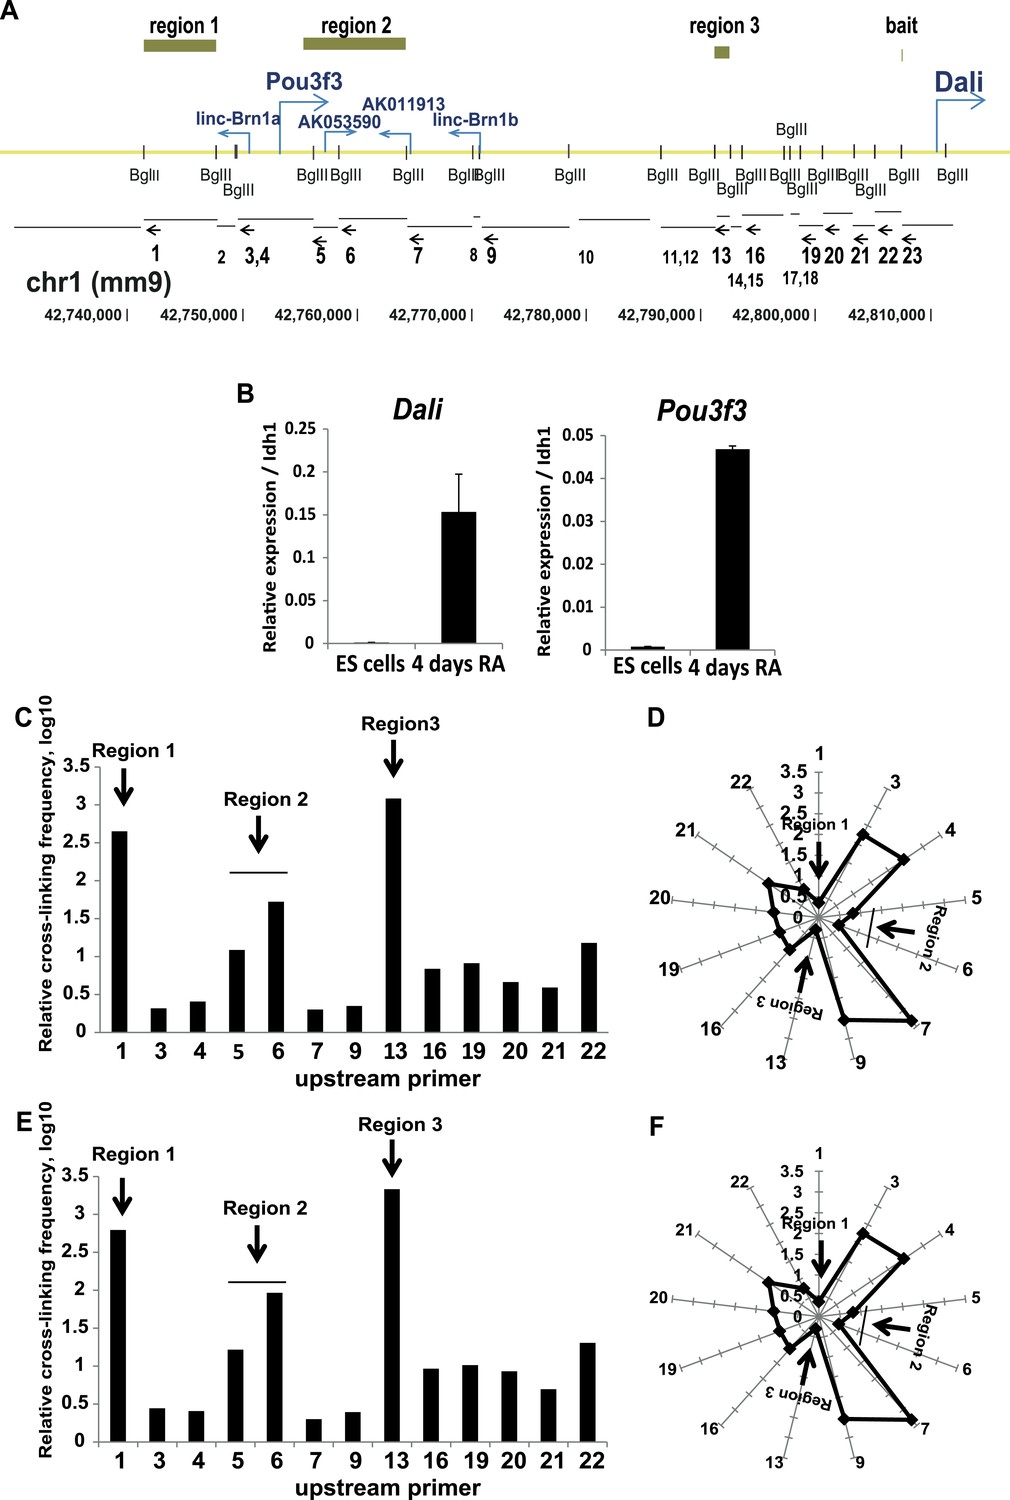
The Pou3f3 locus occurs in a folded nuclear conformation both prior to and after the onset of the expression of its transcripts.
(A) Schematic representation of the Pou3f3 locus showing start sites of transcripts in the region and positions of recognition sites of the BglII restriction endonuclease (small vertical bars) used for the 3C experiment. Below, the restriction fragments generated by BglII digestion are annotated. Arrows indicate the position of the 3C qPCR primers. Numbers represent the corresponding primer (small numbers indicate primers not used in the final analysis due to technical reasons). Green bars indicate regions found to be in close proximity to the Dali transcription start site used as ‘bait’. (B) Nuclear conformation of the Pou3f3 locus was studied in ES cells where the locus is silent and ES cell derived neuronal precursors (4 days retinoic acid differentiation) where transcripts in the regions are expressed. Mean values ± s.e, n = 3 (technical replicates). (C and E) Quantification of genomic interactions between the Dali TSS and the genomic fragments indicated in (A) in ES cells (C) and ES cell derived neuronal precursors (E). The y axis shows relative cross-linking frequency, the x axis indicates the primer used in combination with primer 21. (D and F) Graphical representation of genomic distances between the Dali TSS, positioned at the centre of the radar, and the indicated BglII genomic fragments in ES cells (D) and ES cell derived neuronal precursors (F). Distance was calculated as 1/cross-linking frequency.
Figure 2 with 1 supplement
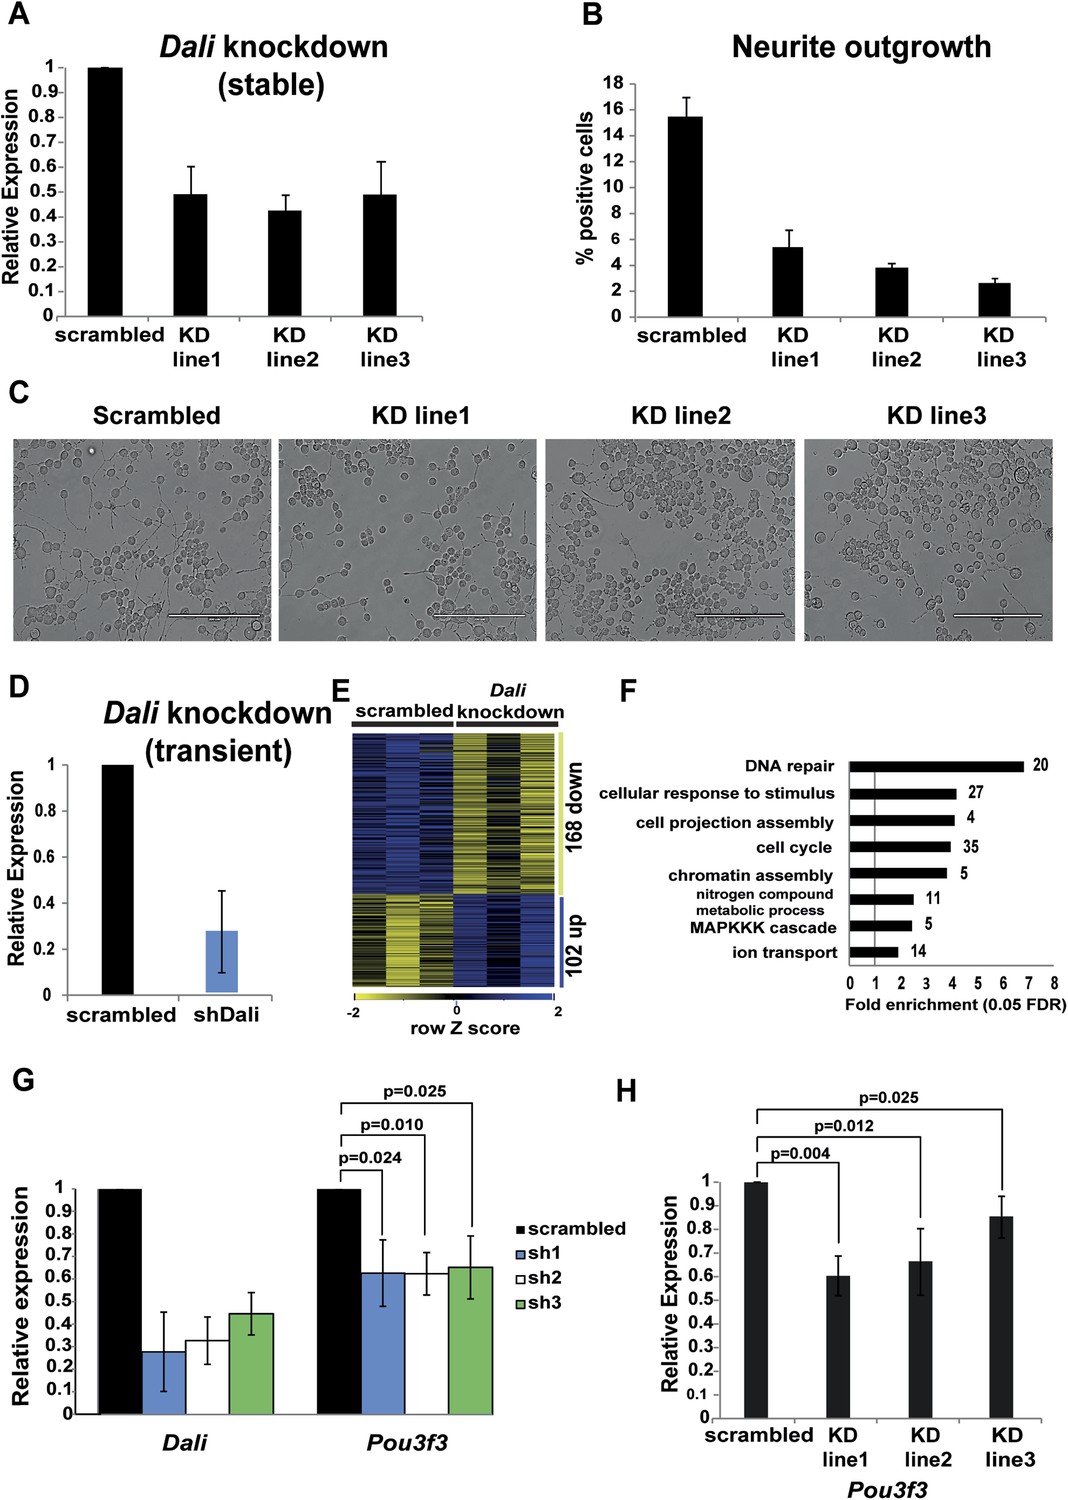
Dali plays a role in regulating genes in neuronal cells.
(A) qRT-PCR analysis validates reduced levels of Dali in three clonal Dali knockdown cell lines compared to a control line. Mean values ± s.e., n = 3. (B) Reduced neurite outgrowth in RA-differentiated Dali knockdown cells. Cells were imaged using bright field microscopy. Cells with ≥1 neurites of length greater than twice the cell body diameter were scored as positive. Average values ± s.e., n = 3. 500-600 cells were counted in each case across at least three non-overlapping fields. (C) Representative images of control and stable Dali knockdown cells differentiated with RA for 72 hr. Scale bar = 200 μm. (D) N2A cells were transfected with either a non-targeting control (scrambled) or a Dali targeting shRNA expression vector (shDali) for 72 hr. Mean values ± s.e., n = 3. (E) Transient Dali knockdown induces statistically significant changes in the expression of 270 genes in N2A cells (10% FDR) (Supplementary file 2). (F) Gene Ontology (GO) categories significantly enriched among Dali regulated genes (5% FDR, hypergeometric test, Benjamini and Hochberg correction; Supplementary file 2). (G) Decreased Pou3f3 expression upon Dali knockdown. Normalised using Gapdh, shown relative to a non-targeting control (set at 1). Mean values ± s.e., n = 3, one tailed t-Test, unequal variance. (H) Reduced Pou3f3 levels in stable Dali knockdown cells (see panel A). qRT-PCR results were normalised using Gapdh and presented relative to expression in control cells (set arbitrarily to 1). Mean values ± s.e., n = 3, one tailed t-Test, unequal variance.
Figure 2—figure supplement 1
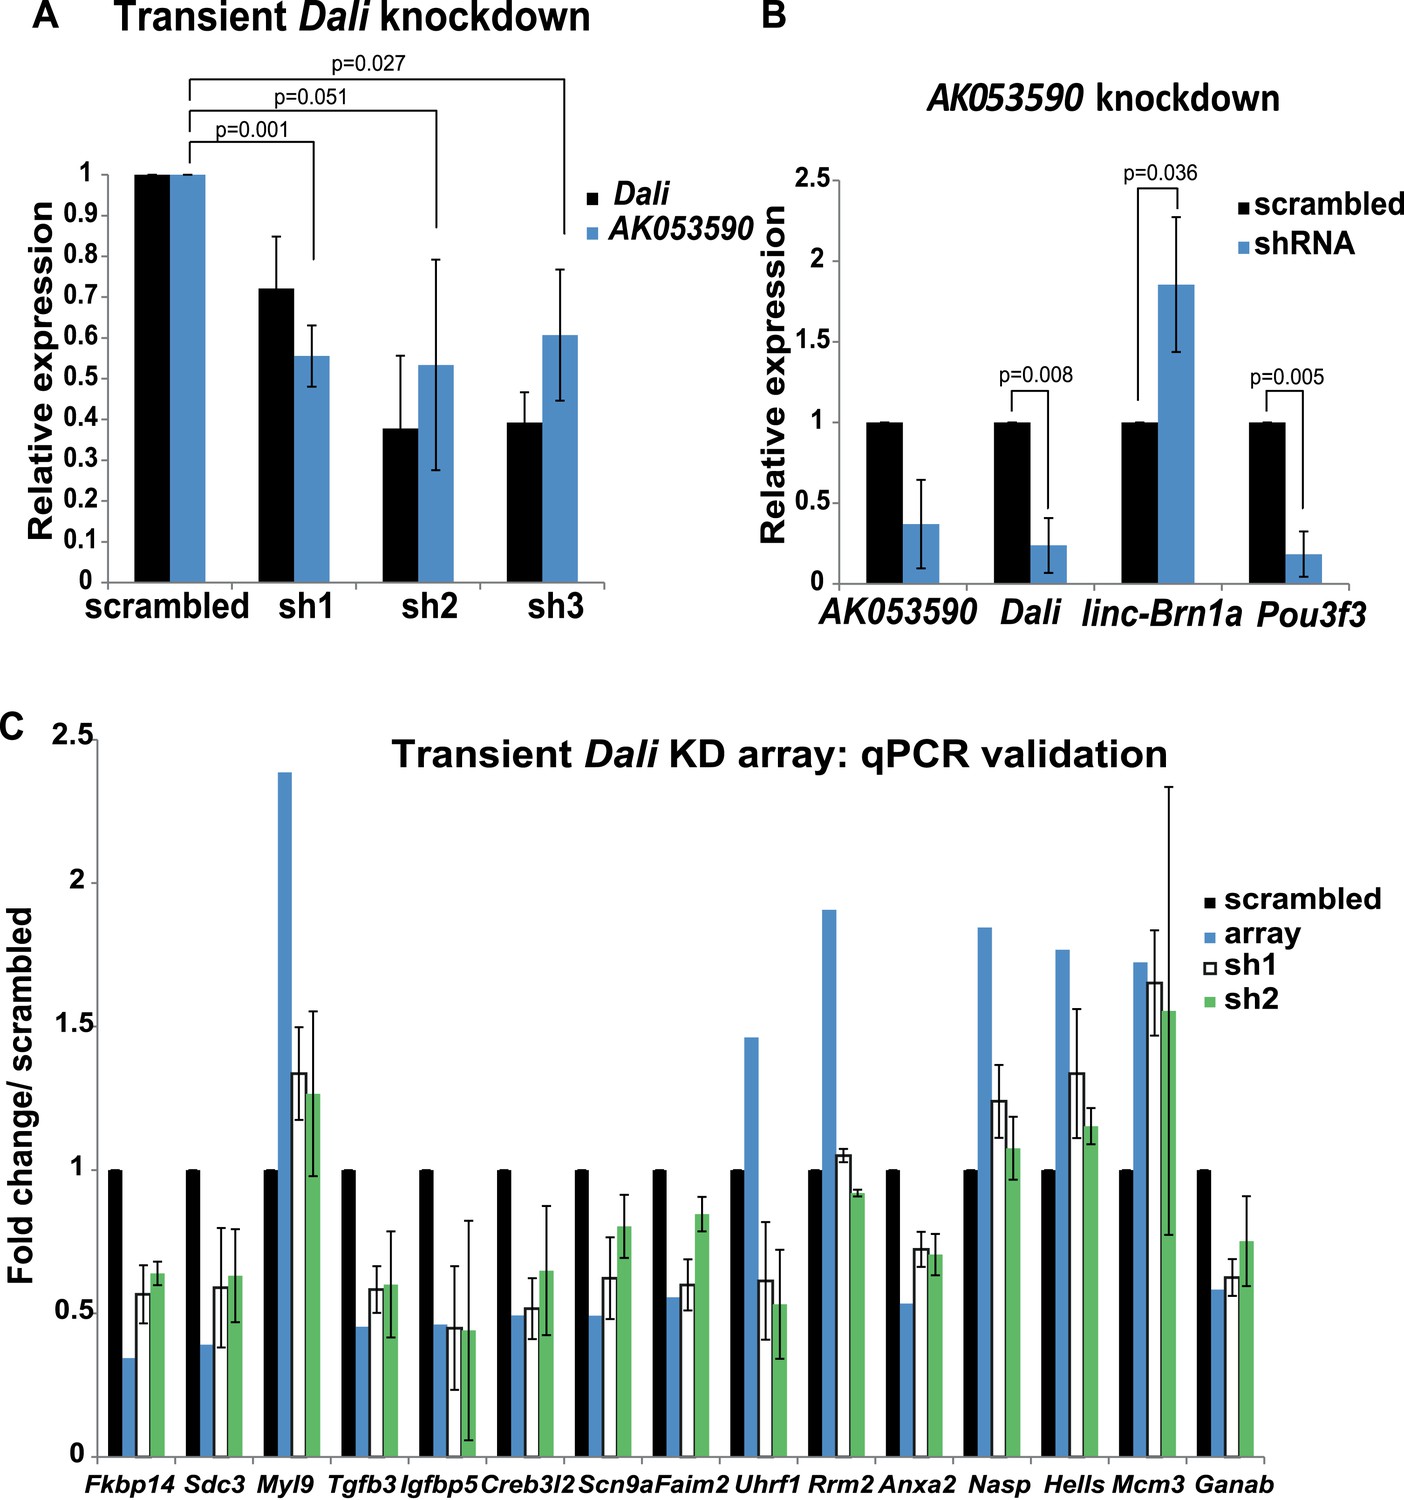
Non-coding transcripts in the Pou3f3 locus form a network of regulatory interactions.
(A) Dali regulates expression of lncRNA AK011913. N2A cells were transfected with either a non-targeting control (scrambled) or three independent Dali targeting shRNA expression vectors. Dali and AK011913 levels were measured by RT-qPCR 72 hr post- transfection. Mean values ± s.e., n = 3, one tailed t-Test, unequal variance. (B) AK011913 regulates expression of Dali and Pou3f3 positively and linc-Brn1a negatively. N2A cells were transfected with either a non-targeting control (scrambled) or a AK011913 targeting shRNA expression vector (shRNA). AK011913, Dali, linc-Brn1a and Pou3f3 levels were measured by RT-qPCR 72 hr post- transfection. Mean values ± s.e., n = 3, one tailed t-Test, unequal variance. (C) RT-qPCR validation of transient Dali knockdown microarray results. Good agreement between microarrays and RT-qPCR and across independent shRNA constructs is observed, indicating that the results are unlikely to represent technical artefacts or off-target effects. Mean values ± s.e., n = 3.
Figure 3

Dali regulates transcription in both Pou3f3-dependent and -independent manners.
(A) N2A cells were transfected with either a non-targeting control (scrambled) or a Pou3f3 targeting shRNA expression vector (knockdown). Pou3f3 and Dali levels were measured by qRT-PCR 72 hr post- transfection. Mean values ± s.e., n = 3. (B) Pou3f3 knockdown resulted in statistically significant changes in the expression of 1041 genes in N2A cells ((10% FDR, Supplementary file 3). (C) GO-analysis of genes differentially expressed upon Pou3f3 analysis (5% FDR, hypergeometric test, Benjamini and Hochberg correction; Supplementary file 3). (D) Intersection of Pou3f3 and Dali targets shows a significant (Fisher’s exact test) overlap approximately 6.2 times as large as expected by chance alone. (E) Target genes common between Dali and Pou3f3 show correlated expression, with the nearly all being positively or negatively regulated by both factors (R = 0.74; Supplementary file 3). (F) Enrichments of Gene Ontology categories of Pou3f3-dependent or -independent Dali targets.
Figure 4 with 1 supplement
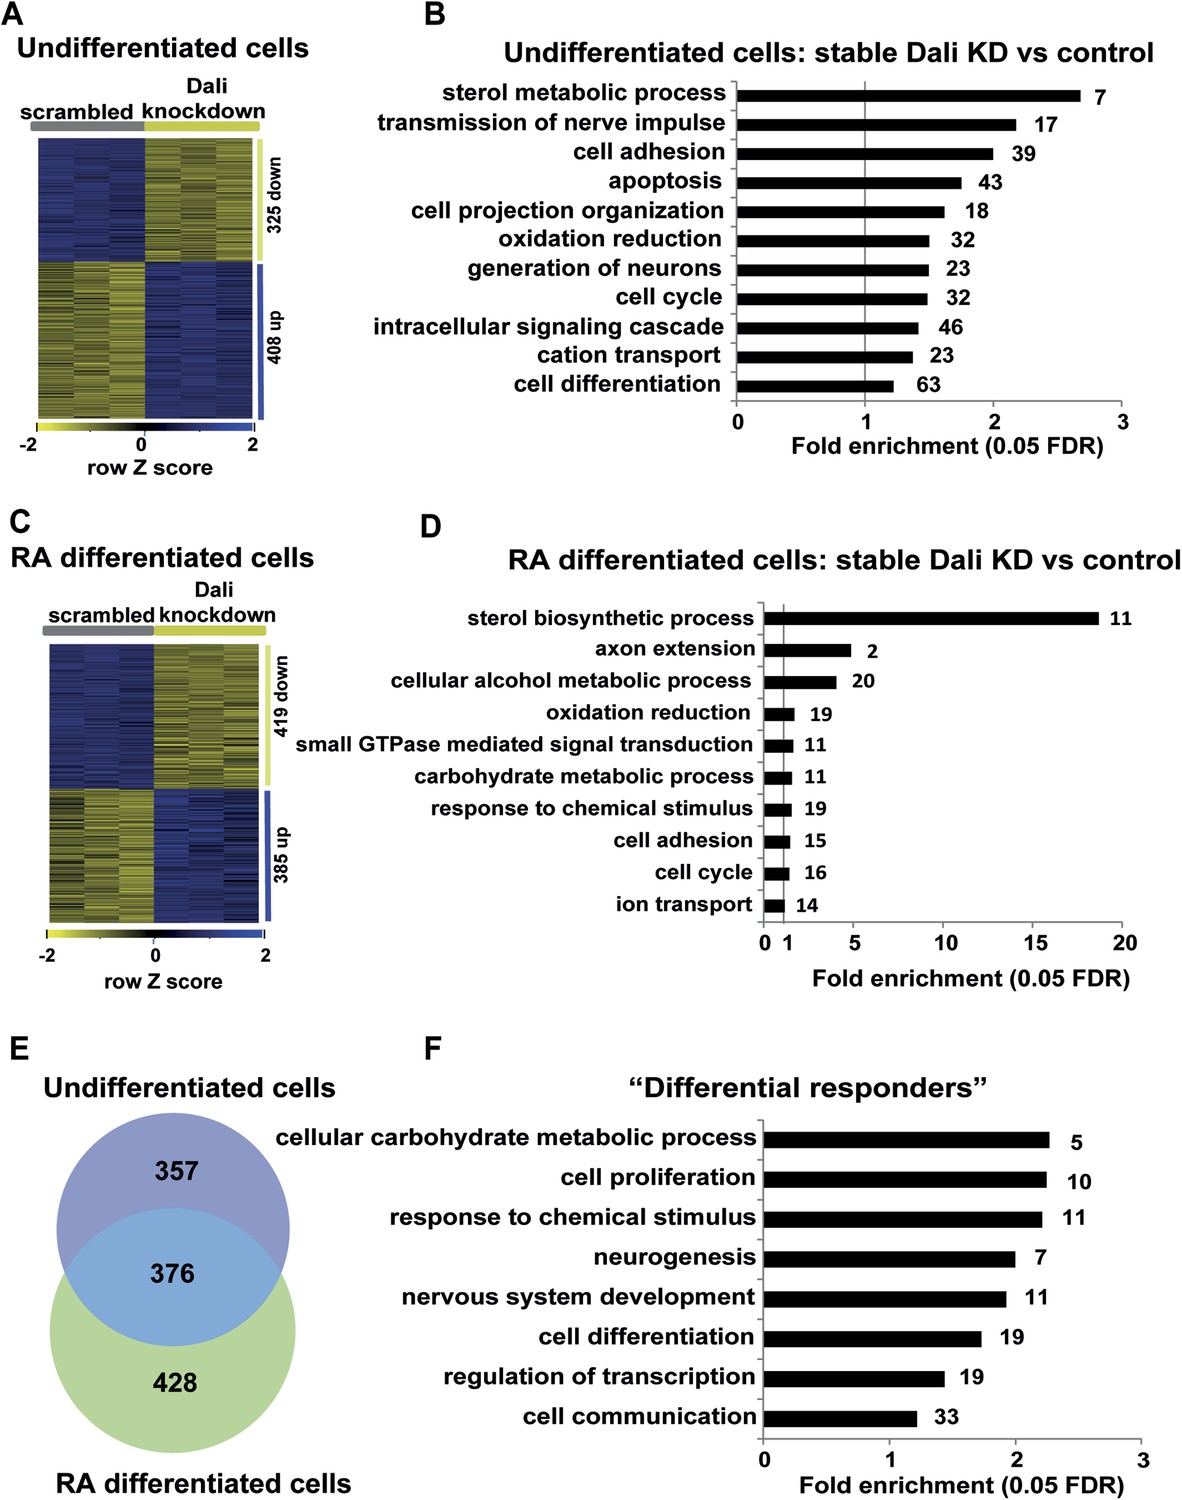
Gene expression analysis of stable Dali knockdown cells.
(A) Stable Dali knockdown resulted in statistically significant changes in the expression of 747 genes in N2A cells (1.3-fold, 5% FDR, Supplementary file 4). 332 genes were up-regulated, 415 down-regulated. (B) GO-analysis of genes differentially expressed upon stable Dali depletion (5% FDR, hypergeometric test, Benjamini and Hochberg correction). (C) Stable Dali knockdown and control cells were differentiated with retinoic acid for 72 hr. 825 genes were differentially expressed between differentiated knockdown and control lines ((≥1.3-fold, 5% FDR, Supplementary file 4). 436 genes were up-regulated, 389 down-regulated. (D) GO-analysis of genes differentially expressed only between differentiated stable Dali knockdown and control cells (5% FDR, hypergeometric test, Benjamini and Hochberg correction). (E) Intersection of gene sets differentially expressed between stable Dali knockdown and control cells prior to (undifferentiated) and after retinoic acid addition (differentiated). (F) GO-analysis of genes responding to retinoic acid treatment differently between stable Dali knockdown and control cells (5% FDR, hypergeometric test, Benjamini and Hochberg correction). ‘Differential responder’ genes were identified using multifactorial analysis of the stable Dali knockdown arrays using limma (Smyth, 2004).
Figure 4—figure supplement 1

Transcriptomics.
(A and C) Heatmap displaying expression changes in control (A) and stable Dali knockdown (C) cells treated with RA for 72 hr. (B and D) GO-analysis of genes differentially expressed (≥1.3-fold, 5% FDR) upon RA treatment of control (B) and stable Dali knockdown (D) cells (5% FDR, hypergeometric test, Benjamini and Hochberg correction). GO categories significantly enriched among genes changing ≥1.5-fold are marked with an asterisk (*).
Figure 5 with 1 supplement

CHART-Seq analysis of Dali genomic binding sites.
(A) Peaks were called against control CHART-seq experiments and input DNA. We consider only the 1427 peaks common to both comparisons (Supplementary File 5). (B) Sequencing of Dali bound DNA reveals focal peaks, including those at the promoter of Ache, E2f2, and Hmgb2. (C and D) Dali peaks are broadly distributed across the mouse genome (C) but are particularly enriched in 5′ UTRs and gene promoters (D). Red arrowheads in (C) mark the Dali locus. (E) A third of Dali peaks are situated within 5 kb of a TSS. (F) Dali-bound loci are enriched in active chromatin marks (H3K4me3, H3K27ac, PolII), DNase I hypersensitivity regions, enhancers and CpG islands annotations (CGI), and CTCF-bound regions, while being depleted of gene body marks (H3K36me3) and repressive chromatin marks (H3K9me3 and H3K27me3). (G) Representative categories from GO analysis of genes associated with Dali binding sites (within 1 Mb) include gene expression, cell cycle, signalling, synaptic transmission and cytoskeleton organization among others. Categories marked with an asterisk (*) are significantly enriched also among genes associated with peaks within 10 kb of a TSS, with two asterisks (**)—among genes with peaks within 100 kb (Supplementary File 5). (H) The intersection of genes proximal (<1 Mb) to Dali peaks, regulated by Dali and changing expression upon Pou3f3 (10% FDR) knockdown identifies those both bound and regulated by Dali, as well as genes regulated by both Dali and Pou3f3 and directly bound by Dali.
Figure 5—figure supplement 1
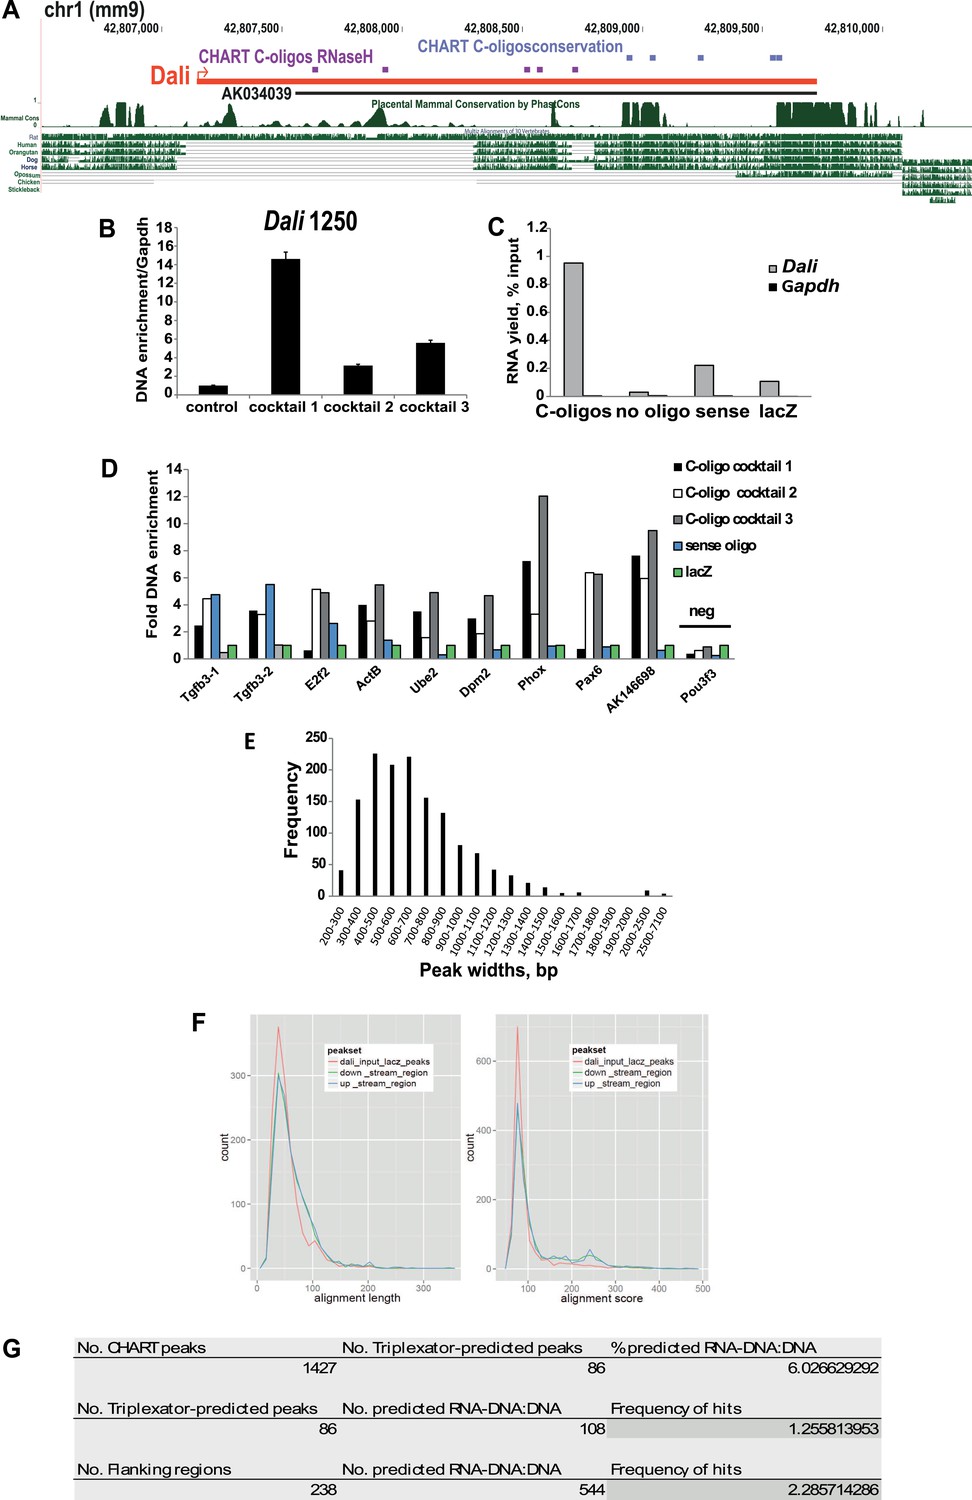
CHART Analysis.
(A) CHART-seq was performed using cocktails of capture (C-) oligos oligonucleotides complementary to accessible (violet) and/or evolutionary conserved (blue) regions of Dali and a non-targeting control. (B) Specific enrichment of Dali genomic locus (at position 1250) using C-oligos compared to controls was assayed by qPCR. Mean values ± s.e., n = 3 (technical replicates). (C) Specific purification of Dali RNA using C-oligos compared to controls was assayed by RT-qPCR. (D) CHART-seq results were validated by performing an independent experiment with the same three cocktails of oligonucleotides, a control sense oligo complementary to the opposite strand of Dali locus and a non-targeting lacZ control oligo. Enrichment of genomic regions identified as peaks was assayed by qPCR. (E) Dali binds to chromatin in a focal manner, with most peaks being <1000 bp wide. (F) Computational analysis of CHART-seq peak set and Dali showed that DNA sequences under peaks are not more complementary to Dali sequence than control flanking regions, as judged by either length of aligned regions (left) or alignment quality score (right). (G) DNA sequences under peaks are also not predicted to form RNA:DNA–DNA triplexes with the Dali transcript than control flanking regions.
Figure 6
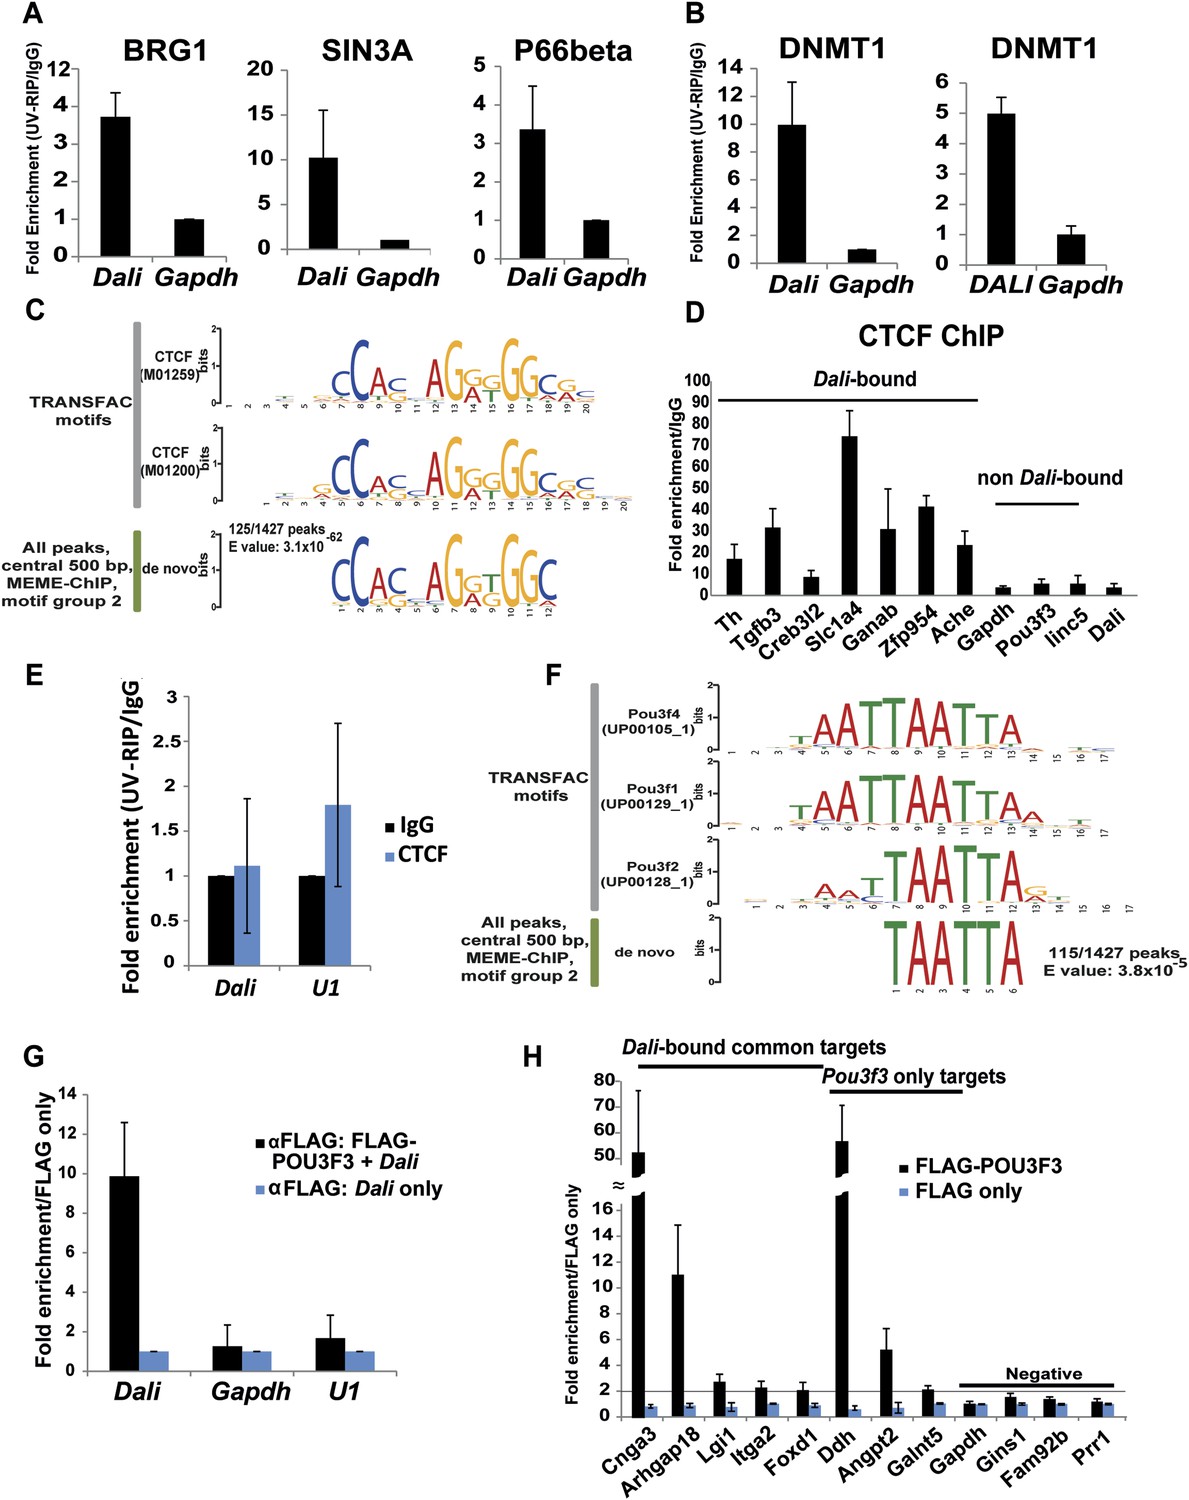
Dali associates with chromatin and transcriptional regulatory proteins.
Dali interacts with BRG1, SIN3A, and P66beta in mouse N2A cells (A) and DNMT1 in mouse N2A and human SH-SY5Y cells (B). Nuclear extracts prepared from UV cross-linked cells were immuno-precipitated using either anti-DNMT1 or control IgG antibodies. Associated RNAs were purified and the levels of Dali and control Gapdh mRNA were quantified using qRT-PCR. Results are expressed as fold enrichment relative to an isotype IgG control antibody. Mean value ± s.e., n = 3. (C) De novo discovery of a near-perfect match to a CTCF motif in 125/1427 (8.8%) Dali CHART-Seq peaks. (D) Dali co-occupies several locations shared with CTCF. Control regions are not predicted to be bound by CTCF and are not bound by Dali. ChIP assays were performed in N2A cells using either an antibody against CTCF or an isotype specific control. The indicated DNA fragments were amplified using qPCR. Fold enrichment was calculated as 2-ΔΔCt (IP/IgG). Mean value ± s.e., n = 3. (E) Dali does not directly interact with CTCF protein in mouse N2A cells. Nuclear extracts were prepared from UV cross-linked cells and immuno-precipitated using either anti-CTCF or control IgG antibodies. Associated RNAs were purified and the levels of Dali and control U1 snoRNA were detected in each UV-RIP using qRT-PCR. Results are expressed as fold enrichment relative to an isotype IgG control antibody. Results are presented as mean value ± s.e. of three independent experiments. (F) De novo discovery of a motif for POU III family transcription factors (which includes POU3F3) in 115/1427 (8.1%) Dali CHART-Seq peaks. (G) UV-RIP in N2A cells: FLAG-tagged POU3F3 protein directly interacts with Dali. Mean value ± s.e., n = 3. (H) ChIP-qPCR in N2A cells: POU3F3 occupies a subset of loci bound by Dali and regulated by both Pou3f3 and Dali. Loci associated with known (Dali-independent) Pou3f3 targets were used as positive control, while loci not regulated by either Pou3f3 or Dali and not bound by Dali were used as negative control. Mean value ± s.e., n = 3.
Figure 7 with 1 supplement
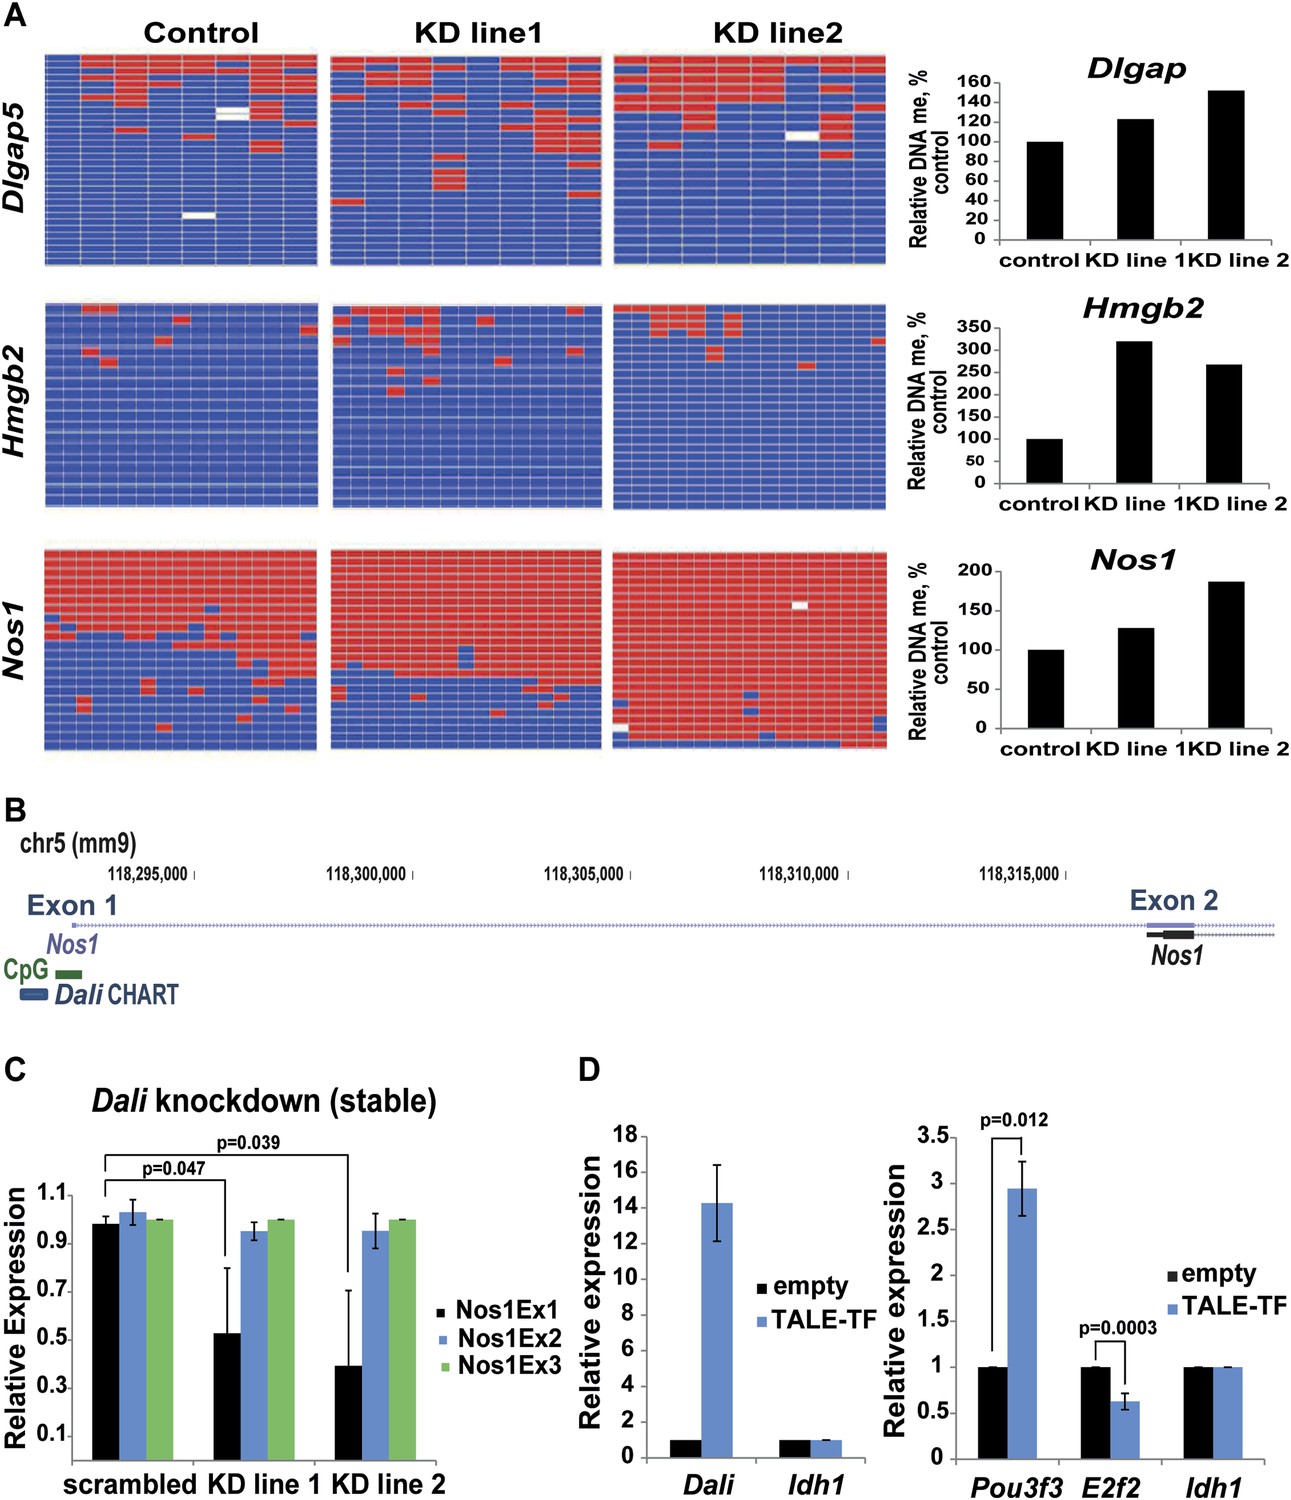
Dali modulates DNA methylation at bound and regulated promoters.
(A) DNA methylation status of three CGI-associated promoters bound and regulated by Dali was assessed using bisulfite sequencing in control and two stable Dali knockdown lines. DNA methylation levels were found to be increased in knockdown lines. The degree of increase was correlated with the degree of Dali knockdown (see Figure 7—figure supplement 1). (B) Nos1 gene has two clusters of alternative TSSs (Exon 1 and Exon 2). The upstream neuronal tissue-specific cluster (Exon 1) is associated with a CpG island and is bound by Dali. (C) Down-regulation of Nos1 observed in stable Dali knockdown lines can be explained by reduced initiation from the Dali-bound TSS (Exon 1), as the ratio between Exon1 and an internal Exon 3 is diminished, while the ratio between Exon 2 and Exon 3 is not changed. Mean values ± s.e, n = 3, one tailed t-Test, unequal variance. (D) Dali transcript regulates Pou3f3 locally and E2f2 distally in ES mouse cells. Dali is expressed from its endogenous locus in non-expressing mouse E14 ES cells using custom-designed TALE-TF (left). De novo induction of the endogenous Dali locus is sufficient to up-regulate the neighbouring Pou3f3 gene and down-regulate the distally located E2f2 gene (right). Mean value ± s.e., n = 3.
Figure 7—figure supplement 1
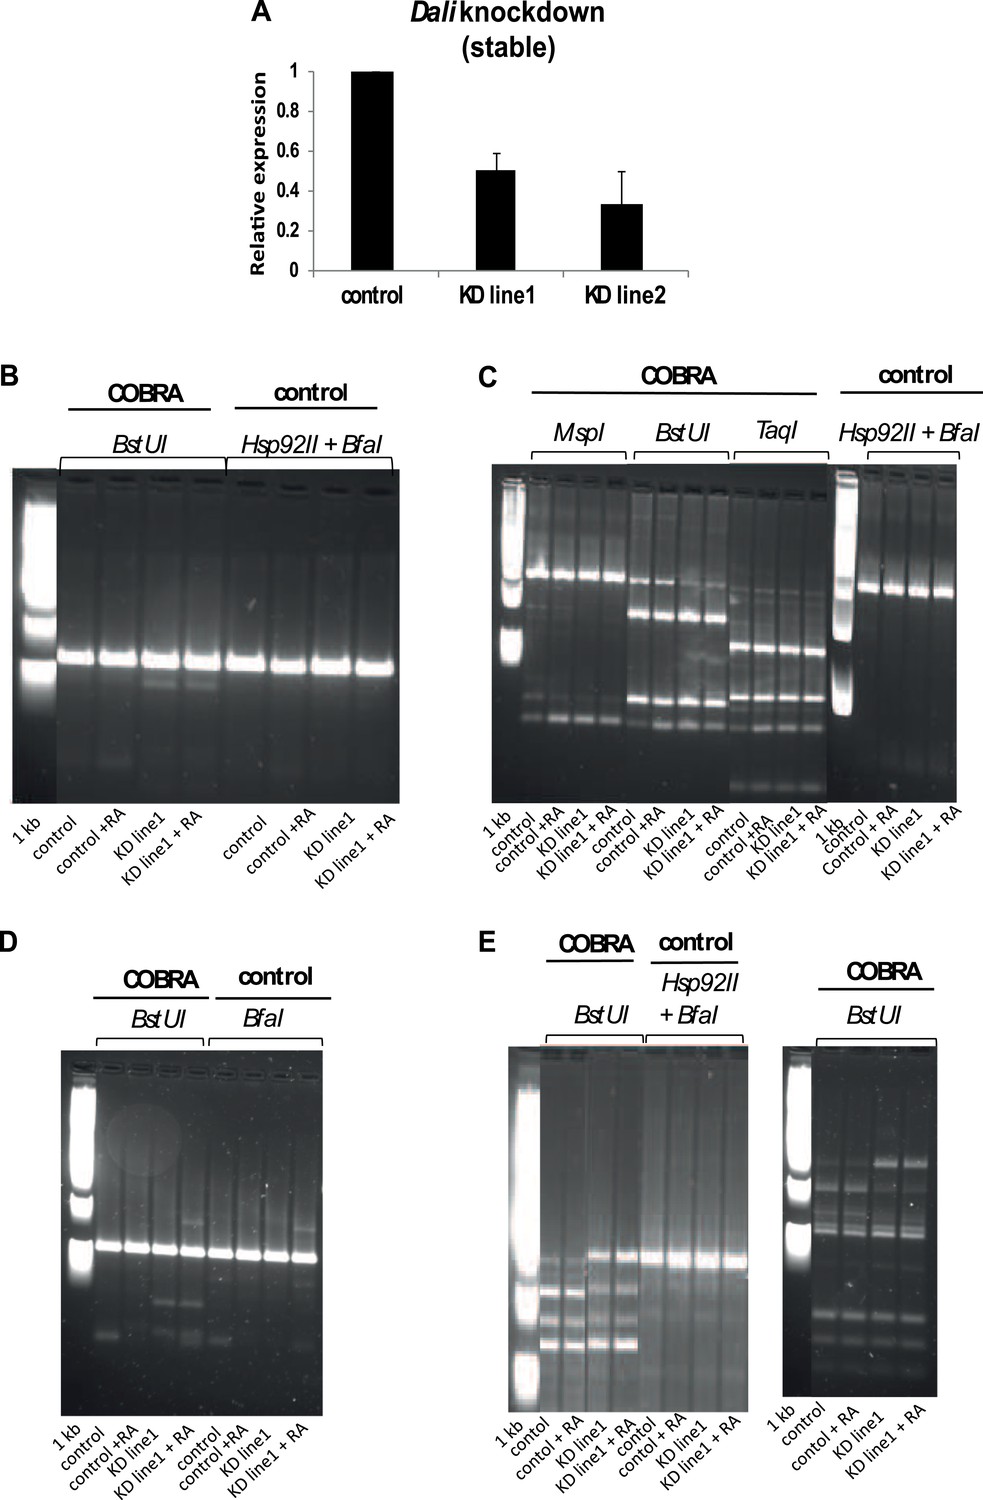
DNA Methylation analysis.
(A) DNA methylation status of three Dali-bound and regulated CGI-associated promoters (Dlgap5, Nos1, and Hmgb2; see Figure 7) was assayed in a stable control and two independently isolated Dali knockdown lines (mean value ± s.e., n = 3). The degree of DNA methylation increase correlated with the degree of Dali depletion observed. (B, C, D, E) Combined bisulfite restriction analysis (COBRA assay) results for Hmgb2 (B), Fbn1 (C), Dlgap5 (D), Nos1 (E). COBRA was performed by bisulfite-treating genomic DNA of control and stable Dali knockdown cells, proliferating and differentiated with RA (+RA), PCR-amplifying the CpG-island associated promoters of the indicated Dali-bound and regulated genes, and digesting the PCR products with COBRA-compatible or control enzymes.
Additional files
-
Supplementary file 1
Oligonuleotides.
- https://doi.org/10.7554/eLife.04530.016
-
Supplementary file 2
Transient Dali knockdown microarray profiling.
- https://doi.org/10.7554/eLife.04530.017
-
Supplementary file 3
Genes changing in transient Pou3f3 knockdown and intersection with Dali targets.
- https://doi.org/10.7554/eLife.04530.018
-
Supplementary file 4
Stable Dali knockdown gene lists.
- https://doi.org/10.7554/eLife.04530.019
-
Supplementary file 5
CHART analysis.
- https://doi.org/10.7554/eLife.04530.020
-
Supplementary file 6
Motif discovery.
- https://doi.org/10.7554/eLife.04530.021
-
Supplementary File 7
Mass spectrometry identification of Dali associated proteins.
- https://doi.org/10.7554/eLife.04530.022
Download links
A two-part list of links to download the article, or parts of the article, in various formats.
Downloads (link to download the article as PDF)
Open citations (links to open the citations from this article in various online reference manager services)
Cite this article (links to download the citations from this article in formats compatible with various reference manager tools)
The long non-coding RNA Dali is an epigenetic regulator of neural differentiation
eLife 3:e04530.
https://doi.org/10.7554/eLife.04530


