Proteomic analysis of the response to cell cycle arrests in human myeloid leukemia cells
- University of Dundee, United Kingdom
Figures
Figure 1

Experimental workflow and positive controls.
(A) NB4 cells were differentially treated using serum starvation (SS), hydroxyurea (HU), and RO-3306 to arrest cells in G0/G1, S, and G2 phases of the cell cycle, respectively. Cells were then processed for label-free quantitative MS-based proteomics in a similar manner to the previous analysis of elutriated cells (Ly et al., 2014). (B) Asynchronous and arrested cells were stained with a DNA-binding dye and analyzed by flow cytometry. DNA content histograms are shown. Cells with >4N DNA content (∼3.3%) are highlighted in the RO-3306 data. (C) Immunoblot analysis of the arrested cells using antibodies recognizing cell cycle phase-specific markers (cyclin A, cyclin E, and cyclin B1) and beta tubulin as a loading control. (D) Pairwise comparisons of MS-based protein abundances (LFQ intensities) independently processed and measured from three asynchronous NB4 cultures. Pearson correlation coefficients are reported in the top left corner of each scatter plot.
Figure 2
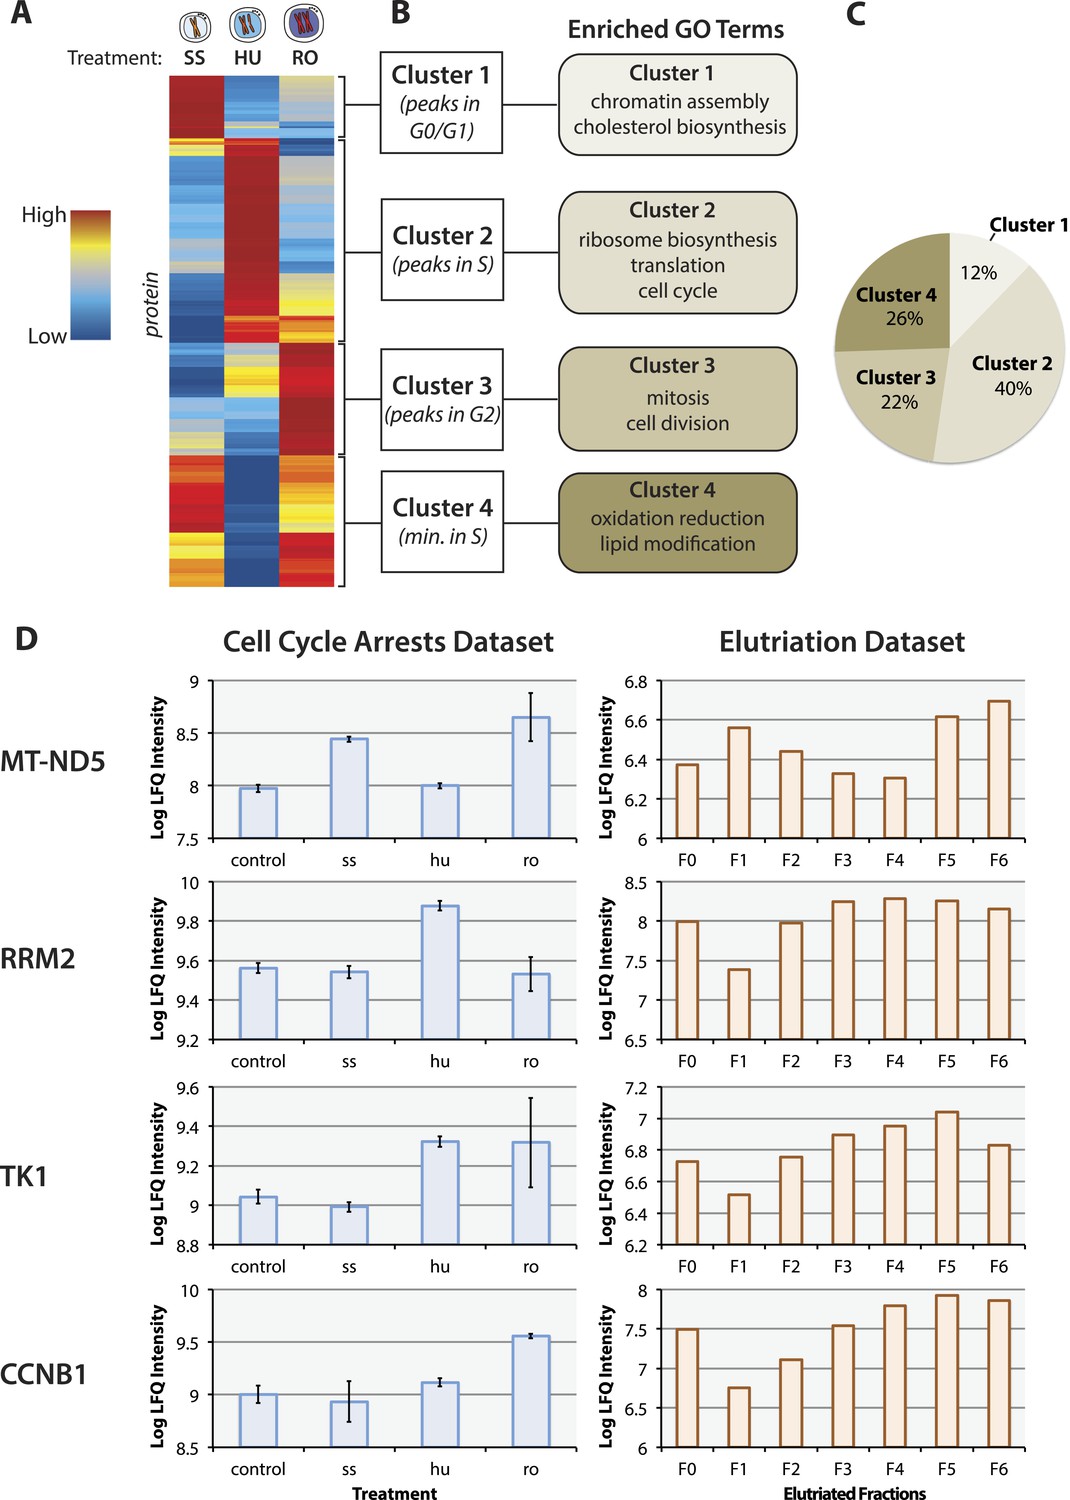
The proteomic response to cell cycle arrests.
(A) The final proteomic dataset after quality control filtering consisted of 3,068 proteins identified with two or more peptides per protein and quantitated in all three replicates within a treatment group. 484 proteins vary in abundance between asynchronous arrested cells using cutoffs based on effect size (≥twofold change between any two conditions) and statistical robustness (p < 0.05, ANOVA). The scaled and clustered abundances of these 484 arrest regulated proteins are illustrated as a heatmap. Each protein is represented by a horizontal line, and the colour (red: high, blue: low) represents the scaled abundance in three treatments. (B) We identify four clusters based on peak expression, which are differentially enriched in gene ontology (GO) biological functions. (C) The proportions of arrest regulated proteins in each cluster. (D) Comparison of the protein abundance changes measured in the cell cycle arrest data set vs the elutriation data set (Ly et al., 2014) for selected proteins (MT–ND5, RRM2, TK1, and CCNB1). Error bars indicate the standard error of the mean log-transformed abundances.
Figure 3
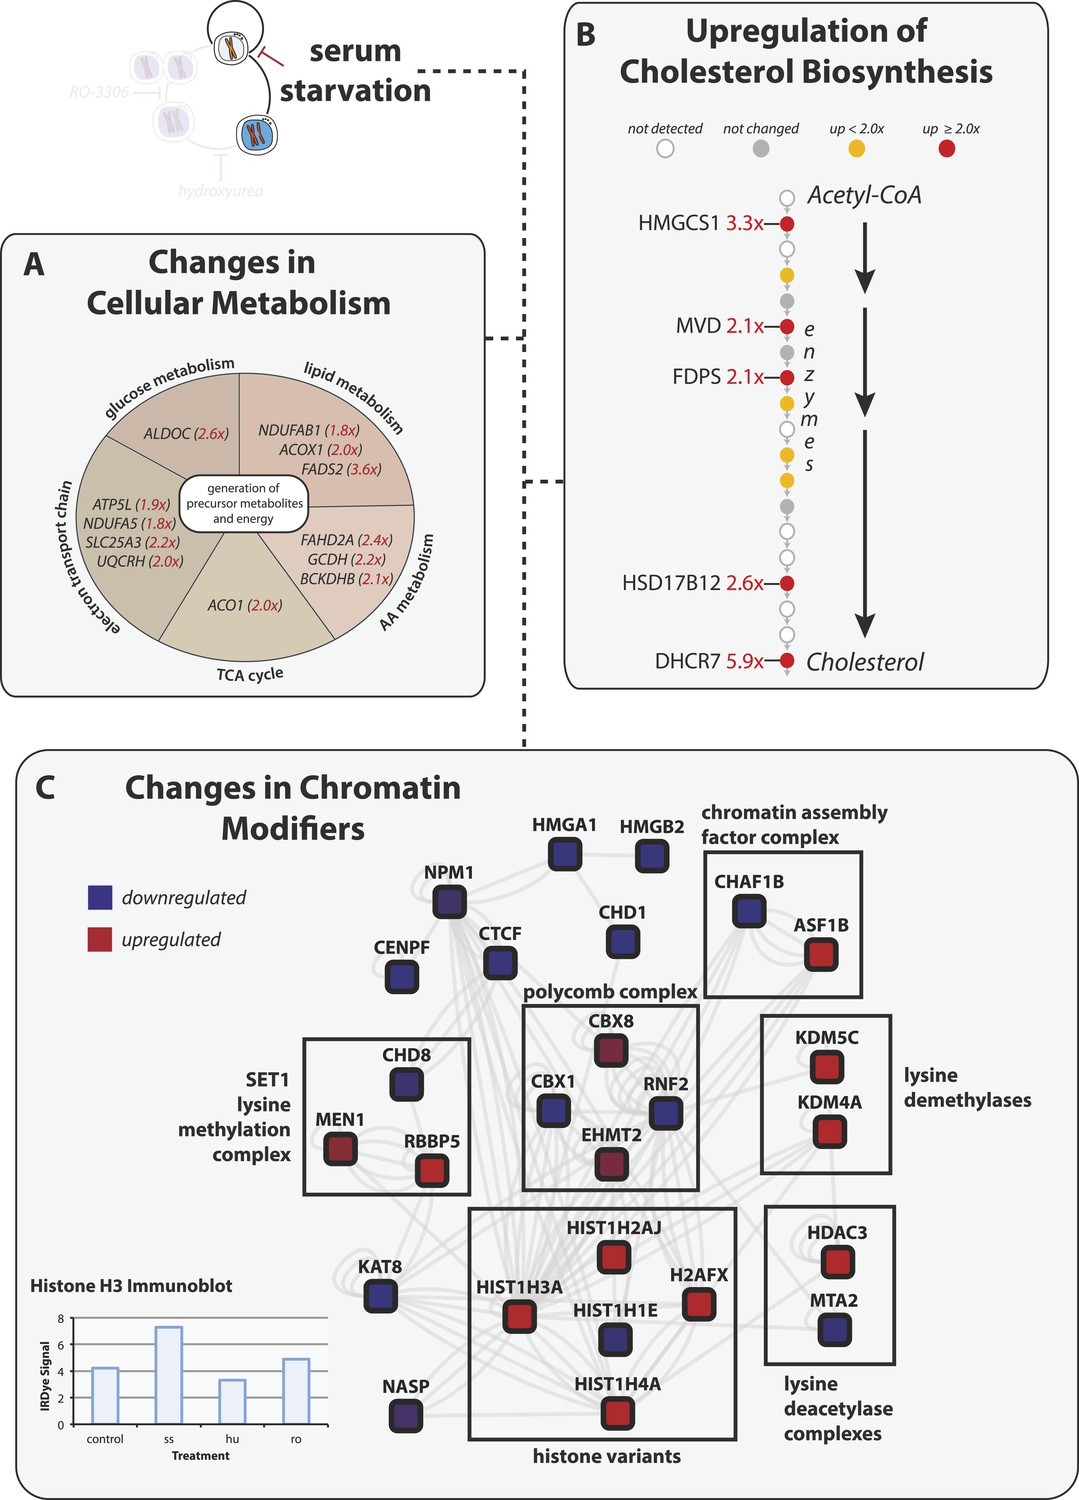
Serum starvation induces changes to cellular metabolism and chromatin remodeling proteins.
(A) Proteins involved in generating precursor or secondary metabolites are shown grouped by metabolic pathway. Fold changes are shown in red in parentheses. (B) The cholesterol biosynthesis pathway is shown schematically (Espenshade and Hughes, 2007) with enzymes shown as circles and arrows indicating progressive steps in the pathway from acetyl-CoA to cholesterol. Fold changes are indicated by shading and are explicitly provided when greater than twofold. (C) Network analysis of chromatin-associated proteins that change in abundance in response to serum starvation. The colour indicates the direction of the change (red: up, blue: down), and the shading indicates the magnitude.
Figure 4

A pathway analysis of the proteomic response to (A) hydroxyurea and (B) RO-3306 treatment.
Boxes containing large arrows and circles show the enriched KEGG and REACTOME pathways in each treatment. The direction of the arrows and colour indicates whether the pathway is up- (red) or down- (blue) regulated compared to asynchronous cells. The green lines and their thicknesses indicate the overlap between pathways. Proteins in individual pathways are shown as rounded squares and are connected by grey lines where protein–protein interactions have been reported. The colouring indicates the direction of the fold change and the shading represents the magnitude. (C) Immunofluorescence flow cytometry of asynchronous cells stained with αCDT1 antibody (AF-488 secondary conjugate, y-axis) and a DNA-binding dye (DAPI, x-axis). CDT1 protein expression is high in G1 cells, low in S-phase cells, and intermediate in G2&M cells. Comparison of CDT1 expression (D) and the relative ratio of CDT1:Geminin expression (E) measured by immunofluorescence flow cytometry in mock (red line) vs RO-3306 treated (blue line) G2&M cells gated by DNA content.
Additional files
-
Supplementary file 1
Filename: Supp_Table_1.txt. Title: Proteomics Data set Legend. This tab-delimited table summarizes the proteins identified and quantified in asynchronous NB4 cells and in serum starvation, hydroxyurea, and RO-3306 arrested cells and includes the following data for each protein identification: protein and gene identifiers, protein descriptions, the number of supporting peptides, the posterior error probabilities (PEPs), the extracted ion chromatogram (XIC) intensities, the LFQ-normalized intensities, and the p-value results from the statistical tests. P-values were calculated for pairwise comparisons between asynchronous and each of the arrest treatments (‘ss.pvalue’, ‘hu.pvalue’, ‘ro.pvalue’). An ANOVA was also used to calculate a global p-value (‘arrest.pvalue’).
- https://doi.org/10.7554/eLife.04534.006
-
Supplementary file 2
Filename: Supp_Table_2.txt. Title: Proteins Regulated by Cell Cycle Arrest Legend. This tab-delimited table lists the proteins that meet the fold change (≥twofold) and p-value (<0.05) criteria. Logical columns indicate whether the protein meets the cutoffs separately for each treatment versus asynchronous (‘ss.changing’, ‘hu.changing’, ‘ro.changing’), and globally using the global p-value calculated from the ANOVA (‘arrest.changing’). The cluster membership (‘cluster’) and the peak treatment (‘peakfraction’, 1:ss, 2:hu, 3:ro) for each protein are provided. A correlation coefficient (Pearson) is calculated between the elutriation and arrest abundance profiles (‘correlation_with_elutriation_data’). Each protein was also categorized as being either, ‘Not Detected in the Elutriation Data set’, ‘Detected in the Elutriation Data set’, ‘Quantitated in the Elutriation Data set’, or ‘Cell Cycle Regulated in the Elutriation Data set’, as indicated in the column ‘status_in_elutriation_dataset’.
- https://doi.org/10.7554/eLife.04534.007
Download links
A two-part list of links to download the article, or parts of the article, in various formats.
Downloads (link to download the article as PDF)
Open citations (links to open the citations from this article in various online reference manager services)
Cite this article (links to download the citations from this article in formats compatible with various reference manager tools)
Proteomic analysis of the response to cell cycle arrests in human myeloid leukemia cells
eLife 4:e04534.
https://doi.org/10.7554/eLife.04534


