Epigenetic modulation of type-1 diabetes via a dual effect on pancreatic macrophages and β cells
- Harvard Medical School, United States
- Massachusetts General Hospital, Harvard Medical School, United States
- GlaxoSmithKline, United Kingdom
- Harvard Medical School and Brigham and Women's Hospital, United States
Figures
Figure 1
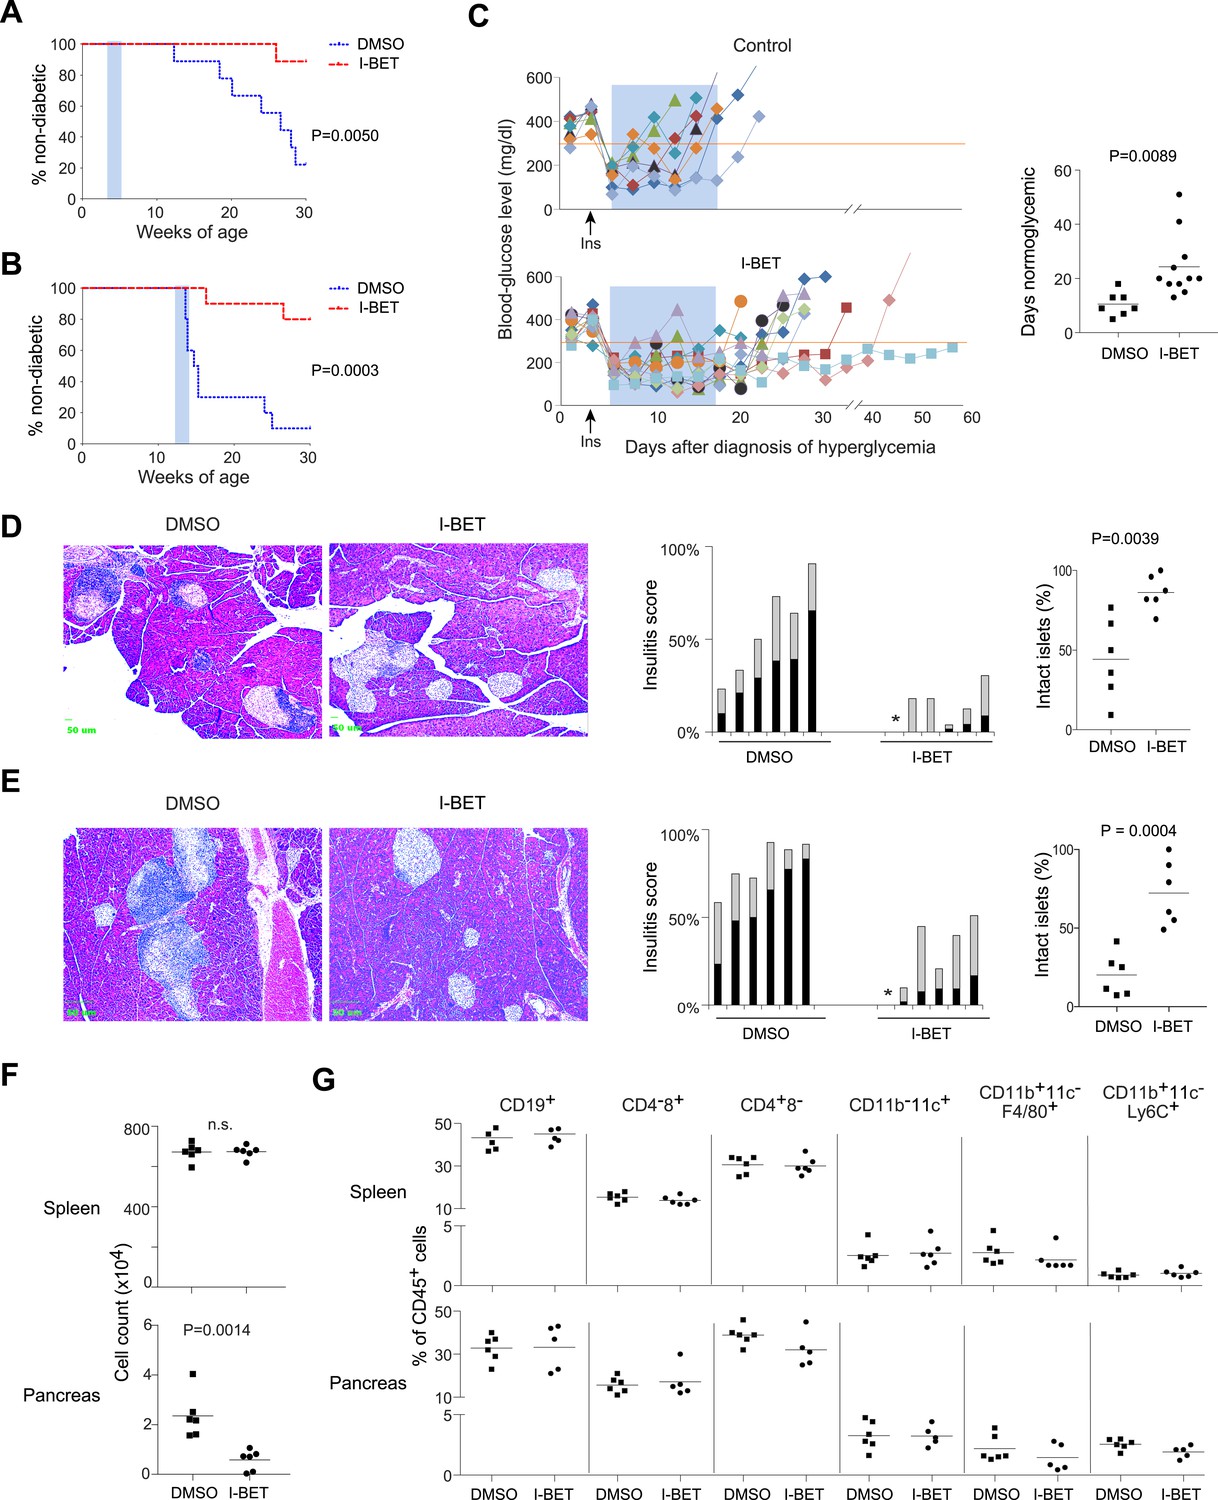
I-BET151 inhibits diabetes and insulitis in NOD mice.
Female NOD mice were treated with I-BET151 in DMSO (10 mg/kg daily) or just DMSO from 3–5 weeks (A and D) or 12–14 weeks (B and E) of age. (A and B) Pre-diabetic mice. Hyperglycemia was monitored until 30 weeks of age. n = 10 per group. Blue shading = treatment window. (C) Recent-onset diabetic mice. Left: Individual blood-glucose curves. An insulin pellet was implanted subcutaneously within 1 day of diabetes diagnosis (arrow). 2 days later, I-BET151 (10 mg/kg) or DMSO was administered daily for 2 weeks (shaded blue). Right: duration of normoglycemia. n = 7 or 11. (D and E) Insulitis was visualized by H&E staining of paraffin sections. Left: representative histology. Middle: insulitis scores for individual mice. Grey = peri-insulitis; black = insulitis. The asterisk indicates no insulitis in any of the sections examined. Right: summary of the proportions of intact islets for individual mice. (F) Left: Total CD45+ cells from the spleen (upper panel) or pancreatic islets (lower panel) from mice treated with I-BET151 or DMSO as per Figure 1B, and analyzed at 14 weeks. n = 6. (G) Summary data on the major immune-cell subsets as a fraction of CD45+ cells, from the spleen (upper panels) or pancreas (lower panels). n = 5 or 6. p values in A and B are from Gehan-Breslow-Wilcoxon tests and in C–G are from Student's t tests.
Figure 2
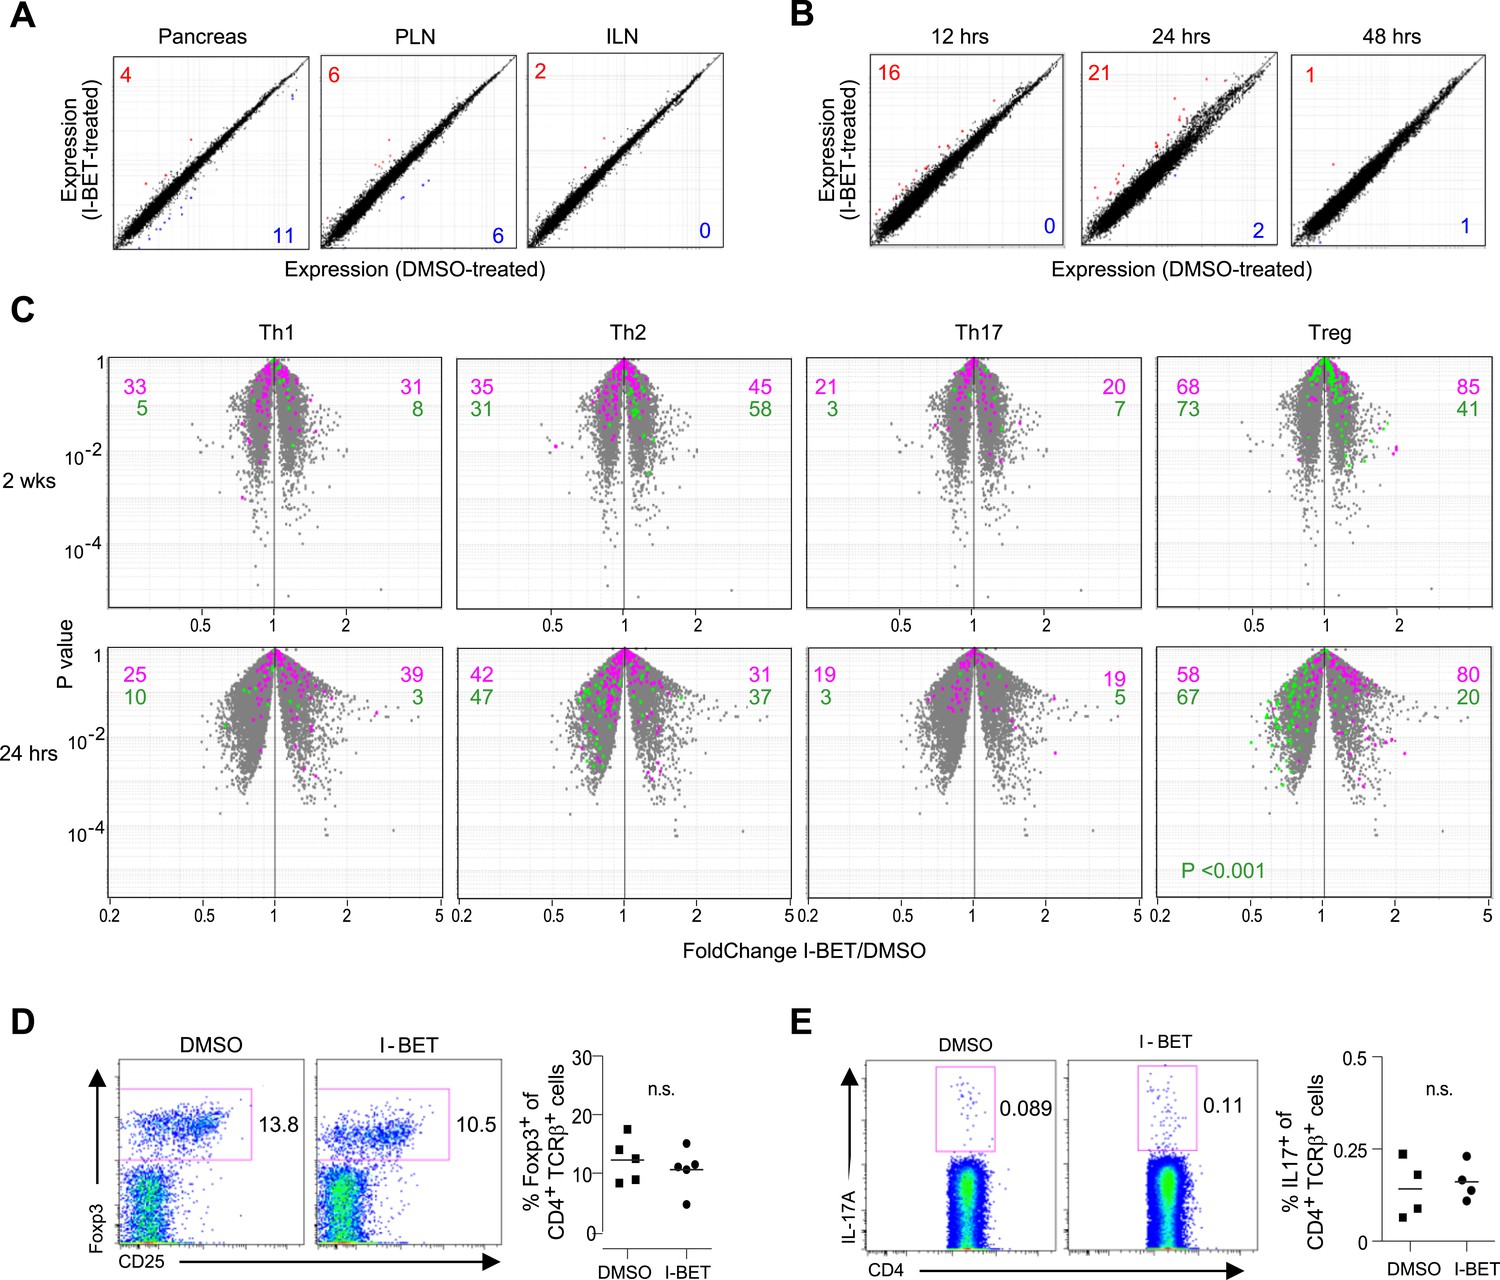
Little impact of BET-protein inhibition on CD4+ T cells in NOD mice.
(A) Microarray-based transcriptional profiling of TCR+CD4+ cells sorted from pancreata, pancreatic lymph nodes (PLNs) and inguinal lymph nodes (ILNs). Comparison plot of I-BET151- and DMSO-treated mice as per Figure 1B and analyzed at 14 weeks of age. Red, transcripts increased >twofold by I-BET151; blue, transcripts >twofold decreased. (B) Analogous plots of TCR+CD4+ cells sorted from the pancreas of mice given a single I-BET151 (10 mg/kg) or DMSO injection, and analyzed 12, 24 or 48 hr later. (C) Th1, Th2, Th17 or Treg signatures (see ‘Materials and methods’) were superimposed on volcano plots comparing the transcriptomes of TCR+CD4+ cells from the pancreas of mice treated with I-BET151 or DMSO either as per Figure 1B and analyzed at 14 weeks of age (upper panels) or with a single injection and analyzed 24 hr later (lower panels). Purple: over-represented signature transcripts; Green: under-represented signature transcripts. (D and E) Proportions of Treg (D) or Th17 (E) cells within the TCR+CD4+ population in the pancreas of I-BET151- or DMSO-treated mice. Left, representative cytofluorometric dot plots; right, summary data. n = 4–5. p values in panel C are from the Chi-squared test (the single significant value is shown; all others were not significant) and in D–E from Student's t tests.
Figure 3
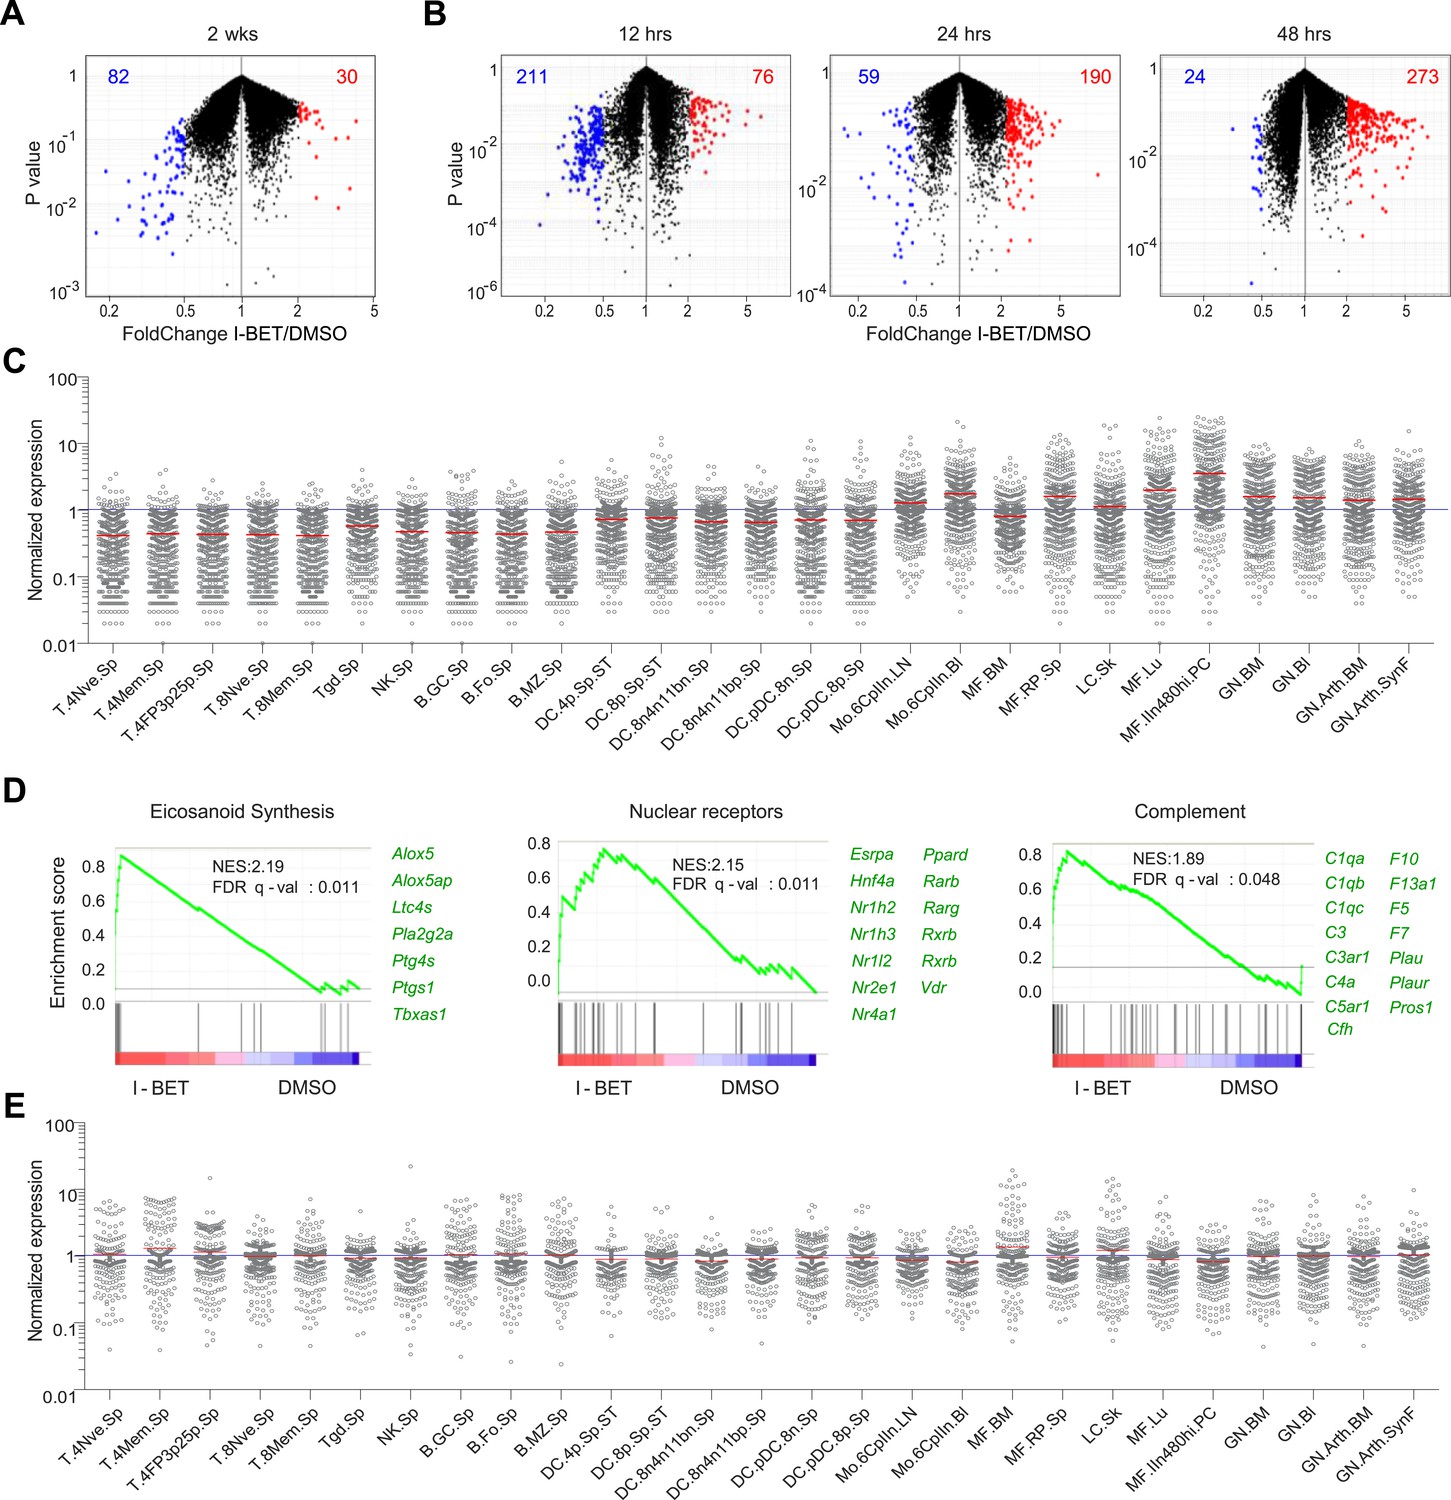
I-BET151 treatment promotes an MF-like, anti-inflammatory transcriptional program in pancreatic CD45+ cells.
(A and B) A volcano plot comparing the transcriptomes of pancreatic CD45+ cells from mice treated with I-BET151 or DMSO as per Figure 1B. Red: transcripts increased >twofold; blue: transcripts decreased >twofold; numbers of modulated transcripts are indicated in the corresponding color. (B) Analogous plots for mice given a single injection of I-BET151 (10 mg/kg) or DMSO only, and analyzed 12, 24 or 48 hr later. (C) Cell-type distribution of the totality of transcripts whose expression was increased >twofold in panels A and B (red). Expression data for and definition of the various cell-types came from ImmGen (www.Immgen.org). Langerhans cells of the skin (LC.SK) have been re-positioned as per recent data (Gautier et al., 2012). Expression values were row-normalized. (D) GSEA of the totality of transcripts increased in pancreatic CD45+ cells of mice treated with I-BET151 (red dots in panels A and B). NES, normalized enrichment score. Representative genes showing increased expression on the right. (E) A plot analogous to that in panel C for the totality of transcripts >twofold under-represented in drug-treated mice (blue dots in panels A and B).
Figure 4
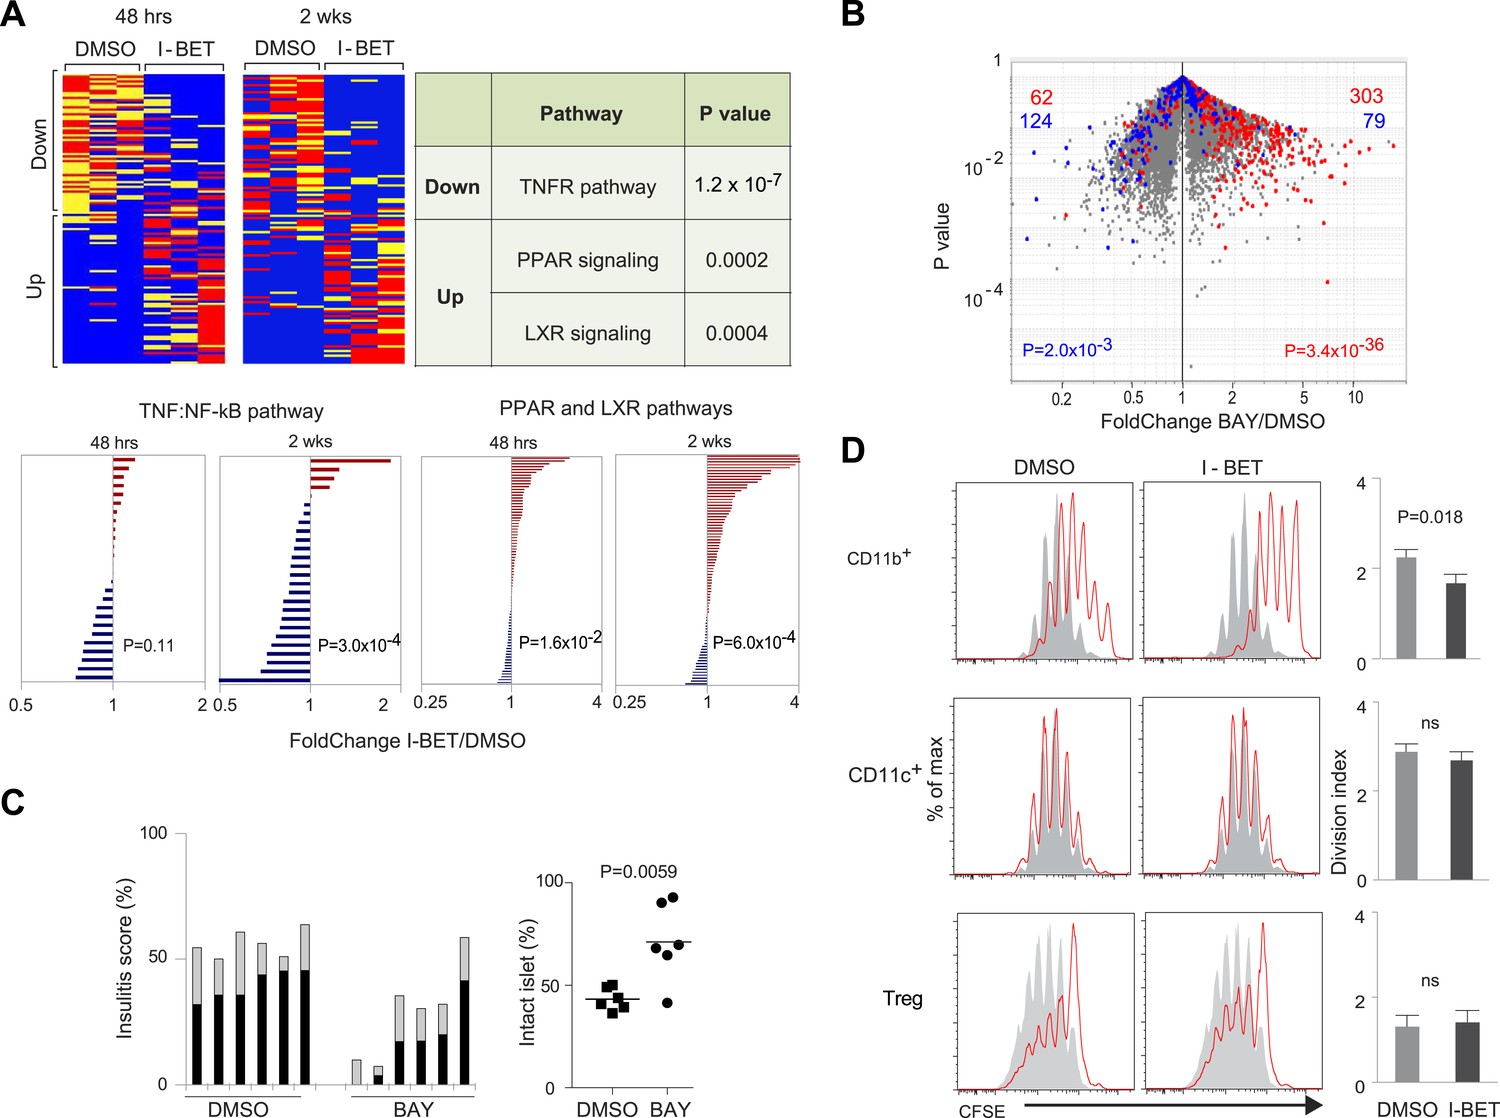
The NF-κB signaling pathway is a major focus of I-BET151's influence on NOD leukocytes.
(A) Upper panels: The inhibitor's effect on NF-κB-regulated genes—defined as per http://www.bu.edu/nf-kb/gene-resources/target-genes. Left, relevant transcripts from pancreatic CD45+ cells of NOD mice treated long- or short-term with I-BET151 or DMSO. Red: over-represented; blue: under-represented. 2 wk: long-term, treatment as per Figure 1B; 48 hr: short-term, treatment with a single 10 mg/kg dose and analyzed 48 hr later. Right, signaling pathways represented by the enriched or impoverished transcripts in the data to the left, via Ingenuity pathway analysis (www.ingenuity.com). Lower panels: Gene sets corresponding to the TNFα-induced canonical NF-κB pathway (Schaefer et al., 2009) or the PPAR and LXR pathways (http://www.genome.jp/kegg/pathway/hsa/hsa03320.html) were retrieved from the Broad Institute's Molecular Signatures Database (http://www.broadinstitute.org/gsea/msigdb), and their expression levels in CD45+ cells from pancreas of I-BET151- or vehicle-treated mice plotted. (B) 12-week-old NOD mice were injected once ip with BAY 11–7082 (10 mg/kg), sacrificed 24 hr later, and CD45+ cells from the pancreas isolated and transcriptionally profiled. A volcano plot comparing treatment with BAY 11–7082 and DMSO, with genes >twofold increased (in red) or decreased (in blue) by I-BET151 treatment (pooled from all time-points of Figure 3A,B) superimposed. (C) Effect of a single dose of 10 mg/kg BAY 11–7082 on insulitis in 12-week-old NOD mice, analyzed 24 hr after injection. Left: insulitis scores. Right: summary data for the fraction of islets with no infiltrate. Grey, peri-insulitis; Black, insulitis. (D) Suppression of in vitro T cell proliferation by cell populations isolated from the pancreas of I-BET151- or DMSO- treated mice (as per Figure 1B). The CD11b+CD11c− (top), CD11b−CD11c+ (middle) and TCRβ+CD4+CD25+ (bottom) fractions of CD45+ cells were sorted. To the left are representative plots of CFSE dilution; to the right are summary data quantifying division indices (see ‘Materials and methods’ for details). p values in A and B are from the chi-squared test, and in C and D are from the Student's t test.
Figure 5
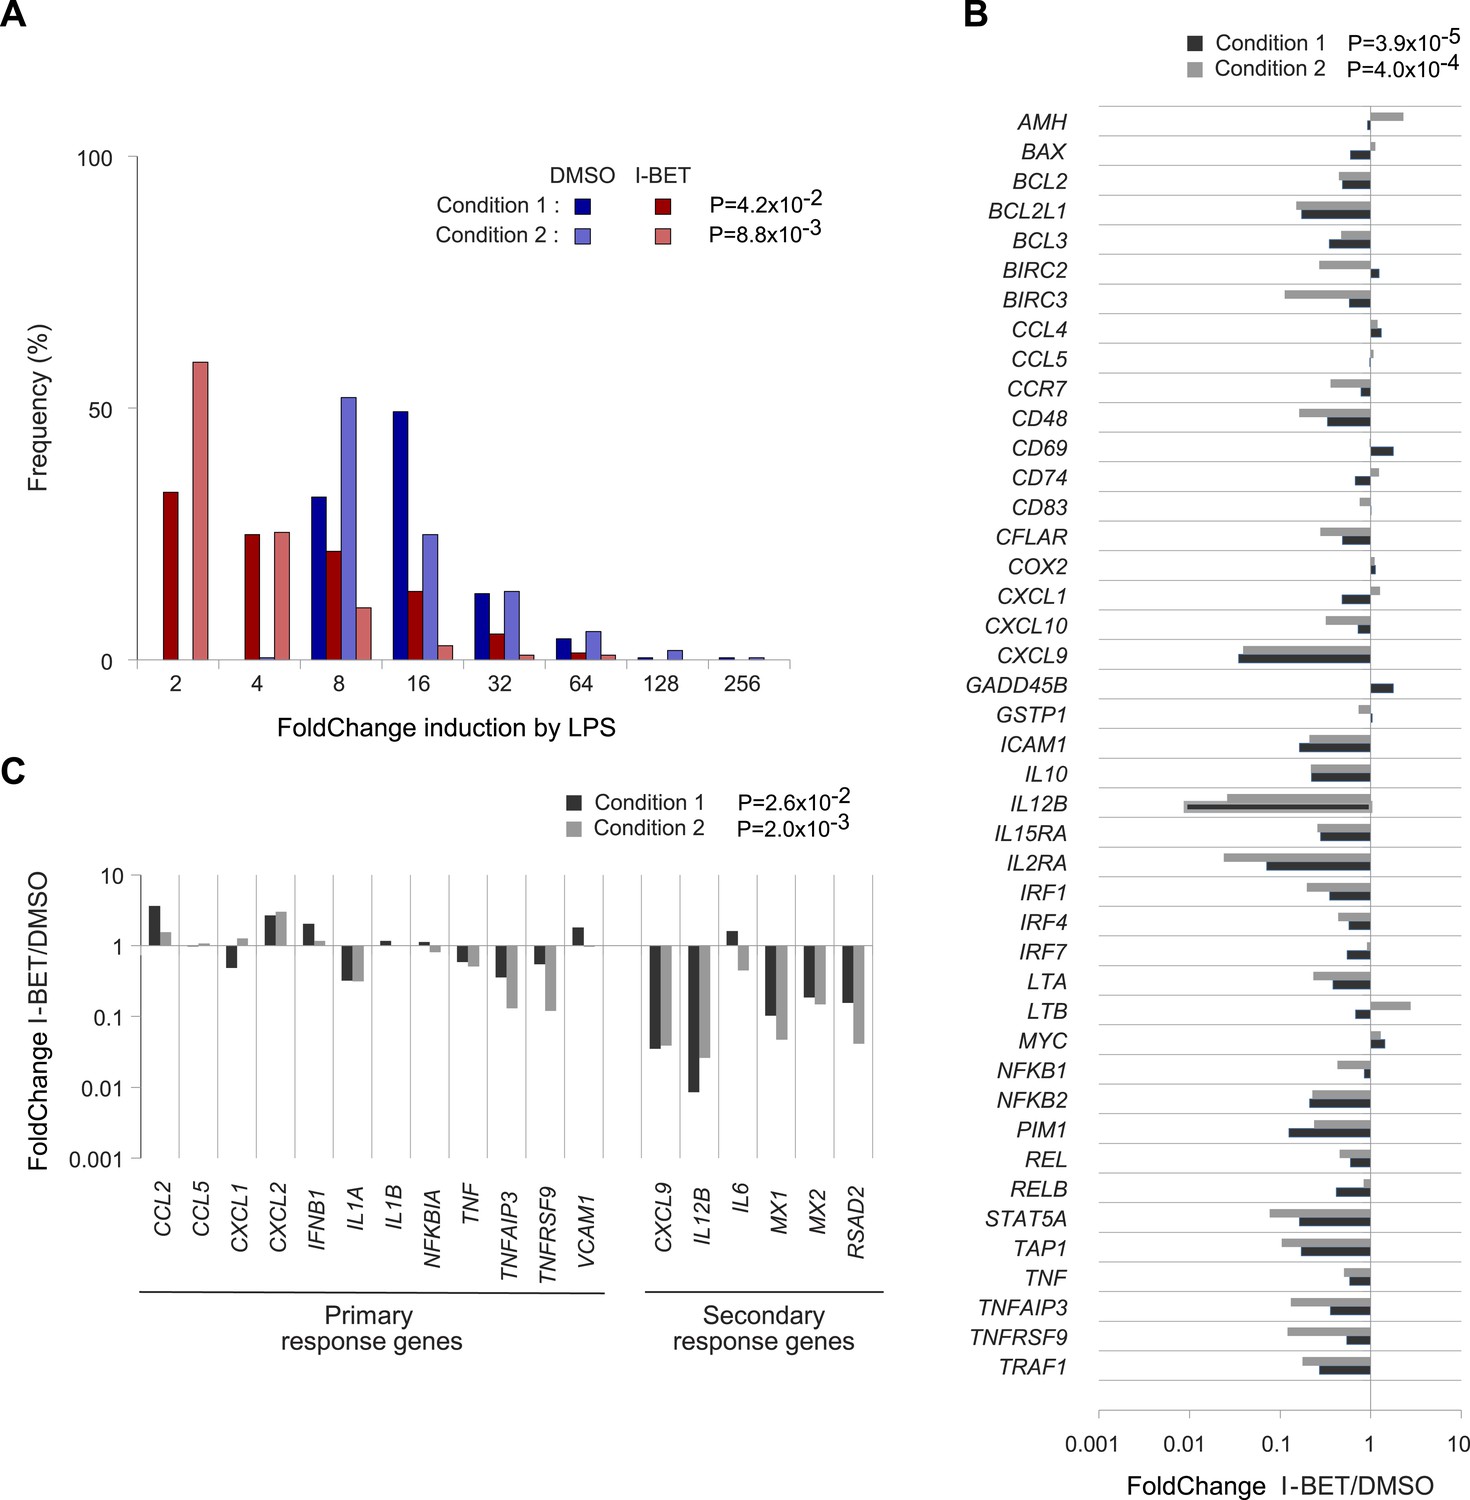
Effects of I-BET151 on human monocyte-derived MFs.
Cultures of human MFs were differentiated from peripheral-blood-derived CD14+ cells, pre-cultured for 30 min with I-BET151 (red bars) or just DMSO (blue bars), and stimulated for another 4 hr after the addition of LPS (100 ng/ml) or vehicle only. Microarray data from two conditions, as indicated and detailed in ‘Materials and methods’. (A) Distribution of FCs of I-BET151/DMSO for LPS-induced genes (according to the data on human monocyte-derived MFs treated with LPS or just vehicle). (B) FCs of I-BET151/DMSO of the human orthologues of the set of murine NF-κB-regulated genes illustrated in Figure 4A. (C) Effects of I-BET151 on primary and secondary LPS-response genes (defined as per [Hargreaves et al., 2009; Ramirez-Carrozzi et al., 2009]).
Figure 6 with 2 supplements
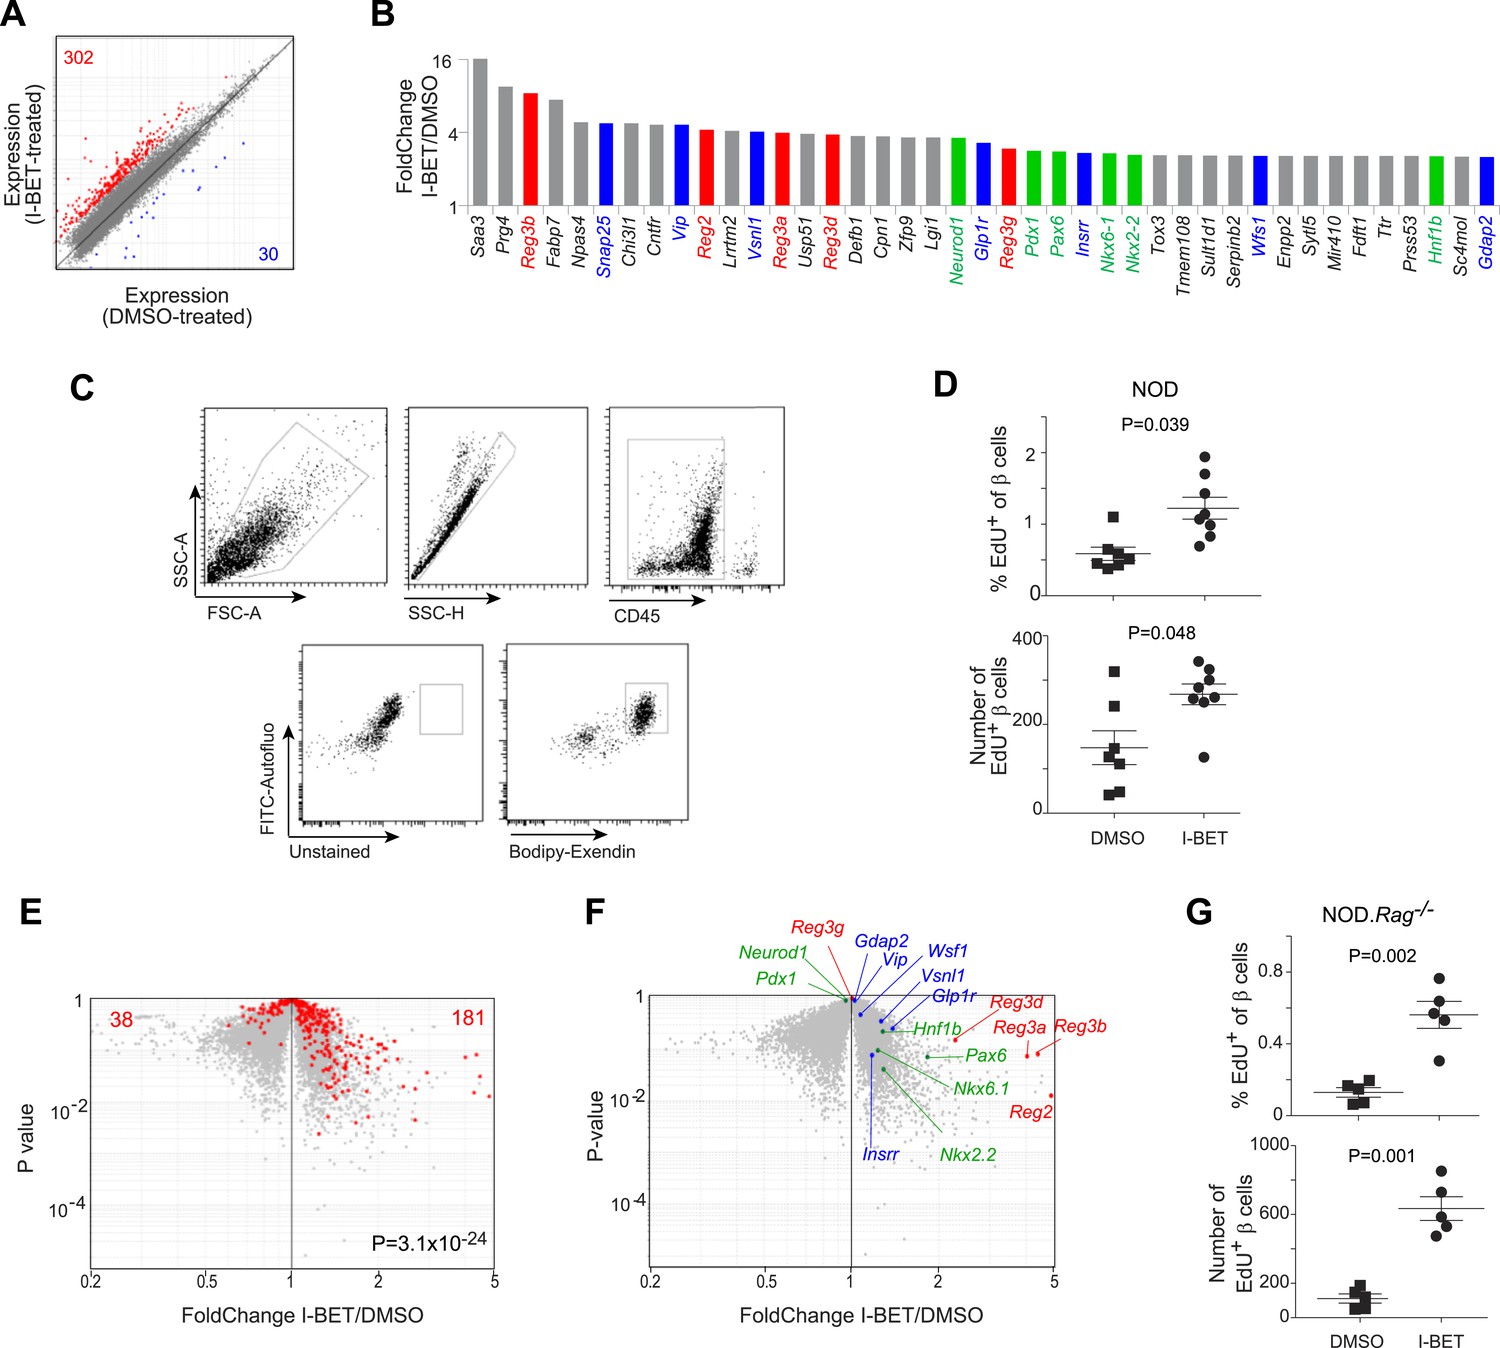
BET-protein inhibition promotes regeneration of islet β cells.
(A) Pancreatic β cells were cytofluorometrically sorted from mice treated with I-BET151 or DMSO as per Figure 1B, and microarray-based transcriptional profiling performed. Red: transcripts increased >twofold by I-BET151; blue, transcripts >twofold decreased. (B) NOD β-cell transcripts increased by I-BET151 ranked by FC vis-à-vis DMSO treatment. Red, regenerating islet-derived (Reg) transcripts; green, transcripts encoding transcription factors important for β-cell differentiation and function; blue, transcripts encoding proteins that enhance insulin production. (C, D, G) Cytofluorometric quantification of EdU+ β cells from NOD (D) or NOD.Rag−/− (G) mice treated with I-BET151 or DMSO as in Figure 1B and injected with EdU during the last 24 hr n = 5–8. Panel C shows the sorting strategy. (E) The set of red transcripts from panel A was superimposed on volcano plots comparing gene expression by β cells from NOD.Rag−/− mice treated as in Figure 1B with I-BET151 vs DMSO. (F) Relevant I-BET151-induced transcripts highlighted in panel B are situated on the volcano plot of panel E. (G) p values: *<0.05; **<0.01; *<0.001—from the Student's t test for panels D and G, and from the chi-squared test for panel E.
Figure 6—figure supplement 1
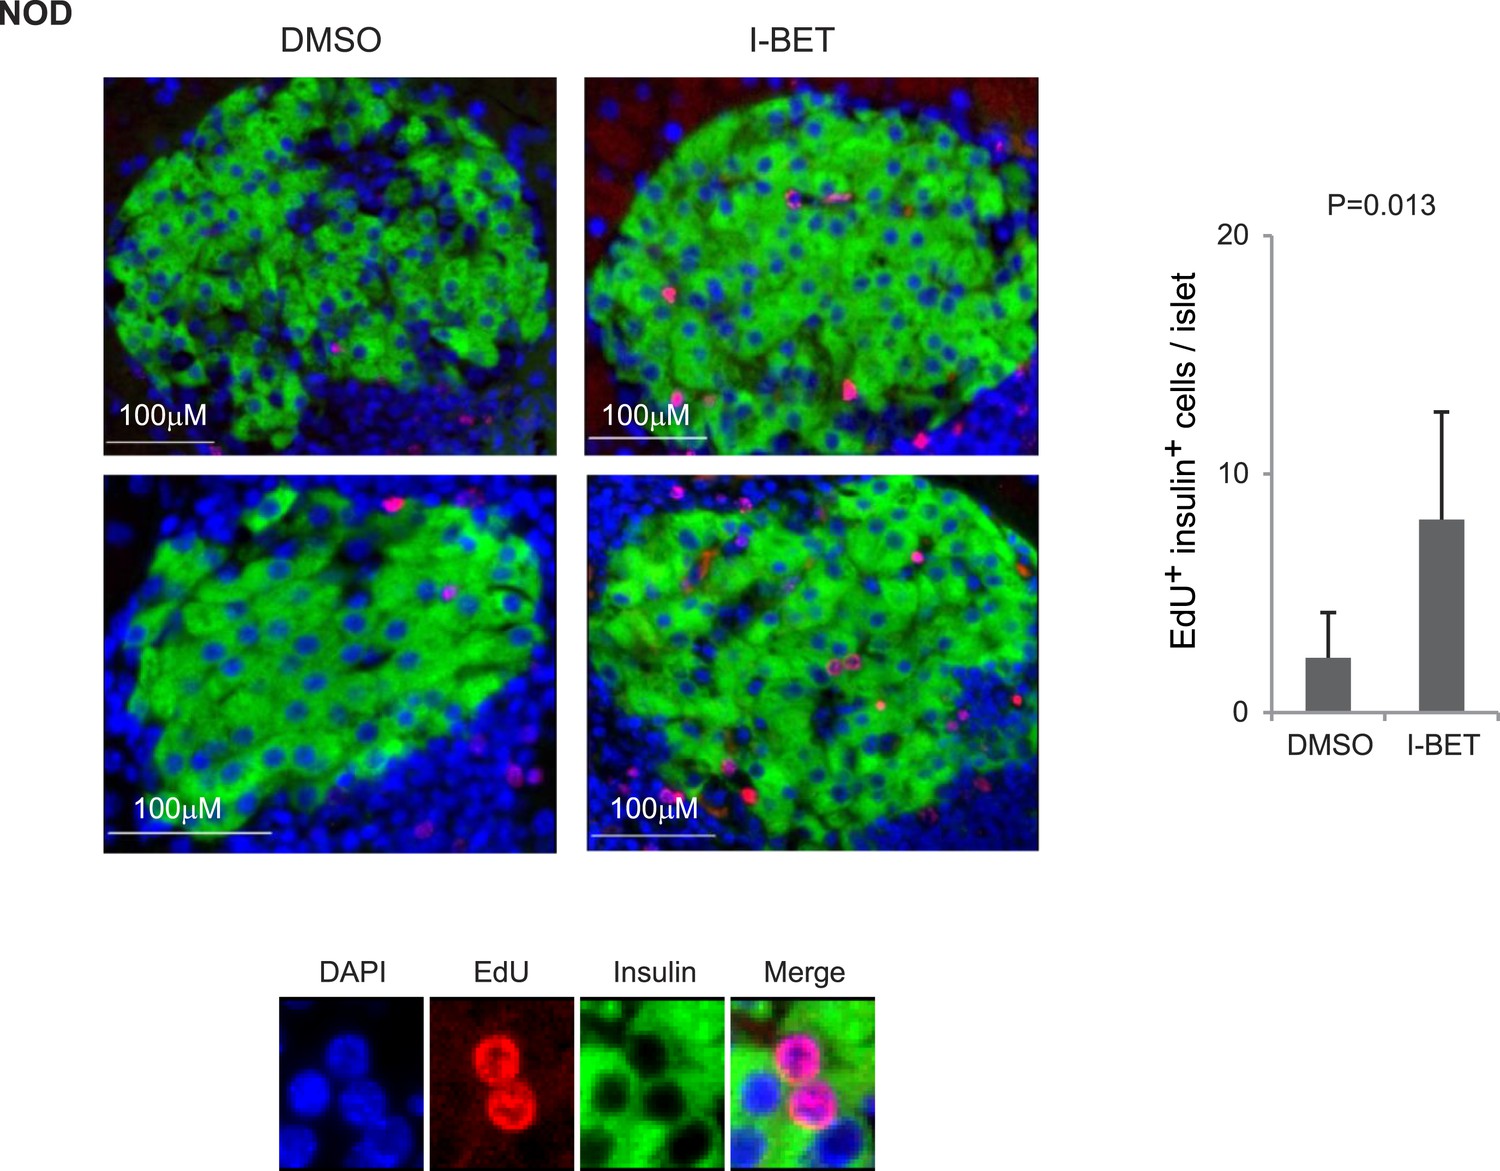
Histologic analysis of β-cell proliferation in response to I-BET151 in NOD mice.
NOD mice were treated with I-BET151 or DMSO as in Figure 1B. EdU was administrated during the last 24 hr. Frozen sections of pancreas were stained for insulin and EdU. Left, representative islet images; two for each condition; right, summary quantification. Small images in color are legends for insulin, EdU and DAPI, respectively. Red, EdU; green, insulin; blue, DAPI.
Figure 6—figure supplement 2

Histologic analysis of β-cell proliferation in response to I-BET151 in NOD.Rag−/− mice.
NOD.Rag−/− mice were treated with I-BET151 or DMSO as in Figure 1B. EdU was administrated during the last 24 hr. Frozen sections of pancreas were stained for insulin and EdU. Left, representative islet images, two for each condition; right, summary quantification.
Additional files
-
Supplementary file 1
Genes over-represented in pancreatic CD45+ cells of NOD mice treated with I-BET151.
- https://doi.org/10.7554/eLife.04631.011
-
Supplementary file 2
Genes under-represented in pancreatic CD45+ cells of NOD mice treated with I-BET151.
- https://doi.org/10.7554/eLife.04631.012
-
Supplementary file 3
Expression of NF-κB target genes in pancreatic CD45+ cells of NOD mice treated with I-BET151.
- https://doi.org/10.7554/eLife.04631.013
-
Supplementary file 4
Transcripts over-represented in β cells of NOD mice treated with I-BET151.
- https://doi.org/10.7554/eLife.04631.014
Download links
A two-part list of links to download the article, or parts of the article, in various formats.
Downloads (link to download the article as PDF)
Open citations (links to open the citations from this article in various online reference manager services)
Cite this article (links to download the citations from this article in formats compatible with various reference manager tools)
Epigenetic modulation of type-1 diabetes via a dual effect on pancreatic macrophages and β cells
eLife 3:e04631.
https://doi.org/10.7554/eLife.04631


