Transient inhibition of the ERK pathway prevents cerebellar developmental defects and improves long-term motor functions in murine models of neurofibromatosis type 1
- University of Michigan Medical School, United States
- Children's National Medical Center, United States
- Mott Children’s Hospital, University of Michigan, United States
- Rockefeller University, United States
- University of Cincinnati College of Medicine, United States
Figures
Figure 1 with 1 supplement
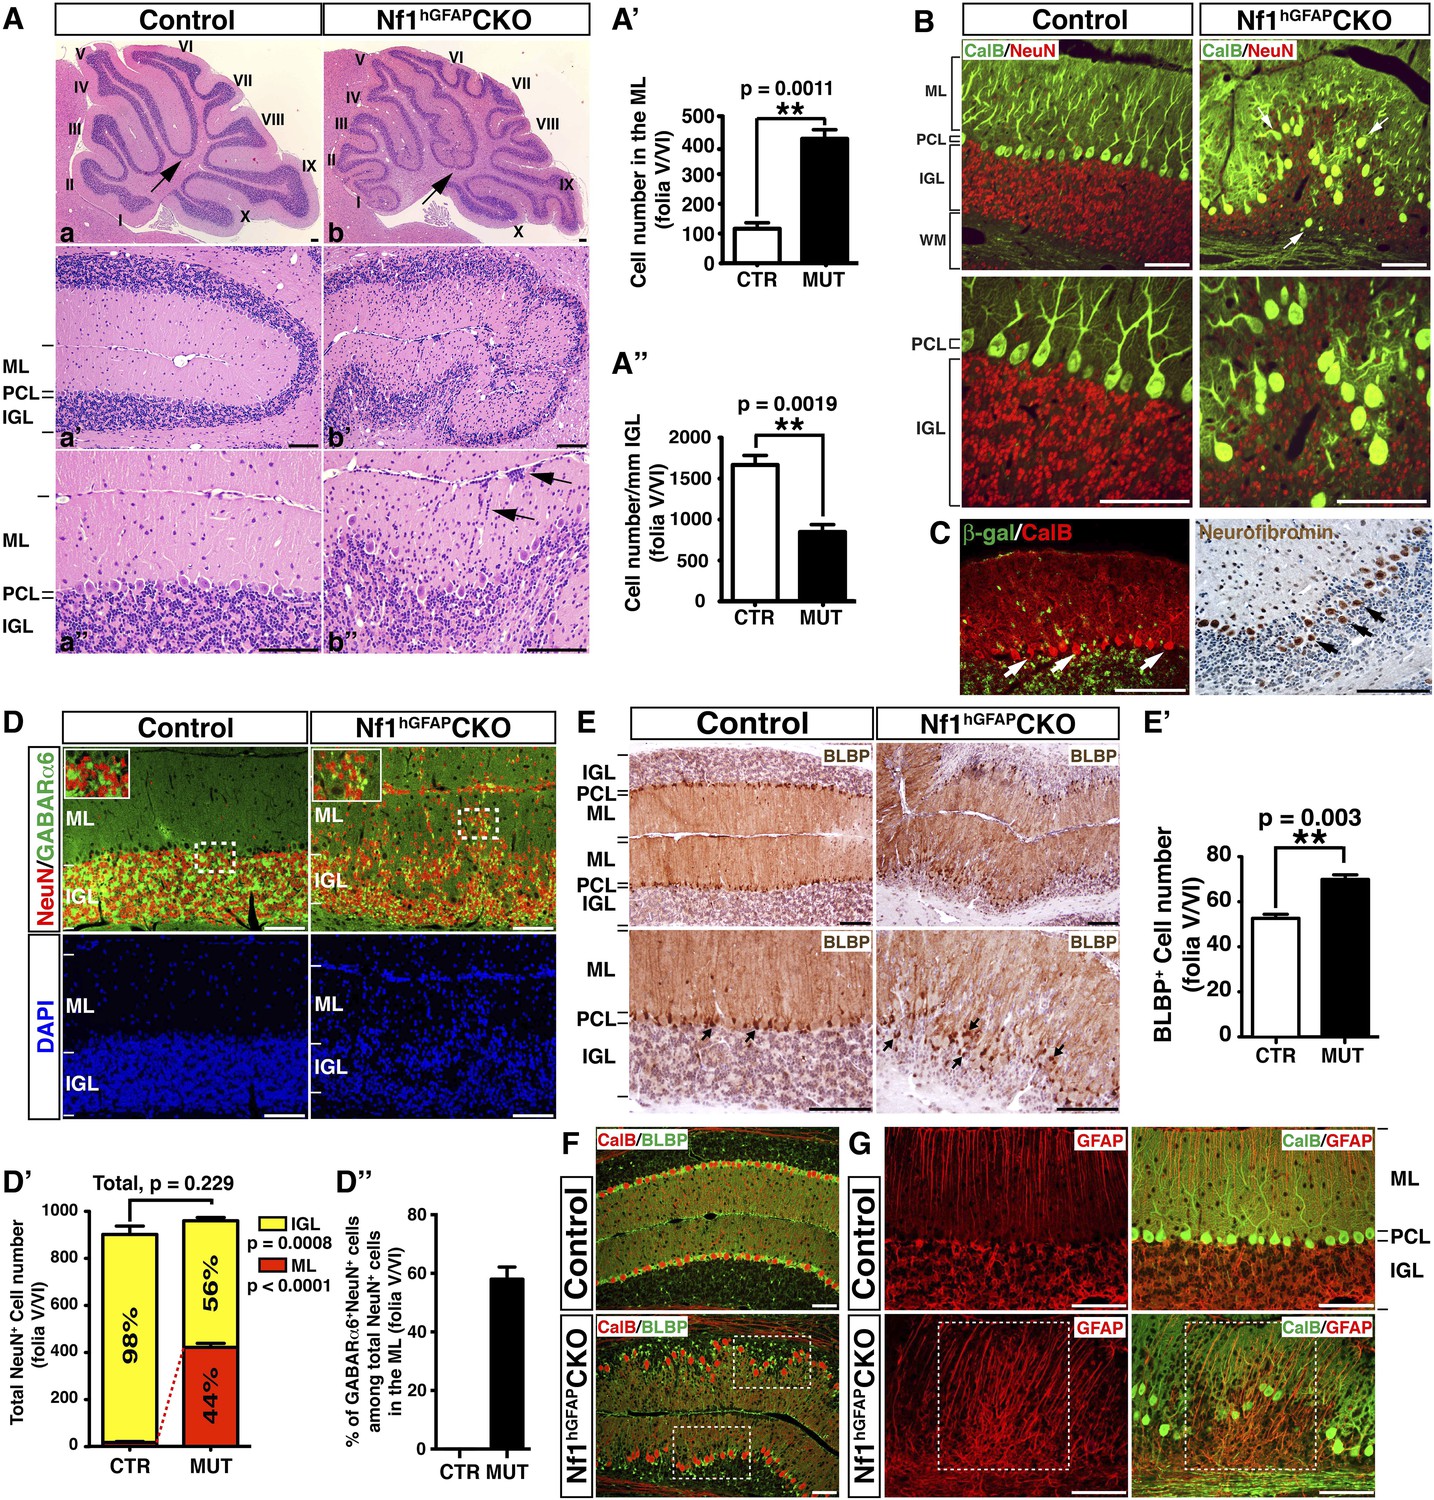
Nf1 inactivation during early cerebellar development disrupts neuronal lamination and causes BG abnormalities.
(A) Sagittal sections from control and Nf1hGFAPCKO cerebella at 2 months of age were stained with H&E and imaged at three increasing magnifications. Each cerebellar folium is numbered by Roman numerals. Arrows in (A, B) highlight folia V/VI where mutants exhibited extra foliation and arrows in (B′′) point to the cells clustered in the ML and on the pial surface of the Nf1hGFAPCKO cerebellum. The total number of cells in the ML and IGL were quantified in (A′) and (A′′). (B) Cerebellar sections were stained for Calbindin (CalB) /NeuN. Arrows point to mispositioned CalB+ Purkinje cells. (C) Sections from adult Nf1hGFAPCKO cerebellum were stained with β-gal/CalB and Nf1. Purkinje cells (arrows) were β-gal− and expressed Nf1. (D) Cerebellar sections were stained for NeuN and GABARα6. The insets are the high magnification images of the boxed areas highlighting the co-localizing cells. The number of NeuN+ cells in the ML and IGL were quantified in (D′) and the percentage of NeuN+ cells in the IGL among total NeuN+ cells (ML + IGL) is shown. The percentage of GABARα6+NeuN+/NeuN+ cells in the ML was quantified in (D′′). (E) The cell bodies (arrows) and processes of BG in control and mutant cerebella were labeled by BLBP staining. The total number of BLBP+ BG cells was quantified in (E′). (F) Sections were stained for CalB/BLBP. Boxed areas compare the Purkinje cell alignment in the less affected areas (lower box) and severely affected areas (upper box) in the Nf1hGFAPCKO cerebellum. Note the correlation between increased number/misalignment of BG and the severity of the disruption of Purkinje cell layer. (G) Sections were stained for CalB/GFAP. Boxed areas highlight the severely disrupted BG alignment and Purkinje cell patterning. All the quantification data are presented as mean ± SEM. DAPI labels the nuclei. Scale bars: 50 μm.
Figure 1—figure supplement 1

Purkinje cell defects in the Nf1hGFAPCKO cerebellum are non-cell-autonomous.
(A) The developmental lineages of the major cerebellar cell types are illustrated. Cell types expressing distinct Cre recombinases (hGFAP, L7, Math1) are highlighted by red dashed boxes. Of note, these Cre drivers except for L7-cre also target cells in the other regions of the brain. (A′) The laminar structure, the alignment and marker expression of Bergmann glia, Purkinje cells and granule cells in adult cerebellum are illustrated. (Ba-d) X-gal staining was performed on cerebellar sections from P0.5 (A, B) and P60 (C, D) double-transgenic hGFAP-cre+; R26LacZR mice to determine the pattern of Cre-mediated recombination. Arrows point to Purkinje cells, which were not stained. Inset in (D) shows a positive control for the X-gal staining in the Purkinje cells that were targeted by Synapsin I-cre (Zhu et al., 2001). PCZ, Purkinje cell zone; PCL, Purkinje cell layer. EGL, external granule cell layer (B′) DNA extracts of the whole cerebellum and tail from hGFAP-cre+;Nf1flox/+ mice were analyzed by PCR analysis, which distinguishes Nf1 wildtype (+), flox (x1) and deleted (Δ) alleles. Note that in the cerebellum the flox allele was completely recombined and became deleted allele. (C) Adult Nf1hGFAPCKO mice exhibited a unique ‘handstand’ behavior. (D–F) Cerebellar sections from adult control and Purkinje-cell-specific Nf1L7CKO mice were analyzed. (D) The specificity of L7-cre-mediated recombination in Purkinje cells was confirmed by CalB and β-gal staining. (E, F) CalB+ Purkinje cells, BLBP+ BG cells and NeuN+ granule cells were compared between control and Nf1L7CKO cerebella and no difference was identified. DAPI labels the nuclei. Scale bars: 50 μm.
Figure 2 with 1 supplement
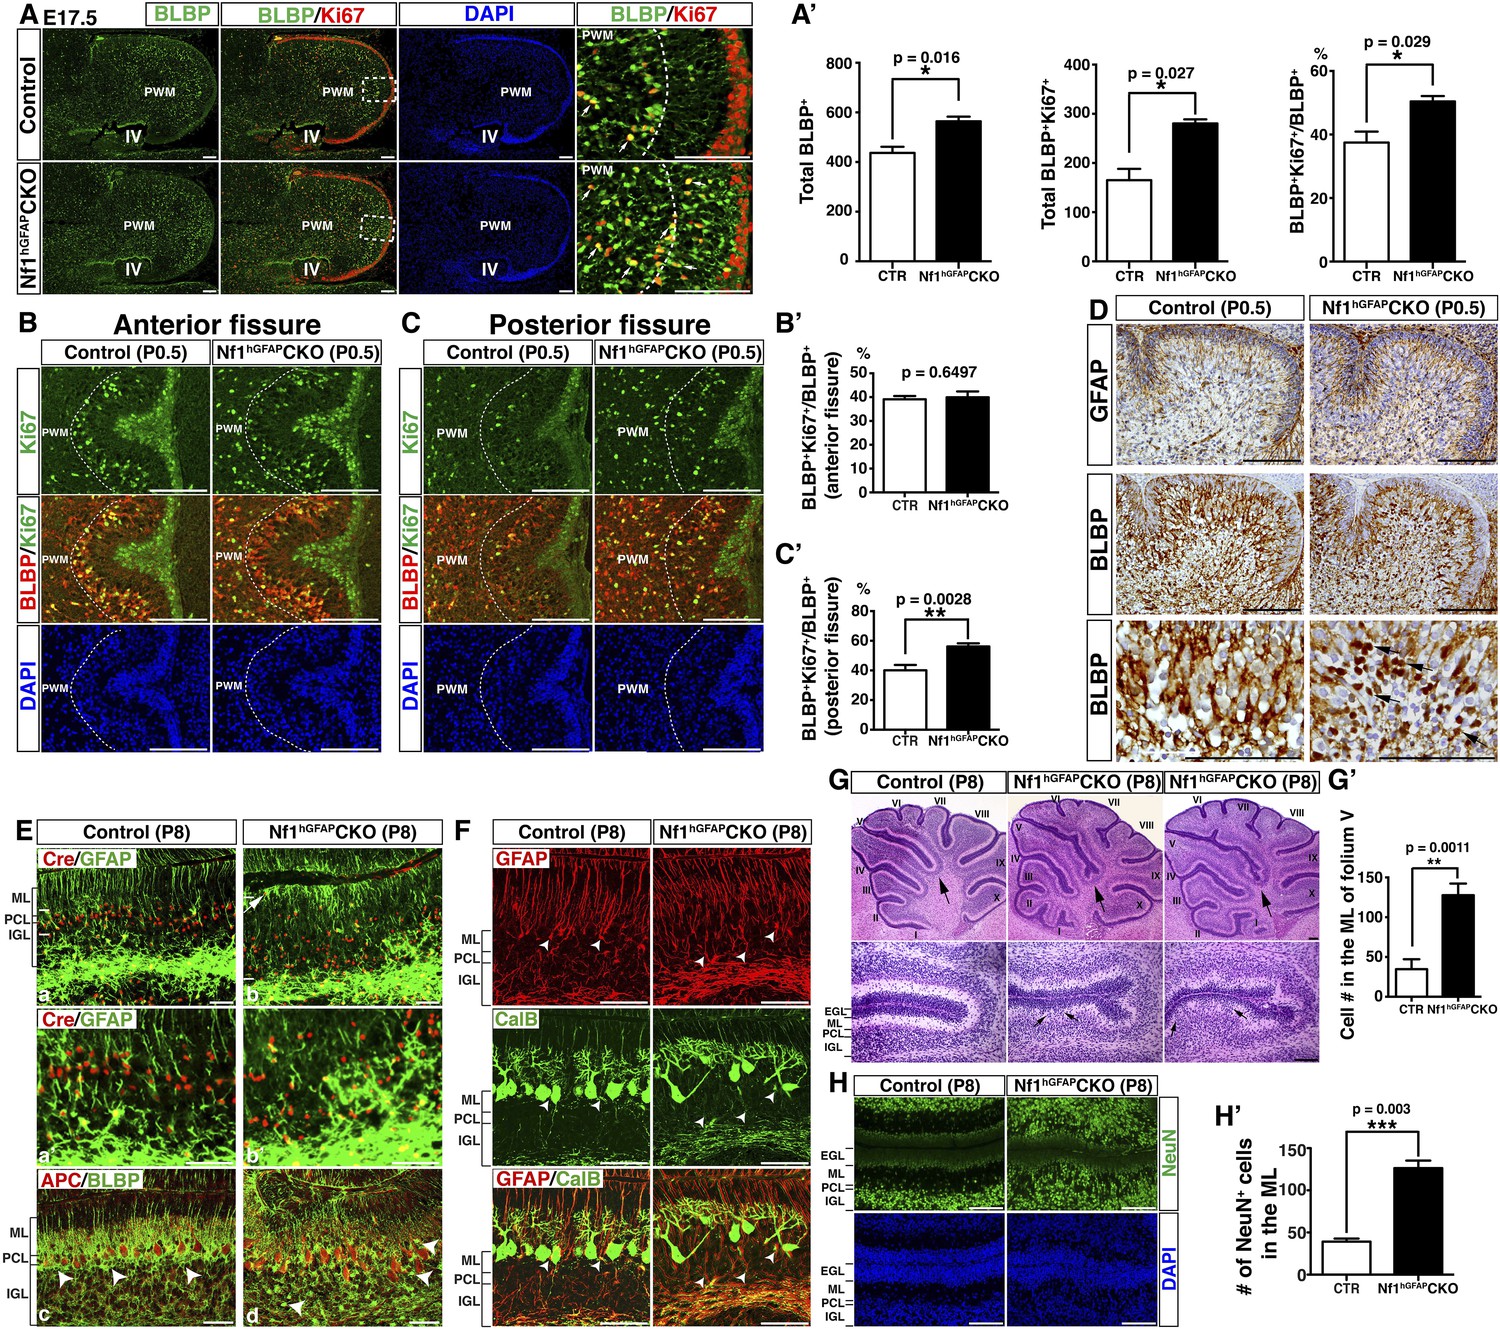
Nf1 inactivation leads to increased proliferation of intermediate glial precursors and subsequent glial/neuronal defects during perinatal development.
(A) Sections of control and Nf1hGFAPCKO cerebella were stained for BLBP and Ki67. Boxed areas in (A) are shown in high magnification on the right. Dashed lines delineate the boundary between the prospective white matter (PWM) and cerebellar cortex. IV, fourth ventricle. The number and mitotic index of BLBP+ cells were quantified in (A′). (B, C) Cerebellar sections were stained for BLBP/Ki67 and imaged at anterior fissure (B) and posterior fissure (C). Dashed lines delineate the boundary of the PWM. The mitotic index of BLBP+ cells in respective fissures was quantified in (B′) and (C′). (D) Sections were stained for GFAP and BLBP. BLBP in the mutant cerebellum exhibit strong nuclear staining (arrows). (E) Sections were stained for Cre/GFAP (A–B′) and APC/BLBP (C, D). White bars mark the rudimentary PC/BGL in the control and the Nf1hGFAPCKO cerebellum. The arrow points to an abnormal BG cell located close to the EGL in the mutant cerebellum. (C, D) Arrowheads point to BG cell bodies. (F) Sections were stained for CalB/GFAP. Arrowheads point to BG cell bodies. (G) Sections were stained by H&E. Lower panels are the high magnification view of folia V/VI. Arrows point to folia V/VI (upper panels) where the mutants exhibit the extra foliation. In lower panels, arrows point to the cell clusters in the mutant ML. The total cell number in the ML was quantified in (G′). (H) Sections were stained for NeuN. The total number of NeuN+ cells in the ML was quantified in (H′). All the quantification data are presented as mean ± SEM. DAPI labels the nuclei. Scale bars: 50 μm.
Figure 2—figure supplement 1
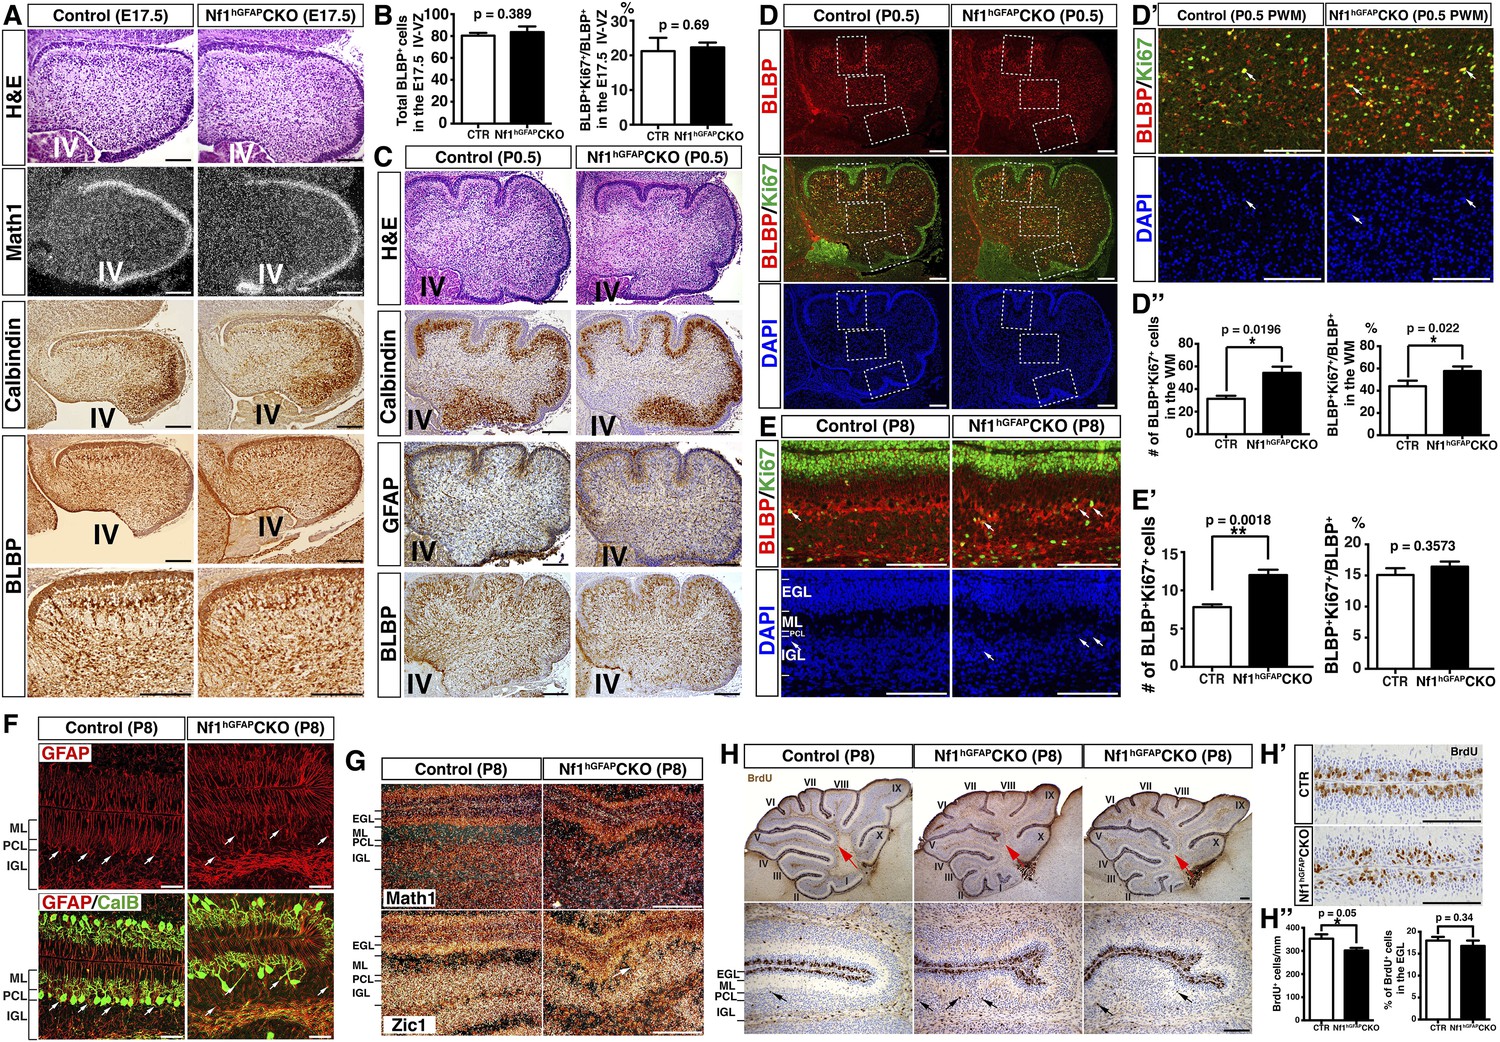
Nf1 regulates cerebellar astrocyte proliferation during an immediate precursor stage.
(A) Cerebellar sections from E17.5 control and Nf1hGFAPCKO cerebella were stained for H&E, Math1 (in situ hybridization), CalB and BLBP (immunohistochemistry). (B) The total number and mitotic index of BLBP+ cells in the IV-VZ (shown in Figure 2A) were quantified. (C–D′′) Cerebellar sections from P0.5 control and Nf1hGFAPCKO cerebella were stained for H&E, Calbindin, GFAP, BLBP and BLBP/Ki67 and imaged at low magnification. Dashed boxes in (D) represent the anterior fissure, PWM and posterior fissure, which were compared at high magnification in (D′) and Figure 2B,C. The total number and mitotic index of BLBP+ cells was quantified in (D′′). (E–H′′) Control and Nf1hGFAPCKO cerebella were analyzed at P8. (E) Sections were stained for BLBP and Ki67. Arrows point to representative co-localizing cells. The total number and mitotic index of BLBP+ cells were quantified in (E′). (F) Sections were stained for GFAP and CalB. Arrows point to Bergmann glial nuclei. (G) Sections were stained for Math1 and Zic1 by in situ hybridization. Zic1 is a marker for the granule neuron lineage in the postnatal cerebellum. (H) Control and Nf1hGFAPCKO mice were analyzed 2h after BrdU pulse at P8. Sections were stained for BrdU. Lower panels are the high magnification view of folia V and VI. Red arrows (upper panels) point to folia V/VI where the mutants exhibit the extra foliation. In lower panels, arrows point to the proliferating cells in the BG layer. (H′) High magnification view of BrdU staining in the EGL shows the focal reduction of BrdU+ cells in the mutants. The total number and percentage of BrdU+ cell number in the EGL were quantified in (H′′). All the quantification data are presented as mean ± SEM. DAPI labels the nuclei. Scale bars: 50 μm.
Figure 3 with 1 supplement
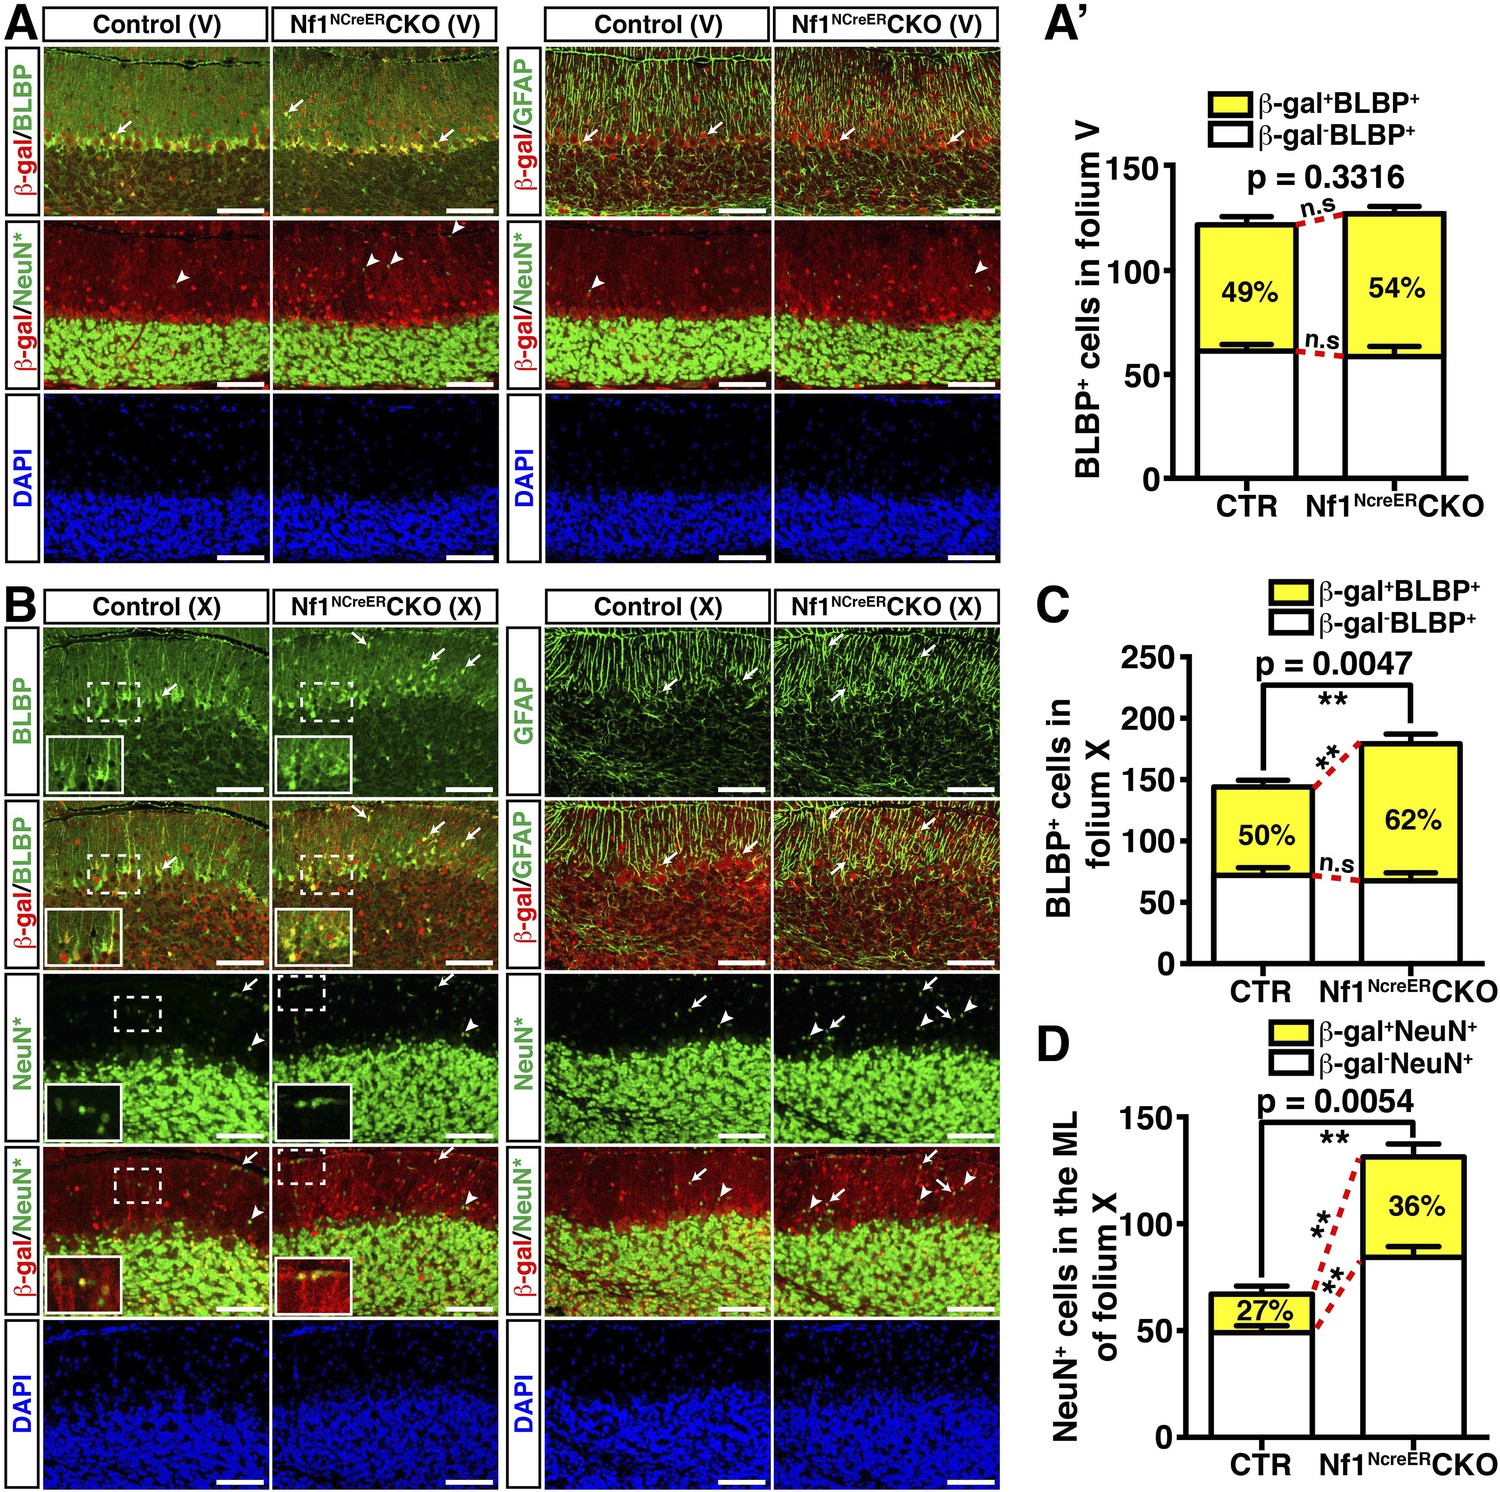
Nf1 is not required for BG function in late developmental stages.
Control and Nf1NcreERCKO mice were tamoxifen (TM)-induced at E17.5 and analyzed at P21. Adjacent sections were triple-stained for BLBP/β-gal/NeuN or GFAP/β-gal/NeuN staining, and were imaged at folium V (A) and folium X (B). NeuN staining (*, Alexa 647) was artificially converted to green. The insets in (B) highlight BLBP+β-gal+ cells and NeuN+β-gal+ cells in the boxed areas. The number of BLBP+ cells (A′, C) and NeuN+ cells (D) was quantified and their co-localization with β-gal was compared. Note that in folia V, none of the NeuN+ cells co-localized with β-gal. Arrows point to representative co-localizing cells, and arrowheads label non-co-localizing cells. All the quantification data are presented as mean ± SEM. DAPI labels the nuclei. Scale bars: 50 μm.
Figure 3—figure supplement 1

Inactivation of Nf1 in Nestin-expressing progenitor cells at E17.5 induces overproduction of glia cells in the posterior cerebellar folia.
(A) Control and Nf1NcreERCKO mice were tamoxifen (TM)-induced at E17.5 and analyzed at P21 (see Materials and Methods). (B) X-gal staining shows the distribution of recombined cells in the TM-induced control and mutant cerebella. (C) The E17.5 TM-induced control and Nf1NcreERCKO cerebella were triple-labeled by BLBP, β-gal and NeuN. In Nf1NcreERCKO cerebellum, white colored Roman numerals (I–V) represent folia that exhibited minimal phenotype, yellow ones exhibited mild phenotype (VI–IX) and the red one (X) had the most severe defects. (C′) High magnification images at folia VIII/IX are shown on the right. (D, E) Low magnification images of GFAP/β-gal/NeuN staining are shown to compare the overall glial/neuronal phenotypes in folium V (D) and folium X (E), respectively. Red arrows point to the white matter of folium X. White arrows point to representative co-localizing cells, and arrowheads label non-co-localizing cells. (D′) The number of NeuN+ cells in the ML of folium V was quantified. DAPI labels the nuclei. Scale bars: 50 μm.
Figure 4 with 1 supplement
Neuron-specific Nf1 inactivation leads to cell-autonomous defects in the glutamatergic interneuron lineages.
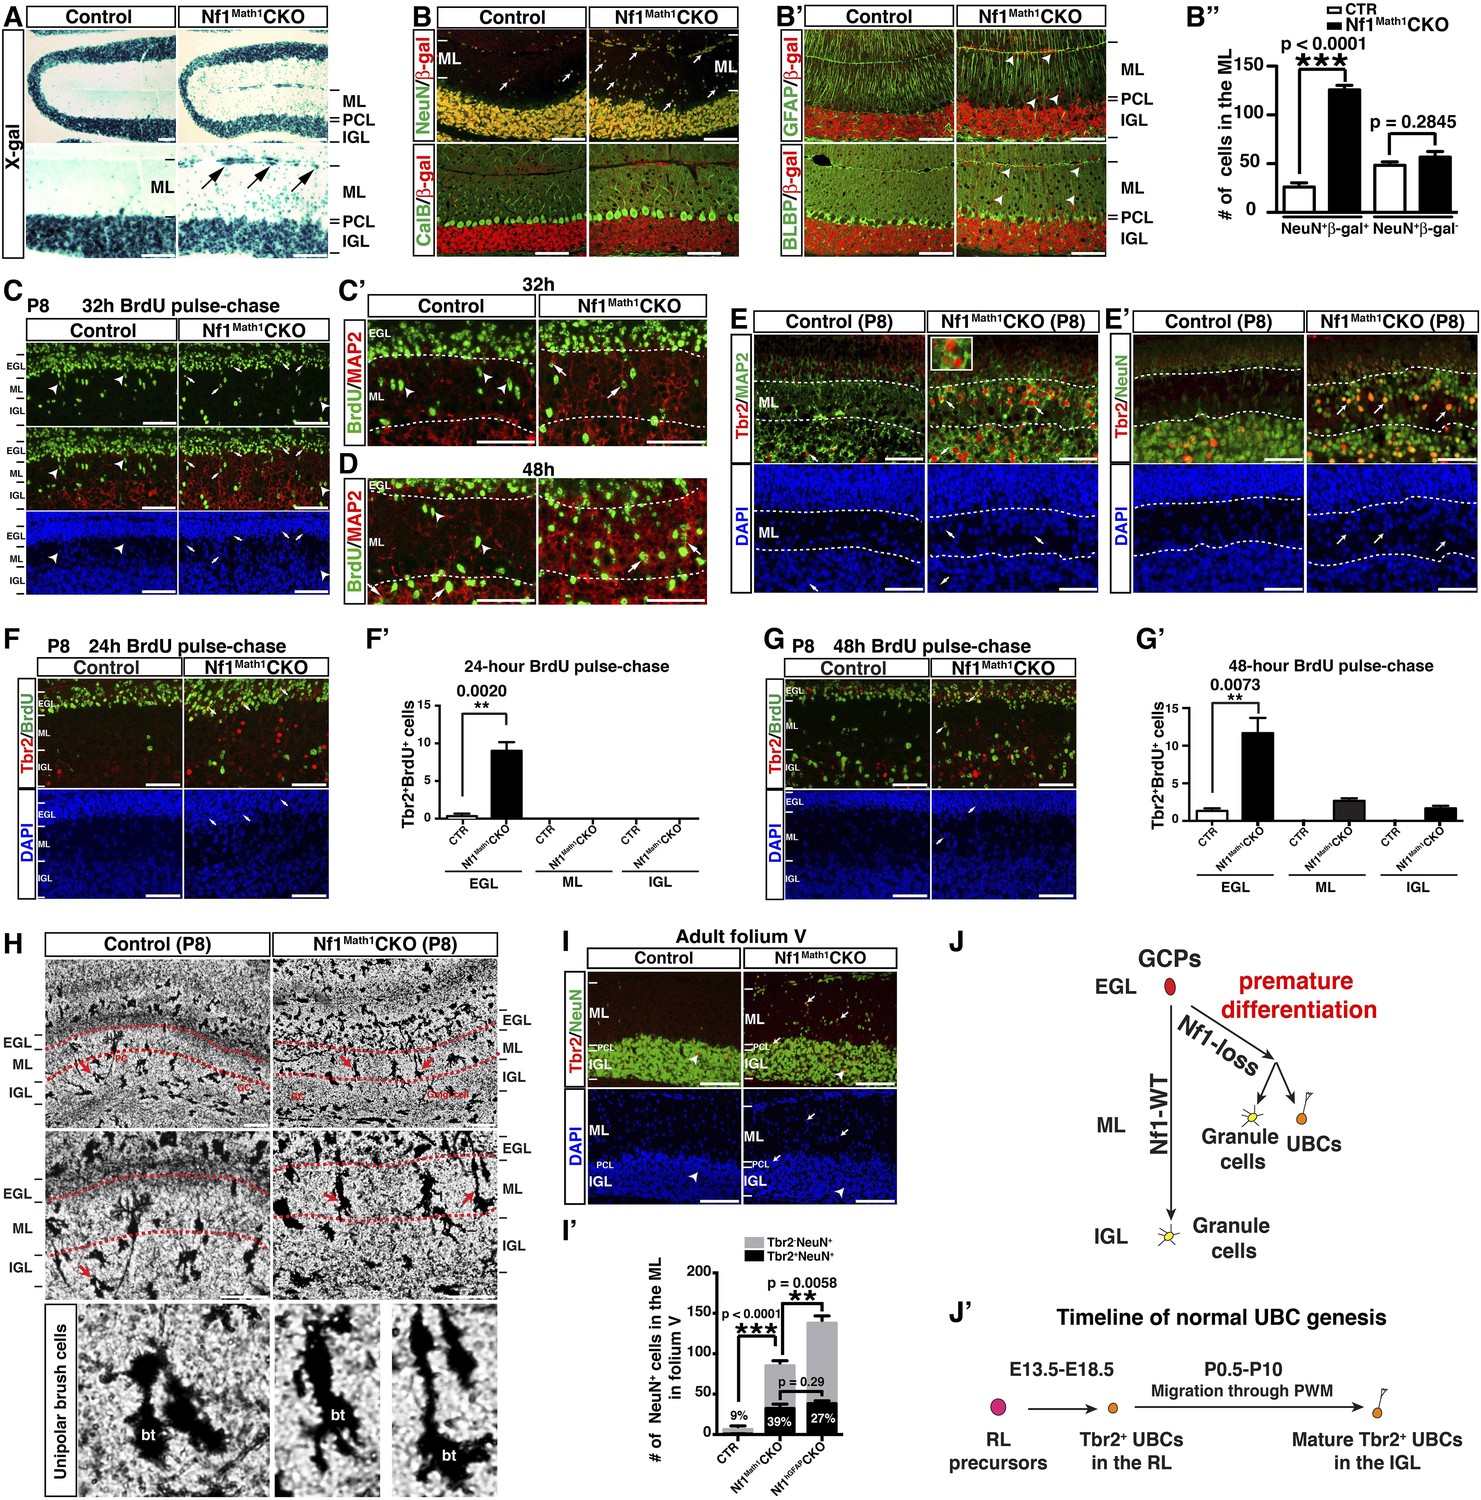
(A) X-gal staining on P21 control and Nf1Math1CKO cerebella labeled cells that underwent Math1-cre-mediated recombination. Arrows point to the abnormally accumulated cells in the ML of the mutant cerebellum. (B, B′) Cerebellar sections were stained for NeuN/β-gal and Cal/β-gal, and GFAP/β-gal and BLBP/β-gal. The total number of NeuN+/β-gal+ and NeuN+/β-gal− cell per high magnification field was quantified in (B′′). (C–D) Control and Nf1Math1CKO mice were analyzed 32 hr and 48 hr after BrdU-pulse at P8. Cerebellar sections were stained for BrdU/MAP2 and imaged at folium V. High magnification images comparing the nuclear morphology of BrdU+ cells are shown in (C′) and (D′). (E, E′) Cerebella sections from P8 control and Nf1Math1CKO mice were stained for Tbr2/MAP2 (E) and Tbr2/NeuN (E′) and imaged at folium V. The inset in (E) shows an example of Tbr2+MAP2+ cells in the mutant ML. (F, G) 24 hr and 48 hr after BrdU-pulse, cerebellar sections from P8 control and Nf1Math1CKO mice were stained for Tbr2/BrdU. The distribution of Tbr2+BrdU+ cells (arrows) in the EGL-ML-IGL was quantified 24 hr and 48 hr after BrdU-pulse in (F′) and (G′), respectively. (H) Golgi staining was performed on P8 cerebellar sections. Cells with UBC morphology are highlighted by red arrows and shown in high magnification (lower panels). Dashed red lines delineate the ML. PC, Purkinje cell; GC, granule cell; bt, the brush tip of UBCs. (I) Cerebellar sections from adult control and Nf1Math1CKO cerebella were stained for Tbr2/NeuN and imaged at folium V. (I′) The number of Tbr2+NeuN+ (arrows) and Tbr2+NeuN− cells (arrowheads) in the ML of folium V per high magnification image was quantified and compared with Nf1hGFAPCKO mice. The percentage of Tbr2+NeuN+ cells among total NeuN+ cells was also quantified. (J) A proposed model summarizes the role of Nf1 in preventing the ectopic differentiation of GCPs into UBCs. As a comparison, the timeline of normal UBC genesis is shown in (J′). All the quantification data are presented as mean ± SEM. DAPI labels the nuclei. Scale bars: 50 μm.
Figure 4—figure supplement 1
Neuron-specific Nf1 inactivation does not impact on the proliferation or migration of GCPs.
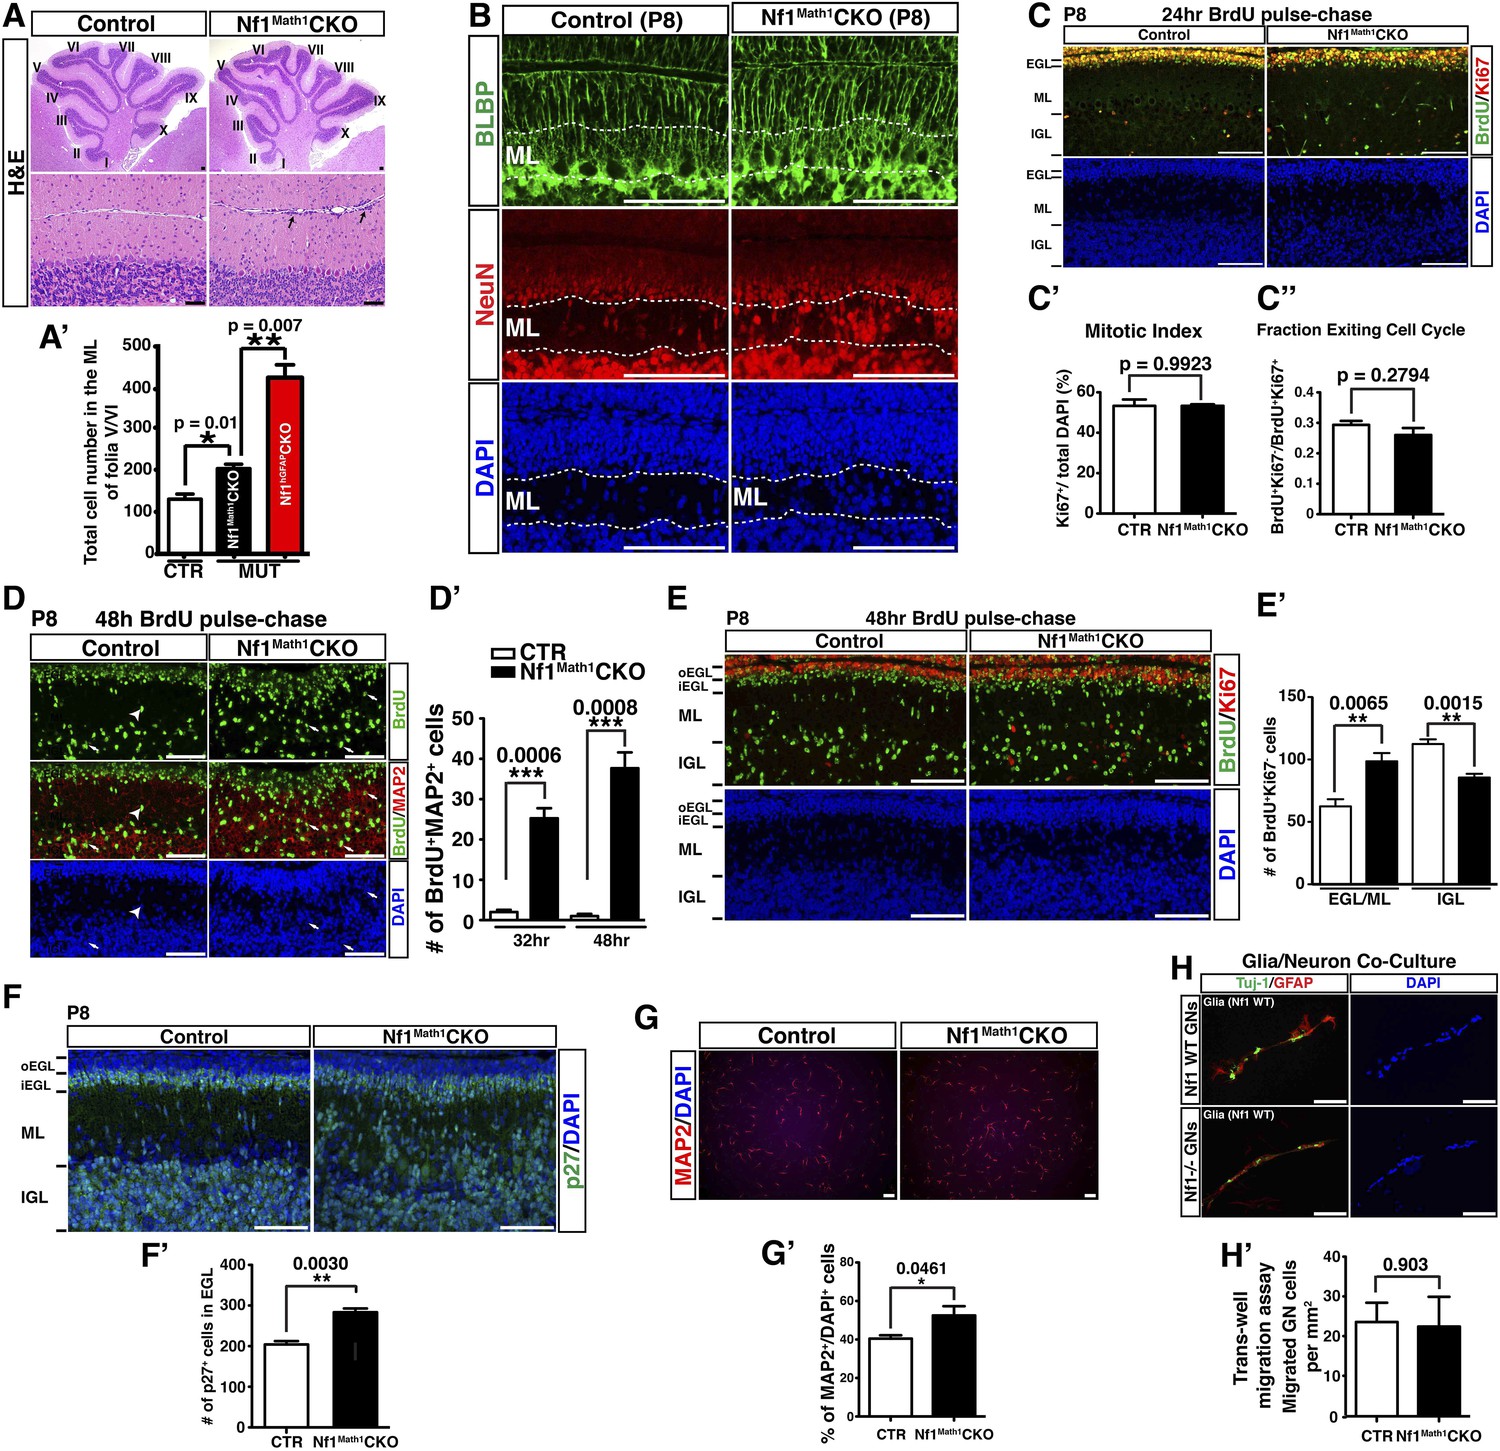
(A) Cerebellar sections from adult control and Nf1Math1CKO cerebella were stained by H&E. Lower panels are the high magnification view of folia V/VI in upper panels. (A′) The total number of cells in the ML of folia V/VI was quantified and compared with Nf1hGFAPCKO mice. (B) P8 cerebellar sections were stained for BLBP/NeuN and imaged at folium V. Dashed lines delineate the ML. (C) Sections of P8 control and Nf1Math1CKO cerebella were analyzed and stained for BrdU/Ki67 24 hr after BrdU pulse. (C′) The mitotic index of EGL precursors was quantified as the percentage of Ki67+ cells of total DAPI+ cells in the EGL. (C′′) The cell cycle exit index (fraction of cells exiting cell cycle) was quantified as the ratio of BrdU+/Ki67− cells (cells exiting cell cycle) to BrdU+/Ki67+ cells (cells remaining or reentering cell cycle) in the EGL. (D–E) P8 control and Nf1Math1CKO mice were analyzed 48 hr after BrdU pulse. (D) Cerebellar sections were stained for BrdU/MAP2. The number of MAP2+BrdU+ cell in the ML was quantified in (D′). (E) Sections were stained for BrdU/Ki67. The number of BrdU+/Ki67− cells (newly differentiated cells) in the inner EGL/ML and IGL was quantified in (E′). oEGL, outer EGL; iEGL, inner EGL. (F) Cerebellar sections from P8 control and Nf1Math1CKO mice were stained for p27 and the number of p27+ cells in the inner EGL was quantified in (F′). (G) GCPs were isolated from control and Nf1Math1CKO cerebella at P8 and cultured in differentiation media for 2 days. Cells were then stained for MAP2 and quantified for the percentage of cells expressing MAP2 among total DAPI+ cells (G′). (H) Purified P6 granule cells from control and Nf1Math1CKO cerebella were cultured with wildtype cerebellar glia at a ratio of 1:2. Cells were then stained for Tuj1 and GFAP or subjected to Transwell migration assay. The number of granule cells that migrated through the membrane was quantified, normalized by the membrane area (per mm2) and compared (H′). All the quantification data are presented as mean ± SEM. DAPI labels the nuclei. Scale bars: 50 μm.
Figure 5 with 2 supplements
Glia-independent and -dependent UBC abnormalities in the Nf1hGFAPCKO cerebellum.
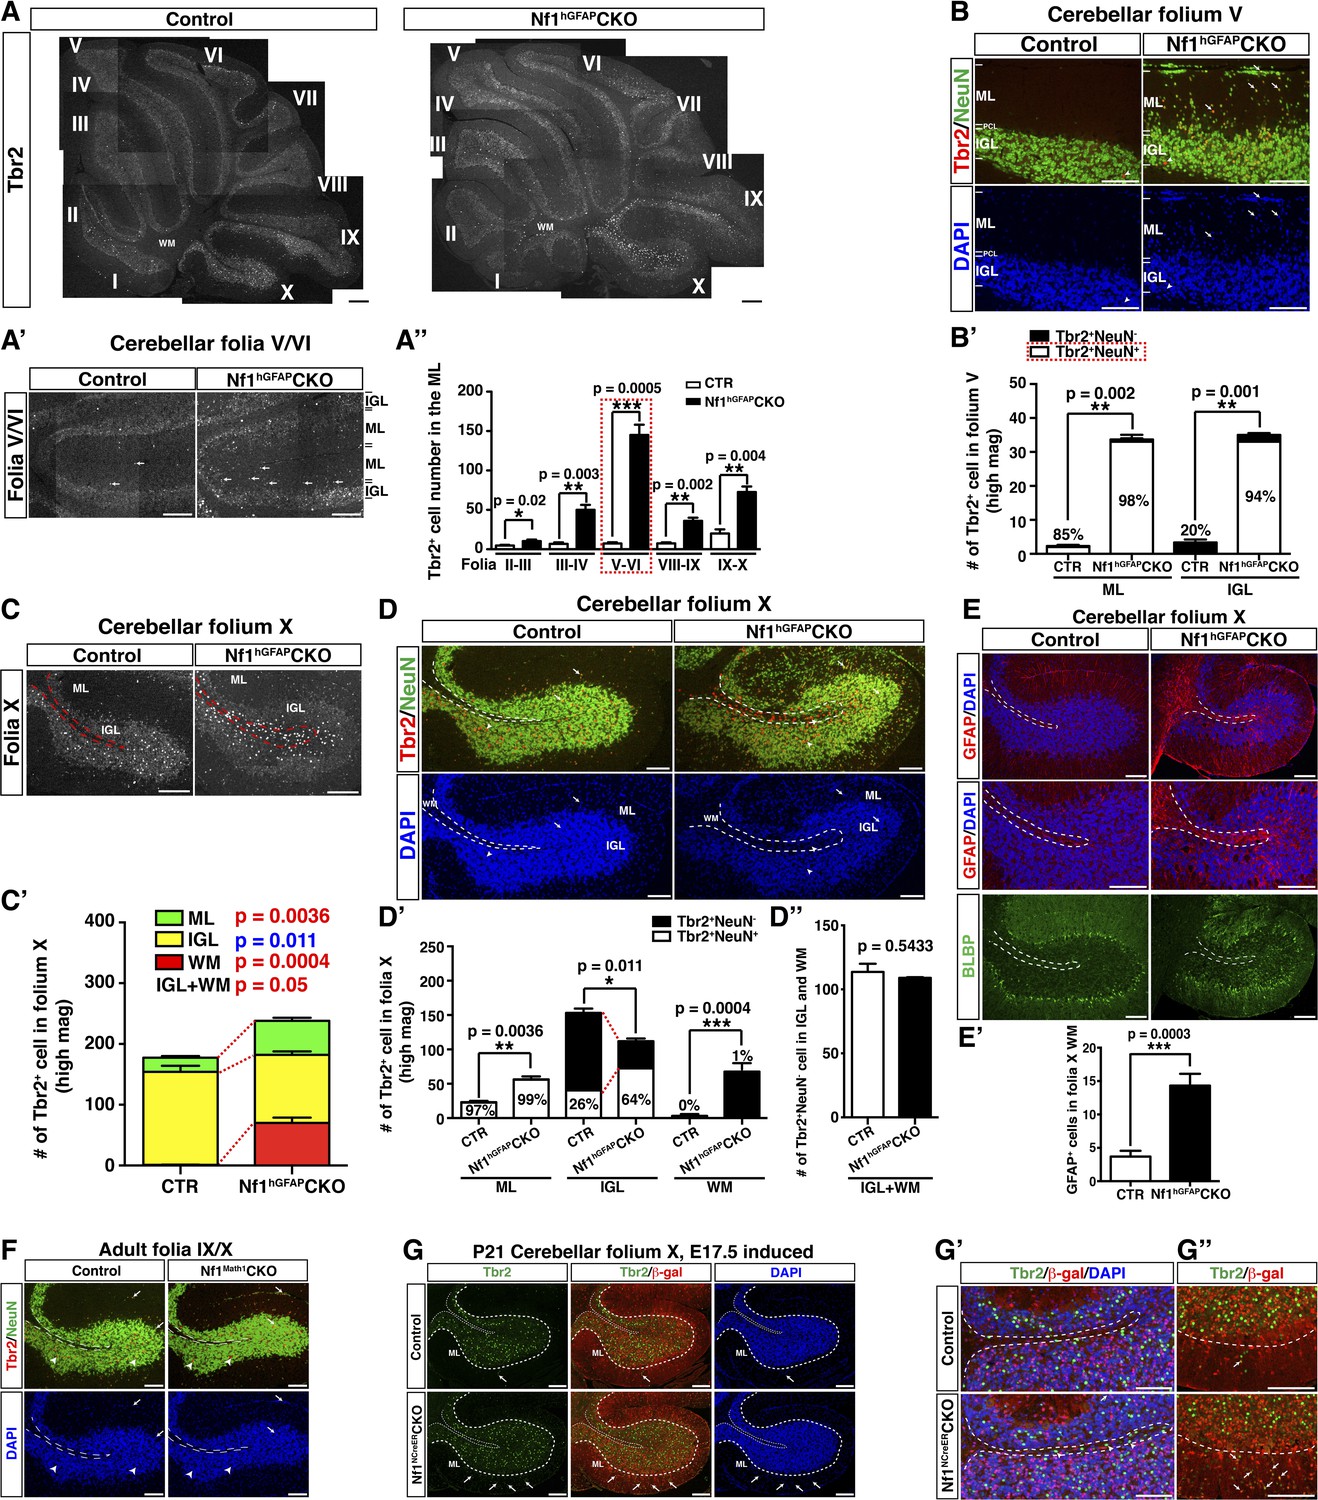
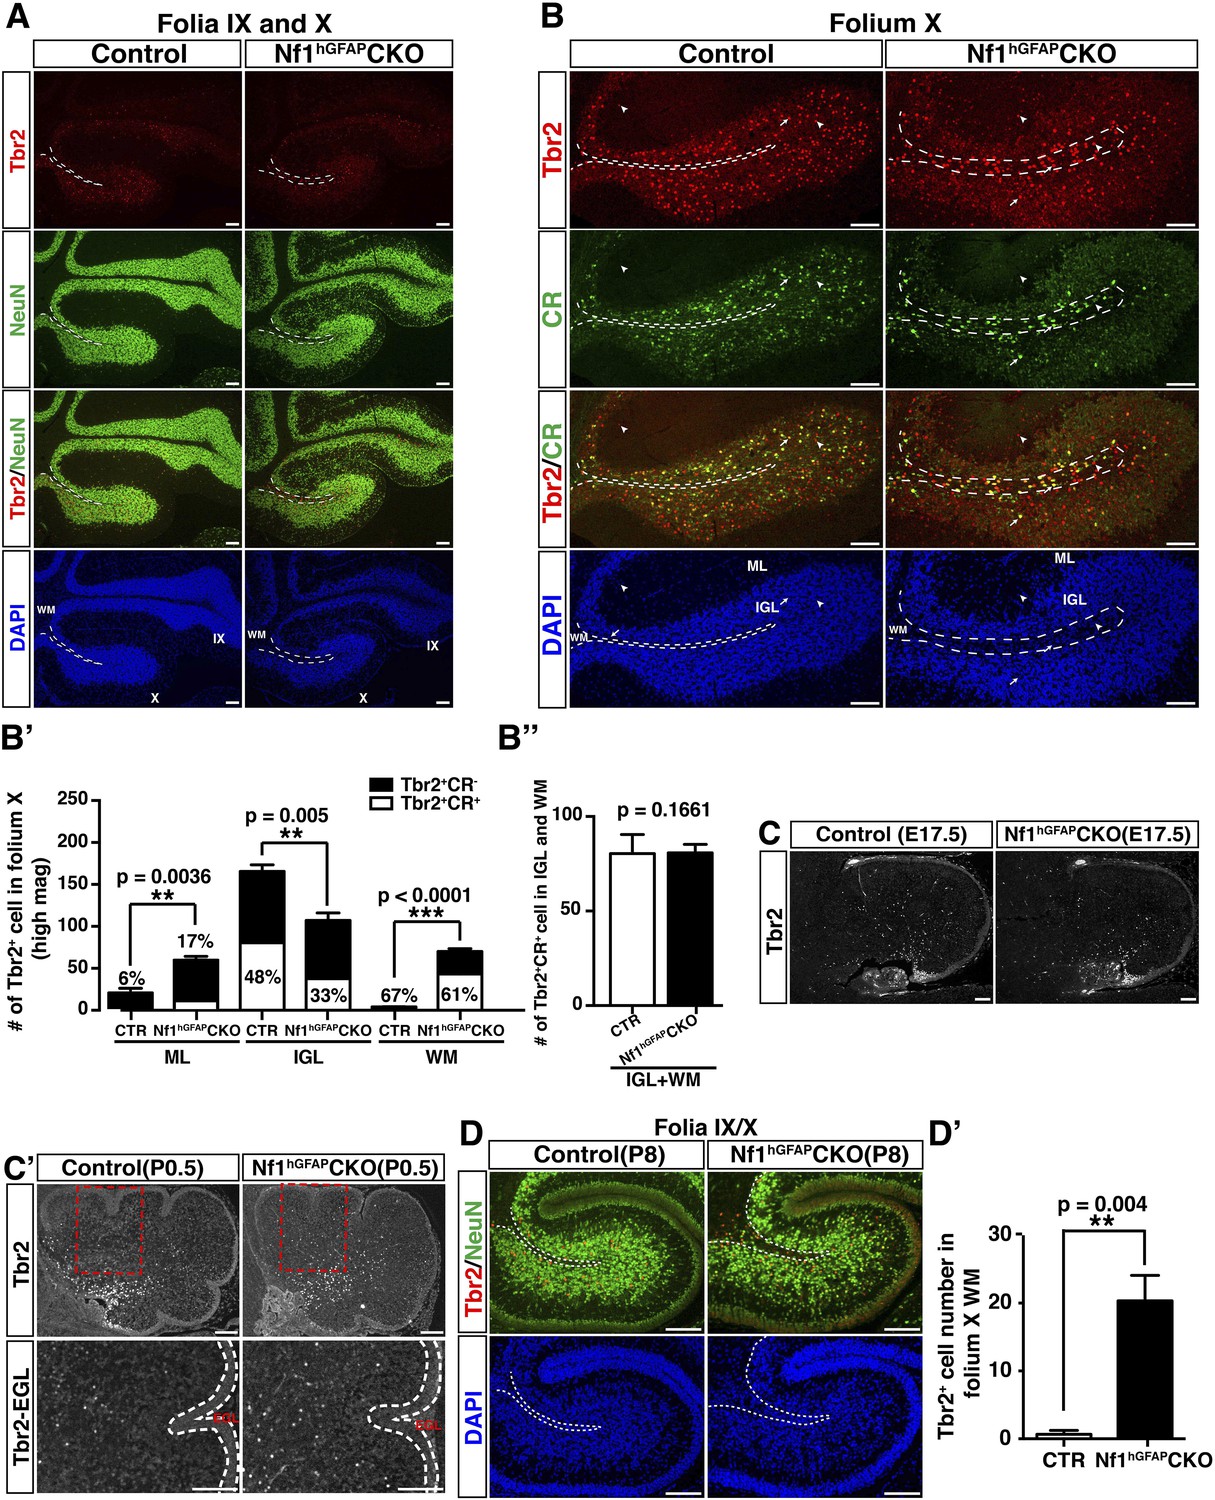
(A) The overall expression pattern of Tbr2 in the adult control and Nf1hGFAPCKO cerebella was compared. High magnification images were merged to provide a high-resolution view. (A′) Tbr2 staining in folium V/VI was compared. Arrows point to Tbr2+ cells in the ML. The total number of Tbr2+ cell in the ML of each folium was quantified in (A′′). (B) Sections were stained for Tbr2/NeuN and imaged at folium V. The number of Tbr2+NeuN+ cells and Tbr2+NeuN− cells per high magnification field was quantified in (B′). The percentage of Tbr2+NeuN+ cells among Tbr2+ cells is illustrated. (C) Tbr2 staining in folium X was compared. The total number of Tbr2+ cells in the ML, IGL and WM of folia X was quantified in (C′). (D) Sections were stained for Tbr2/NeuN and imaged at folium X. The number of Tbr2+NeuN+ cells and Tbr2+NeuN− cells per high magnification field was quantified in (D′) and (D′′). The percentage of Tbr2+NeuN+ cells is illustrated. (E) Sections were stained for GFAP and BLBP and imaged at folium X. The total number of GFAP+ cells in the WM was quantified in (E′). (F) Cerebellar sections from control and Nf1Math1CKO were stained for Tbr2/NeuN and compared. (G–G′′) Control and Nf1NcreERCKO mice were TM-induced at E17.5 and analyzed at P21. Tbr2/β-gal staining was imaged at folium X (G) and high magnification views of the white matter (G′) and ventral folium X (G′′) were compared. Dashed lines mark the border between the WM and IGL in folium X. Of note, ectopic Tbr2+ cells in the WM of Nf1NcreERCKO were exclusively β-gal-negative (Nf1-wildtype) (G′). In contrast, the increase of Tbr2+ cells in the mutant ML was mostly contributed by Tbr2+β-gal+ cells (Nf1-deficient) (arrows, G′′). Arrows label co-localizing cells and arrowheads label non-co-localizing cells. All the quantification data are presented as mean ± SEM. DAPI labels the nuclei. Scale bars: 50 μm.
Figure 5—figure supplement 1
The ectopic accumulation of Tbr2+ UBC in the ML of Nf1hGFAPCKO cerebella occurs during postnatal development.
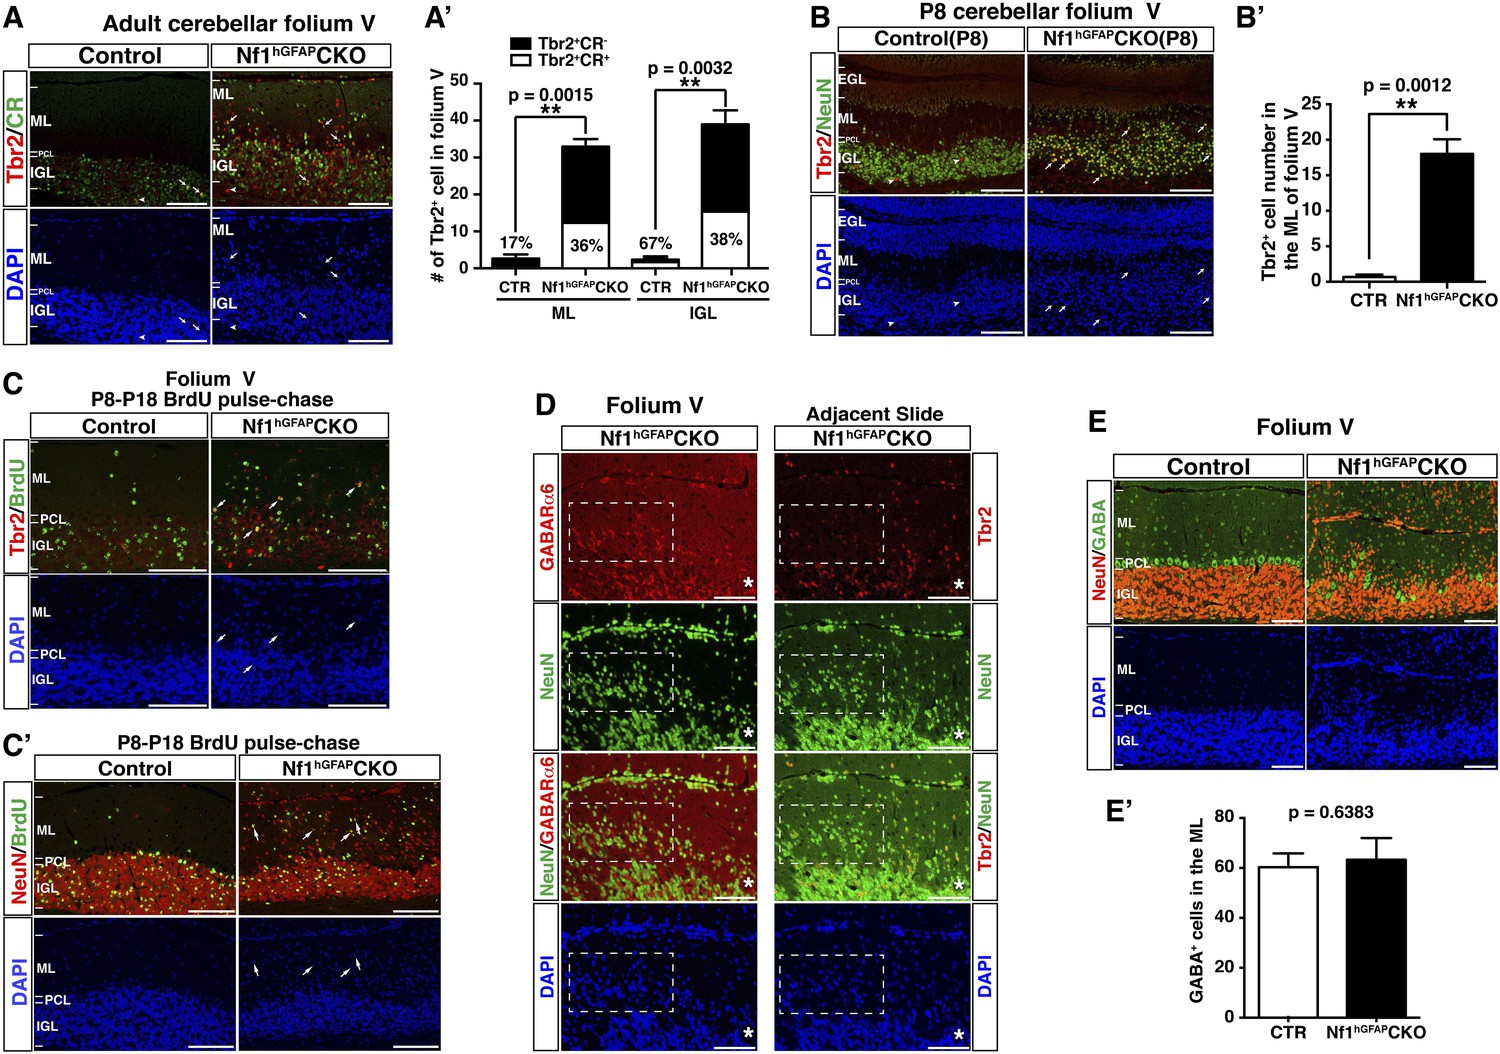
(A) Cerebellar sections were stained for Tbr2/CR and imaged at folium V. The number of Tbr2+CR+ cells and Tbr2+CR− cells per high magnification field was quantified in (A′). The percentage of Tbr2+CR+ cells is illustrated. (B) Sections of P8 control and Nf1hGFAPCKO cerebella were stained for Tbr2/NeuN and imaged at folium V. The number of Tbr2+ cells in the ML of folium V was quantified in (B′). (C, C′) Control and Nf1hGFAPCKO mice were pulsed with BrdU at P8 and sacrificed at P18. Cerebellar sections were stained for Tbr2/BrdU (C) and NeuN/BrdU (C′) to label newly generated Tbr2+BrdU+ UBCs and NeuN+BrdU+ granular cells (arrows) (D) Adjacent sections from the same Nf1hGFAPCKO adult cerebellum were stained for GABAα6/NeuN and Tbr2/NeuN. * labels a blood vessel structure found in both sections, which was used as a reference to match these two sections. Boxed areas highlight a group of cells that express a significant level of GABAα6 but are mostly Tbr2−. (E) Sections of adult control and Nf1hGFAPCKO cerebella were stained for NeuN/GABA and the number of GABA+ GABAergic neurons in the ML were quantified in (E′). DAPI labels the nuclei. All the quantification data are presented as mean ± SEM. Scale bars: 50 μm.
Figure 5—figure supplement 2
A subpopulation of UBCs in the Nf1hGFAPCKO cerebella fail to migrate into the IGL and are ectopically present in the WM during postnatal development.
(A) The low magnification view of Figure 5D is shown to compare the overall distribution of Tbr2+ cells in folia IX and X. (B) Sections of adult control and Nf1hGFAPCKO cerebella were stained for Tbr2/CR and imaged at folium X. Dashed lines mark the border of white matter in folium X. The number of Tbr2+CR+ cells (arrows) and Tbr2+CR− cells (arrowheads) per high magnification field were quantified in (B′, B′′). The percentage of double-labeled Tbr2+CRhigh cells among total Tbr2+ cells was illustrated. (C, C′) The distribution of Tbr2+ cells in E17.5 (C) and P0.5 (C′) control and Nf1hGFAPCKO cerebella was compared. Boxed areas in (C′, upper panels) are shown at higher magnification in lower panels to indicate the absence of Tbr2+ cells in the EGL of both control and mutant cerebella. (D) Sections of P8 control and Nf1hGFAPCKO cerebella were stained for Tbr2/NeuN and imaged at folia IX/X. The number of Tbr2+ cells in the WM of folium X was quantified in (D′). DAPI labels the nuclei. All the quantification data are presented as mean ± SEM. Scale bars: 50 μm.
Figure 6 with 1 supplement
Glia-independent neuronal defects in the Nf1Math1CKO cerebellum are rescued by P0.5–P21 MEKi-treatment.
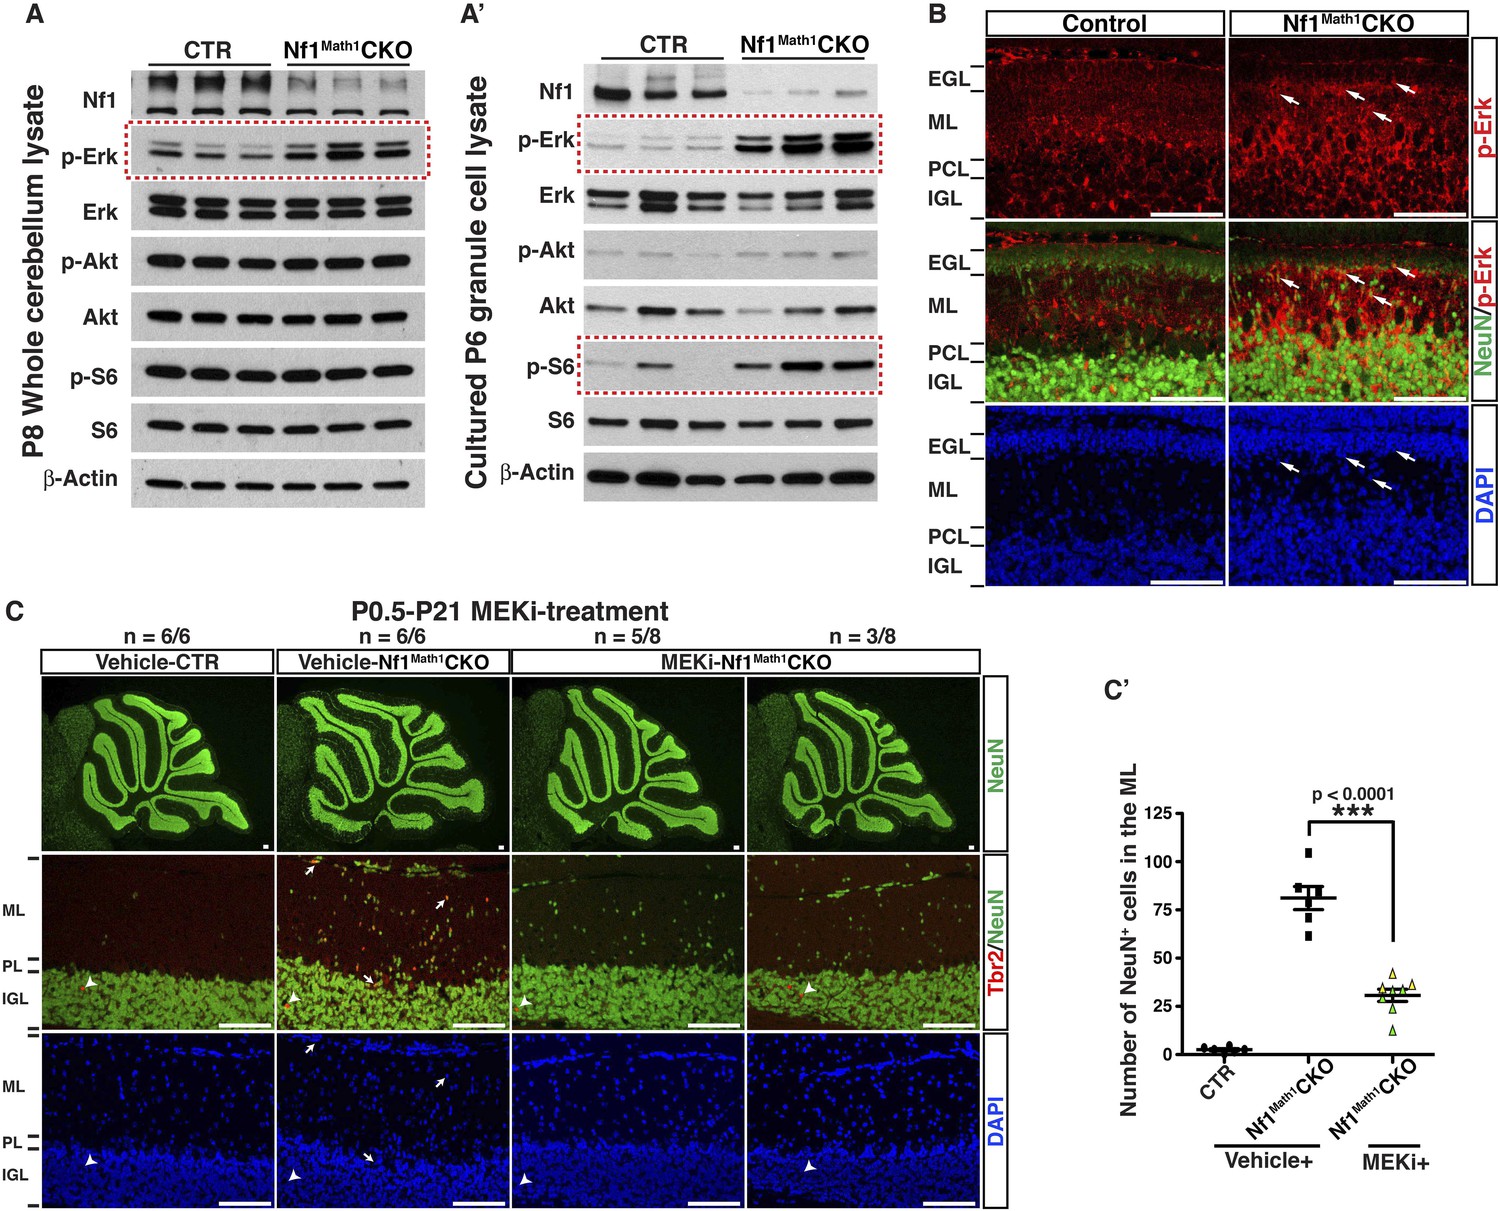
Western blot analysis was performed on P8 whole cerebellar lysates (A) or P6 cultured GCP lysates (A′) from control and Nf1Math1CKO mice. (B) Cerebellar sections from P8 control and Nf1Math1CKO mice were stained for NeuN and p-Erk. Arrows highlight the NeuN+p-Erk+ cells in the mutant EGL and ML. (C) Control and Nf1Math1CKO mice were treated with vehicle or MEKi (5 mg/kg) from P0.5–P21 and analyzed at P21. Cerebellar sections were stained for Tbr2/NeuN, and imaged at low magnification (upper panels) and folium V (lower panels). (C′) The number of NeuN+ cells in the ML was quantified and compared. Of note, the yellow triangles represent 3 MEKi-treated mutant cerebella that still displayed cell clusters near the pial surface. Individual data points are presented, as well as mean ± SEM for each group. DAPI labels the nuclei. Scale bars: 50 μm.
Figure 6—figure supplement 1
Rapamycin treatment during neonatal stages does not rescue the neuronal defects in the Nf1Math1CKO cerebellum, but causes adverse effects.
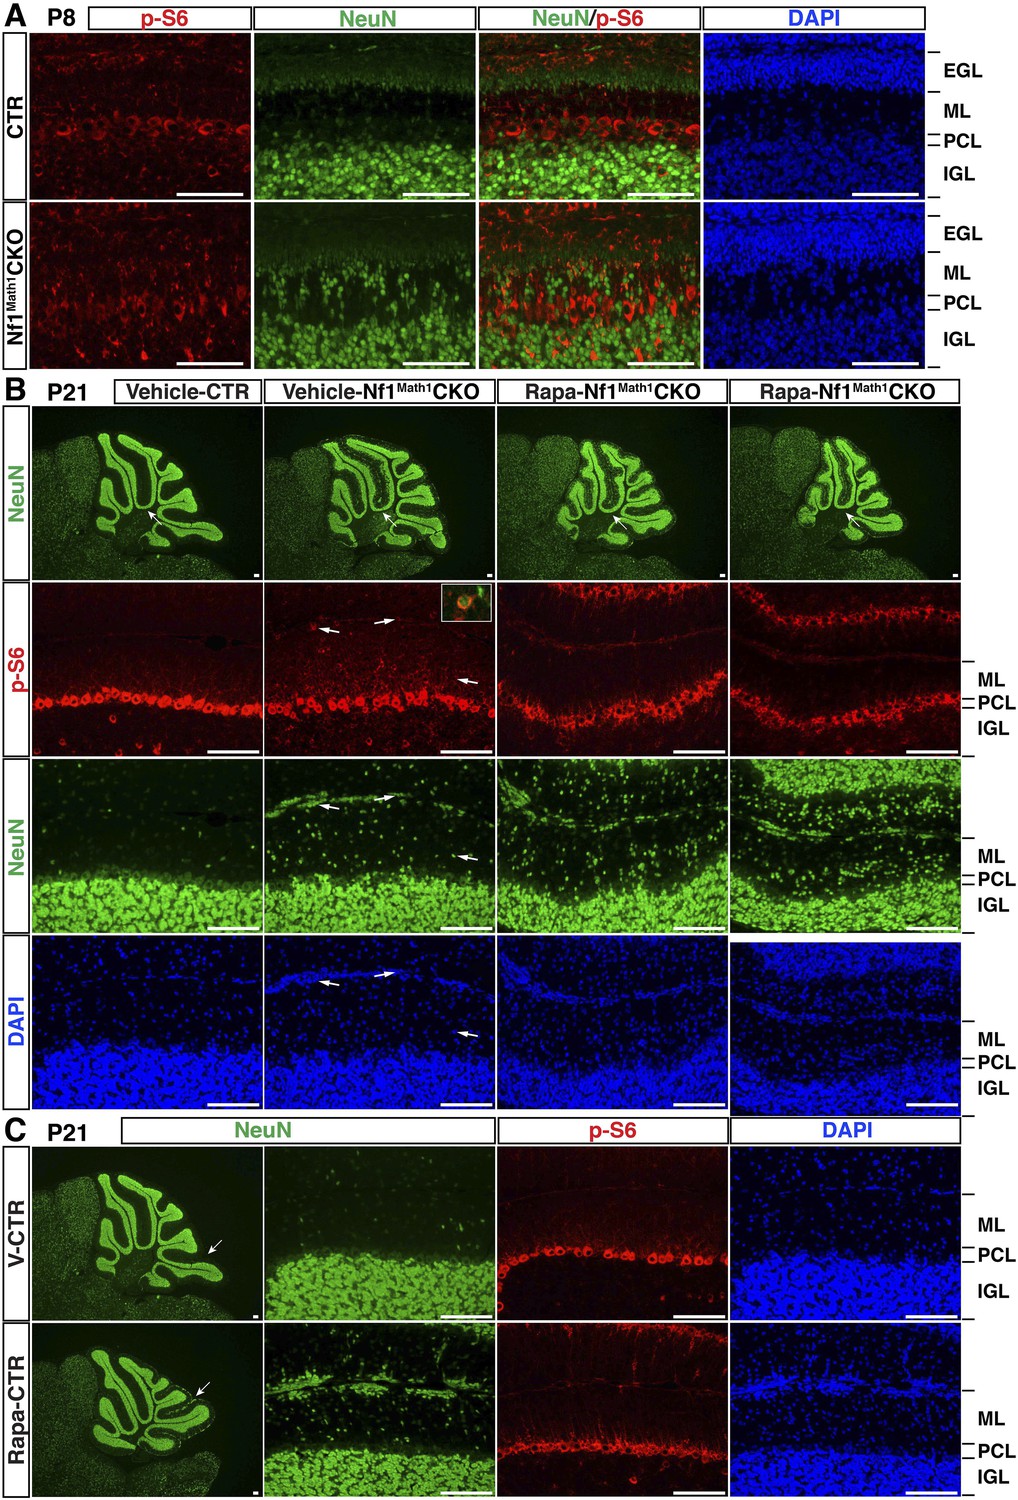
(A) Sections of P8 control and Nf1Math1CKO cerebella were stained for p-S6 and NeuN. (B) Control and Nf1Math1CKO mice were treated with vehicle or Rapamycin from P0.5–P21 and analyzed at P21. Arrows point to p-S6+NeuN+ cells, which are also shown in the inset. (C) Rapamycin-treated control and Nf1Math1CKO mice exhibited significant cerebellar defects. Sections from vehicle- or Rapamycin-treated controls were stained for NeuN and p-S6. Arrows point to folia where there is abnormal neuronal clustering in the Rapamycin-treated cerebellum, but not in the vehicle-treated control. DAPI labels the nuclei. Scale bars: 50 μm.
Figure 7 with 2 supplements
MEKi treatment rescues glia-dependent cerebellar defects in the Nf1hGFAPCKO cerebellum.
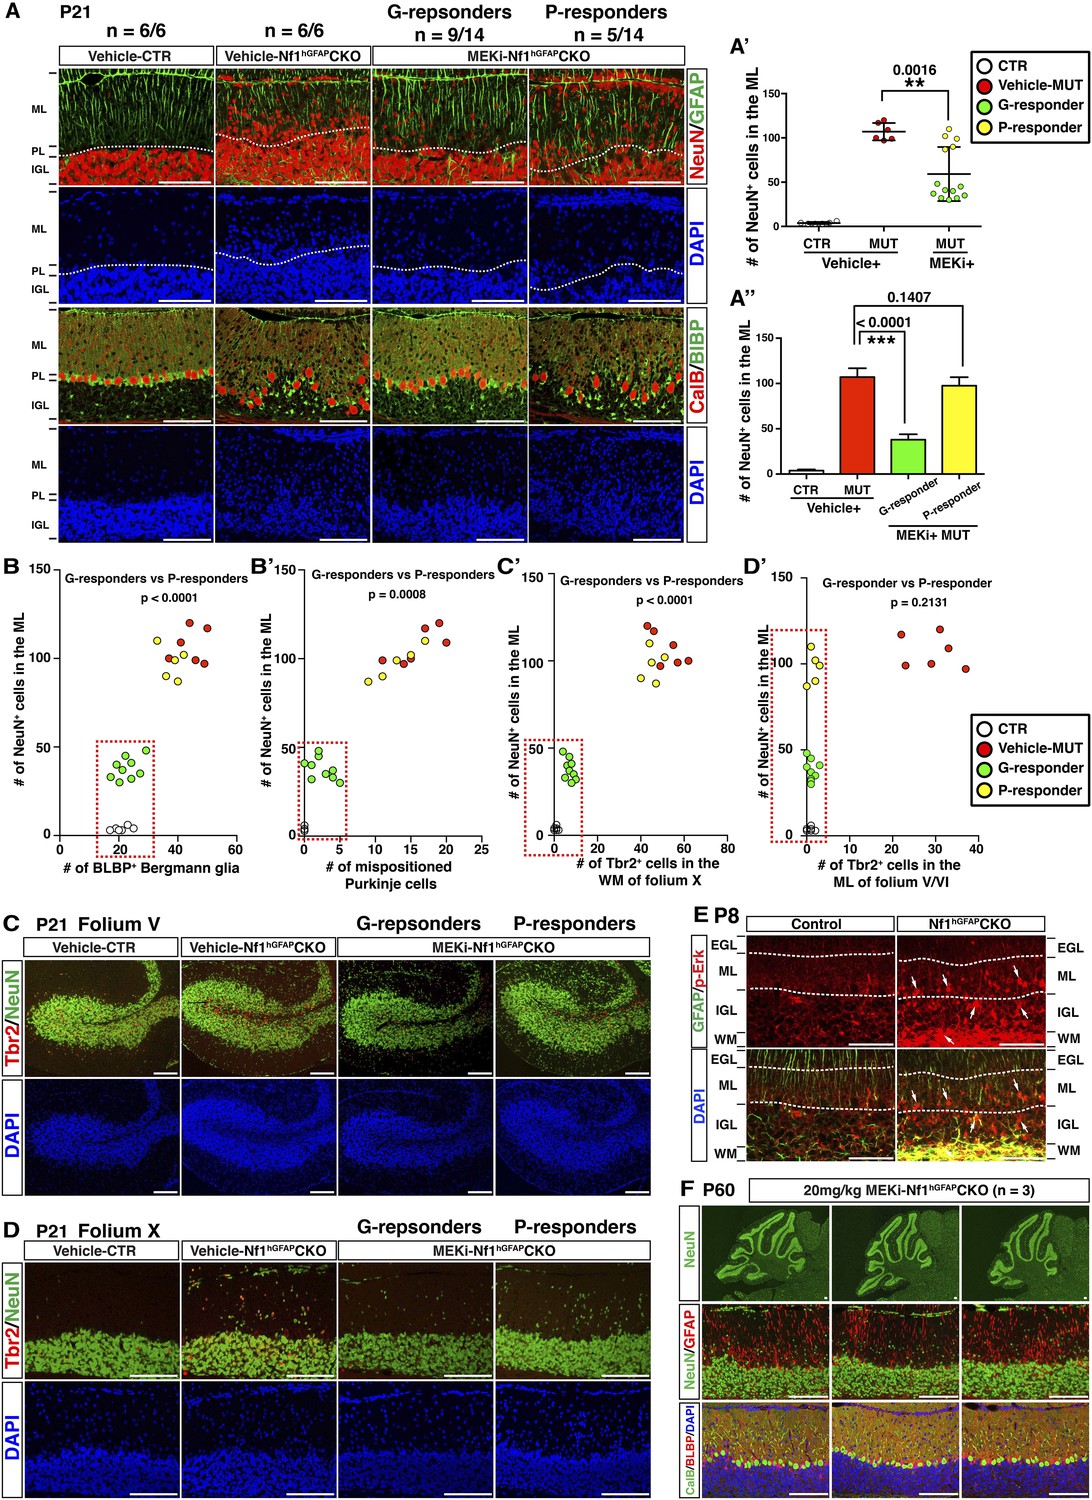
(A) Cerebellar sections of vehicle- and MEKi-treated (5 mg/kg) control and Nf1hGFAPCKO mice were stained for GFAP/NeuN and CalB/BLBP and imaged at folium V. 9 out 14 MEKi-treated mutant mice (G-responder) exhibited a significant improvement, although the remaining 5 (P-responder) still had large number of cells in the EGL/ML and displayed severe laminar disruption. The number of NeuN+ cells in the ML was quantified and compared in (A′). For MEKi-treated mutants, green and yellow color represents G-responders and P-responders, respectively. G-responders and P-responders were separated into two groups and compared in (A′′). (C, D) Cerebellar sections were stained for Tbr2/NeuN and imaged at folia V and X. (B, B′, C′, D′) The correlation between the number of NeuN+ cells in the ML, and the number of BLBP+ BG cells (B), mispositioned Purkinje cells (B′), ectopic Tbr2+ cells in the WM (C′) and ML (D′) was plotted and compared. (E) Sections of P8 control and Nf1hGFAPCKO cerebella were stained for GFAP and p-Erk. Arrows highlight the GFAP+p-Erk+ cells in the ML, IGL and WM of the Nf1hGFAPCKO cerebellum. (F) Three Nf1hGFAPCKO mice treated with MEK inhibitor at 20 mg/kg from P0.5–P21 were analyzed at P60. GFAP/NeuN and CalB/BLBP staining show consistent rescue of both neuronal and glial defects. Individual data points are presented, as well as mean ± SEM for each group. DAPI labels the nuclei. Scale bars: 50 μm.
Figure 7—figure supplement 1

Ras/Erk signaling is differentially activated in neuronal and glial precursors of the developing Nf1hGFAPCKO cerebellum.
(A, B) Sections of P8 control and Nf1hGFAPCKO cerebella were stained for GFAP and p-Erk. Arrows highlight the GFAP+p-Erk+ cells in the ML, IGL and WM of the Nf1hGFAPCKO cerebellum. (B) is the high magnification view of (A). The different p-Erk level in the neuronal vs glial precursors Nf1hGFAPCKO cerebella is more evident in the images with lower exposure in (B). Boxed images are also shown in Figure 7E. DAPI labels the nuclei. Scale bars: 50 μm.
Figure 7—figure supplement 2

High-dose MEKi-treatment produces more consistent phenotypic rescue.
(A) Control and Nf1hGFAPCKO mice were treated with vehicle or MEKi (20 mg/kg) from P0.5–P21 and analyzed at P60. H&E staining of the overall cerebellar structure and folium V are presented. Low magnification view of NeuN staining, as well as high magnification merged images of NeuN/GFAP, CalB/BLBP/DAPI are compared. Arrows point to misaligned Purkinje cells in the ML or IGL. Boxed images are also shown in Figure 7F. The number of NeuN+ cells in the ML, the total number of BLBP+ cells and the number of mispositioned Purkinje cells are quantified in (B), (C) and (D), respectively. DAPI labels the nuclei. All the quantification data are presented as mean ± SEM. Scale bars: 50 μm.
Figure 8
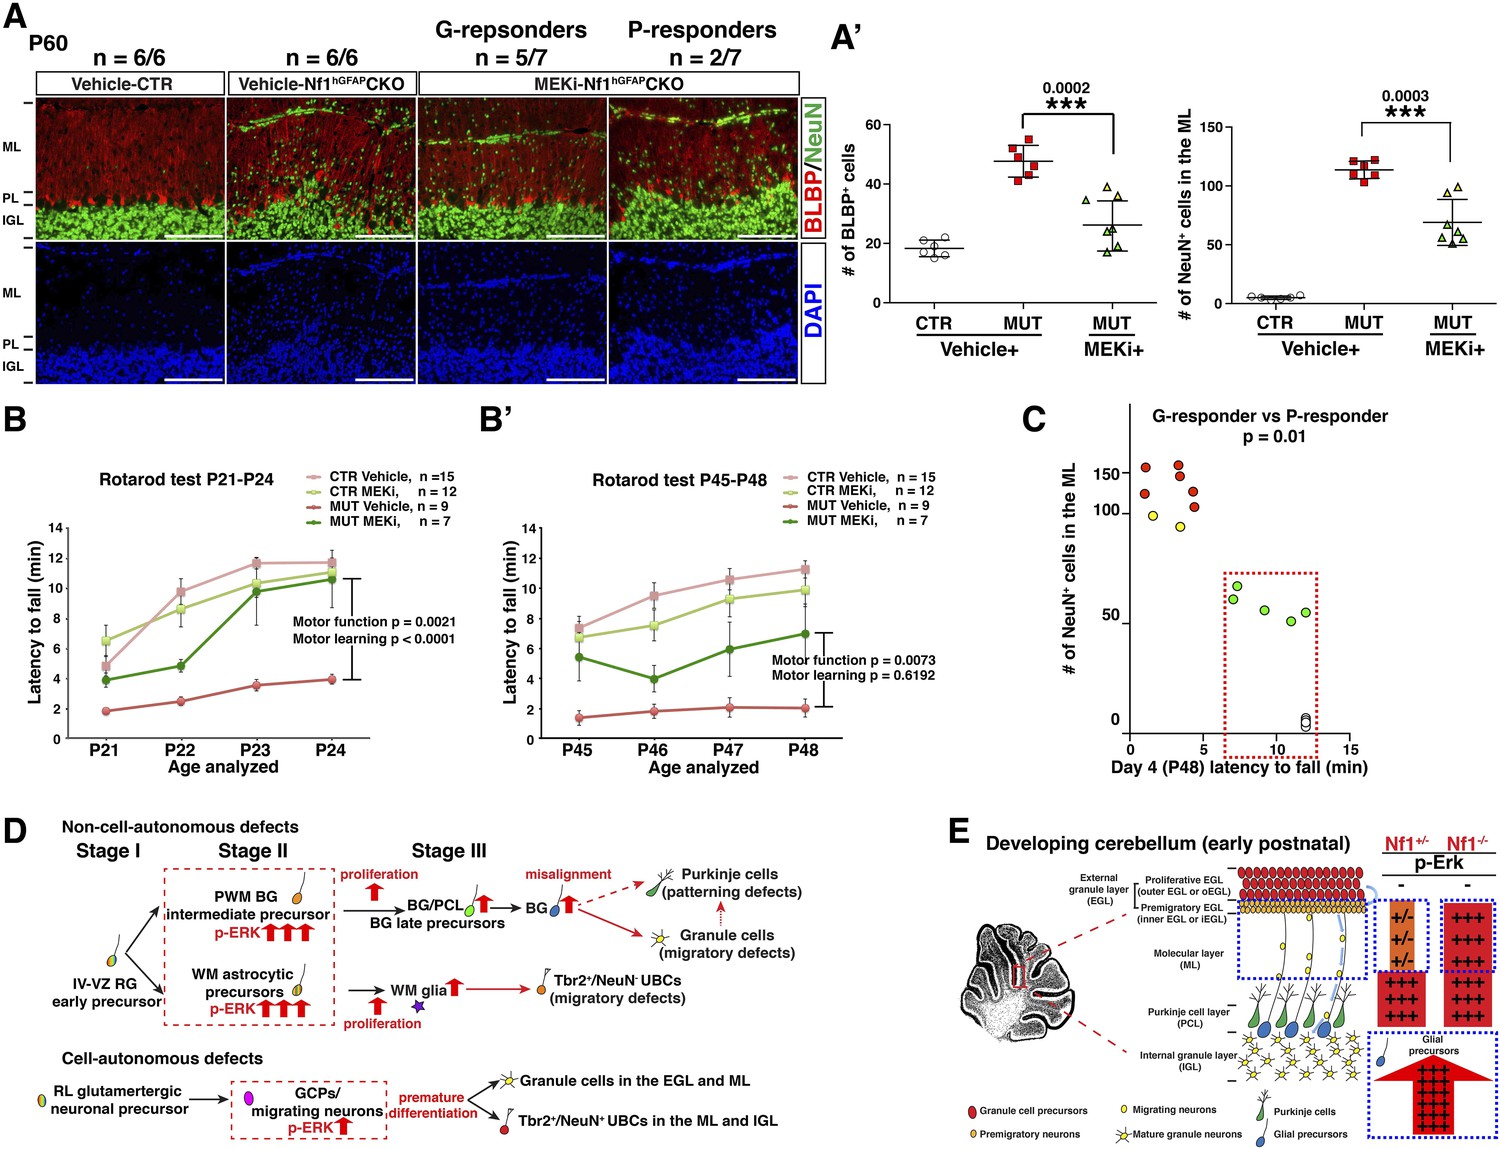
Transient MEKi treatment provides long-term rescue of the cerebellar defects and improves the motor performance of Nf1hGFAPCKO mice.
(A) Control and Nf1hGFAPCKO mice were treated with vehicle or MEK inhibitor (MEKi) from P0.5–P21 and analyzed for BLBP/NeuN staining between P50 and P60. The number of NeuN+ cells in the ML and BLBP+ BG cells were quantified, respectively (A′). (B, B′) Rotarod tests were performed on transiently vehicle- and MEKi-treated control and Nf1hGFAPCKO mice for consecutive days from P21–P24 (B) or P45–P48 (B′) and the duration time for the mice to stay on the Rotarod was documented and compared. The correlation between the number of NeuN+ cells in the ML and duration time on the Rotarod at P48 was plotted in (C). (D) A model is proposed to summarize cell-autonomous and non-cell-autonomous defects in Nf1hGFAPCKO cerebellum and the underlying mechanisms. See main text. (E) A schematic diagram illustrates the differential Erk activation in the P8 control and Nf1hGFAPCKO cerebella. In controls, p-Erk expression is mostly restricted in the IGL neurons and a subset of WM glia, while in mutants, high level of p-ERK expression is identified in migrating neurons in the ML and the majority of WM glia. Note that in Nf1hGFAPCKO cerebella, p-ERK level is much higher in glia compared to neurons. Individual data points are presented, as well as mean ± SEM for each group. DAPI labels the nuclei. Scale bars: 50 μm.
Videos
Video 1
Behavioral defects of Nf1hGFAPCKO mice before and after MEKi treatment.
This video illustrates the typical phenotypes seen in vehicle-treated and untreated Nf1hGFAPCKO mice compared to controls including scruffy fur, unbalanced gait, vertical projection of the tail, hyperactivity, hind-limb crossing, and hand-standing. Following MEKi treatment, the G-responders appear similar to the controls except the vertical projection of the tail, while the P-responders are more similar to the vehicle-treated mutants. All the mice in this video are P21 except the mouse with the hand-standing phenotype, which was videotaped at 4 months of age.
Video 2
Rotarod testing.
Representative P48 control and Nf1hGFAPCKO mice were videotaped on the final (fourth) day of rotarod performance testing. During the test, the vehicle-treated mutants had difficulty walking in a constant forward direction, rotated with the rotarod, and had frequent slippage with difficulty maintaining a grip on the rotarod ultimately resulting in a fall before 5 min. The MEKi-treated mice all had improved performance on the rotarod test, staying on the rotarod for the entire duration, but had a variable response to the treatment, as some of the MEKi-treated mice continued to show evidence of motor dysfunction (e.g., more likely to cling onto the rotarod instead of walking). The video includes clips from different time points and speeds during the rotarod test as a representation of the mouse performance during the task.
Download links
A two-part list of links to download the article, or parts of the article, in various formats.
Downloads (link to download the article as PDF)
Open citations (links to open the citations from this article in various online reference manager services)
Cite this article (links to download the citations from this article in formats compatible with various reference manager tools)
Transient inhibition of the ERK pathway prevents cerebellar developmental defects and improves long-term motor functions in murine models of neurofibromatosis type 1
eLife 3:e05151.
https://doi.org/10.7554/eLife.05151


