Developmental alterations in centrosome integrity contribute to the post-mitotic state of mammalian cardiomyocytes
- Friedrich-Alexander-Universität Erlangen-Nürnberg, Germany
- Max Planck Institute for Heart and Lung Research, Germany
- University of Ulm, Germany
Figures
Figure 1 with 2 supplements
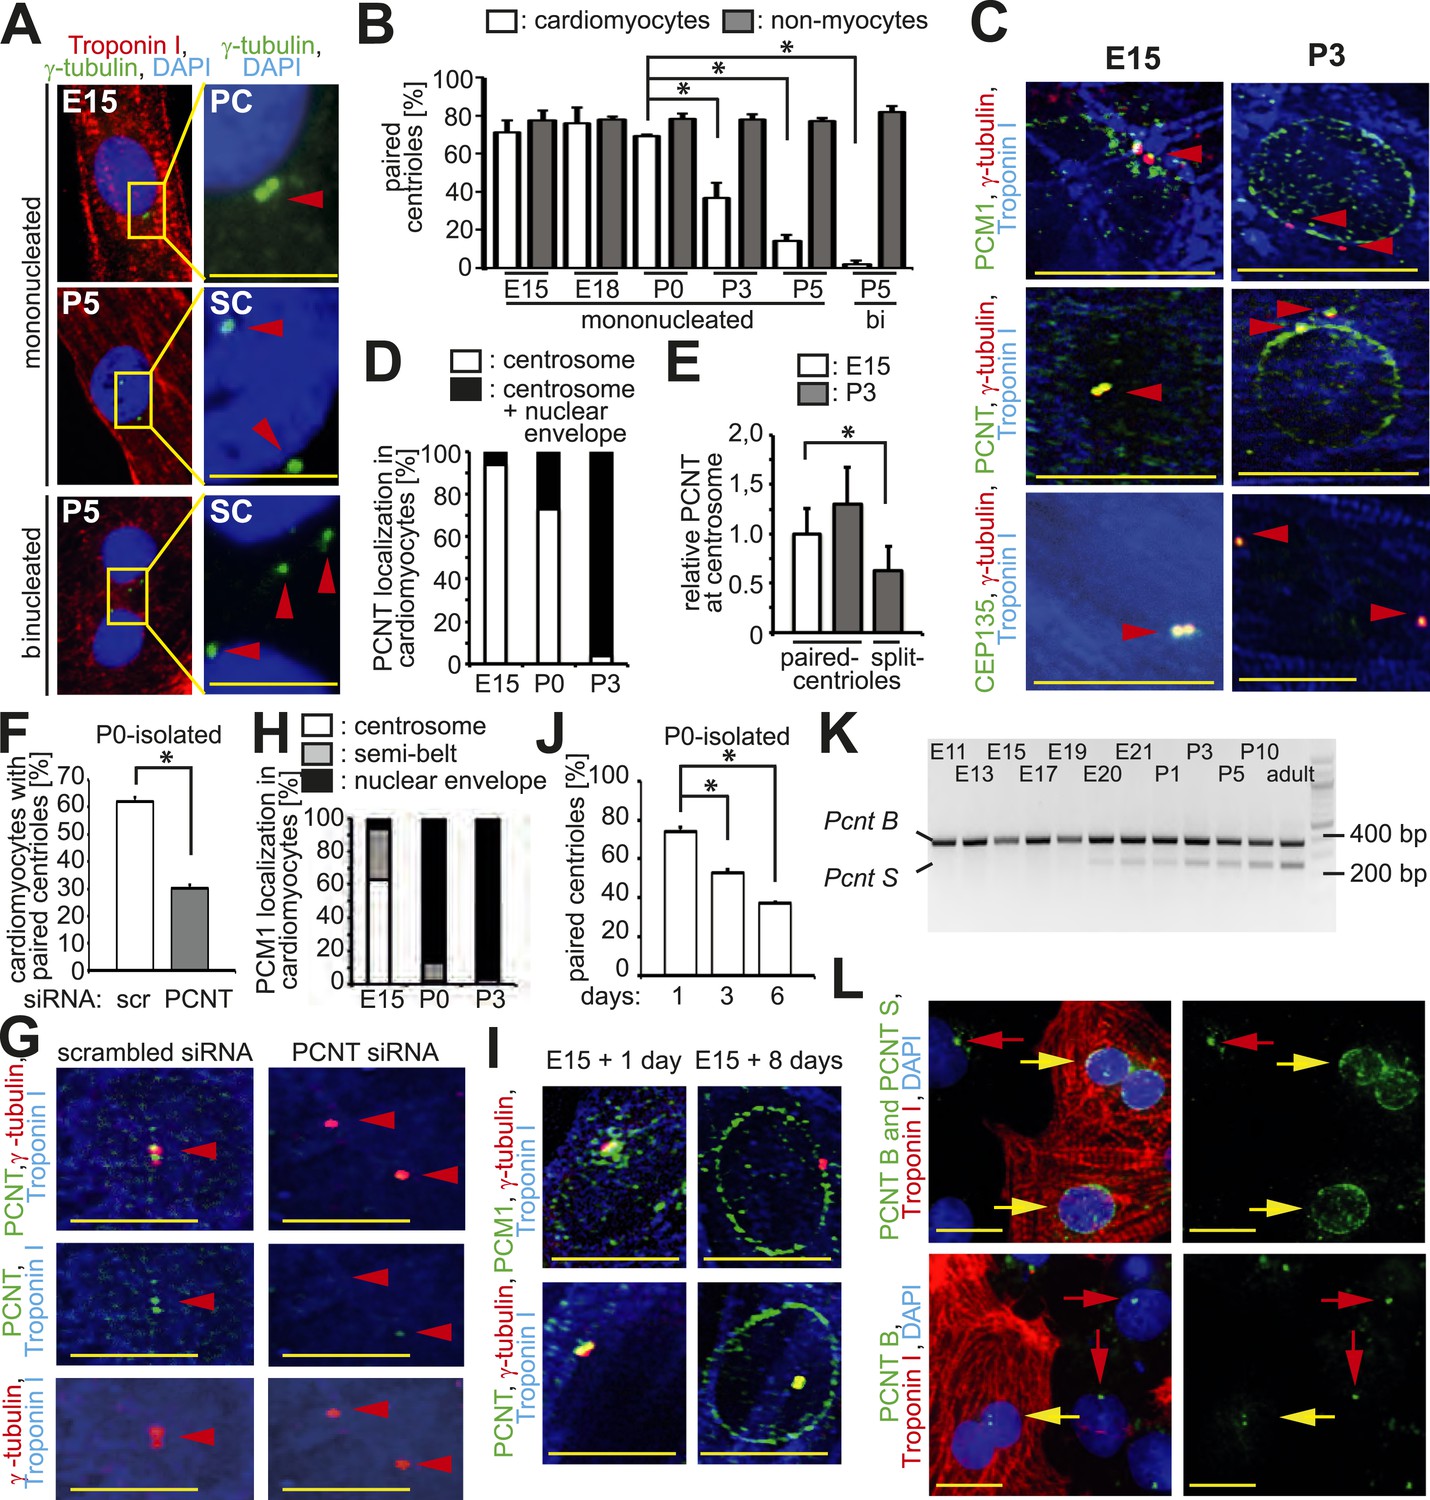
Loss of centrosome integrity during heart development.
(A) Analysis of centriole (γ-tubulin) configuration in E15- or P5-isolated ventricular rat cardiomyocytes (Troponin I). Nuclei: DAPI. PC: paired-centrioles. SC: split-centrioles. Scale bar: 5 µm. (B) Frequency of cells with paired-centrioles during development. Bi: Binucleated. (C) Analysis of the localization of the centrosome proteins PCM1, PCNT (Pericentrin), and CEP135 in isolated cardiomyocytes. (D) PCNT localization frequency in cardiomyocytes isolated from different developmental stages. (E) Centrosomal PCNT signal intensity in P3-isolated cardiomyocytes with paired- and split-centrioles relative to E15-isolated cardiomyocytes. (F) Frequency of paired-centrioles in P0-isolated cardiomyocytes after siRNA-mediated Pcnt knockdown. scr: scrambled. (G) Representative images of the analysis in (F). (H) PCM1 localization frequency in cardiomyocytes isolated from different developmental stages. (I) Analysis of PCM1 and PCNT localization in E15-isolated cardiomyocytes cultured for either 1 or 8 days. (J) Frequency of P0-isolated cardiomyocytes with paired-centrioles after 1 day, 3 days, or 6 days in culture. (K) RT-PCR analysis of Pcnt B and S isoform expression during rat heart development in vivo. (L) Localization of PCNT isoforms. P3-isolated cardiomyocytes immunostained with antibodies against either both PCNT B and S isoforms or only the PCNT B isoform. Yellow arrows: cardiomyocyte nuclei. Red arrows: non-myocyte nuclei. Unless otherwise noted, scale bars: 10 µm; red arrowheads: centrioles; data are mean ± SD, n = 3, *: p < 0.05. For the experiments ≥ 10 cells (E), ≥ 50 cells (B, F, J), ≥ 100 (D, H) cells were analyzed per experimental condition.
Figure 1—figure supplement 1
Loss of centrosome integrity during heart development.
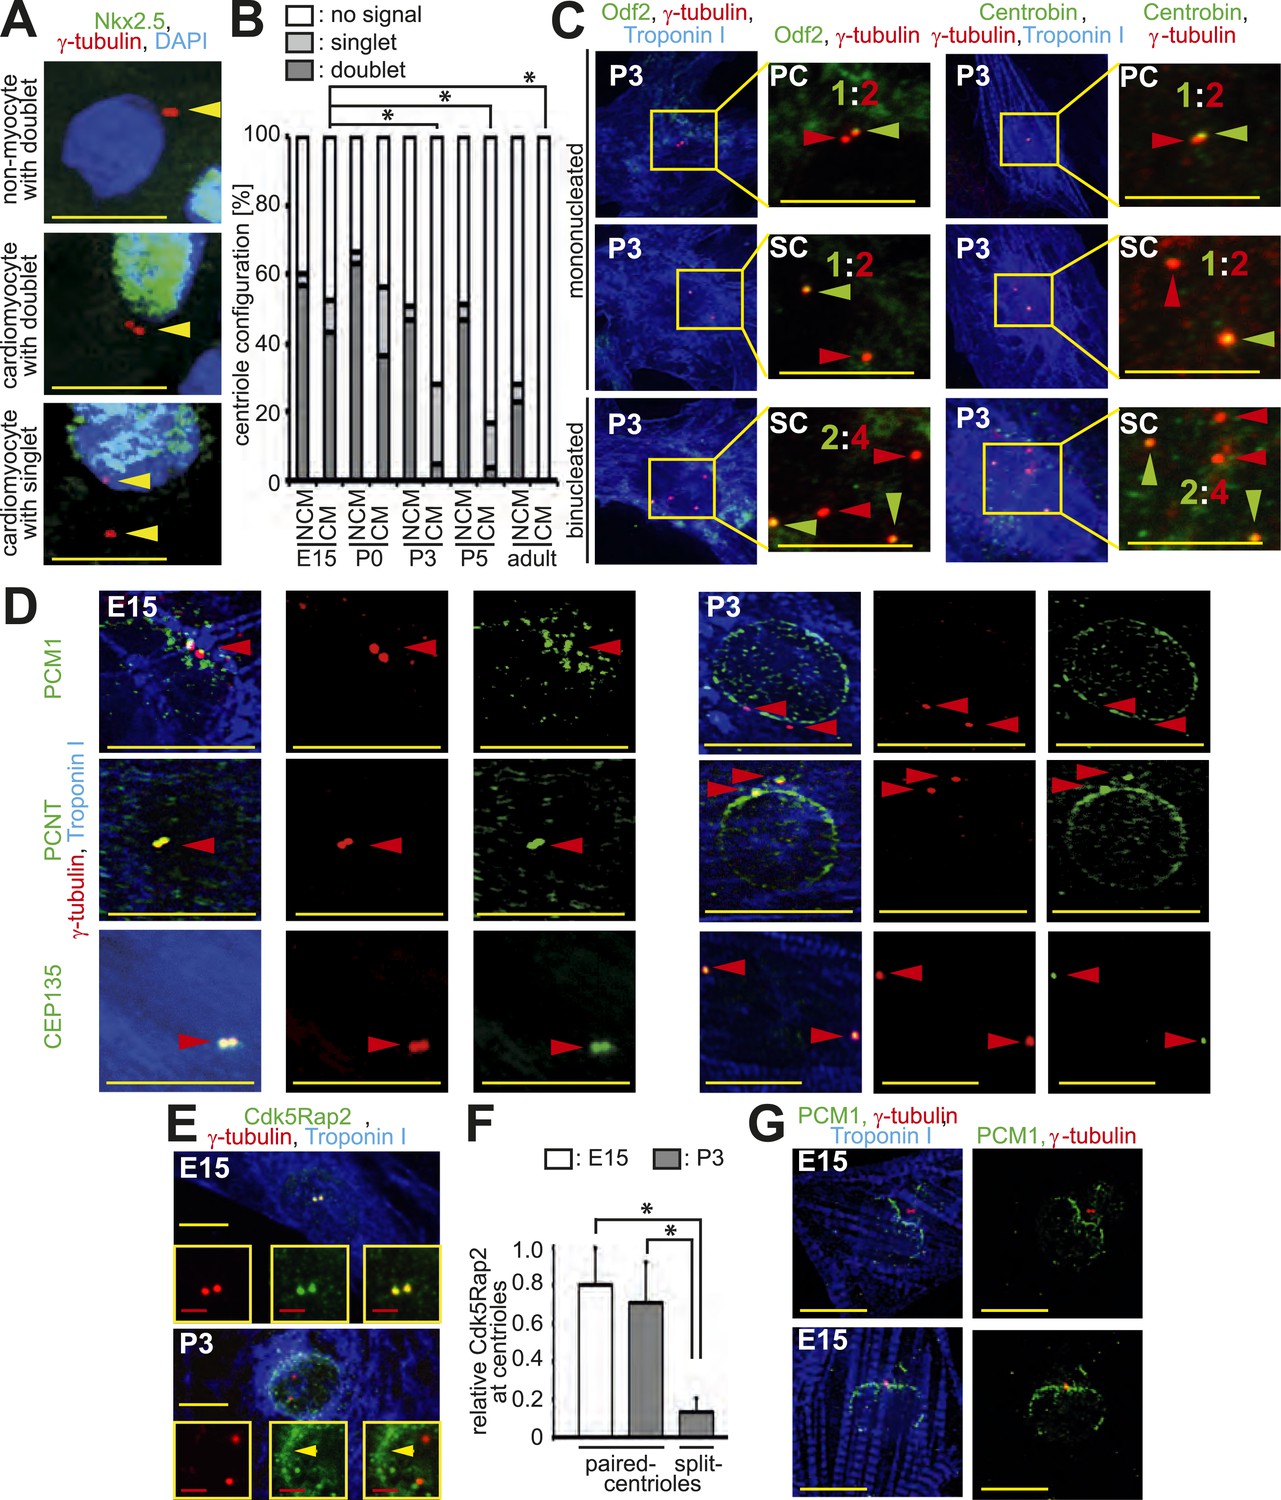
(A) Representative images of centrosomes (γ-tubulin) in heart cryosections of P0 rat heart ventricles. Nuclei: DAPI. Cardiac nuclei: Nkx2.5. Arrowheads indicate centrioles. γ-tubulin signals separated by a distance greater than 2 µm were considered as singlets. Scale bars: 10 µm. (B) Quantitative analysis of centriole signals and configurations in cardiomyocytes and non-myocytes from cyrosections of E15-, P0-, P3-, P5, or adult (2 months) rat heart ventricles. CM: cardiomyocyte. NCM: non-myocyte. Results are from three independent animals, data are mean ± SD, ≥ 100 cells were analyzed per experimental condition, *: p < 0.05 (refers to doublets). (C) Representative images of P3-isolated cardiomyocytes immunostained for mother centriole (Odf2) and daughter centrioles (Centrobin) (green arrowheads). SC: split-centrioles. Colored ratios equal daughter or mother centriole: all centrioles. (D) Analysis of the localization of the centrosome proteins PCM1, PCNT (Pericentrin), and CEP135 in isolated cardiomyocytes. Red arrowheads indicate centrioles. (E) Representative images of Cdk5Rap2 localization in E15- and P3-isolated rat cardiomyocytes. Yellow arrowhead: Cdk5Rap2 at the nuclear envelope. (F) Quantitative analysis of centriolar Cdk5Rap2 signal intensity in E15- and P3-isolated cardiomyocytes. Data are mean ± SD, n = 3, ≥ 10 cells were analyzed per experimental condition, *: p < 0.05. (G) Representative images of PCM1 localization in E15-isolated cardiomyocytes (Troponin I). Centrioles: γ-tubulin.
Figure 1—figure supplement 2
Loss of centrosome integrity during heart development.
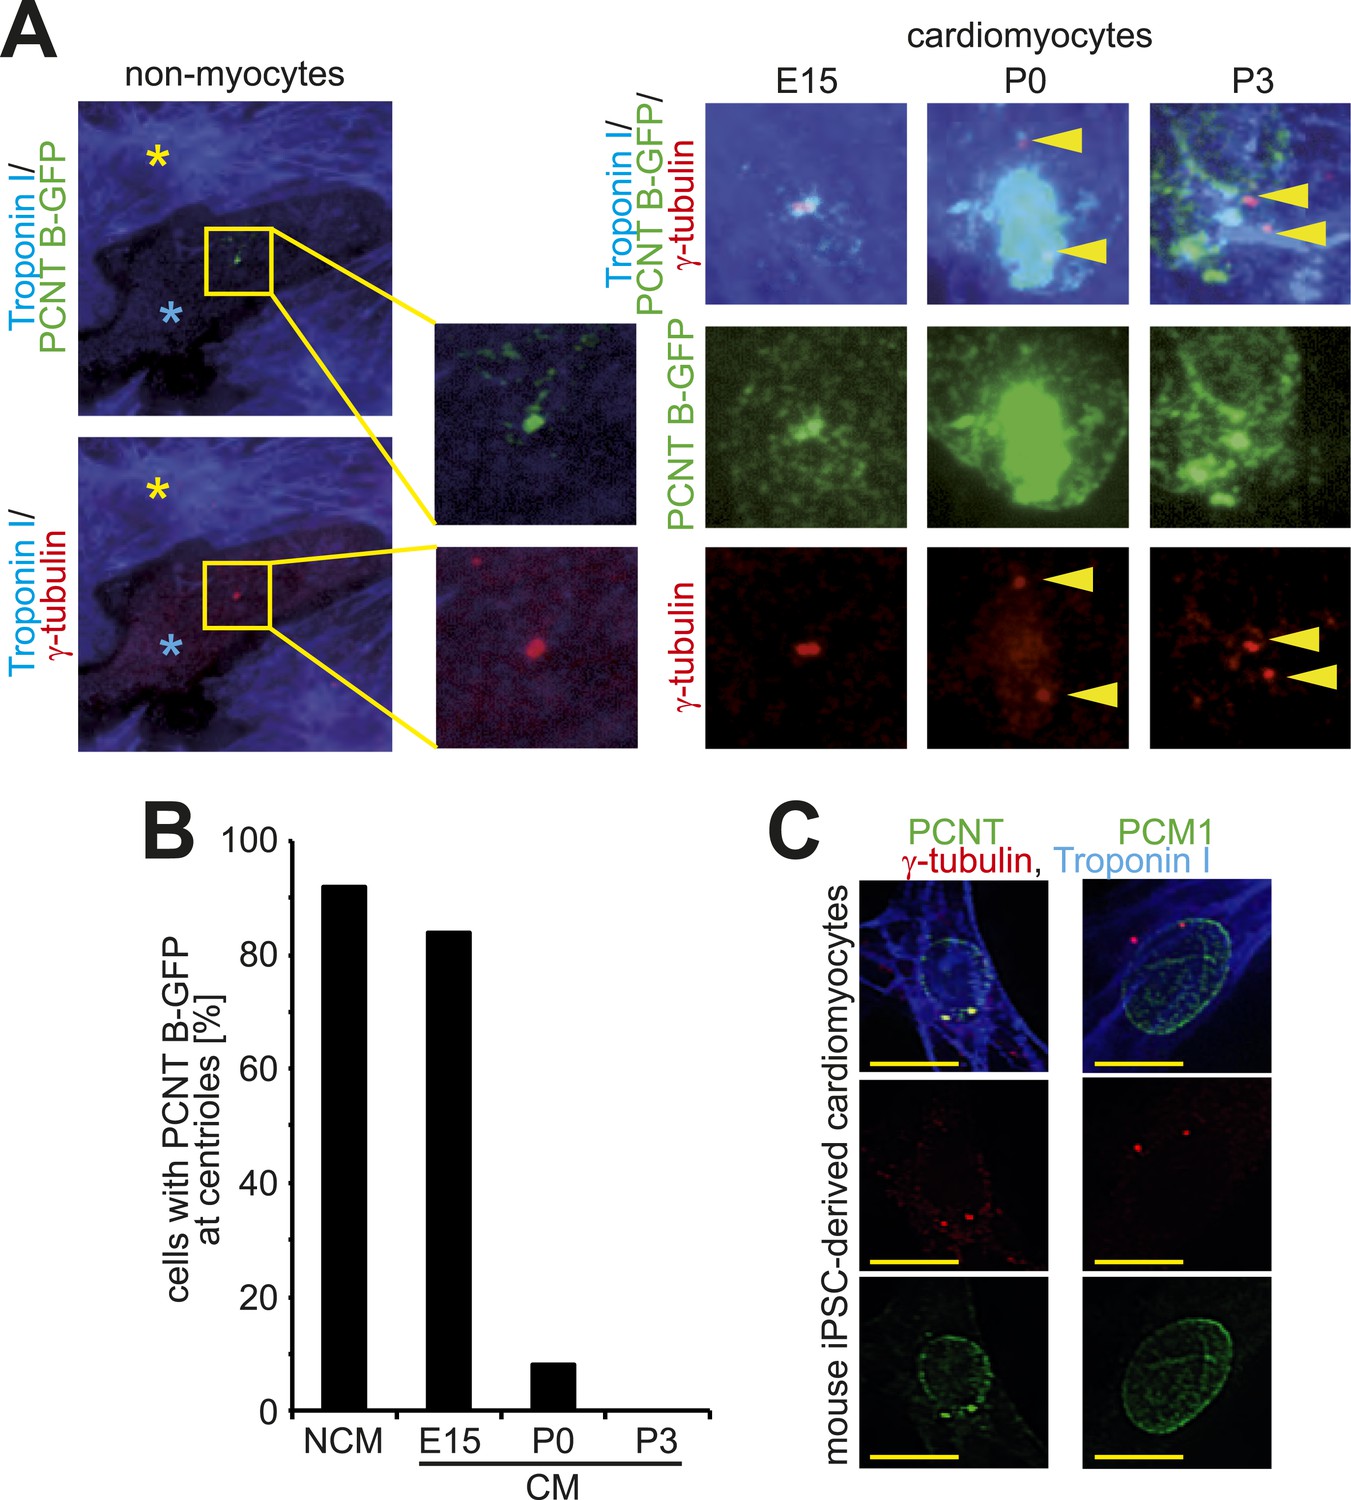
(A) Localization of Pericentrin (PCNT) B-GFP in non-myocytes and cardiomyocytes from different developmental stages. Cardiomyocyte (Troponin I), centriole (γ-tubulin). Arrowheads indicate centrioles. Yellow asterisk: cardiomyocytes. Blue asterisk: non-myocyte. (B) Frequency of PCNT B-GFP-positive centrioles in non-myocytes (NCM) and cardiomyocytes (CM) from different developmental stages. ≥ 50 cells pooled from several experiments were analyzed per time point. (C) Representative images of centriole configuration and PCNT and PCM1 localization in mouse iPSC-derived cardiomyocytes. Yellow scale bars: 10 μm.
Figure 2 with 1 supplement
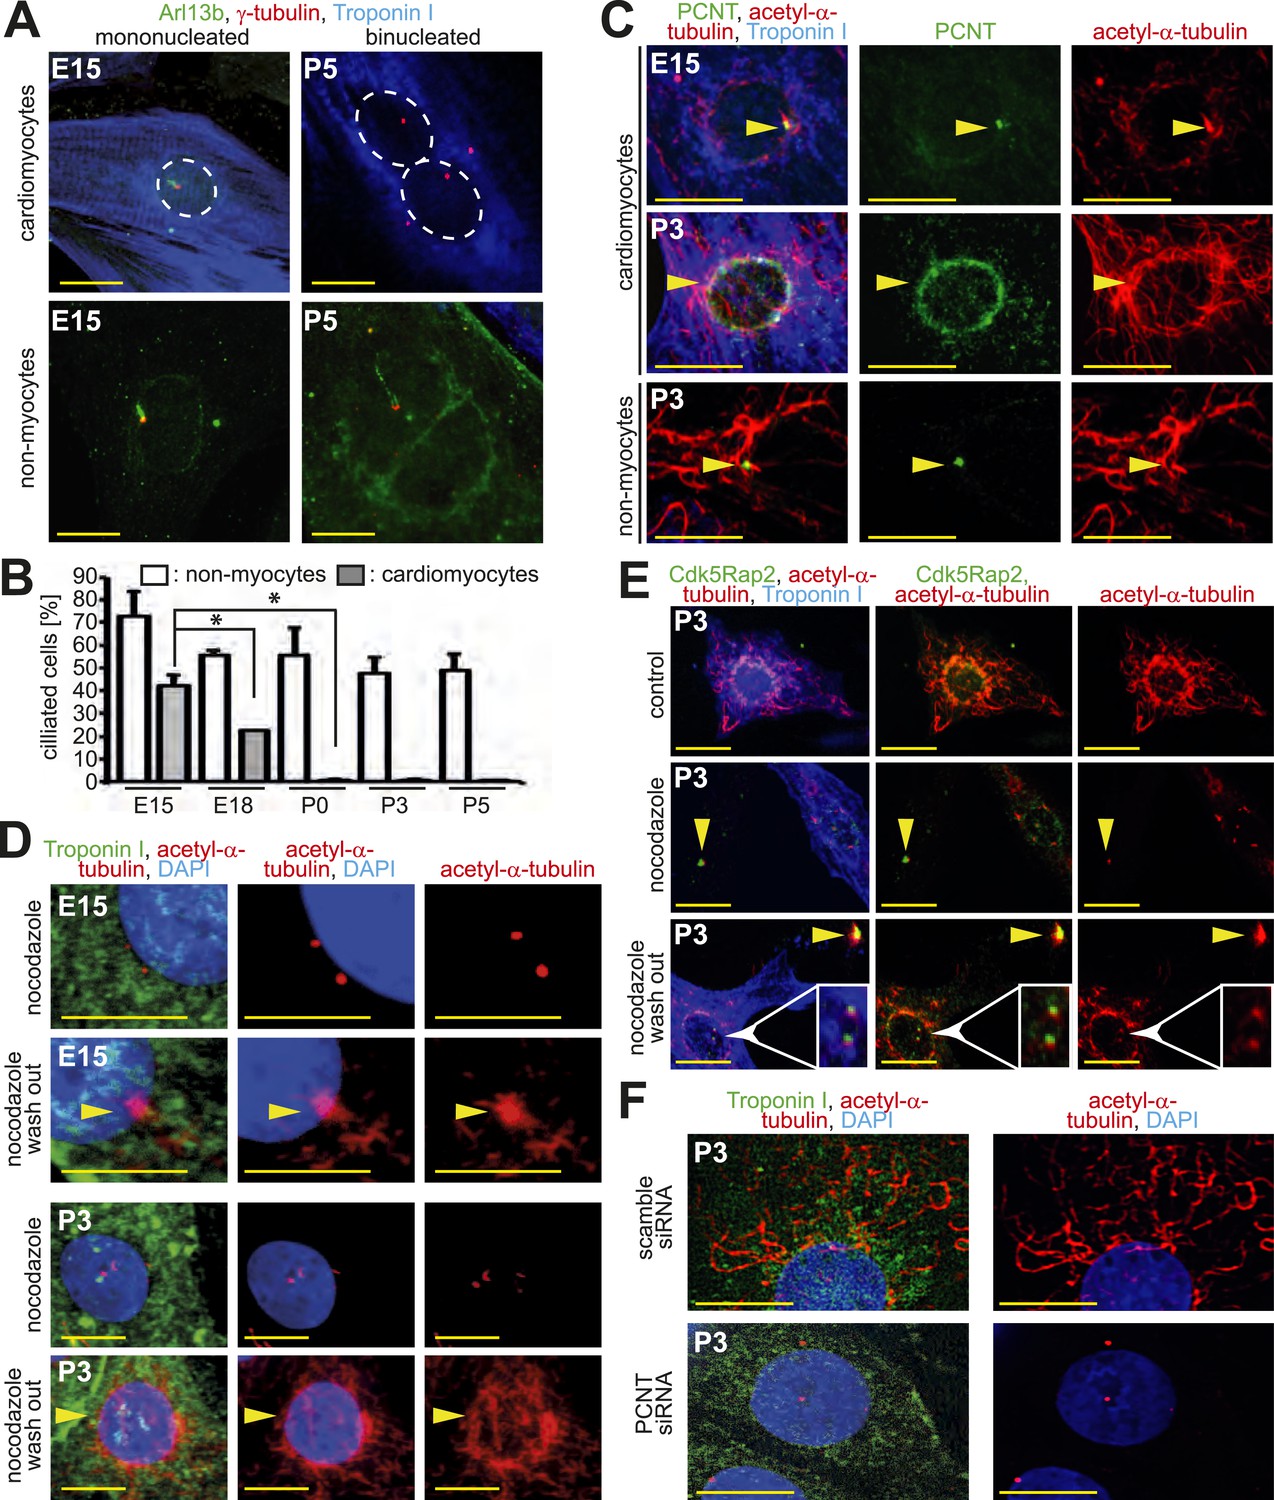
Loss of centrosome function during heart development.
(A) Identification of primary cilium (Arl13b) in E15- and P5-isolated cardiomyocytes (Troponin I) and non-myocytes. Centrioles: γ-tubulin. White circle: nuclei. (B) Frequency of ciliated cardiomyocytes and non-myocytes isolated from hearts at different developmental stages. Data are mean ± SD, n = 3, *: p < 0.05. ≥ 200 cells were analyzed for each condition. (C) Localization of the cellular MTOC (Pericentrin [PCNT]) in E15- and P3-isolated cardiomyocytes. Microtubules: acetylated-α-tubulin; yellow arrowheads: PCNT-positive MTOC. (D) Localization of microtubule regrowth (yellow arrowhead). E15- or P3-isolated cardiomyocytes treated with nocodazole or nocodazole followed by wash-out. (E) Analysis of microtubule regrowth at centrioles. P3-isolated cardiomyocytes were treated as in (D). Yellow arrowheads: Cdk5Rap2-positive centrioles in non-myocytes; White arrowheads: Cdk5Rap2-positive centrioles in cardiomyocytes. (F) Pericentrin is required for a functional MTOC. P3-isolated cardiomyocytes transfected with scrambled or PCNT siRNAs and analyzed for microtubule formation. Scale bars: 10 µm.
Figure 2—figure supplement 1

Loss of centrosome function during heart development.
(A) Representative images of postnatal cardiomyocytes stained for cell cycle activity (Ki67) and cardiomyocytes (α-actinin) including a quantitative analysis for Ki67-positive cardiomyocytes. Data are mean ± SD, n = 3. ≥ 200 cells were analyzed per experimental condition. Nuclei: DAPI. Scale bars: 20 µm. (B) Quantitative analysis of the purity of cardiomyocyte cultures based on α-actinin. Data are mean ± SD, n = 3. ≥ 150 cells were analyzed per experimental condition. (C) Cell cycle analysis of cardiomyocytes based on DNA content by FACS analysis. Peaks: G0/G1 (green), S-phase (yellow), G2/M (blue). (D) Quantitative analysis of (C). Data are mean ± SD, n = 3. Per experimental condition 10,000 cells were analyzed. (E) Localization of microtubule regrowth in non-myocytes of P3-isolated cardiomyocyte cultures treated with nocodazole or nocodazole followed by wash-out. Scale bars: 10 µm. (F) Frequency of MTOC localization in cardiomyocytes (CM) and non-myocytes (NCM) from different developmental stages after nocodazole wash out. n = 3, ≥ 50 cells were analyzed per experimental condition. (G) Frequency and extent of centriole-based microtubule formation in P3-isolated CM and NCM after nocodazole wash out. > 50 cells were analyzed per condition. (H) Representative images of centriole-based microtubule formation as quantitated in (G). Microtubules (acetylated-α-tubulin), Centrioles (Cdk5Rap2). Arrowheads indicate centrioles. (I) Relative frequency of cardiomyocytes with nuclear envelope-based MTOC after Pcnt siRNA-mediated knockdown. Scr: Scramble siRNA. ***: p < 0.005. n = 3, ≥ 100 cells were analyzed per experimental condition.
Figure 3 with 1 supplement

Absence of centrosome integrity results in cell cycle aberrations.
(A) Correlation between proliferative potential (Ki67) and centrosome integrity (split-centrioles). Overlay of the frequency of Ki67-positive E15-, P0-, P3-, or P5-isolated cardiomyocytes in response to 20% fetal bovine serum (FBS) (bars) and the frequency of cardiomyocytes with split-centrioles at different developmental stages according to Figure 1B (red line). (B) Representative images indicating that 20% FBS-stimulated P3-isolated cardiomyocytes (Troponin I) with paired-centrioles (γ-tubulin) exhibited greater proliferative potential (Ki67) than those with split centrioles. Scale bars: 10 µm. (C) Frequency of Ki67-positive P3-isolated cardiomyocytes in response to 20% FBS in the presence or absence of p38 MAP kinase inhibitor (p38i). (D–F) Pericentrin (PCNT) is required for cardiomyocyte proliferative potential. (D) Relative frequency of Ki67-positive P0-isolated cardiomyocytes treated with scrambled or PCNT siRNA in response to 20% FBS. (E) Representative images of 20% FBS-stimulated P0-isolated cardiomyocytes transfected with a construct driving RFP-tagged dominant negative C-terminal Pericentrin (RFP–PeriCT) expression and stained for Ki67. Scale bars: 10 µm. (F) Quantitative analysis of (E). (G, H) Analysis of centrioles (γ-tubulin) during metaphase (H3P). (G) Representative images of P3-isolated cardiomyocytes in metaphase in the presence or absence of p38i upon stimulation with 10% FBS. Scale bars: yellow: 50 µm; red: 10 µm. (H) Quantitative analysis of (G). (I) Representative images of centrioles in adult cardiomyocytes in metaphase stimulated with FGF1 plus p38i. Chromosomes: DAPI. Scale bars: 20 µm. Data are mean ± SD, n = 3, *: p < 0.05. For the experiments ≥ 20 cells (F), ≥ 25 cells (D), ≥ 40 cells (H), or ≥ 50 cells (A, C) were analyzed per experimental condition.
Figure 3—figure supplement 1
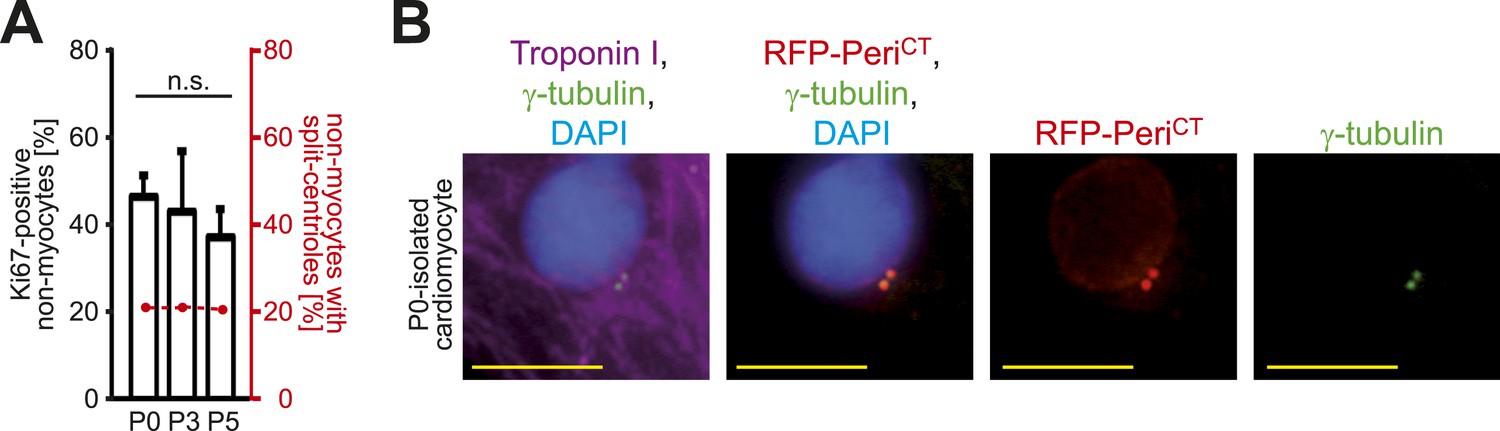
Absence of centrosome integrity results in cell cycle aberrations.
(A) Correlation between proliferative potential (Ki67) and centrosome integrity (split centrioles). Overlay of the frequency of Ki67-positive P0-, P3-, P5-isolated non-myocytes in response to 20% fetal bovine serum (FBS) (bars) and the frequency of non-myocytes with split-centrioles at different developmental stages according to Figure 1B (red line). Data are mean ± SD, n = 3. > 50 cells were analyzed per experimental condition. n.s.: not statistically significant (p > 0.05). (B) Representative images of P0-isolated cardiomyocytes transfected with a construct driving RFP-tagged dominant negative C-terminal Pericentrin (RFP–PeriCT) expression and stained for cardiomyocytes (Troponin I) and centrioles (γ-tubulin). Nuclei were stained with DAPI. Scale bars: 10 µm.
Figure 4 with 1 supplement
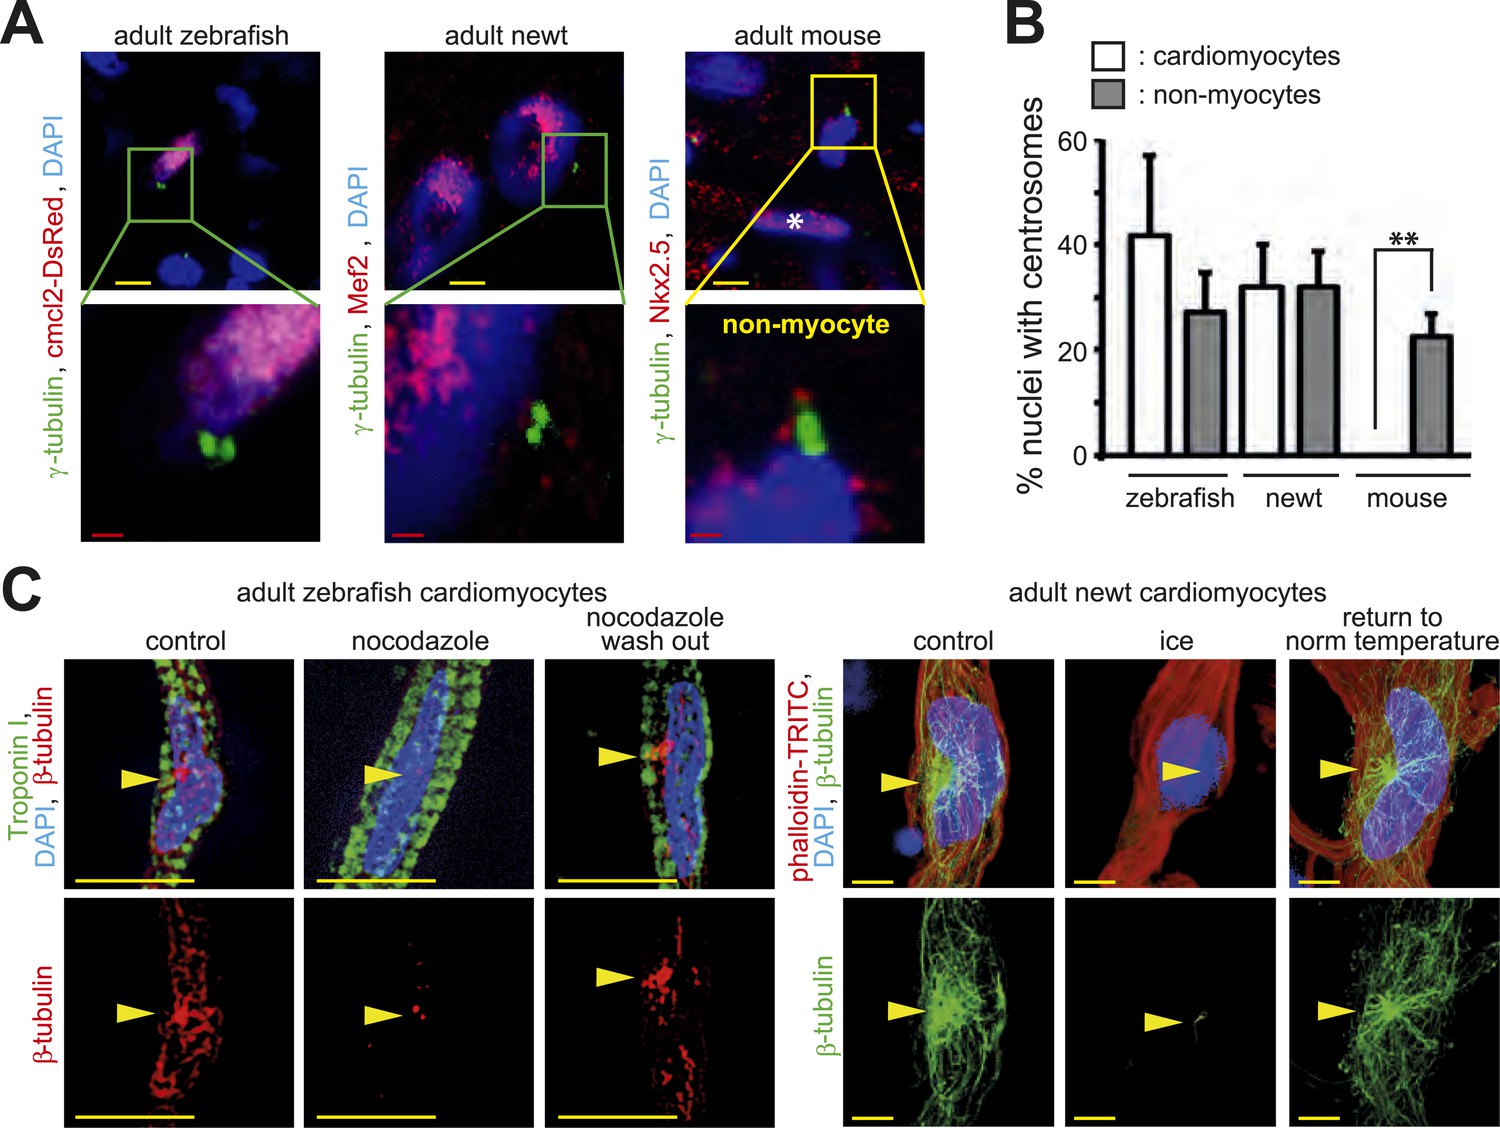
Centrosome integrity is maintained in adult newt and zebrafish cardiomyocytes.
(A) Representative images of centrosomes (γ-tubulin) in heart cryosections of adult transgenic cmlc2:dsRedExp-nuchsc4 zebrafish, of adult newt hearts, and adult mouse hearts. Nuclei: DAPI, cardiac nuclei: DsRed or Nkx2.5. Green-framed expansions: newt and zebrafish cardiomyocyte nuclei with paired-centrioles. Yellow-framed expansion: mouse non-myocyte nucleus with paired-centrioles. White asterisk: cardiomyocyte nucleus. Yellow scale bar: 10 µm. Red scale bar: 2 µm. (B) Quantitative analysis of nuclei associated with intact centrosomes in cryosections as shown in (A). Data are mean ± SD, n = 3, ≥ 300 cells were analyzed per experimental condition, *: p < 0.05. (C) Representative images documenting localization of microtubule regrowth (β-tubulin) in cultured adult zebrafish (Troponin I) and newt (phalloidin-TRITC) cardiomyocytes. Adult zebrafish were treated with serum (control), nocodazole, or nocodazole followed by wash out. Adult newt cardiomyocytes were treated with serum (control), ice, or ice followed by return to normal (norm) temperature. Nuclei: DAPI. Yellow arrowheads: localization of centrosome. Yellow scale bar: 10 µm.
Figure 4—figure supplement 1
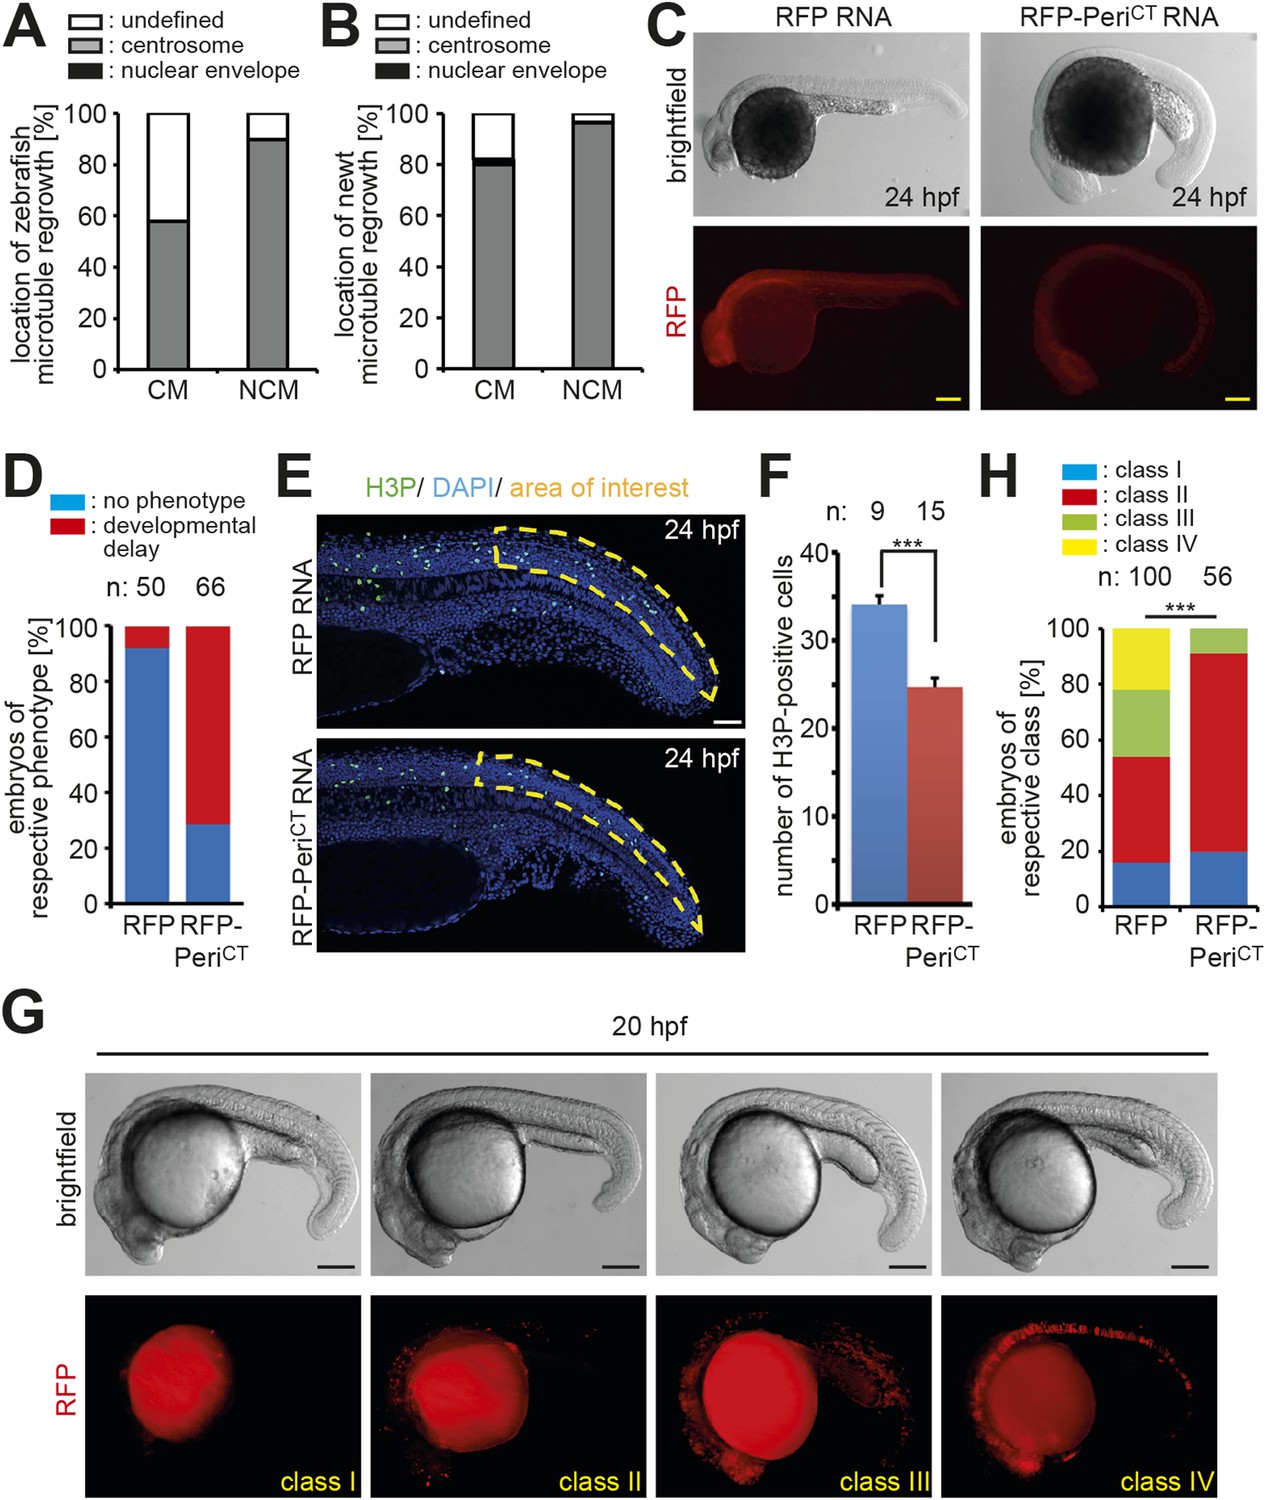
Centrosome integrity is maintained in adult newt and zebrafish cardiomyocytes.
(A) Frequency of MTOC localization in adult zebrafish cardiomyocytes (CM) and non-myocytes (NCM) after nocodazole wash out. Cardiomyocytes from 12 hearts were pooled and 50 CMs and 50 NCMs were analyzed. (B) Frequency of MTOC localization in adult newt CM and NCM after microtubule depolymerization with ice. Cardiomyocytes from 10 hearts were pooled and > 50 CMs and > 50 NCMs were analyzed. (C) Expression of dominant negative Pericentrin (RFP-PeriCT) via RNA injection caused developmental delay in zebrafish embryos at 24 hr post fertilization (hpf) compared to RFP RNA-injected control embryos. (D) Percentage of embryos showing a normal or developmental delayed phenotype in each group. (E) Representative images of RFP and RFP-PeriCT RNA-injected zebrafish embryos stained for mitotic cells (H3P). (F) Quantification of H3P events in the area of interest as defined in (E). (G) Representative images of clone classes in RFP DNA-injected embryos at 20 hpf. (H) Percentages of embryos in different classes in RFP or RFP-PeriCT DNA-injected embryos. Data are mean ± SEM; n = total number of embryos analyzed. ***: p < 0.001. Scale bars: yellow/black: 250 µm; white: 50 µm.
Author response image 1
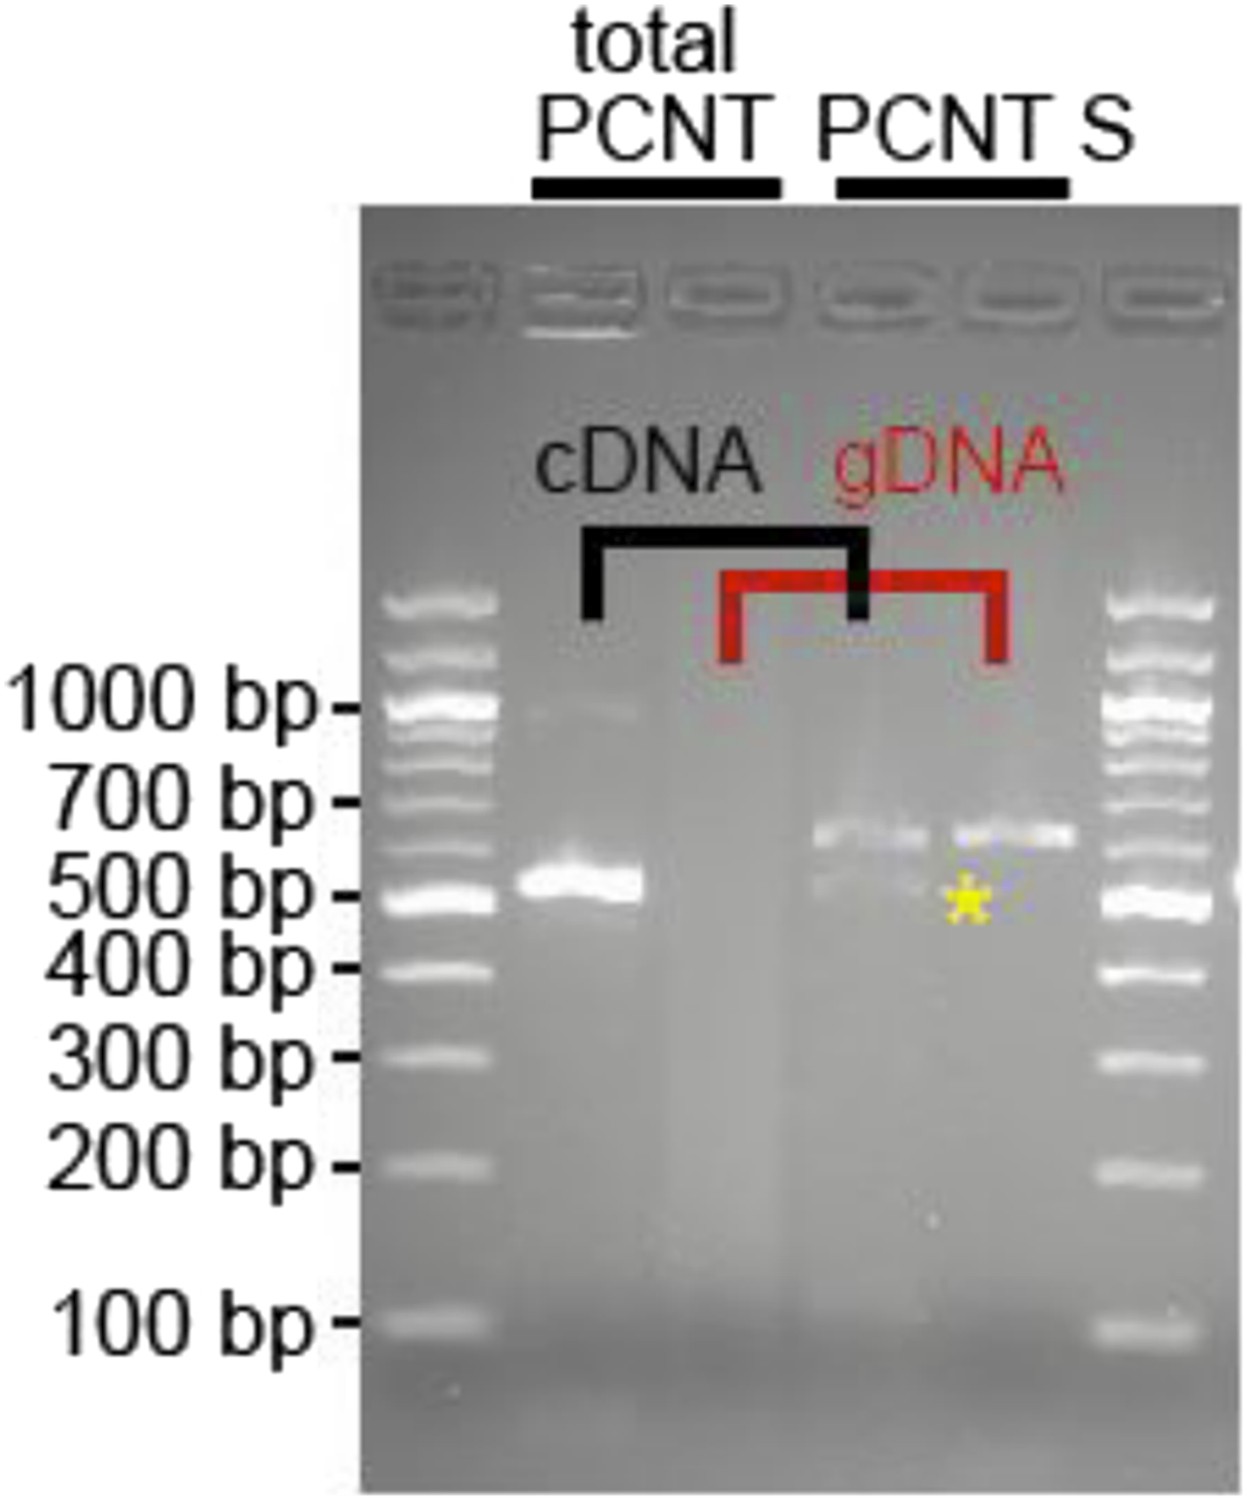
RNA was obtained from adult zebrafish hearts. RT-PCRs were performed to amplify total Pericentrin (should amplify all known isoforms, total PCNT) or only the PCNT S isoform. As control genomic DNA was utilized (gDNA). Yellow star: indicates putative PCNT S.
Additional files
-
Supplementary file 1
Homology analysis of PCNT to determine conserved regions for the identification of PCNT splice isoforms in the adult zebrafish heart.
- https://doi.org/10.7554/eLife.05563.012
Download links
A two-part list of links to download the article, or parts of the article, in various formats.
Downloads (link to download the article as PDF)
Open citations (links to open the citations from this article in various online reference manager services)
Cite this article (links to download the citations from this article in formats compatible with various reference manager tools)
Developmental alterations in centrosome integrity contribute to the post-mitotic state of mammalian cardiomyocytes
eLife 4:e05563.
https://doi.org/10.7554/eLife.05563


