A balance of positive and negative regulators determines the pace of the segmentation clock
- University of Dundee, United Kingdom
Figures
Figure 1

A mathematical model of positive and negative regulation of the somitogenesis clock.
(A) A schematic illustration of inter-cellular coupling via Delta-Notch signalling. (B) A schematic illustration of the reduced model in which the pulsatile production of NICD is down stream of clock gene expression. (C–E) Representative numerical solution of the model Equations (1)-(3). Clock protein (p(t), solid line) and NICD (n(t), dashed line) levels are plotted against time. (C) 'Wild-type' oscillations (k_4 = 0.063), (D) Decreasing NICD decay rate yields longer period oscillations (k_4 = 0.023), (E) Decreasing Hes7 decay rate lowers levels of Hes7 and NICD (k_2 = 0.035). (F) The oscillation period (colour) is plotted against Hes7 and NICD half-lives. (G) NICD level is plotted against Hes7 and NICD half-lives. (H) Oscillator period is plotted against NICD production rate and half-life. (E–G) Solid lines depict emergence of the non-trivial steady-state. Dashed lines depict points in parameter space where the nontrivial steady state undergoes a Hopf bifurcation. Damped Oscillations (DO), Stable Oscillations (SO), No Oscillations (NO). Unless otherwise stated, parameter values are: k1=123 min−1, k2=0.058 min−1, k3=134 min−1, k4=0.063 min−1, T1=44.0 min, T2=67.0 min, KP=125, KN=125.
Figure 2 with 3 supplements
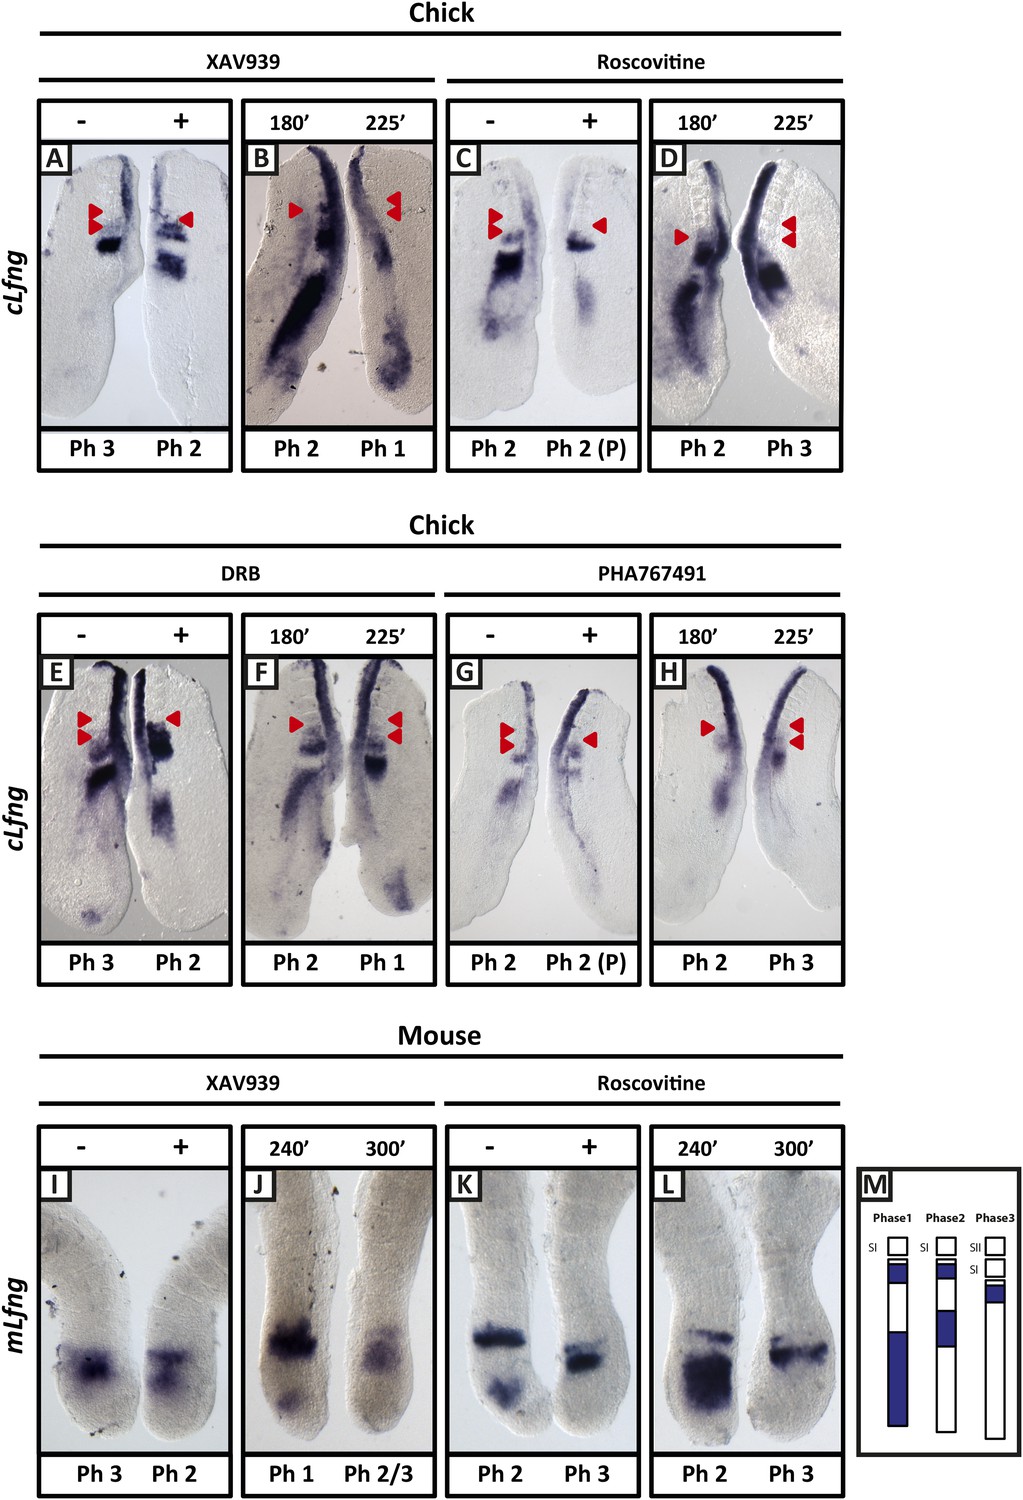
XAV939, Roscovitine, DRB and PHA767491 treatment delays the pace of the segmentation clock in the chick and mouse PSM.
Bissected chick or mouse caudal explant pairs treated ‘−’ or ‘+’ inhibitor (A, C, E, G) or treated with inhibitor and subjected to the fix and culture assay (B, D, F, H) and then analysed by in situ hybridisation for Lfng mRNA expression : (A, C, E, G) Treatment of chick PSM explants in the presence (+) or absence (−) of XAV939 (A), Roscovitine (C), DRB (E) and PHA7667491 (G) for 3 hr reveals that ‘+’ explants have lagging expression of cLfng, often with one less somite formed than the ‘−’ explants. (B, D, F, H): After 3 hr treatment in the presence of XAV393 (B), Roscovitine (D), DRB (F) and PHA767491 (H), one chick PSM explant was fixed while the other was treated for another 45 min, showing that cLfng expression is still dynamic in the presence of these inhibitors. (I, K): Mouse PSM explants treated in the presence or absence of XAV939 (I) or Roscovitine (K) for 4 hr revealed a delay in the oscillations of mLfng expression. (J, L): Treatment of one mouse PSM explant for 4 hr, and the other for 5 hr in the presence of XAV939 (J) or Roscovitine (L) reveals that mLfng mRNA expression is still oscillating in the PSM. The red arrowheads identify the somites that have formed during the in vitro culture period of the assay. (M) Schematic representation of the expression domains of Lfng in the PSM in the three different phases of one oscillation cycle. S1, SII = the most recently formed somite. (P) = previous cycle.
Figure 2—figure supplement 1
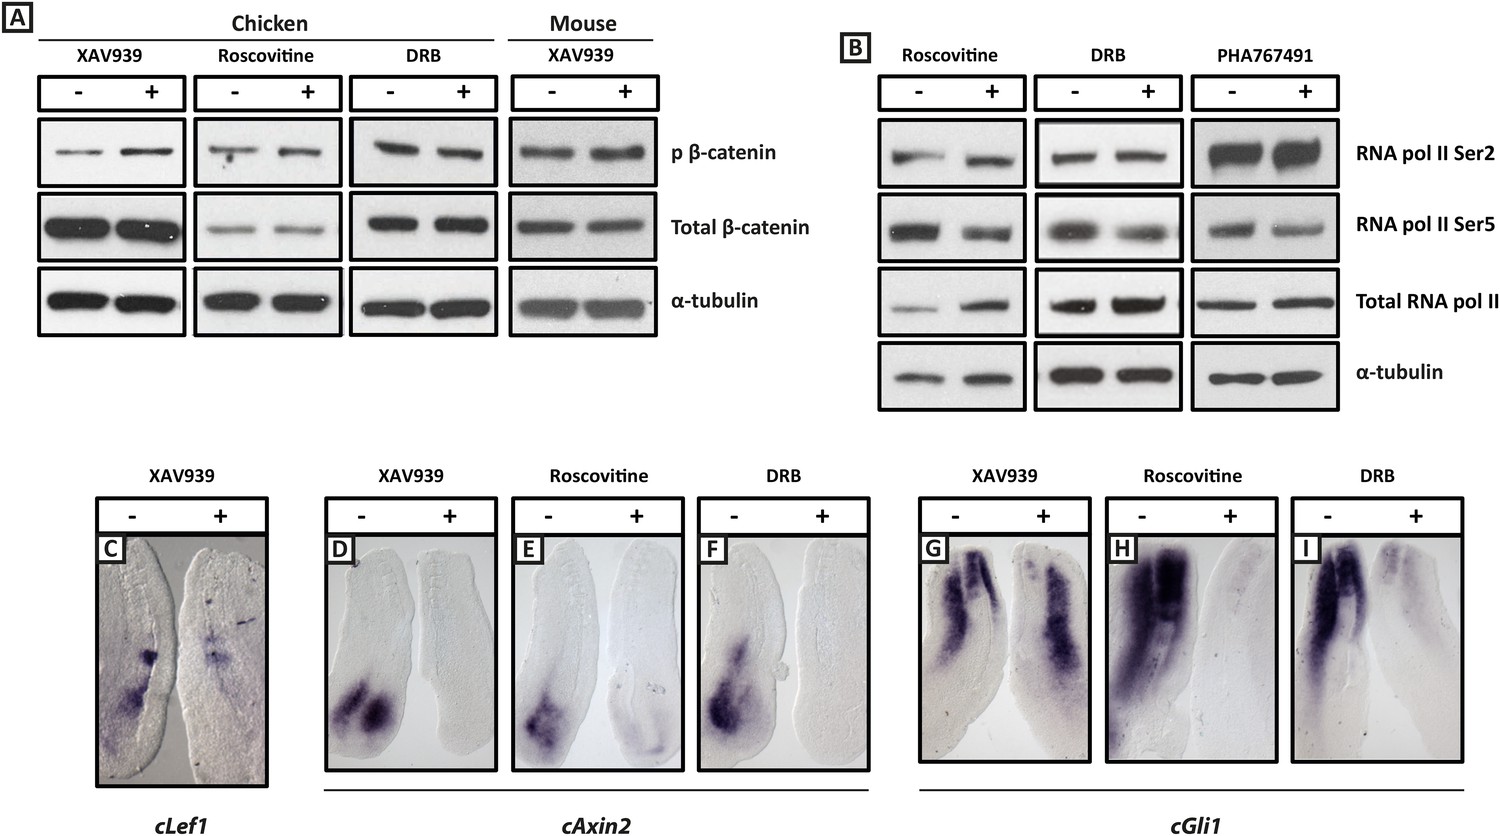
XAV939, Roscovitine, DRB treatment down-regulates expression of the Wnt target Axin2 and the Shh target Gli1 in the chick PSM.
(A): Western Blot analysis of pooled PSM lysates from half PSM explants treated ‘+’ or ‘−’ the inhibitors using antibodies against phosphorylated β-catenin, reveals levels of this form of β-catenin is increased in the chick PSM after 3 hr treatment with XAV939 (mean fold-change = 2.856, p = 0.016), but unaffected after 3 hr treatment with Roscovitine (mean fold-change =1.134, p = 0.617) or DRB (mean fold-change = 0.785). (B): Similar analysis looking at levels of RNA Polymerase which is phosphorylated at Serine 2 (Ser2) reveal this modification appears unaffected by 3 hr treatment with Roscovitine, DRB or PHA767491, but levels of RNA polymerase phosphorylated at Serine 5 (Ser5) are somewhat decreased following this treatment. (C): Bissected chick caudal explant pairs treated ‘−’ or ‘+’ the inhibitors and then analysed by in situ hybridisation show expression of cLef1 is down-regulated after 3 hr treatment in the presence of XAV939 in the chick PSM. (D–F): Expression of the cAxin2 is similarly down-regulated in the chick PSM after 3 hr treatment in the presence of XAV939 (D), Roscovitine (E), or DRB (F). (G–I): Expression of cGli1 is also down-regulated after 3 hr treatment in the presence of XAV939 (G), Roscovitine (H), or DRB (I).
Figure 2—figure supplement 2
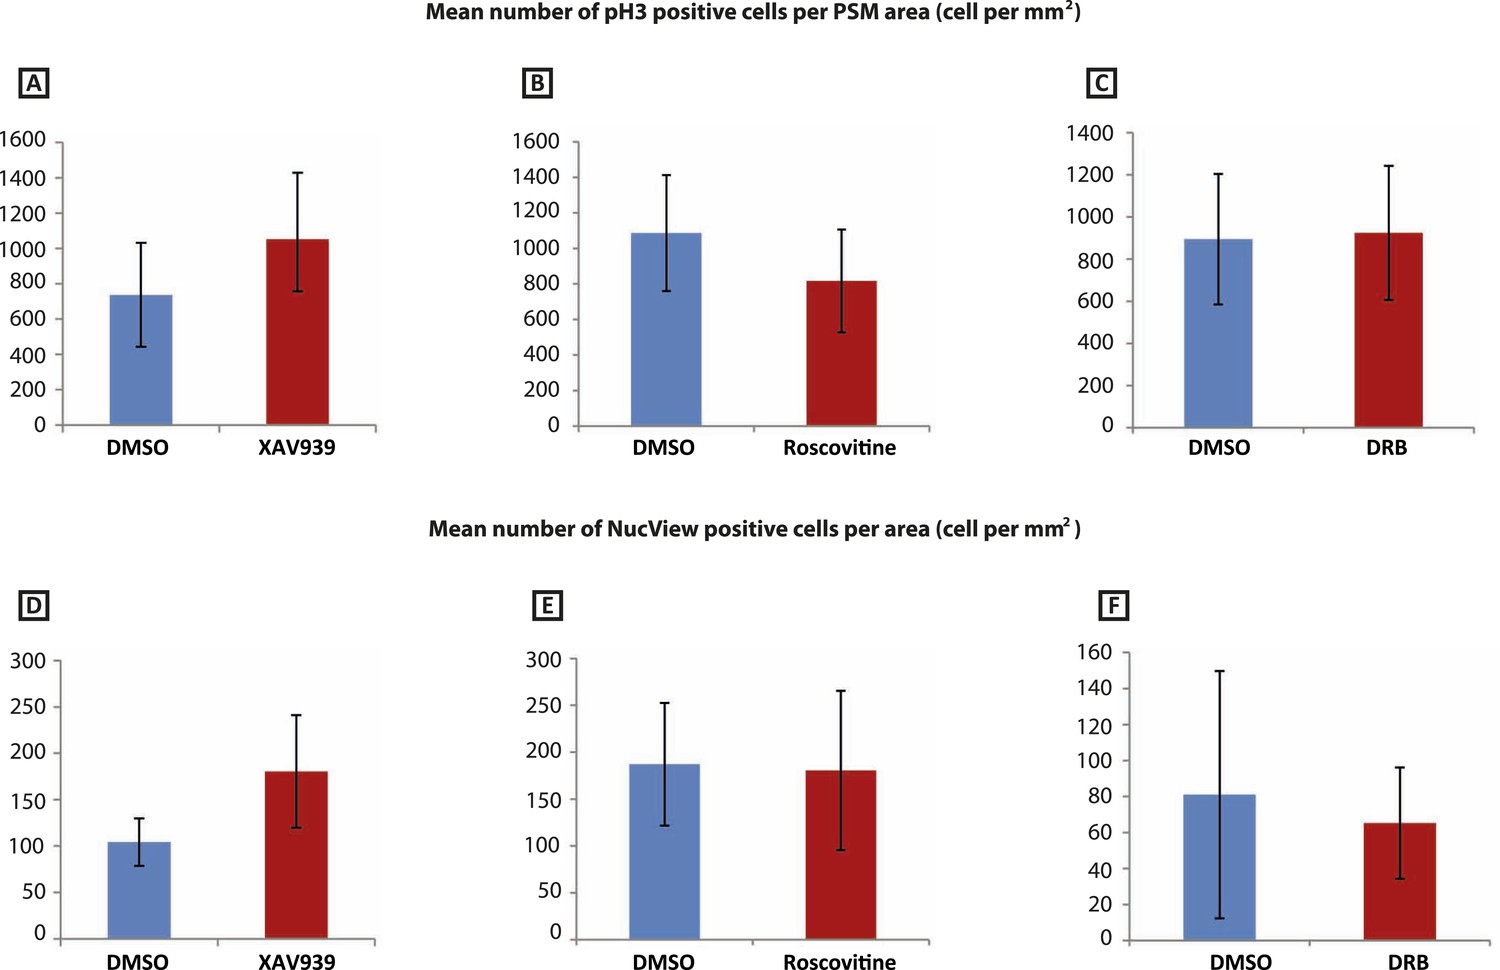
XAV939, Roscovitine, DRB treatment does not induce apoptosis or affect cell proliferation in the chick PSM.
(A–C): Mean numbers of phospho-histone3 (Ph3)-positive cells in the chick PSM are not significantly affected after 3 hr treatment with XAV939 (A), Roscovitine (B), or DRB (C). (D–F): Mean numbers of NucView-positive cells in the in the chick PSM are not significantly affected after 3 hr treatment with XAV939 (D), Roscovitine (E), or DRB (F).
Figure 2—figure supplement 3
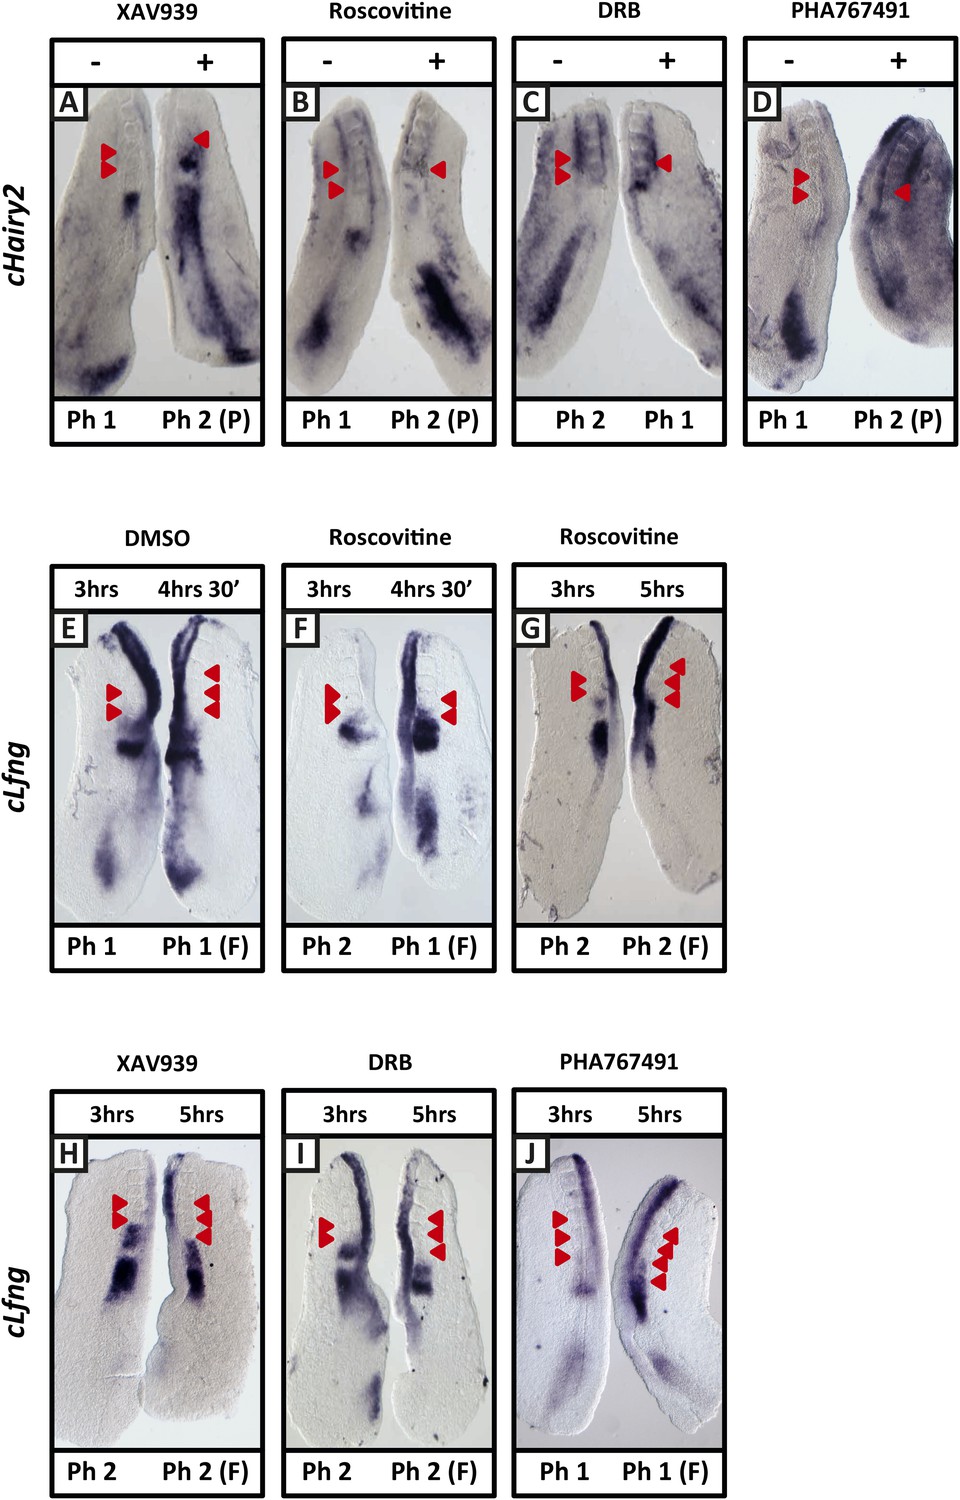
XAV939, Roscovitine, DRB and PHA-767491 treatment delays dynamic mRNA expression of Notch target clock genes in the chick PSM thereby extending the clock period.
(A–D): Bissected chick caudal explant pairs treated ‘−’ or ‘+’ the inhibitors and then analysed by in situ hybridisation for the Notch target gene cHairy2 reveals cHairy2 mRNA expression is delayed in the treated side as compared to the control after 3 hr treatment with XAV939 (A), Roscovitine (B), DRB (C), PHA-767491 (D). (E–J): Bissected chick caudal explant pairs treated for 3 hr ‘−’ or ‘+’ the inhibitors and then subjected to fix and culture where the cultured side is cultured for 90 min (E, F) or 2 hr (G–J) and then analysed by in situ hybridisation for cLfng mRNA expression. Red arrows indicate newly formed somites from the beginning of treatment.
Figure 3
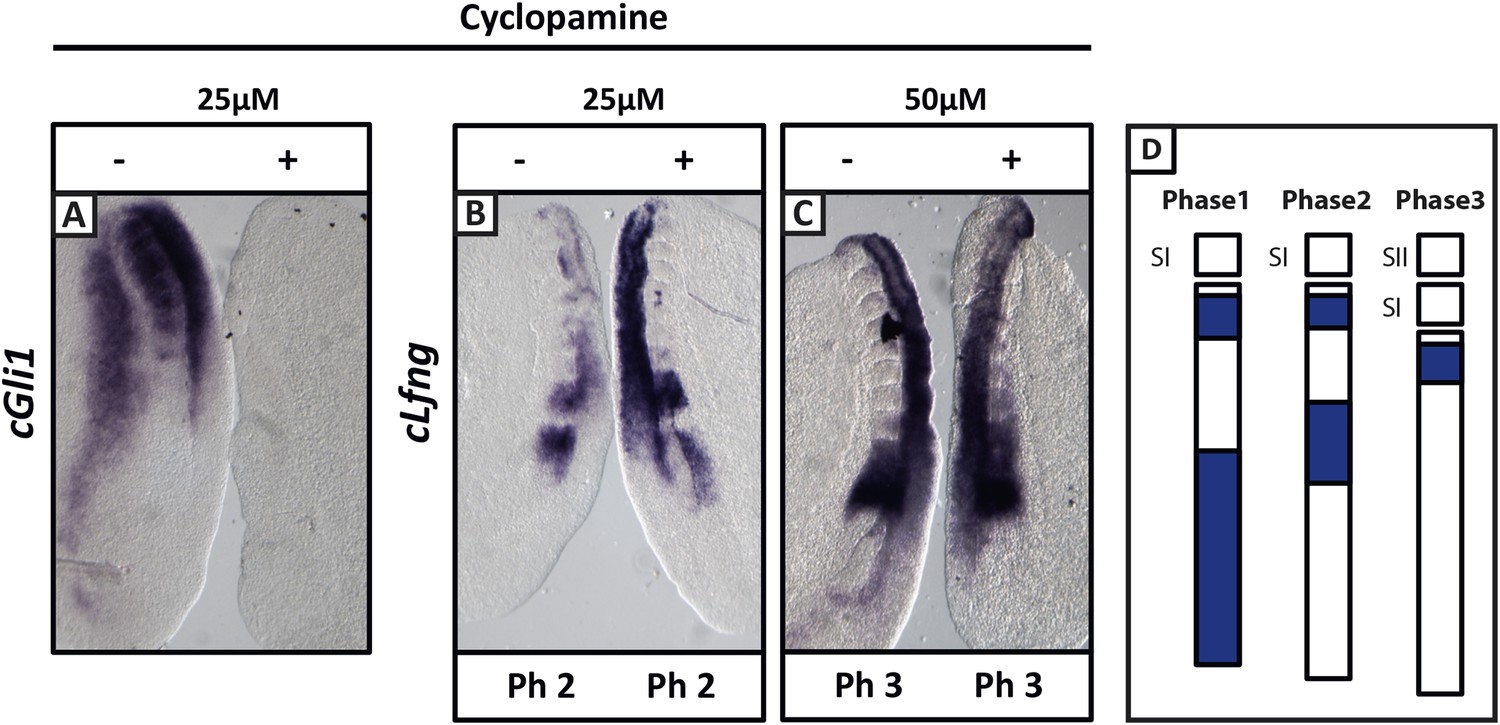
Cyclopamine treatment does not affect the pace of cLfng oscillations in the chick PSM.
Bissected chick caudal explant pairs treated ‘−’or ‘+’ cyclopamine and then analysed by in situ hybridisation for Lfng or Gli1 mRNA expression. (A): At 25 µM, cyclopamine inhibits expression of the Shh target gene cGli1 in the chick PSM after 3 hr treatment. (B, C): The expression domains and intensity of cLfng mRNA are the same in the PSM of the ‘−’ or ‘+’ cyclopamine halves of each embryo and there is no difference in the number of somites in each half of a pair thus we conclude the pace of Lfng oscillation is not affected by cyclopamine treatment for 3 hr at either 25 µM (B) or 50 µM (C). (D) Schematic representation of the expression domains of Lfng in the PSM in the three different phases of one oscillation cycle. S1, SII = the most recently formed somite.
Figure 4 with 1 supplement
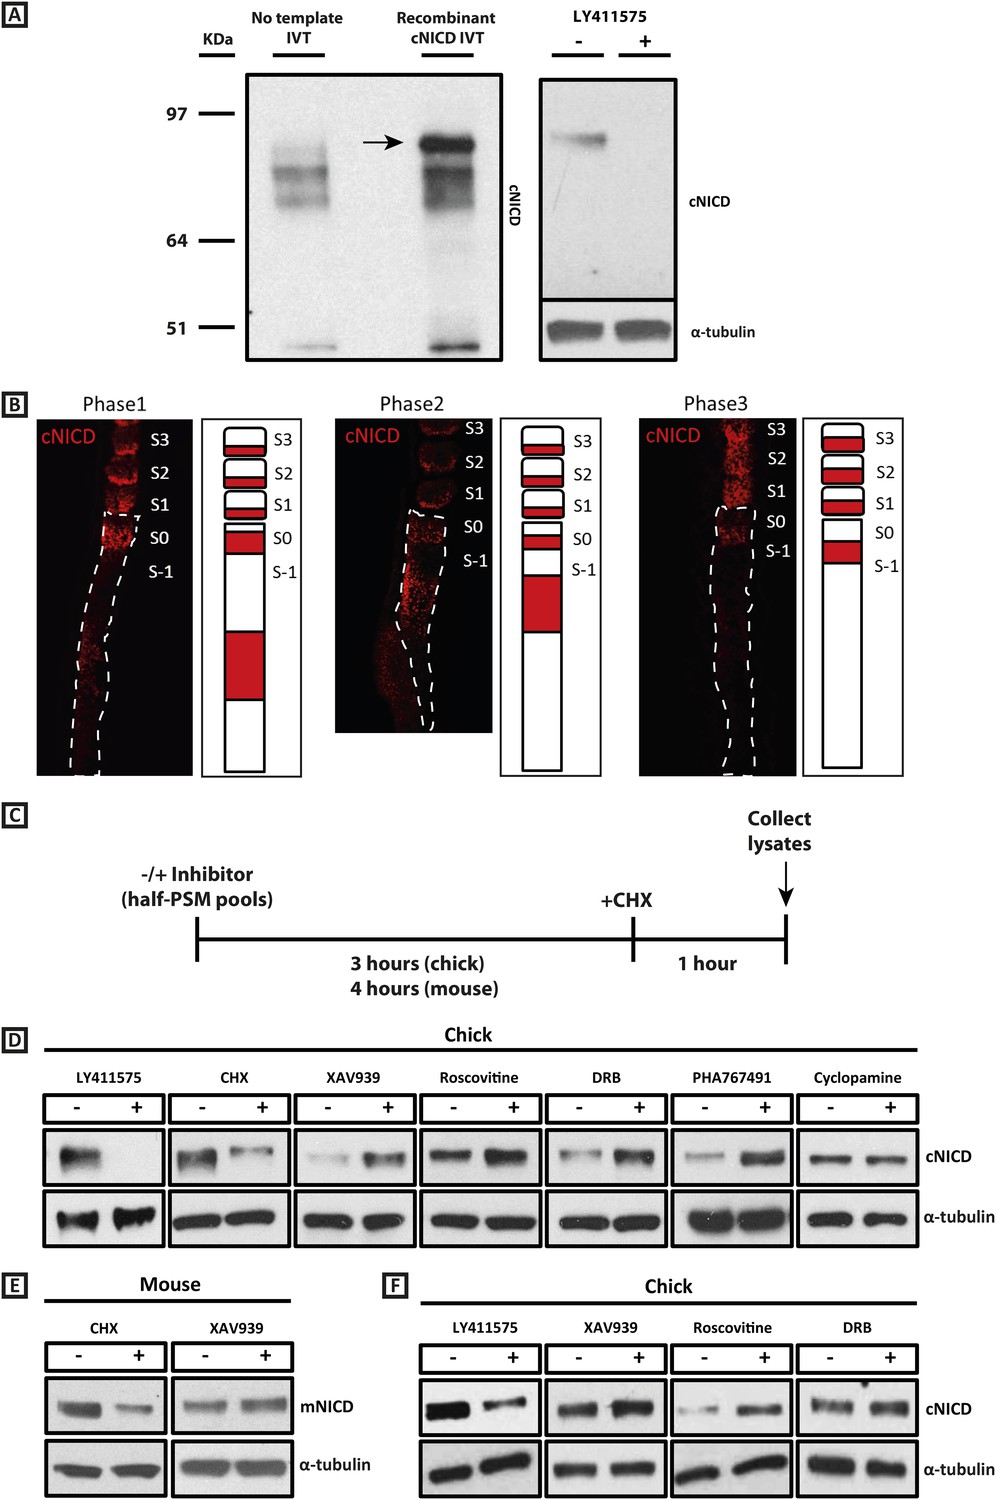
cNICD levels in the chick PSM are elevated after exposure to XAV939, Roscovitine, DRB or PHA767491.
(A): A polyclonal cNICD antibody was raised against the N-term sequence of the cleaved chicken Notch1 intracellular domain. The epitope is only exposed after gamma secretase cleavage and is not accessible in the uncleaved form. By Western Blot analysis the antibody detects a band of protein at around 90KDa (see arrow) in an in vitro-generated recombinant cNICD sample, which is not detected in the control IVT sample; this band disappears in half chick PSM pools (see ‘Materials and methods’) after 3 hr treatment with 150 nM LY411575, a concentration shown previously to have no toxic effects to PSM tissue (Bone et al., 2014). (B): Immunohistochemistry for cNICD protein on 16 μm sagittal sections of sucrose agar embedded HH10 chicken embryo tails showing dynamic phases of localisation in the PSM and schematic representations to the right of each panel. S1 - S3 = somite; S0 - S-1 = prospective somite region of anterior PSM. (C): A schematic illustrating the cNICD degradation assay: corresponding pools of 9 PSM explants are incubated in the presence or absence of an inhibitor for 3 (chick) or 4 hr (mouse), before treating all pools with the protein synthesis inhibitor cycloheximide (CHX) for a further hour. Lysates are then collected for Western Blot analysis. (D): Representative Western Blot showing levels of cNICD protein in lysates of chick PSM pools are increased after treatment with XAV939, Roscovitine, DRB and PHA767491, but not with cyclopamine. Lanes 1 and 2 show exposure to 150 nM LY411575 alone for 3 hr removes all NICD and serves as a control for the western. Lanes 3 and 4 show exposure to CHX alone in the last hour of culture severely depletes NICD levels as compared to NICD levels in the pool of contralateral PSM explants cultured in DMSO. (E): Levels of mNICD in the mouse PSM pools are increased following treatment with XAV939. Lanes 1 and 2 show that NICD protein levels drop drastically after exposure for 1h to CHX as compared to strong NICD signal in lysate from the contralateral half PSMs treated with EtOH. (F): Representative Western Blot showing levels of cNICD protein in lysates of chick PSM pools are increased after treatment with XAV939, Roscovitine and DRB when LY411575 is added to the culture for the last hour (in place of CHX). Lanes 1 and 2 show exposure to LY411575 alone only in the last hour severely depletes NICD levels as compared to the NICD levels in the pool of contralateral PSM explants cultured in DMSO.
Figure 4—figure supplement 1
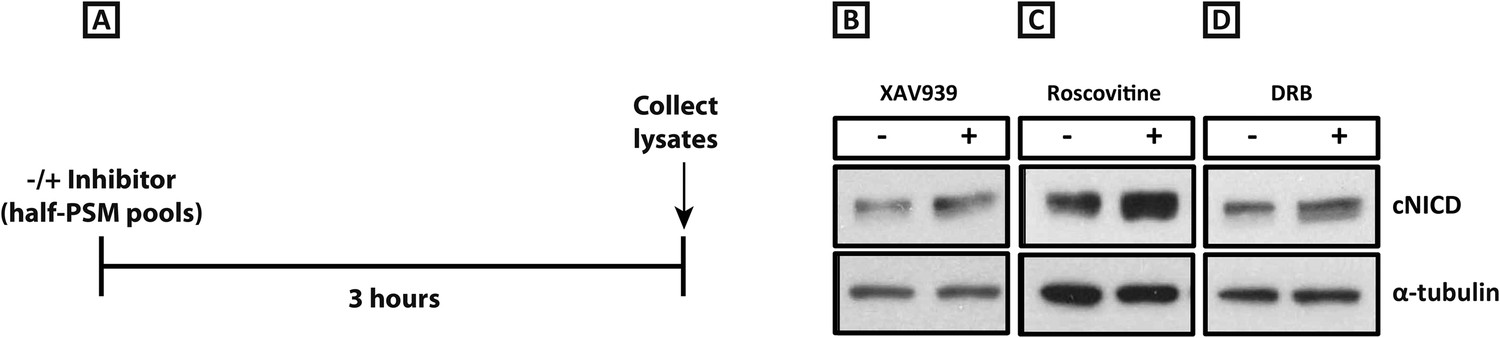
XAV939, Roscovitine, and DRB treatment increases the level of cNICD in the chick PSM.
(A): A schematic showing the degradation assay notably without the cycloheximide step described in the assay for Figure 4: pools of 9 explants were treated either in the presence or absence of inhibitors for 3 hr before lysis. (B–D): After the treatment depicted in (A), Western Blot analysis revealed levels of cNICD are elevated in chick PSM explant pools after treatment with XAV939, p = 0.0361 (B), Roscovitine, p = 0.00653 (C), or DRB, p = 0.00601 (D) relative to their respective DMSO control treated pools.
Figure 5

Length of newly formed somites are increased following long-term treatment with inhibitors.
(A–C): Graphs showing log base 2 (fold) changes in 2 consecutive somite length ratios between the average somite lengths for the first (+1), second (+2), and third (+3) formed somites following treatment initiation in the presence of DMSO, XAV939, Roscovitine, PHA767491 or DRB. T-tests were performed to test the null hypothesis that the mean somite length ratio is the same as in DMSO controls. The null hypothesis was rejected in the starred cases (p < 0.005) with the following p values XAV = 0.0211; Rosc = 0.0002; Pha = 0.0001; DRB = 0.0007 (D–H) Bissected chick caudal explant pairs subjected to the fix and culture assay after 6 hr treatment in the presence of DMSO, XAV939, Roscovitine, PHA767491 or DRB. In each case the cultured side showed cLfng expression had advanced. (I–M) In situ hybridisation of cTbx6 on whole embryos following 6 hr treatment in the presence of either DMSO, XAV939, Roscovitine, PHA767491 or DRB. Asterix = newly formed somite(s) during culture, line = length of most recently formed somite, scale bar = 100 μm. (N–R) High magnification image of the samples in (I–M). XAV939 treated embryos do not form as clearly defined boundaries as the other inhibitor treated embryos. (F) = following cycle.
Figure 6 with 1 supplement
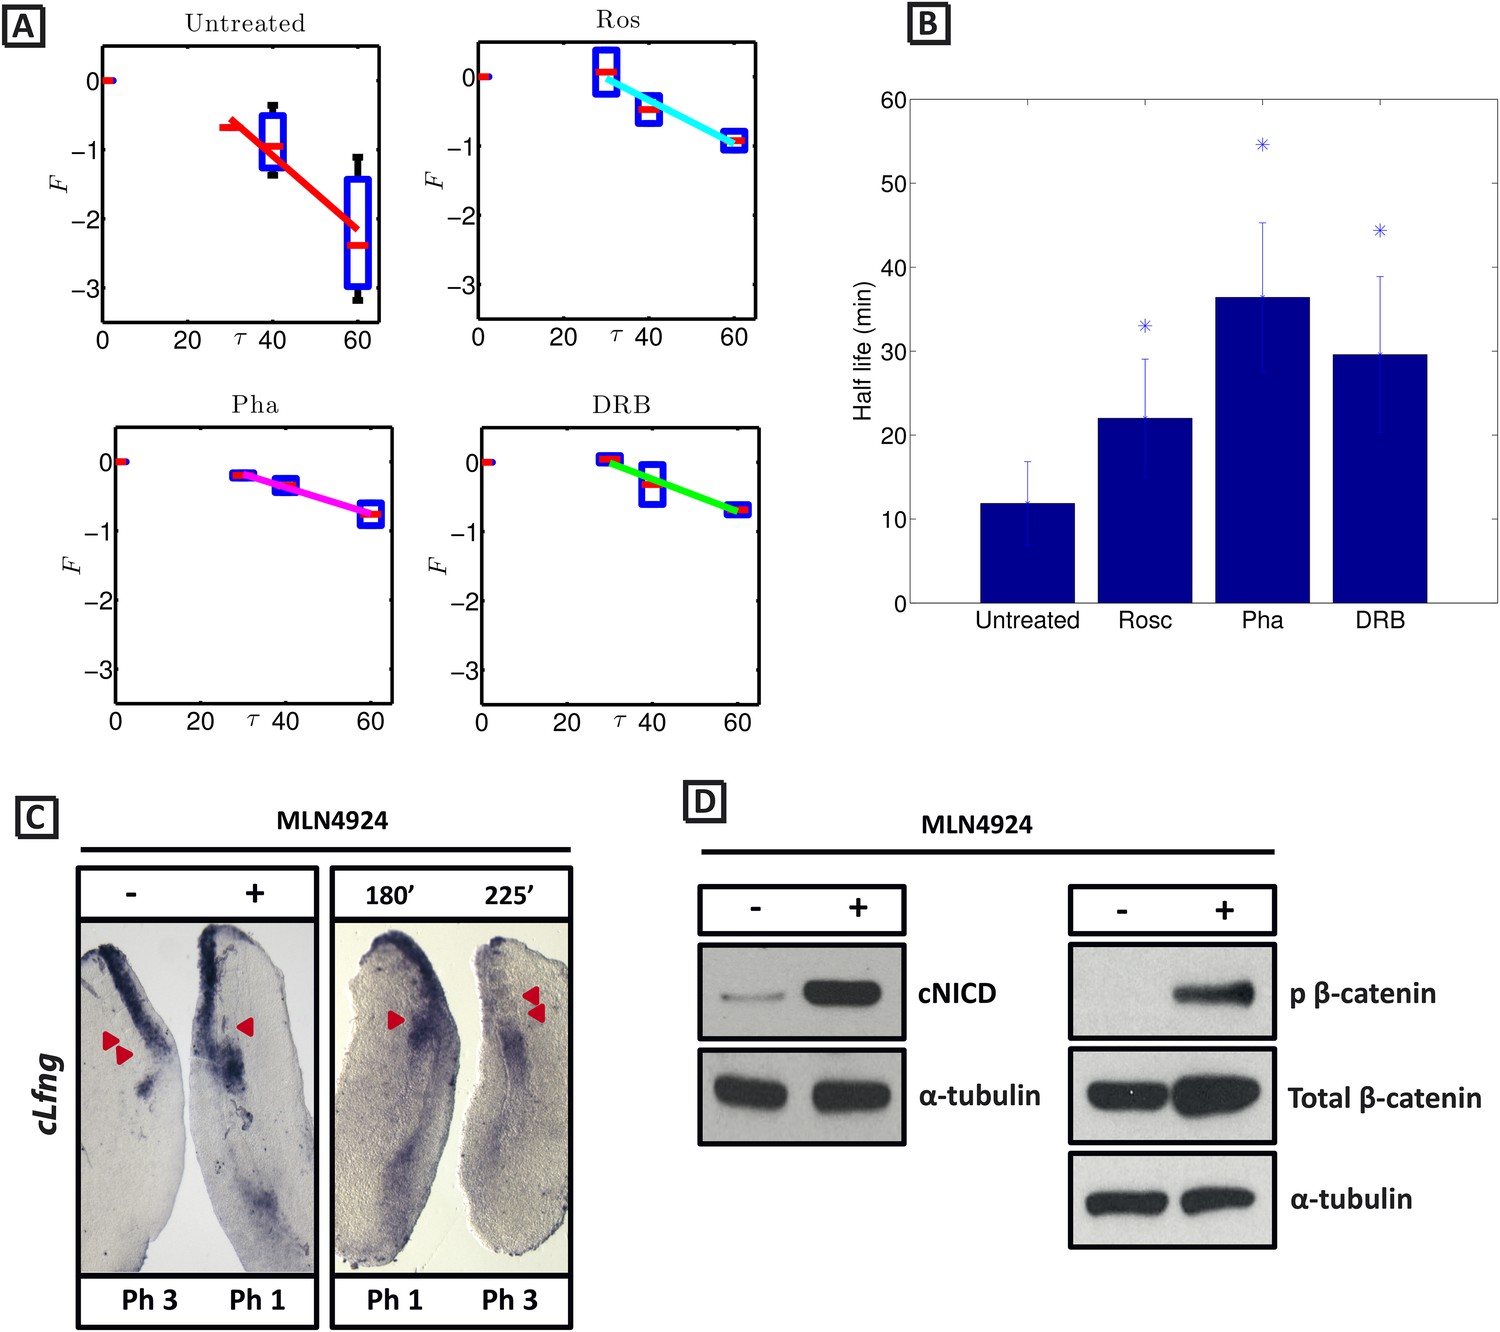
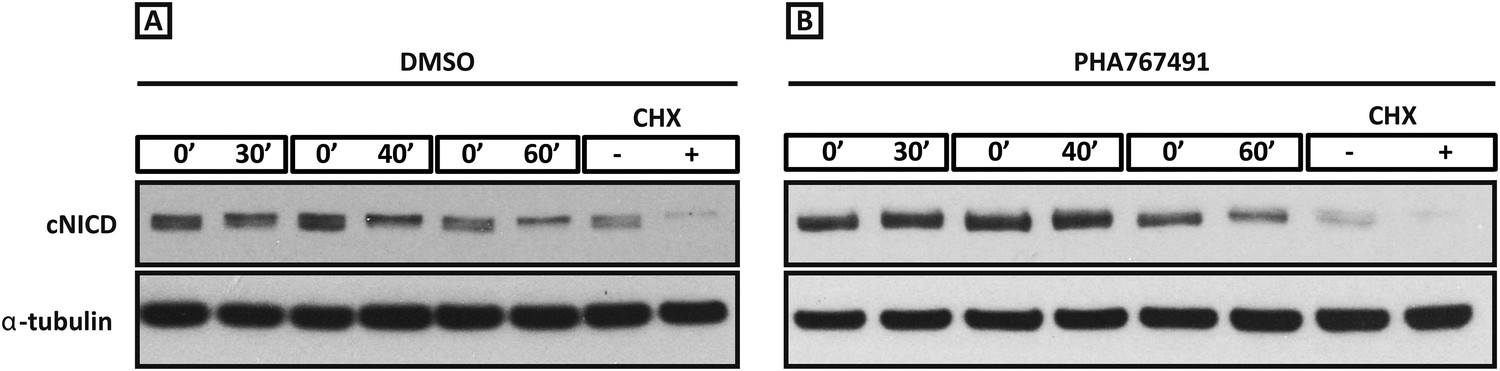
cNICD half-life in the PSM is increased after exposure to Roscovitine, DRB and PHA-767491.
(A): Endogenous cNICD levels analysed by Western Blot (after normalisation to alpha tubulin loading control) in PSM explants cultured initially in the presence of each reagent for 3 hr and subsequently in the presence of inhibitor plus cycloheximide for an additional 30 min before the time-course. Panels show log transformation on repeated data. The half life is proportional to the inverse of the inferred slope (Equation [4]). (B) Bar chart showing the half-life of cNICD in each condition. Asterix represents statistically significant differences p < 0.05. (C) Left Panel: Treatment in the presence (+) or absence (−) of MLN4924 for 3 hr reveals that the inhibitor treated explant has lagging expression of cLfng compared to the control contralateral explant. Right panel: After 3 hr in the presence of MLN4924 one PSM explant was fixed while the other was treated for another 45 min, showing cLfng expression is still dynamic in the presence of this inhibitor. (D) Following the assay described in Figure 4, levels of cNICD, normalised to levels of alpha tubulin, in the chick PSM pools are highly increased in the presence of MLN4924. Western Blot analysis of pooled PSM lysates from half PSM explants treated ‘+’ or ‘−’ MLN4924 reveals levels of phosphorylated β-catenin are increased in the chick PSM after 3 hr treatment with MLN4924.
Figure 6—figure supplement 1
Roscovitine, PHA-767491 and DRB treatment increases the level of cNICD in the chick PSM.
Figure 6—figure supplement 1(A–B): Western Blot analysis to monitor the decay of cNICD protein: after 3 hr treatment with the reagents the pools of 9 explants were exposed to cycloheximide for 30 min to inhibit new protein synthesis, and subsequently the decay of cNICD protein was monitored whereby one pool was removed from culture and protein lysate prepared while the corresponding pool was cultured for an additional 30–60 min before lysate also prepared. The +/− lanes with Cycloheximide (CHX) show that levels of cNICD fall dramatically in the absence of de novo protein synthesis in the presence of this reagent.
Figure 7
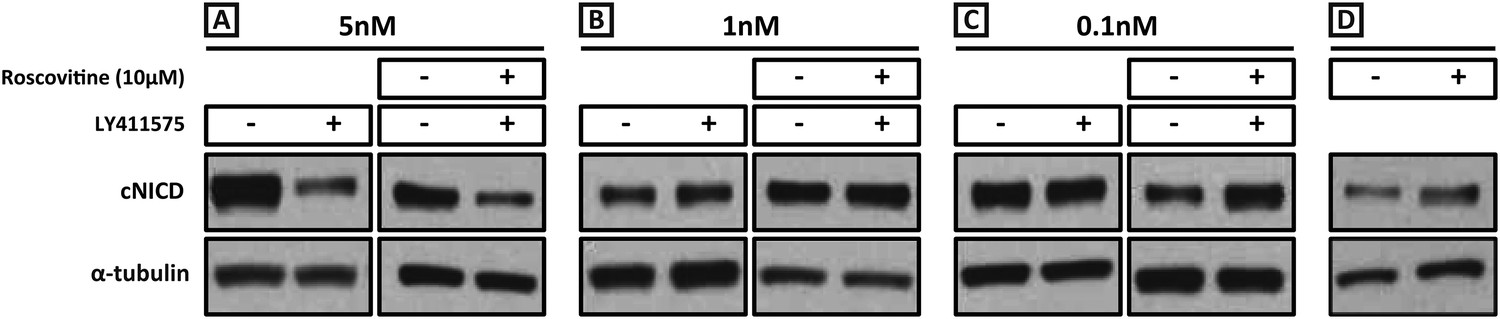
Exposure to 1 nM LY411575 rescues the increased levels of cNICD caused by 10 μM Roscovitine.
Endogenous cNICD levels analysed by Western Blot (after normalisation to alpha tubulin loading control) in PSM explant pools cultured for 3 hr in the presence (+) or absence (−) of (A) 5 nM LY411575 (lane 1,2); 10 μM Roscovitine together with 5 nM LY411575 (lane 3,4) or (B) 1 nM LY411575 (lane 1,2); 10 μM Roscovitine together with 1 nM LY411575 (lane 3,4) or (C) 0.1 nM LY411575 (lane 1,2); 10 μM Roscovitine together with 0.1 nM LY411575 (lane 3,4) (D) or 10μM Roscovitine alone.
Figure 8 with 1 supplement

Exposure to 1 nM LY411575 rescues the delay in clock gene oscillations caused by Roscovitine, DRB and XAV939.
Bissected chick or mouse caudal explant pairs treated ‘−’ or ‘+’ inhibitor and then analysed by insitu hybridisation for Lfng mRNA expression: (A–C) Treatment of chick PSM explants in the presence (+) or absence (−) of 5 nM LY411575 (A), 1 nM LY411575 (B), 0.1 nM LY411575 (C) for 3 hr reveals that 5 nM LY411575 severely downregulates cLfng expression whereas 1 nM and 0.1 nM do not appear to change levels or domain of cLfng expression. (D–F): Treatment of chick PSM explants in the presence (+) or absence (−) of Roscovitine (D), DRB (E) or XAV939 (F) for 3 hr reveals that ‘+’ explants have lagging expression of cLfng, with one less somite formed than the ‘−’ explants. (G–I): Treatment of chick PSM explants in the presence (+) or absence (−) of 1 nM LY411575 together with Roscovitine (G), DRB (H) or XAV939 (I) for 3 hr reveals that 1 nM LY411575 rescues the delay in clock gene oscillations caused by these three inhibitors such that the cLfng expression domains in the ‘−’ and ‘+’ explants are very similar. The red arrowheads identify the somites formed during the in vitro culture period of the assay. (P) = previous cycle.
Figure 8—figure supplement 1
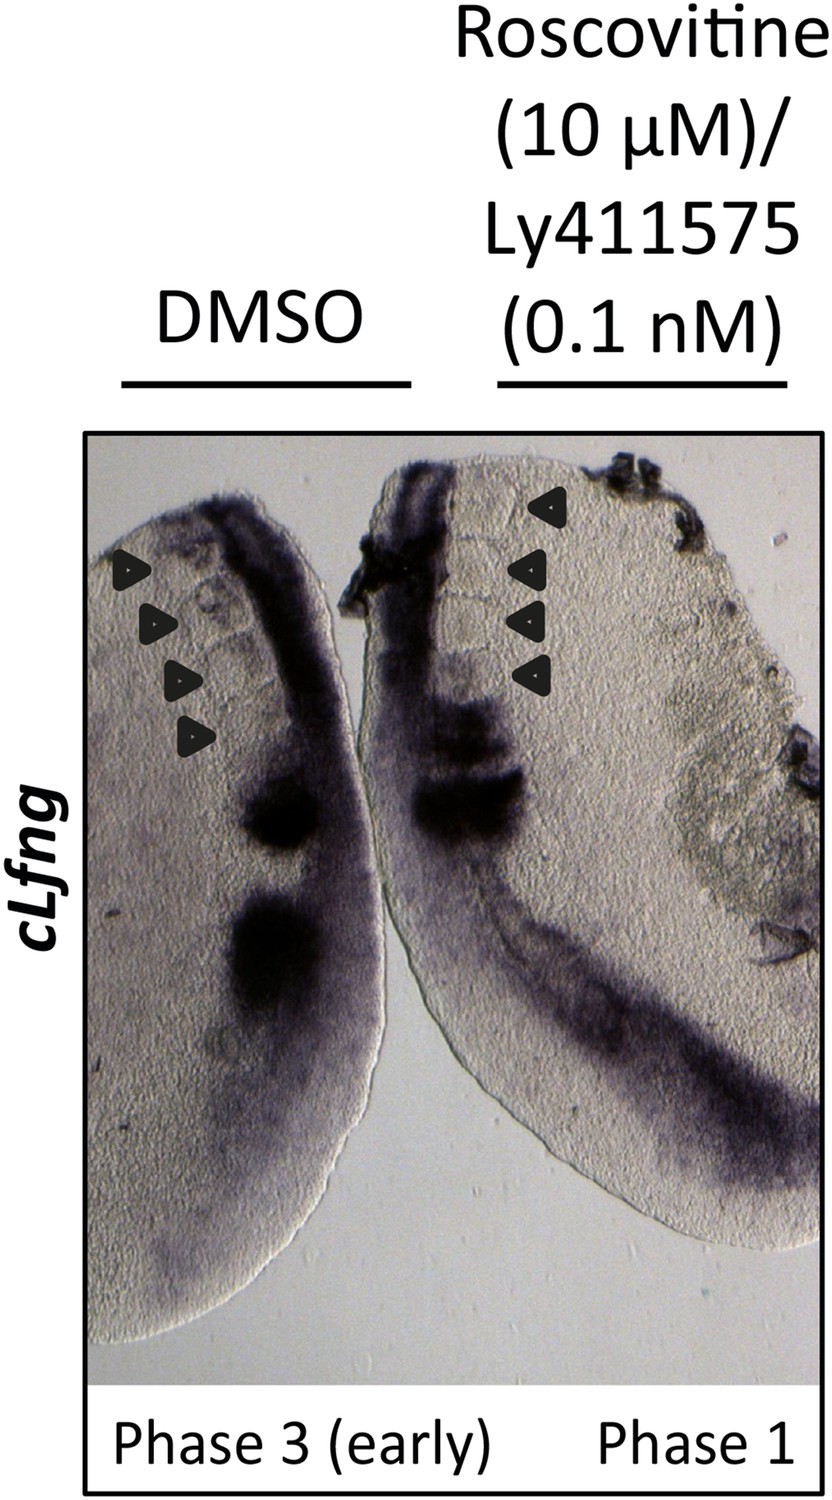
0.1 nM LY411575 does not rescue the delay in oscillation caused by Roscovitine.
Bissected chick caudal explant pair treated ‘−’ or ‘+’ 10μM roscovitine and 0.1 nM LY411575 and then analysed by in situ hybridisation for the Notch target gene cLfng reveals cLfng mRNA expression is delayed in the treated side as compared to the control after 3 hr treatment. Black arrows indicate somites.
Figure 9
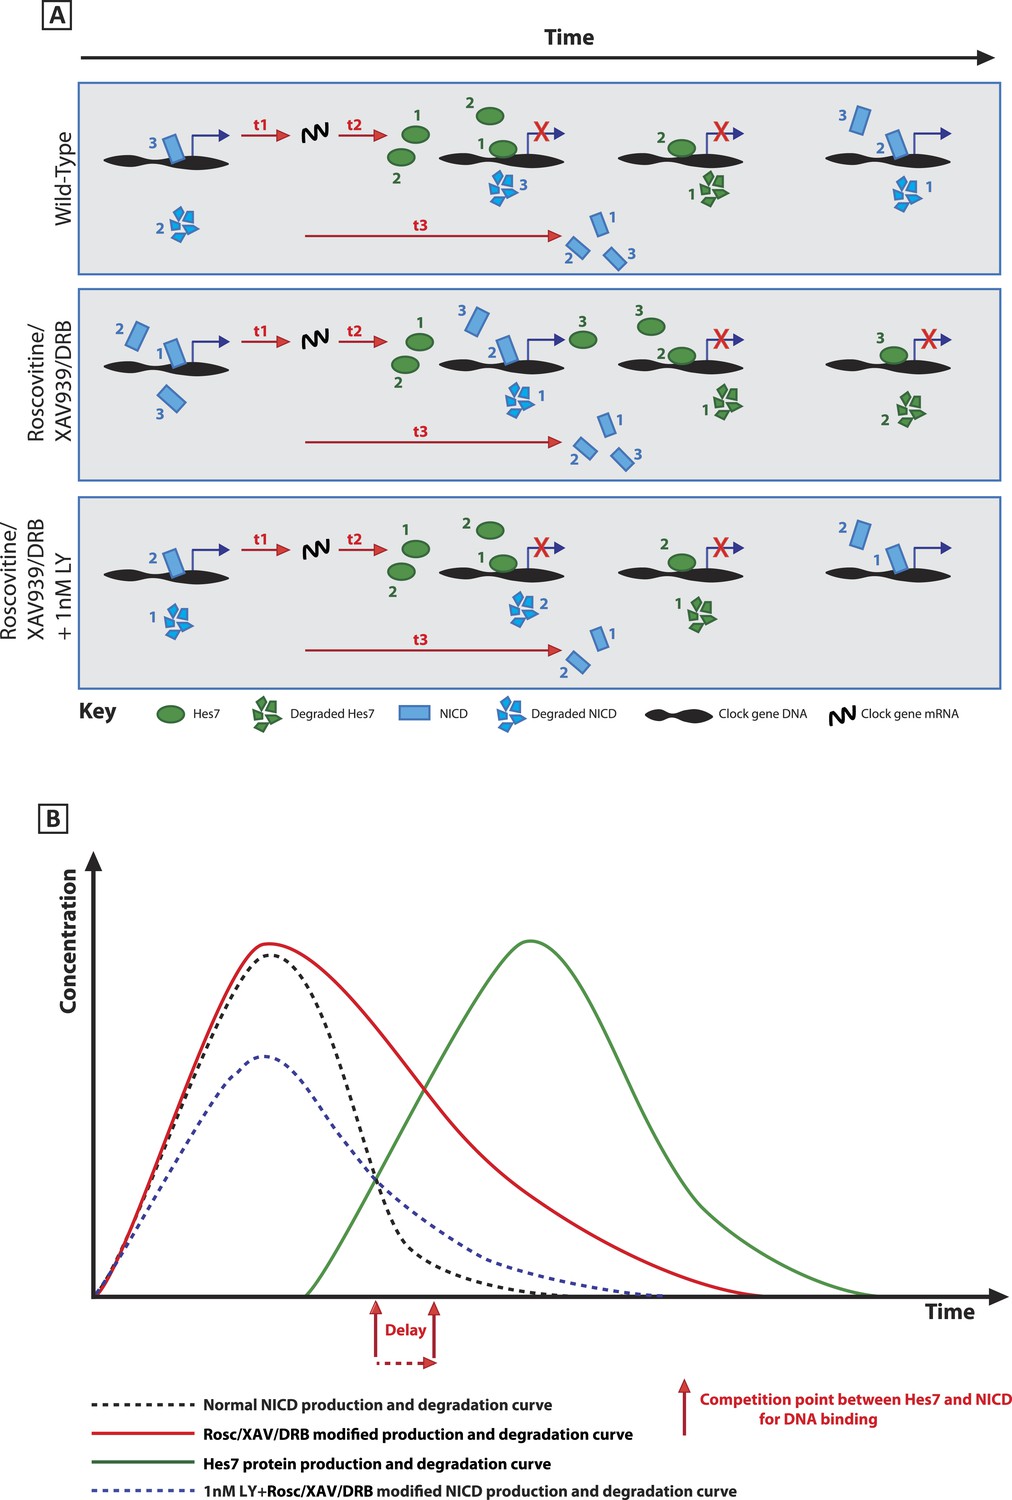
A schematic illustration depicting how modification of NICD stability may cause a delay to the period of the oscillations.
(A) Schematic showing the competition between molecules of Hes7 and NICD for binding to the promoter of a clock gene. Exposure to Roscovitine, XAV939 or DRB causes increased stability and levels of NICD and thus NICD occupies the promoter for longer than in the wild-type situation, thereby prolonging the oscillation period. Exposure to 1 nM LY411575 together with Roscovitine, XAV939 or DRB reduces the level of NICD production offsetting the increased stability which rescues the delay. t1 = delay due to transcription of Hes7 and Notch; t2 = the delay due to translation of Hes7; t3 = delay due to translation of Notch and subsequent ligand dependent production of NICD. (B) Graphical model depicting how modifying the stability of NICD may cause a delay to the period of the oscillations by delaying the time-point at which proportional levels of NICD and Hes7 allow switching of promoter occupancy of these two factors.
Tables
Table 1
Summary table of densitometry quantifications for cNICD and mNICD in inhibitor assays
| Treatment | N | Mean adjusted relative fold change of cNICD protein | ± standard error of the mean | Statistical test | p-value |
|---|---|---|---|---|---|
| XAV939 | 9 | 3.078 | ±0.776 | One-sample T-test | 0.0280* |
| XAV939 (no CHX) | 5 | 2.491 | ±0.480 | One-sample T-test | 0.0361* |
| Roscovitine | 10 | 1.94 | ±0.255 | One-sample Signed Rank test | 0.002* |
| Roscovitine (no CHX) | 7 | 1.594 | ±0.146 | One-sample T-test | 0.00653* |
| DRB | 8 | 2.557 | ±0.702 | One-sample Signed Rank test | 0.008* |
| DRB (no CHX) | 6 | 1.369 | ±0.081 | One-sample T-test | 0.00601* |
| Cyclopamine | 2 | 1.263 | ±0.106 | One-sample T-test | 0.244 |
| PHA767491 | 2 | 3.479 | ±0.451 | One-sample T-test | 0.115 |
| MLN4924 | 3 | 8.831 | ±2.734 | One-sample T-test | 0.103 |
| Treatment | N | Mean adjusted relative fold change of mNICD protein | ± Standard error of the mean | Statistical test | p-value |
|---|---|---|---|---|---|
| XAV939 | 8 | 2.221 | ±0.396 | One-sample signed rank test | 0.008* |
-
*
demarcates a statistically significant difference.
-
Densitometry was performed on Western Blots and the fold change of cNICD or mNICD in the + inhibitor treated sample relative to the corresponding DMSO control was adjusted to the relative change in the tubulin loading control. The given statistical test was used to compare the average value for each assay to a fixed fold-change value = 1 (i.e. no change) and a p-value obtained.
Additional files
-
Supplementary file 1
This file contains further analysis of the mathematical model and notes on parameter identification.
- https://doi.org/10.7554/eLife.05842.019
Download links
A two-part list of links to download the article, or parts of the article, in various formats.
Downloads (link to download the article as PDF)
Open citations (links to open the citations from this article in various online reference manager services)
Cite this article (links to download the citations from this article in formats compatible with various reference manager tools)
A balance of positive and negative regulators determines the pace of the segmentation clock
eLife 4:e05842.
https://doi.org/10.7554/eLife.05842


