Paracrine Met signaling triggers epithelial–mesenchymal transition in mammary luminal progenitors, affecting their fate
- Institut Curie, Paris Sciences et Lettres Research University, France
- Subcellular Structure and Cellular Dynamics - Institut Curie, France
- Equipe Labellisée par La Ligue contre le Cancer, France
- Karlsruhe Institute of Technology, Germany
- CIC bioGUNE, Spain
- Baylor College of Medicine, United States
- Institut national de la santé et de la recherche médicale, France
Figures
Figure 1 with 2 supplements
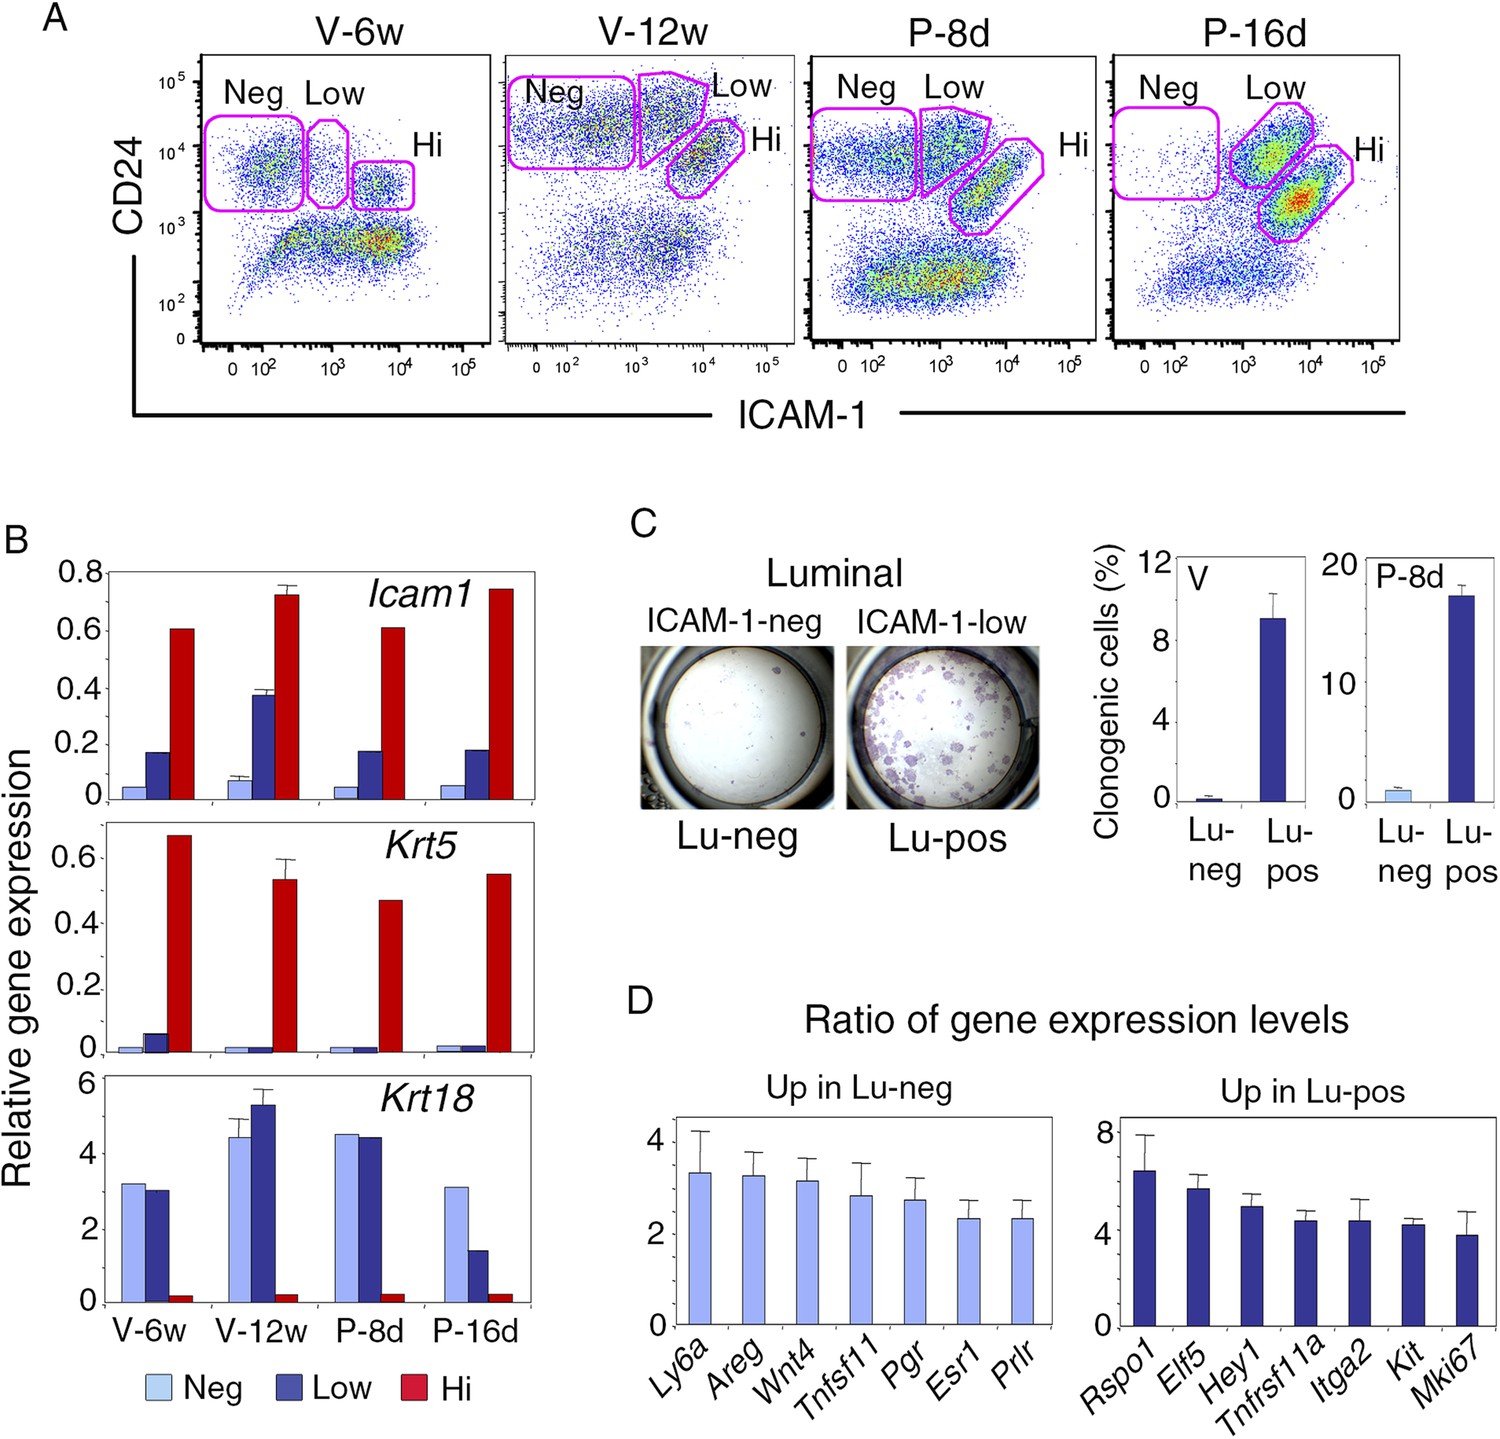
ICAM-1 expression discriminates basal and luminal cell compartments and defines a luminal population highly enriched in clonogenic progenitors.
(A) Flow cytometry dot plots showing CD24 and ICAM-1 expression in cells isolated from mouse mammary glands taken at representative stages of development: V-6w, 6-week-old virgin; V-12w, 12-week-old virgin; P-8d, 8-day pregnant mice; P-16d, 16-day pregnant mice. Within the CD24-positive epithelial cell population, ICAM-1 discriminated three distinct fractions, negative (Neg), low-expressing (Low), and high-expressing (Hi) cells. (B) Levels of Icam1 and lineage-specific gene expression in ICAM1-neg, ICAM1-low, and ICAM1-hi epithelial cells as determined by q-PCR analysis. Cells were isolated from mammary glands at different stages of development, as shown in panel A. The values were normalized to Gapdh expression and represent mean values from at least two distinct cell preparations. Data obtained with adult virgin mice (V-12w) are from four independent groups of cell samples and presented as mean ±S.E.M. (C) Colony formation by ICAM1-neg (Lu-neg) and ICAM1-low (Lu-pos) mammary luminal cells. Left panel: hematoxylin and eosin (H&E) staining of clonal colonies after 8 days in culture. Right panel: percentages of clonogenic cells. Cells were isolated from mature virgin mice (V) and early pregnant females (P-8d). The results are from two (P-8d) or three (V) independent cell preparations (each of which with three separate wells), and presented as mean values ±S.E.M. (D) q-PCR analysis of relative gene expression levels in Lu-neg and Lu-pos cells isolated from mammary glands of mature virgin females. Mean ratios (±S.E.M) of values normalized to Gapdh expression are shown. Lu-neg/Lu-pos and Lu-pos/Lu-neg ratios are presented in left and right panels, respectively. Results are from three independent cell preparations.
-
Figure 1—source data 1
- https://doi.org/10.7554/eLife.06104.004
Figure 1—figure supplement 1
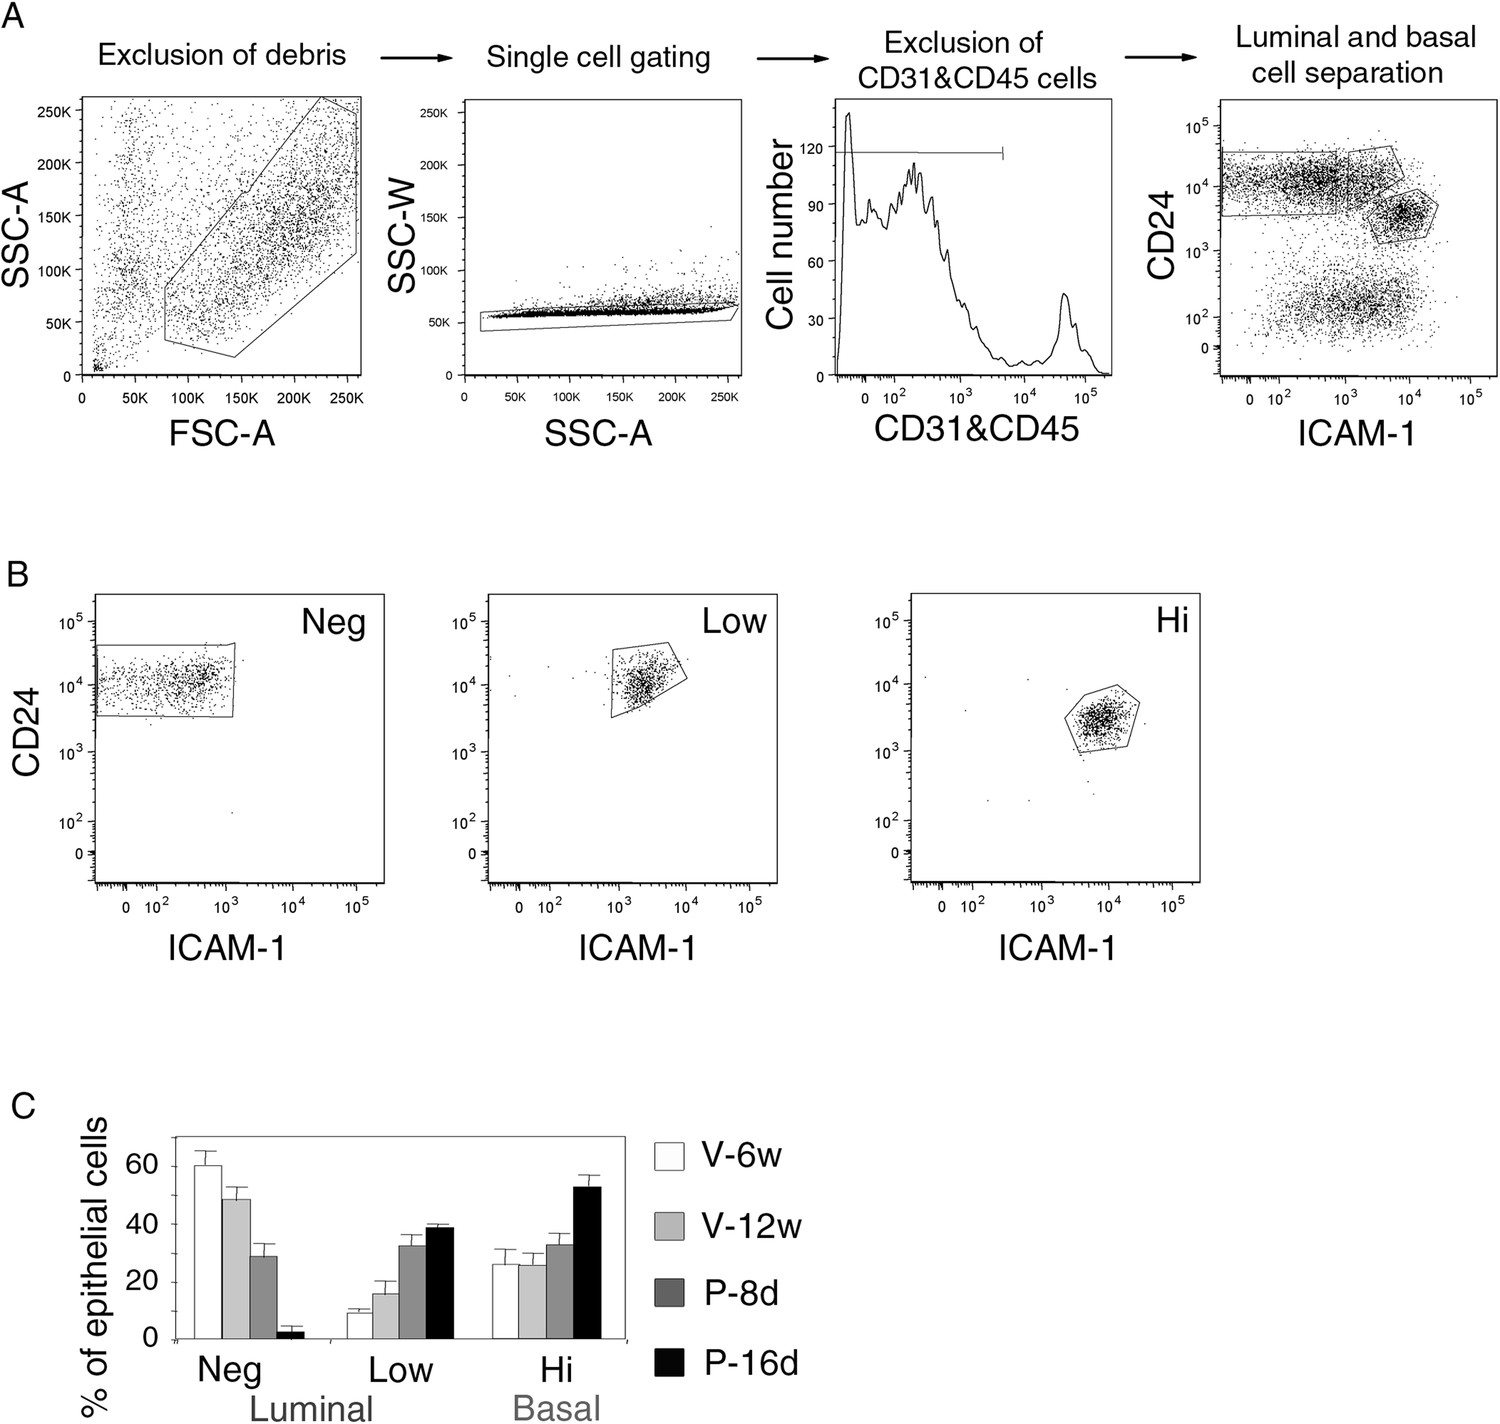
Gating procedure for flow cytometry analysis.
(A) Sequential steps of gating procedure for flow cytometry analysis and sort of mammary epithelial cells stained with anti-CD31, anti-CD45, anti-CD24 and anti-ICAM-1 antibodies. From left to right: exclusion of debris by gating cells on forward (FSC-A) and side scatter (SSC-A) parameters, exclusion of doublets by gating cells on SSC-A and SSC-W parameters, exclusion of CD31/CD45-expressing cells, luminal and basal cell separation using CD24 and ICAM-1 expression. (B) Purity control of the sorted ICAM1-neg, ICAM1-low, and ICAM1-hi CD24-positive epithelial cell populations. Cell purity was ≥97%. (C) Percentages of ICAM1-neg, ICAM1-low, and ICAM1-hi mammary epithelial cells at puberty, maturity, early-, and late pregnancy. Data are expressed as the mean (±S.E.M) of three flow cytometry analyses.
Figure 1—figure supplement 2
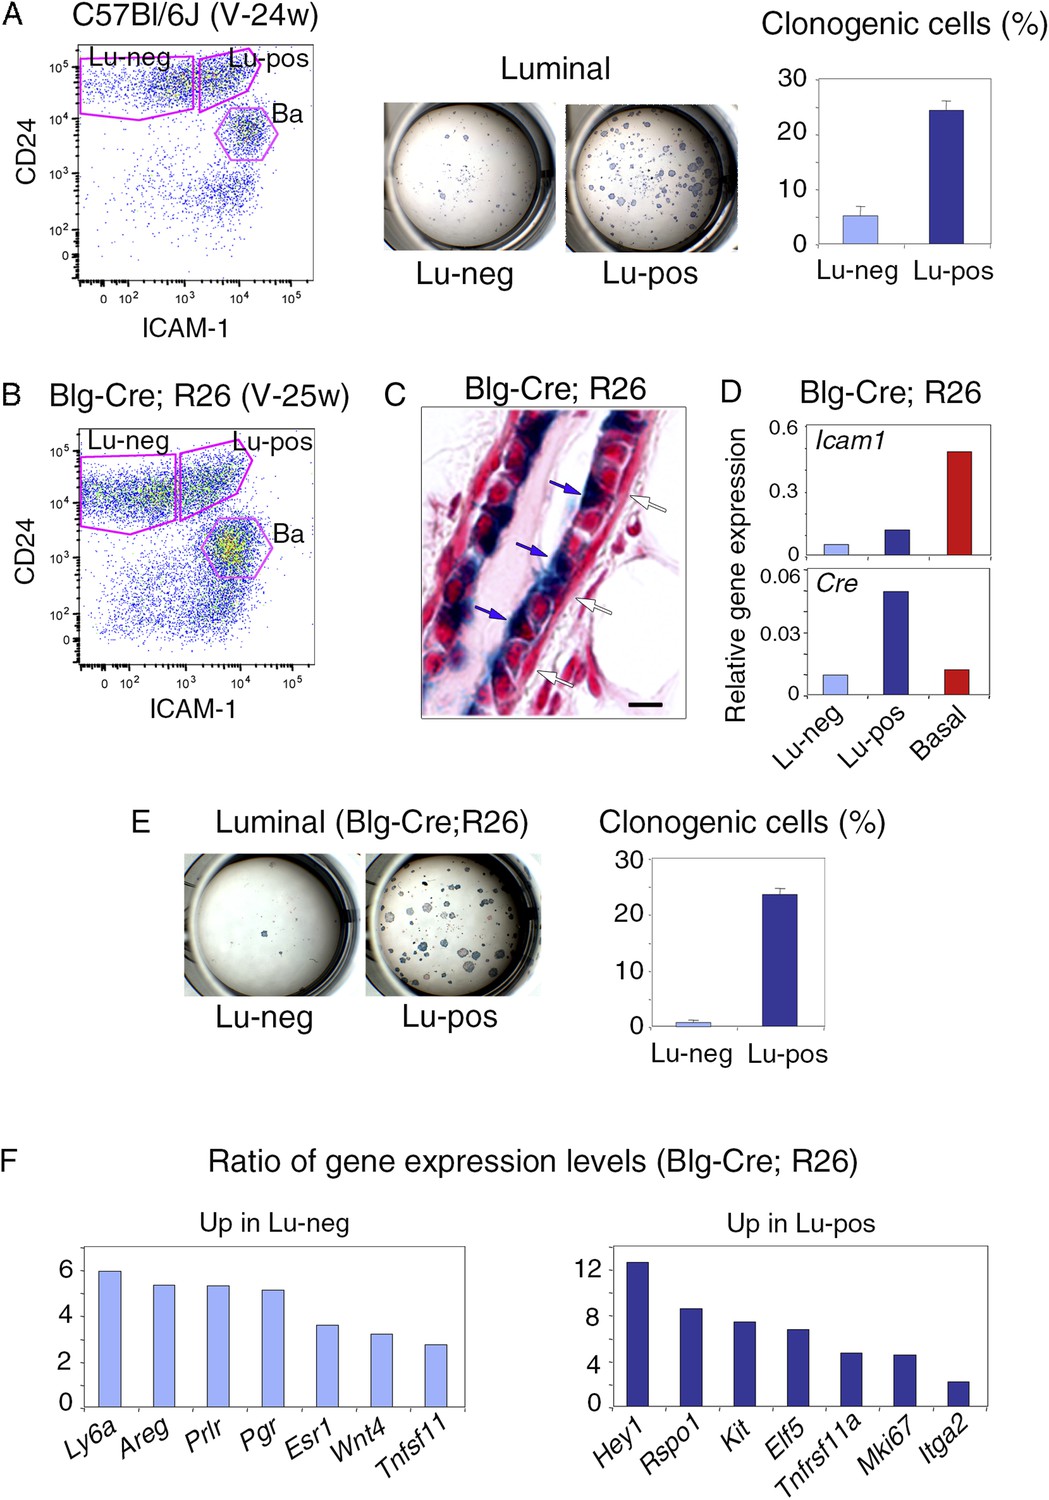
Isolation of mammary luminal progenitors from adult virgin C57Bl/6J and Blg-Cre; R26 females using ICAM-1.
(A) Isolation of clonogenic luminal progenitors from adult virgin C57Bl/6J mice using ICAM-1. Left panel: flow cytometry analysis of ICAM-1 and CD24 expression in freshly isolated mammary epithelial cells. Middle panel: H&E staining of clonal colonies obtained from Lu-neg and Lu-pos luminal cells after 8 days in culture. Right panel: percentages of clonogenic cells. The results are from triplicates obtained with one cell preparation and presented as mean values ±S.E.M. (B) Flow cytometry analysis of ICAM-1 and CD24 expression in mammary epithelial cells freshly isolated from adult virgin Blg-Cre; R26 females. (C) Sections through Blg-Cre; R26 mouse mammary gland Xgal-stained in whole mount. Blue and white arrows indicate LacZ-positive luminal cells and LacZ-negative basal cells, respectively. Bar, 15 μm. (D) Icam-1 and Cre expression in Lu-neg, Lu-pos, and basal cells, as determined by q-PCR. The values normalized to Gapdh expression are from one representative experiment performed with 3 pooled adult virgin Blg-Cre; R26 mice. (E) Clonogenic potential Lu-neg and Lu-pos luminal cells isolated from adult virgin Blg-Cre; R26 mice using ICAM-1. Left panel: Xgal staining of colonies counterstained with fast red. Right panel: percentages of clonogenic cells. The results are from triplicates obtained with one cell preparation and presented as mean values ±S.E.M. (F) q-PCR analysis of gene expression levels in Lu-neg and Lu-pos cells isolated from mammary glands of 3 pooled adult virgin Blg-Cre; R26 mice. Ratios of values normalized to Gapdh expression are shown. Lu-neg/Lu-pos and Lu-pos/Lu-neg ratios are presented in left and right panels, respectively.
Figure 2 with 1 supplement
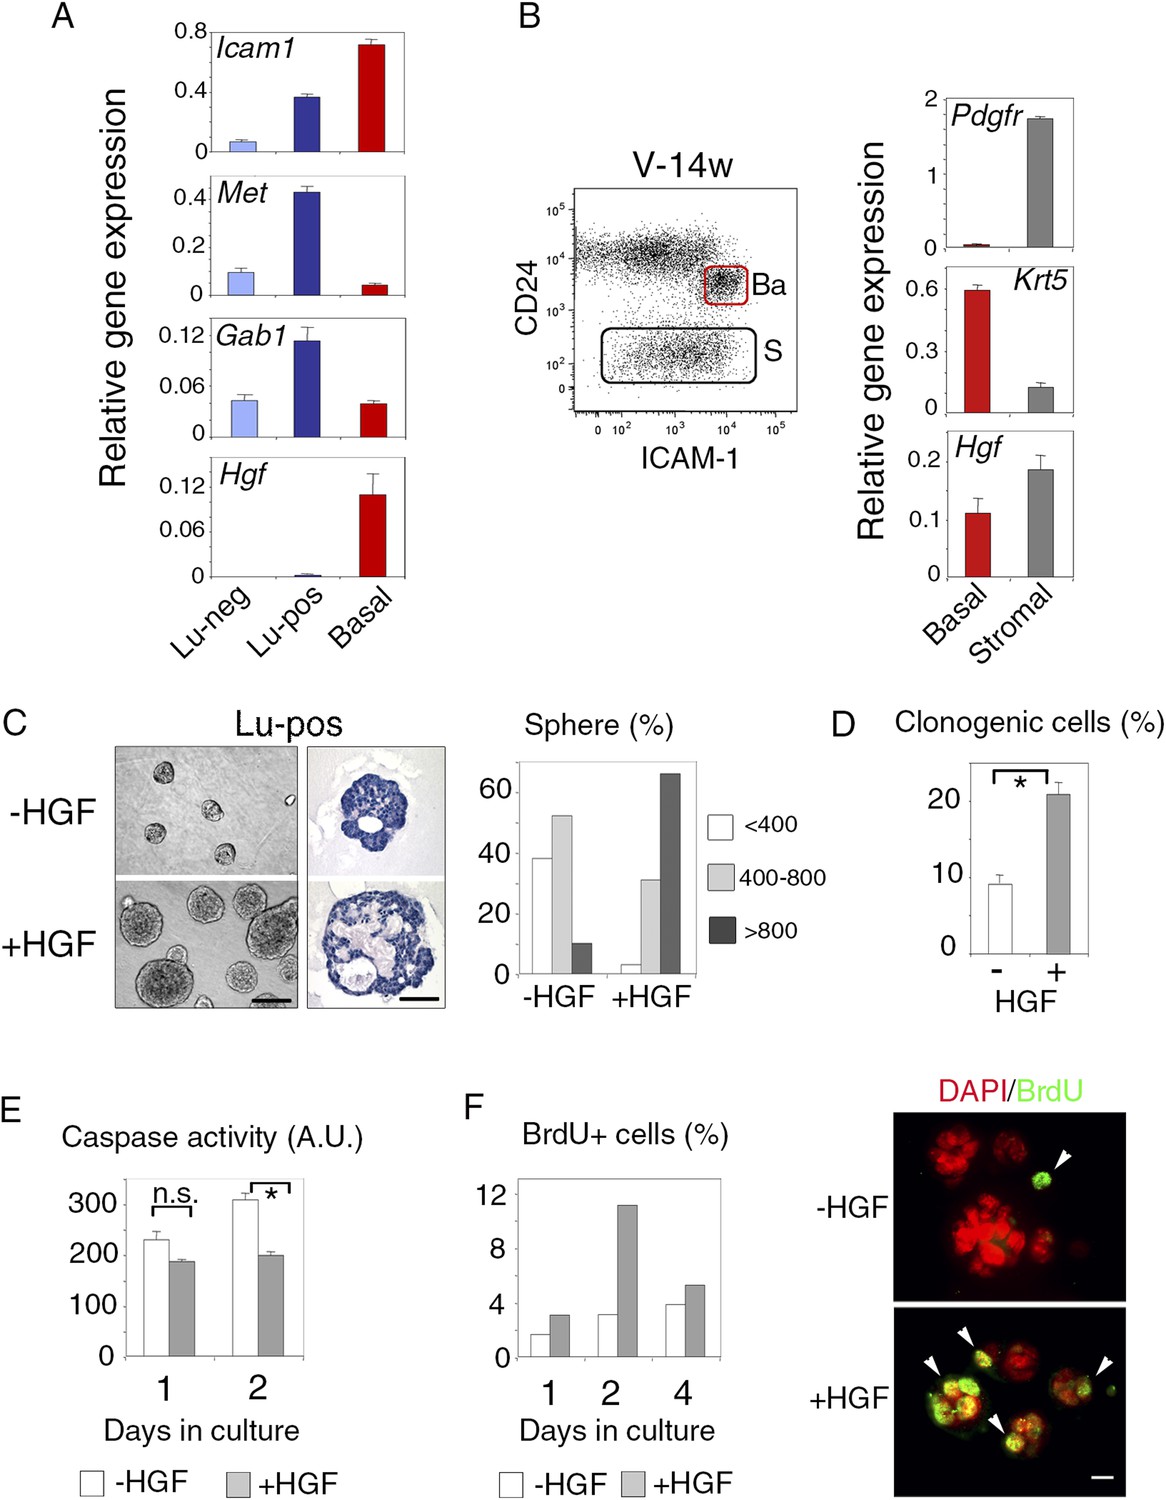
ICAM-1 identifies Met-expressing clonogenic luminal progenitors.
(A) Icam-1, Met, Gab1, and Hgf expression in Lu-neg, Lu-pos, and basal/myoepithelial cells isolated from mammary glands of mature virgin mice by flow cytometry. The q-PCR values were normalized to Gapdh expression and represent mean values ±S.E.M from three independent preparations. (B) Levels of Hgf expression in stromal and basal/myoepithelial cells. Left panel: flow cytometry dot plot showing mammary basal (Ba) and stromal (S) cell compartments isolated from a 14-week-old virgin mice. Right panel: q-PCR analysis of Hgf expression in basal and stromal cells. The values were normalized to Gapdh expression and represent mean values ±S.E.M from three independent preparations. (C) Characteristics of HGF-treated and untreated spheres derived from purified Lu-pos cells cultured in the absence or presence of HGF for 10 days. Left panels: Representative phase contrast images of HGF-treated and untreated spheres (bar, 400 μm) and H&E staining of sections through HGF-treated and untreated spheres (bar, 150 μm). Right panel: Sphere size distribution (in arbitrary units) in HGF-treated and untreated cultures. At least 250 spheres were analyzed per conditions. (D) Average percentages (±S.E.M) of clonogenic cells in non-stimulated and HGF-stimulated cultures of Lu-pos cells. Data from two independent cell preparations (each of which with three separate wells analyzed at day 10) are shown. *p < 0.0004. (E) Caspase-3 and caspase-7 activity in non-stimulated and HGF-stimulated Lu-pos cells after 1 and 2 days in culture as measured by a luminescent assay. Data are the mean (±S.E.M) of three measurements from separate wells. *p < 0.003 at day 2, not significant (n.s) at day 1. A.U., arbitrary unit. (F) BrdU incorporation in Lu-pos cells grown in the absence or presence of HGF for 1, 2, and 4 days. Left panel: percentage of BrdU-positive cells. Mean values from two distinct cell preparations are shown. Right panel: representative images of cells cytocentrifuged and immunostained with anti-BrdU antibody after 2 days in culture. Nuclei were counterstained with DAPI. Arrowheads indicate proliferating BrdU-positive cells. Bar, 20 μm.
-
Figure 2—source data 1
- https://doi.org/10.7554/eLife.06104.008
Figure 2—figure supplement 1
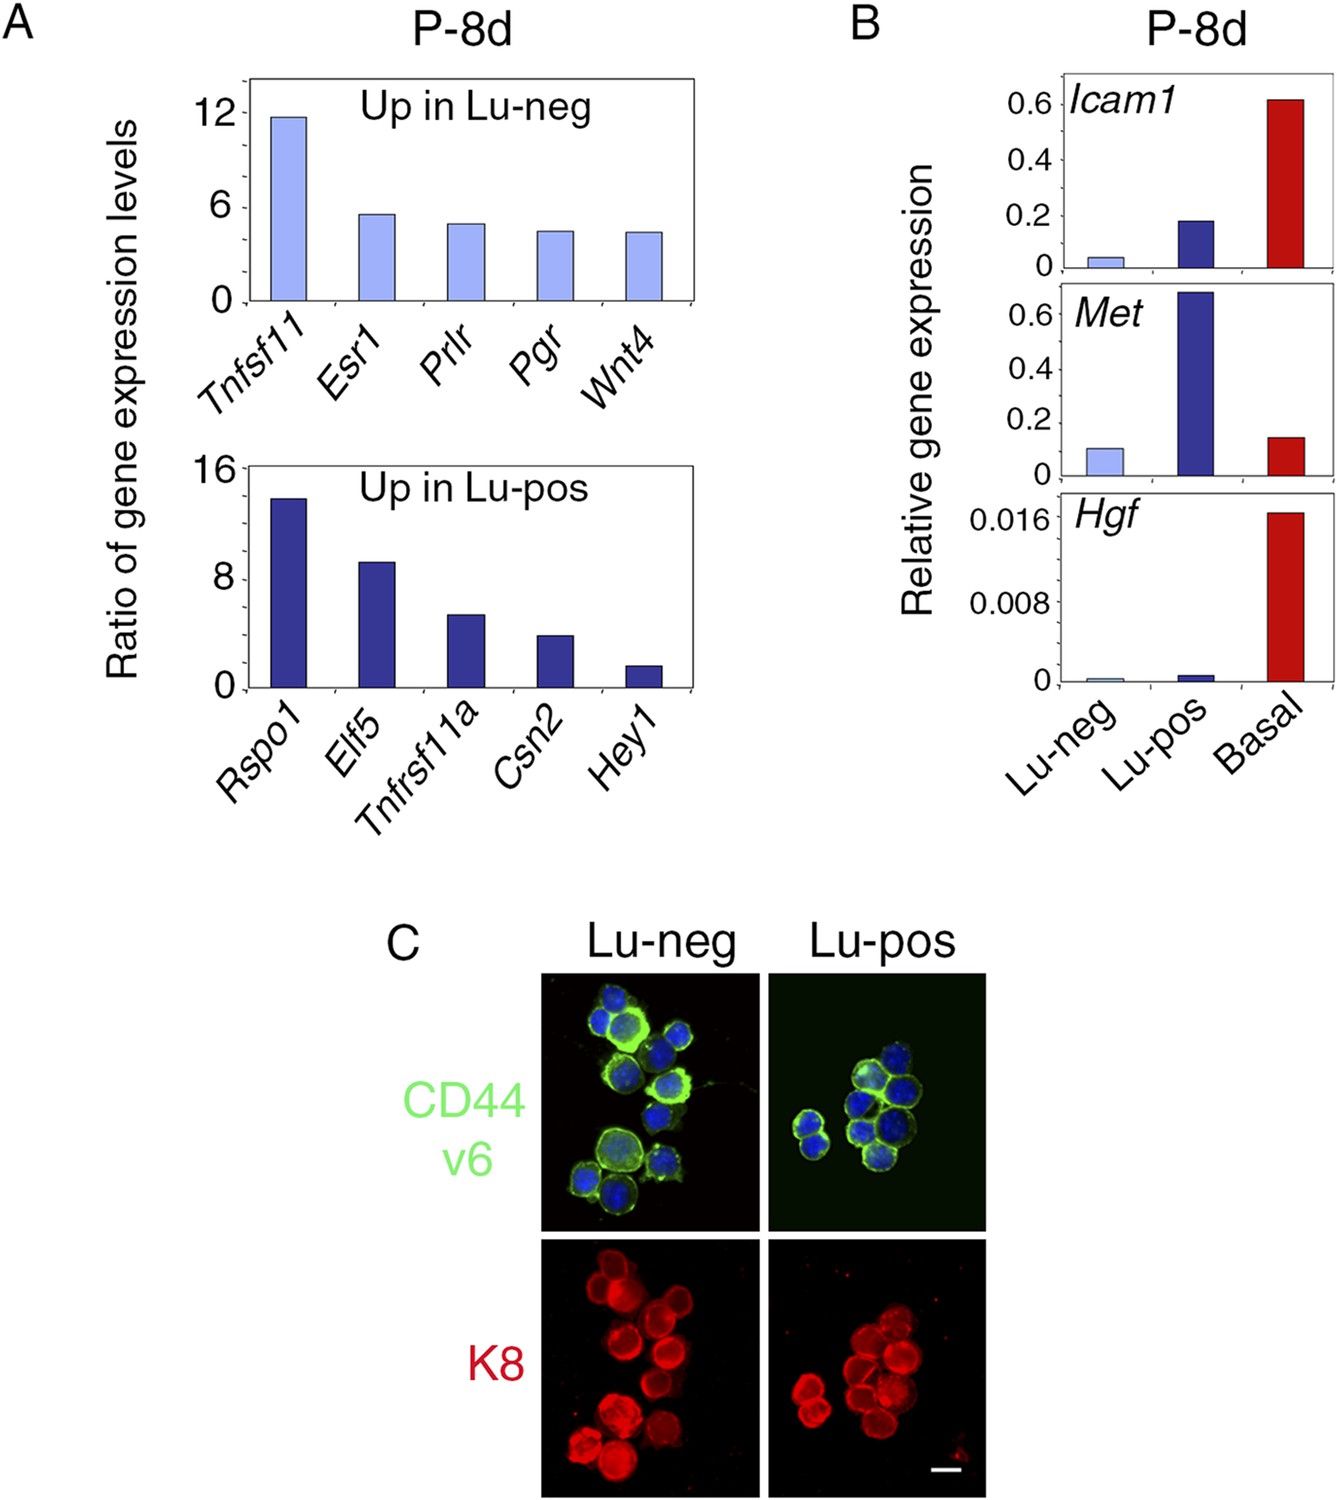
Molecular and phenotypic characteristics of luminal progenitors isolated from virgin and early pregnant females.
(A) q-PCR analysis of gene expression levels in mammary Lu-neg and Lu-pos cells isolated from early pregnant females (P-8d). Mean ratios of values normalized to Gapdh expression are shown. Lu-neg/Lu-pos and Lu-pos/Lu-neg ratios are presented in upper and lower panels, respectively. Data are from two independent cell preparations. (B) Icam-1, Met, and Hgf expression in Lu-neg, Lu-pos, and basal/myoepithelial cells, as determined by q-PCR. Cells were isolated from mammary glands of 8-day-pregnant mice. The q-PCR values were normalized to Gapdh expression and represent mean from two independent preparations. (C) Immunodetection of CD44v6 and K8 in cytocentrifuged Lu-neg and Lu-pos cells freshly isolated from mammary glands of mature virgin mice. In upper panels, nuclei were stained with DAPI. Bar, 15 μm.
Figure 3 with 1 supplement
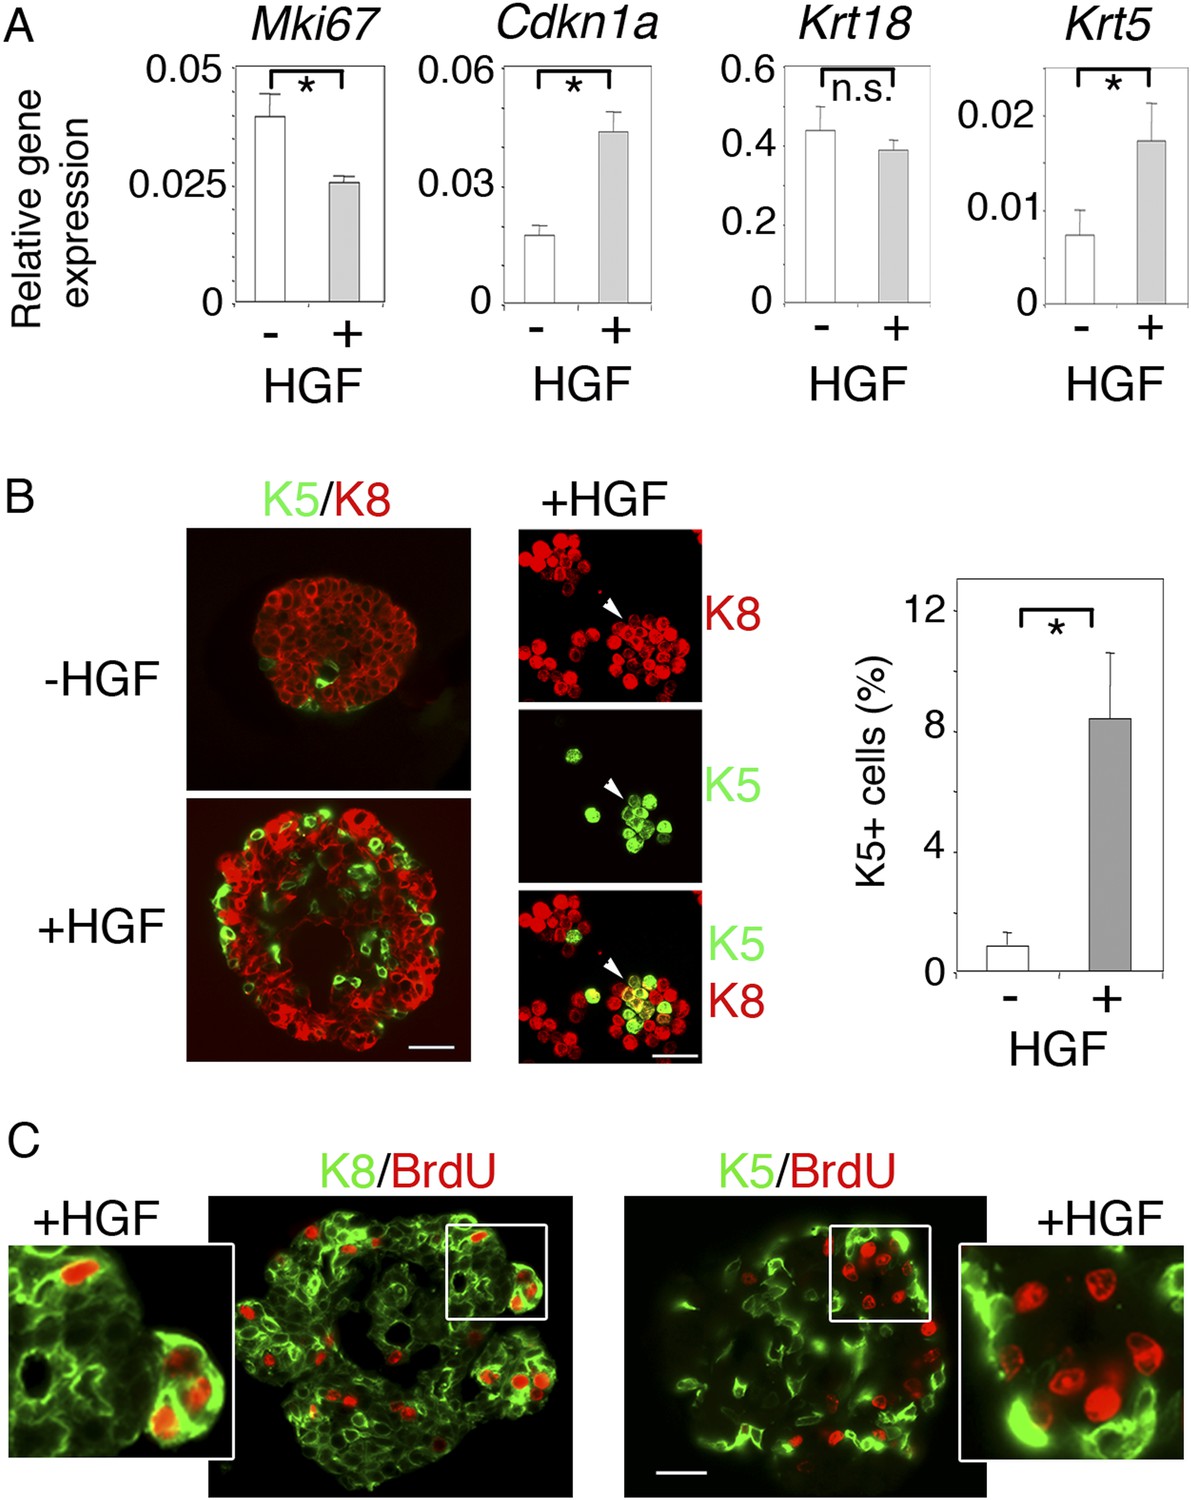
HGF promotes acquisition of basal-specific keratins in luminal progenitors identified by ICAM-1.
(A) Analysis of Mki67, Cdkn1, Krt18 and Krt5 expression in spheres derived from untreated and HGF-treated Lu-pos cells, as determined by q-PCR. Lu-pos cells were isolated from mammary glands of mature virgin mice. The values, normalized to Gapdh expression, represent mean values ±S.E.M. from at least three independent sphere preparations harvested after 10 days in culture. *p < 0.05, p < 0.001, p < 0.007 for Mki67, Cdkn1, and Krt5, respectively. n.s, not significant (Krt18). (B) Double immunofluorescence labeling of non-stimulated and HGF-stimulated Lu-pos cells grown for 10 days. Left panel: K8 and K5 staining of spheres sections. Bar, 60 μm. Middle panel: K8 and K5 staining of cytocentrifuged cells derived from HGF-stimulated cultures. Arrowheads indicate a group of double-positive K5/K8 cells. Bar, 45 μm. Right panel: Average percentages (±S.E.M) of K5-expressing cells in 10- to 12-day-old spheres derived from untreated and HGF-treated Lu-pos cells. 1000 cells at least were counted per sample. Percentages of K5-positive cells in untreated and HGF-treated cultures were 0.8% ± 0.4 and 8.4% ± 2.2, respectively. Data are from four independent cell preparations. *p < 0.002. (C) BrdU incorporation in 10-day-old HGF-treated spheres. Sections were stained with anti-BrdU antibody combined either to anti-K8 (left panels) or anti-K5 (right panels) antibodies. Pictures at low magnification and enlarged views of defined areas are shown. Bar, 45 μm.
-
Figure 3—source data 1
- https://doi.org/10.7554/eLife.06104.011
Figure 3—figure supplement 1
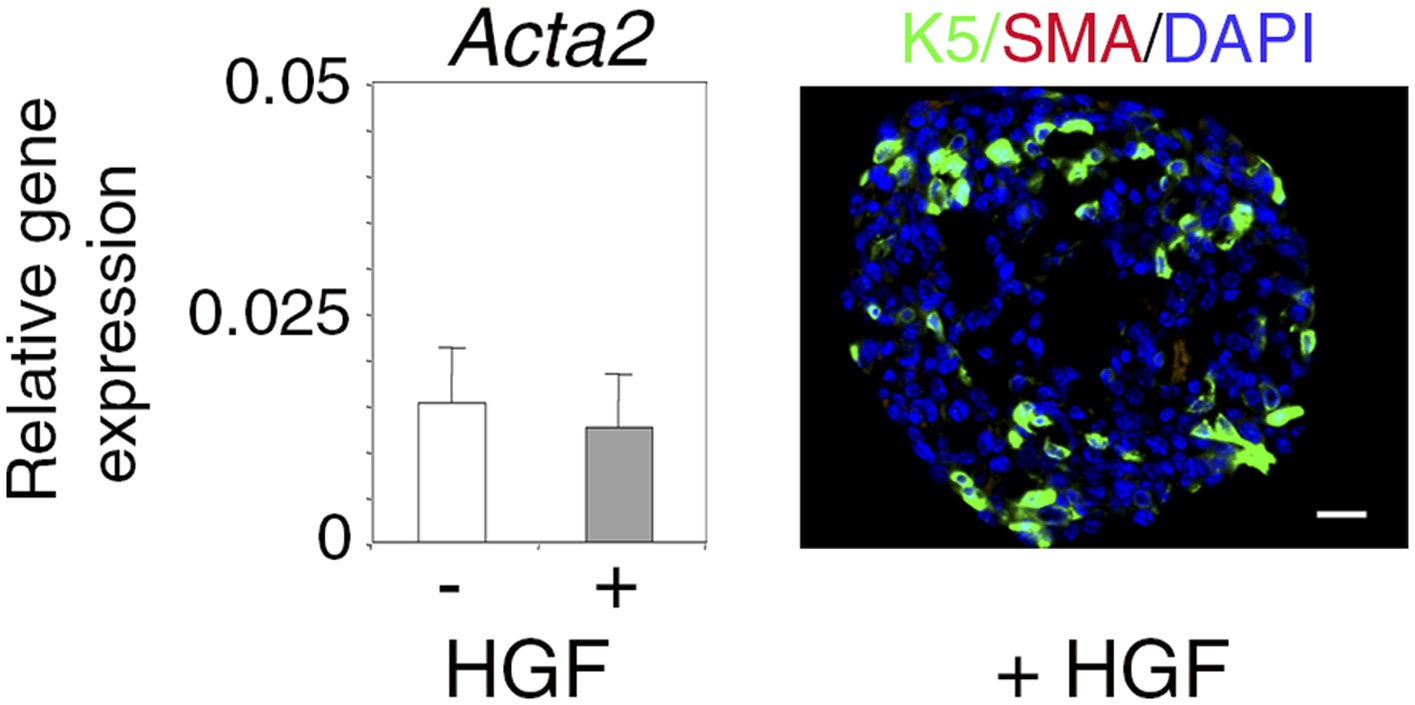
α-SMA expression in untreated and HGF-treated spheres.
Absence of α-SMA expression in untreated and HGF-treated spheres derived from Lu-pos cells grown for 10 days. Left panel: Acta2 expression determined by q-PCR. The values normalized to Gapdh expression represent mean ±S.E.M. from three independent sphere preparations. Right panel: double immunofluorescence labeling of a HGF-treated sphere section with anti-K5 and anti-α-SMA antibodies. Nuclei were stained with DAPI. Bar, 45 μm.
Figure 4 with 1 supplement
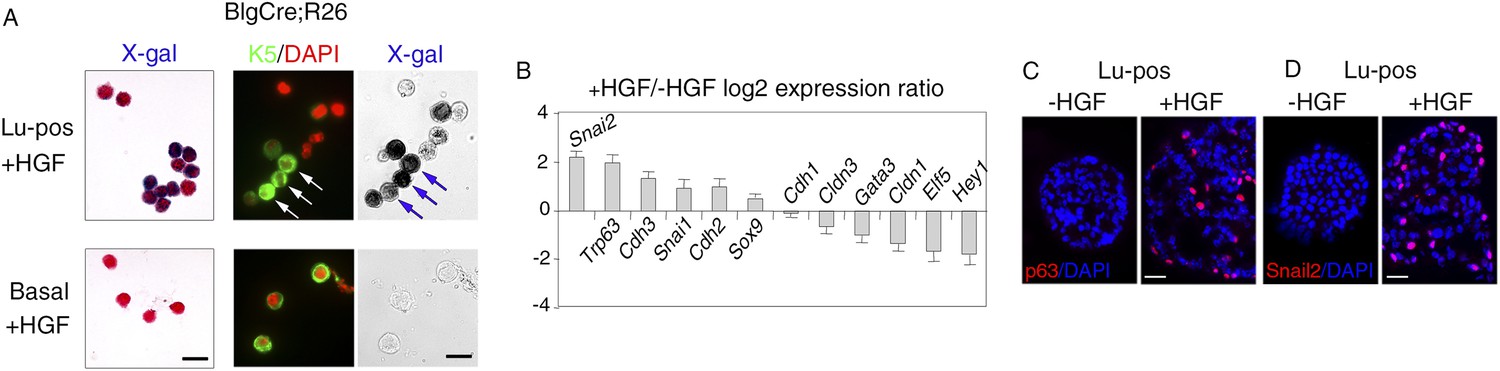
HGF triggers activation of EMT program in ICAM1-expressing luminal progenitors.
(A) K5 and β-galactosidase expression in cells isolated from HGF-treated spheres. Lu-pos (upper panels) and basal cells (lower panels) were purified from mammary glands of mature virgin Blg-Cre; R26 mice and stimulated with HGF for 13 days. Left panels: X-gal staining with fast red counterstaining. Bar, 15 μm. Middle and right panels: correlated images of K5 immunostaining and X-gal staining. Arrows indicate LacZ-positive cells expressing K5. Quantitative data are shown in Figure 4—figure supplement 1B. Bar, 10 μm. (B) Comparative expression levels of basal-specific, epithelial–mesenchymal transition (EMT)-associated and luminal-specific genes in spheres derived from untreated and HGF-treated Lu-pos cells as determined by q-PCR. Lu-pos cells isolated from mammary glands of mature virgin Balb/c mice were cultured in the absence or presence of HGF for 10 days. Results are expressed as Log2 ratios of values normalized to Gapdh and represent mean values ±S.E.M. from at least three independent sphere preparations. The comparator values were those obtained with untreated spheres. (C-D) Immunodetection of p63 (C) and Snail2 (D) in sections through untreated and HGF-stimulated spheres. Nuclei were counterstained with DAPI. Bar, 25 μm.
-
Figure 4—source data 1
- https://doi.org/10.7554/eLife.06104.014
Figure 4—figure supplement 1

Met expression in luminal progenitors isolated from Blg-Cre; R26 mice.
(A) Icam-1, Met, and Hgf expression in Lu-neg, Lu-pos, and basal/myoepithelial cells, as determined by q-PCR. Cells were isolated from mammary glands of 3 pooled adult virgin Blg-Cre; R26 mice. The q-PCR values were normalized to Gapdh expression. (B) Percentages of K5-positive cells (upper panel) and K5-positive cells expressing LacZ (lower panel) in HGF-treated spheres derived from Lu-pos and basal cells isolated from mammary glands of 3 pooled adult virgin Blg-Cre; R26 mice. Data are from one cell preparation. At least 500 cells were counted per sample.
Figure 5
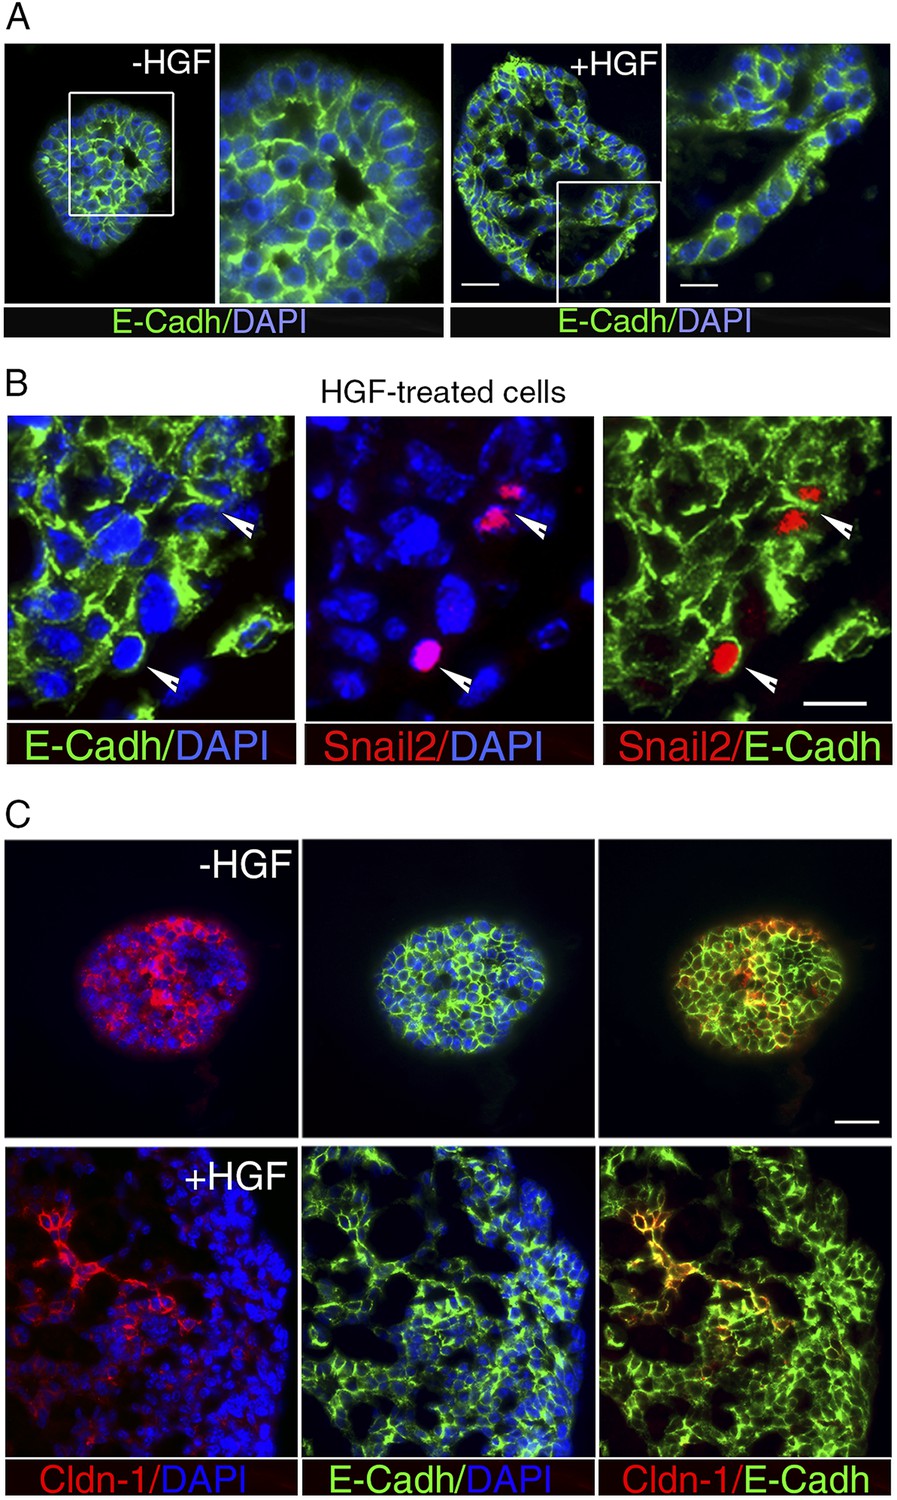
HGF treatment perturbs cell–cell adhesion in ICAM1-expressing luminal progenitors.
(A) Immunofluorescence labeling of sphere sections with anti-E-cadherin antibody. Low- and high-magnification views of untreated (left panels) and HGF-treated (right panels) spheres. Nuclei were stained with DAPI. Bars, 60 μm and 30 μm. (B) Double immunodetection of Snail2 and E-cadherin in a HGF-treated sphere. Arrowheads indicate Snail2-positive cells expressing E-cadherin at their surface. Nuclei were stained with DAPI. Bar, 20 μm. (C) Double immunofluorescence labeling of sphere sections with anti-claudin-1 and anti-E-cadherin antibodies. Nuclei were stained with DAPI. Bar, 75 μm.
Figure 6
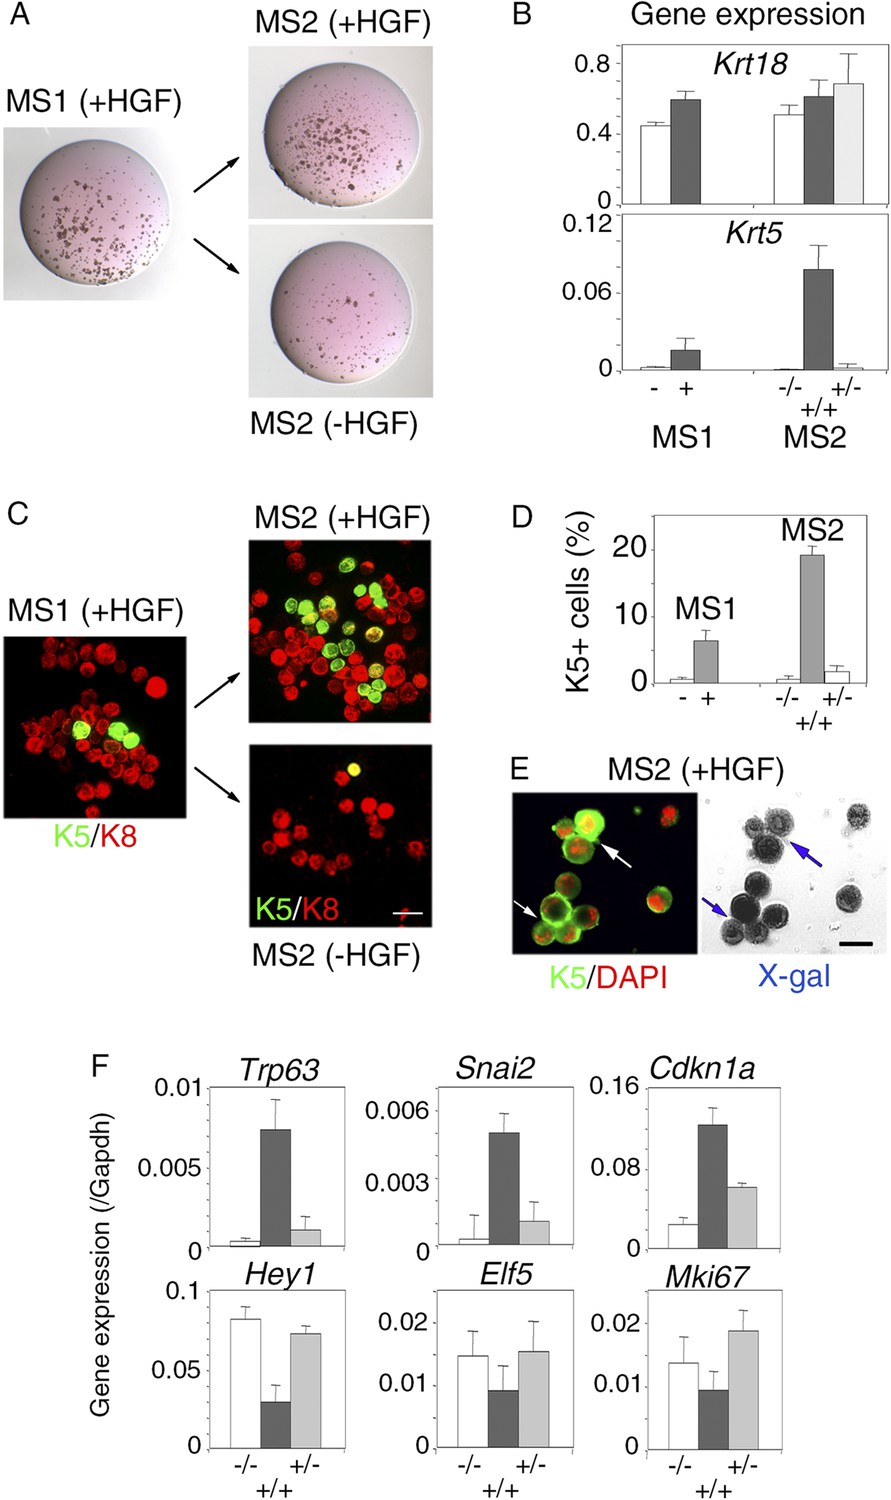
Persistent stimulation with HGF is required to sustain effects on luminal progenitors.
(A) Microphotographs of primary (MS1) and secondary (MS2) mammospheres derived from purified Lu-pos cells. Primary spheres obtained after 11 days of culture in the presence of HGF were dissociated and 5000 cells were replated and grown either in the presence or absence of HGF for an additional period of 10 days. (B) Krt18 and Krt5 expression levels in MS1 and MS2 cultures derived from Lu-pos cells as determined by q-PCR. HGF-treated MS2 cultures (+) grown either in the presence or absence of HGF are labeled +/+ and +/−, respectively. Untreated primary (−) and secondary (−/−) spheres of Lu-pos cells served as controls. The values were normalized to Gapdh expression. Data are presented as mean values ±S.E.M. of three independent experiments. (C) K5-expressing cells in MS1 and MS2 cultures derived from Lu-pos cells. Immunodetection of K5 and K8 in cytocentrifuged cells isolated from MS1 and MS2. Bar, 30 μm. (D) Percentages of K5-expressing cells in MS1 and MS2 cultures according to their treatment with HGF. 2000 cells were counted per analyzed cytospots. Data from two independent experiments (three separate cytospots) are presented as mean values ±S.E.M. (E) Correlated images of K5 immunostaining and X-gal staining in cells isolated from HGF-treated secondary spheres. Lu-pos cells were purified from mammary glands of mature virgin Blg-Cre; R26 mice and continuously stimulated with HGF. Arrows indicate two groups of LacZ-positive cells expressing K5. Bar, 15 μm. (F) Modulation of Trp63, Snai2, Hey1, Elf5, Cdkn1a, and Mki67 expression levels in MS2 cultures derived from Lu-pos cells as determined by q-PCR. The q-PCR values were normalized to Gapdh expression. Results are shown as mean values ±S.E.M. of three independent experiments.
-
Figure 6—source data 1
- https://doi.org/10.7554/eLife.06104.018
Figure 7
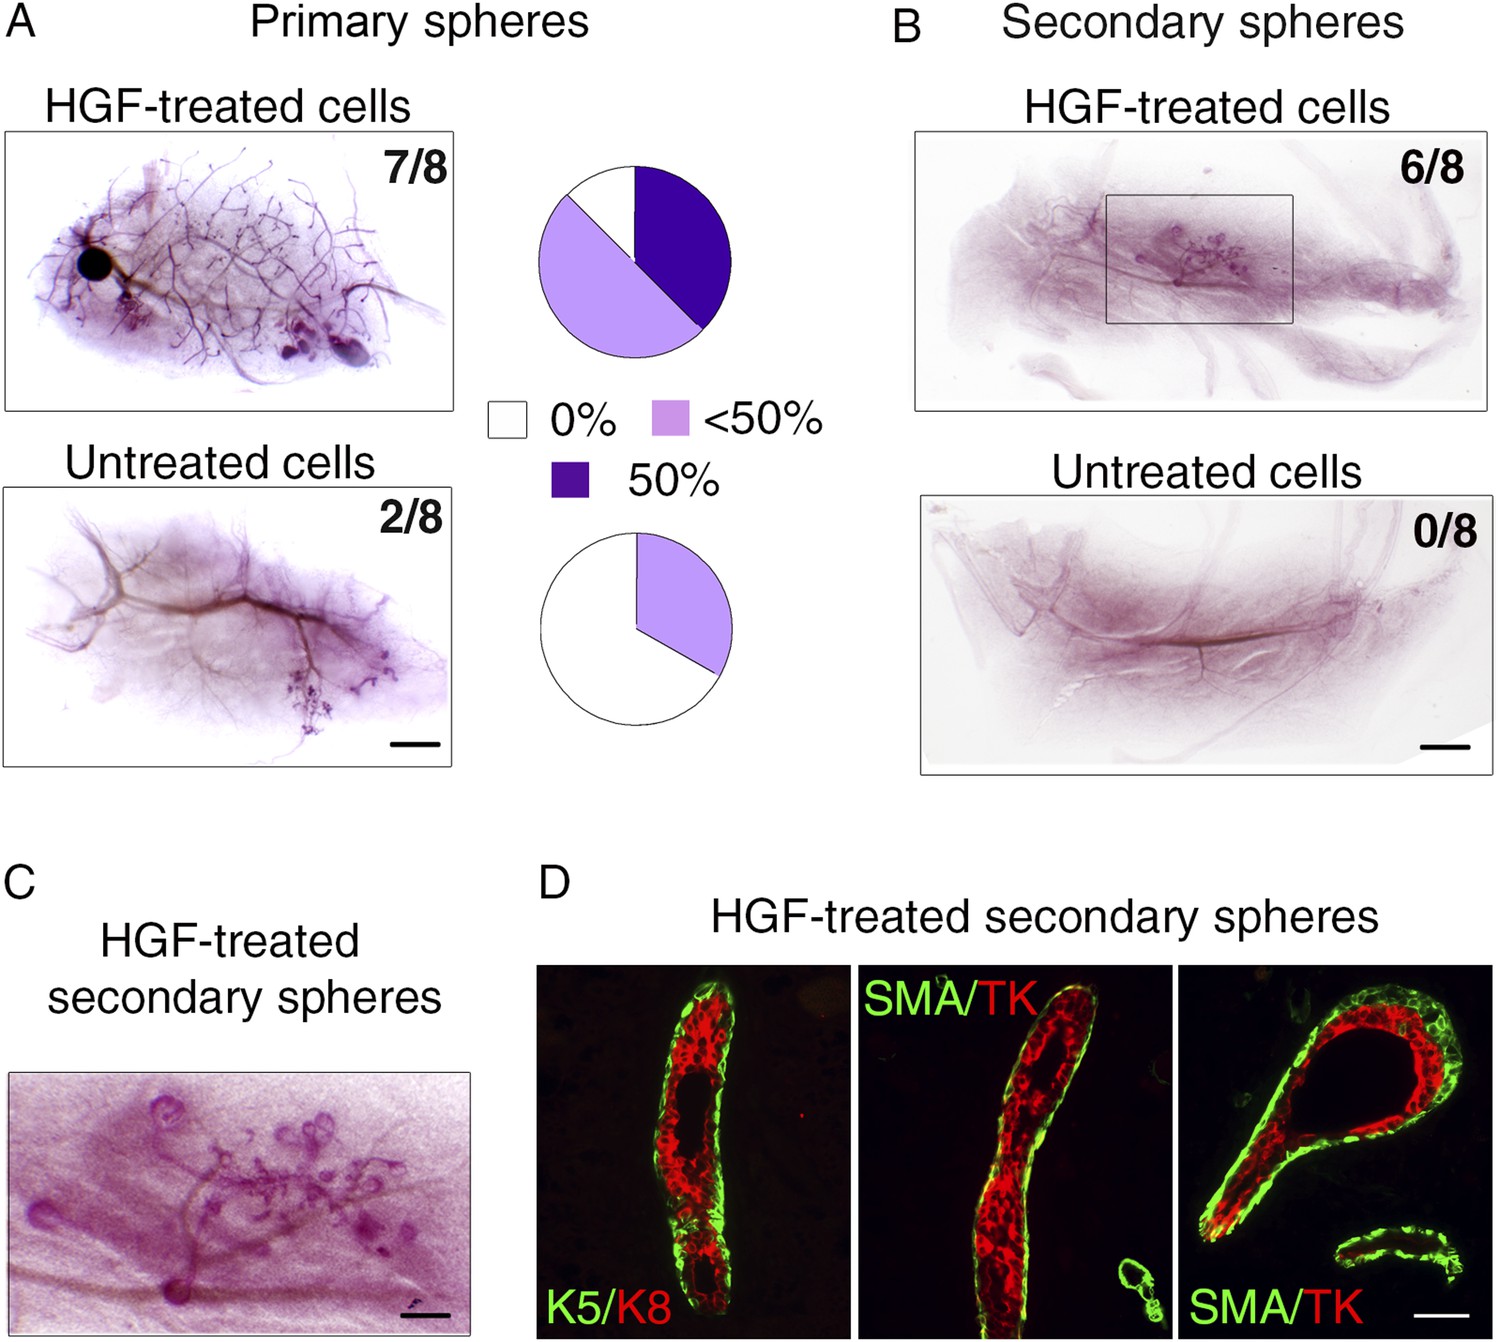
HGF-treated luminal progenitors display regenerative potential.
(A) Regenerative properties of cells isolated from untreated and HGF-treated cultures of luminal progenitors. Primary spheres were dissociated and single cell suspensions were transplanted at 2000, 1000, and 500 cells/fat pad. Left panels: Representative images of carmine-stained outgrowths obtained 12 weeks after transplantation of 2000 cells and take rates. Bar, 0.2 mm. Right panels: Diagrams showing take rate and fat pad filling. (B) Representative images of carmine-stained outgrowths obtained 5 weeks after transplantation of intact secondary spheres harvested from untreated and HGF-treated cultures of luminal progenitors. Take rates are indicated. Bar, 2 mm. (C) Enlarged view of the outgrowth shown in B. Bar, 0.8 mm. (D) Double immunofluorescence stainings of sections through the outgrowth shown in C. Immunodetection of K5/K8 in a duct (left panel) and α-SMA/TK in a duct and a growing bud (middle and right panels, respectively). Bar, 45 μm. The following supplementary file is available for Figure 7: Supplementary file 1.
Figure 8 with 1 supplement
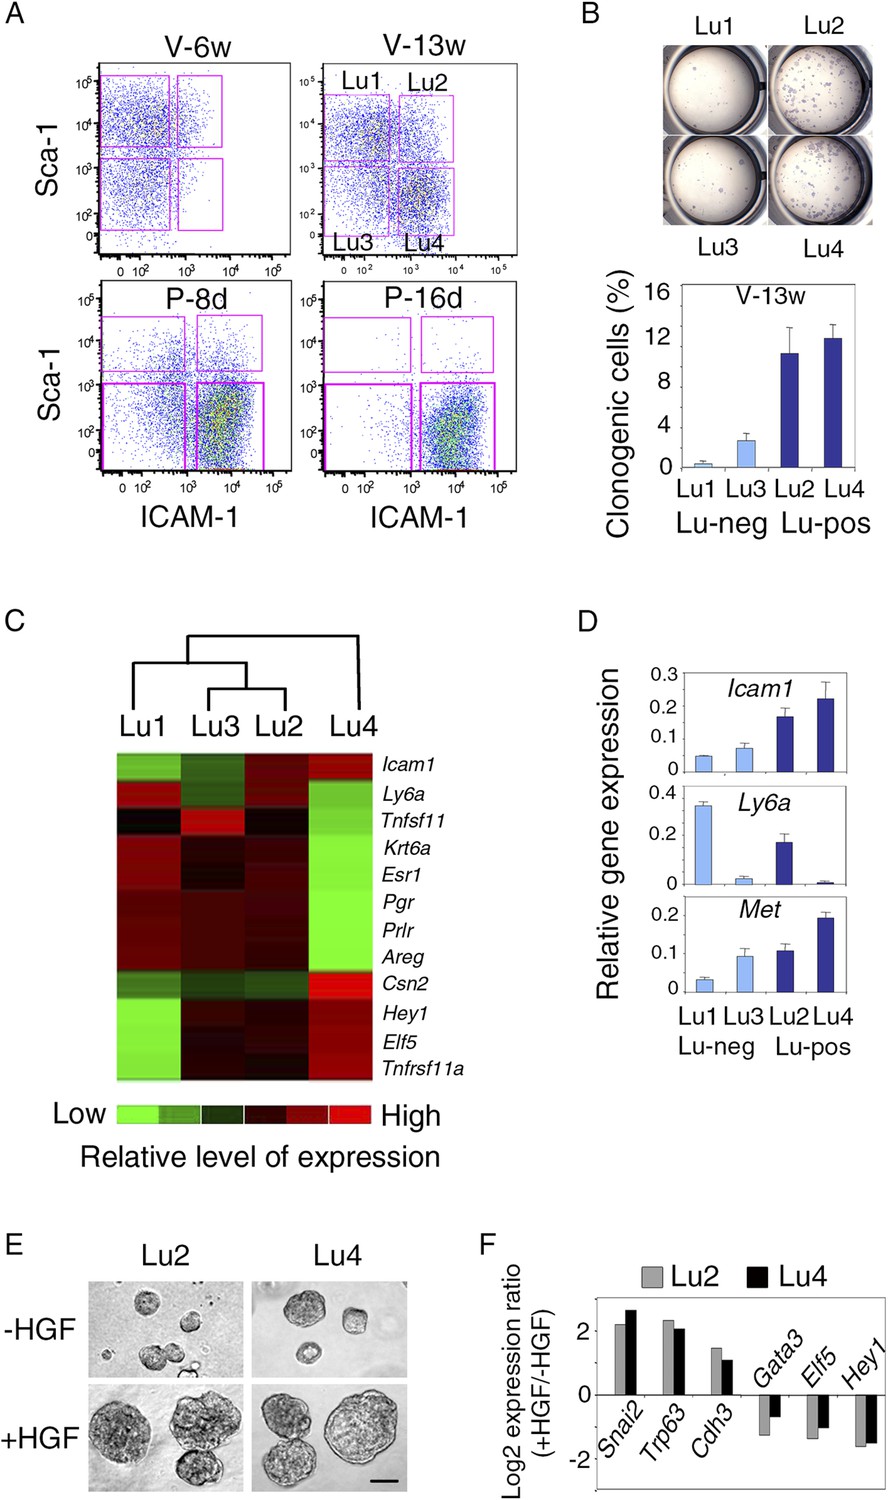
Met-expressing clonogenic cells are distributed in hormone-receptor-positive and negative luminal cell populations.
(A) Representative flow cytometry dot-plots showing Sca-1 and ICAM-1 expression in the mammary luminal cell population isolated from mice at different stages of development: V-6w, 6-week-old virgin; V-13w, 13-week-old virgin; P-8d, 8-day pregnant; P-16d, 16-day pregnant mice. Combined with Sca-1, ICAM-1 discriminated four cell populations referred to as Lu1, Lu2, Lu3, and Lu4. (B) Colony formation by Lu1, Lu2, Lu3, and Lu4 cell subsets isolated from mammary glands of mature virgin mice. Upper panel: H&E staining of colonies after 8 days in culture. Lower panel: percentages of clonogenic cells. The results from two independent cell samples (each of which with three separate wells) are presented as mean values ±S.E.M. (C) Heat map of qPCR gene expression analysis performed on Lu1, Lu2, Lu3, and Lu4 cells freshly isolated from mammary glands of mature virgin mice. The qPCR values were normalized to Gapdh expression. Mean values from three independent cell preparations were used to establish the map and determine relationships between the luminal subsets by unsupervised hierarchical clustering. (D) q-PCR analysis of Icam1, Ly6a, and Met expression in Lu1, Lu2, Lu3, and Lu4 cell populations freshly isolated from mammary glands of mature virgin mice. The values were normalized to Gapdh expression and represent mean values ±S.E.M from three independent preparations. (E) Representative phase contrast images of spheres derived from Lu2 and Lu4 cell populations grown in the absence or presence of HGF for 10 days. Bar, 150 μm. (F) Comparative expression levels of basal-specific, EMT-associated and luminal-specific genes in spheres derived from Lu2 and Lu4 cells, as determined by q-PCR. Cells were grown as described above in (E). Results are expressed as Log2 ratios of values normalized to Gapdh. The comparator values were those obtained with cell preparations grown in the absence of HGF.
-
Figure 8—source data 1
- https://doi.org/10.7554/eLife.06104.021
Figure 8—figure supplement 1

Characterization of luminal cell populations isolated from virgin and pregnant mice using ICAM-1 and Sca-1 expression.
(A) Flow cytometry dot plots showing the gating procedure of the four luminal cell subsets (Lu1, Lu2, Lu3, and Lu4) identified by Sca-1 and ICAM-1. Cells were isolated from mammary glands of mature virgin mice. (B) qPCR analysis of Krt18 and Krt14 expression in Lu1, Lu2, Lu3, and Lu4 cells isolated from mammary glands of mature virgin mice as shown in (A). Mean values ±S.E.M. from three independent cell preparations are shown. (C) Percentages of clonogenic cells in Lu1, Lu2, Lu3, and Lu4 populations isolated from mammary glands of mice taken at different stages of development: V-6w, 6-week-old virgin; P-8d, 8-day pregnant; P-16d, 16-day pregnant mice. Corresponding flow cytometry dot plots are shown in Figure 8A. Two separate cell preparations (distributed in three wells) were analyzed at each stages of development. The results are presented as mean values ±S.E.M. (*) No cell population. (D) Heat map of qPCR gene expression analysis performed on Lu1, Lu2, Lu3, and Lu4 cells freshly isolated from mammary glands of 8-day pregnant mice (P8-d). The qPCR values were normalized to Gapdh expression. Mean values from two independent cell preparations were used to establish the map and determine relationships between the luminal subsets by unsupervised hierarchical clustering. (E) q-PCR analysis of Icam-1 and Met expression in Lu1, Lu2, Lu3, and Lu4 cell populations freshly isolated from mammary glands of 8-day pregnant mice (P8-d). The values were normalized to Gapdh expression and represent means from two independent preparations.
Figure 9 with 1 supplement
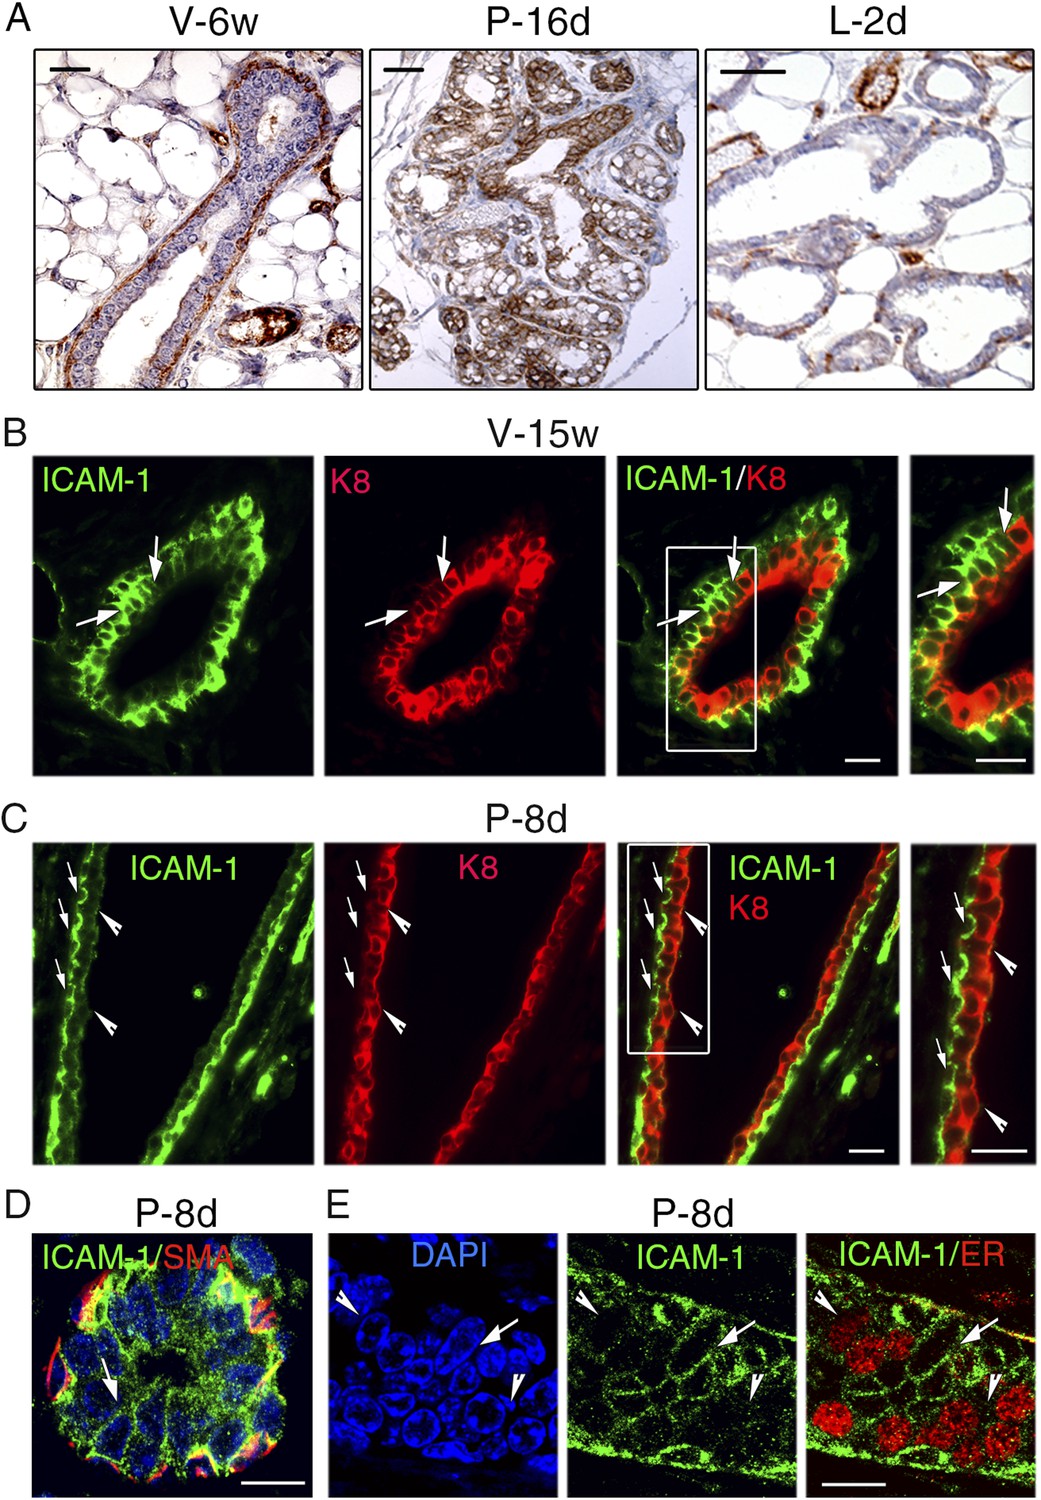
ICAM-1 localization in the developing and adult mammary gland.
(A) Immunohistochemical detection of ICAM-1 in sections through mammary glands from mice at puberty (V-6w; left panel), late pregnancy (P-16d; middle panel), and onset of lactation (L-2d; right panel). Left panel: bar, 60 μm. Middle and right panels: bar, 100 μm. (B) Double immunofluorescence labeling of ICAM-1 and K8 in a mammary duct of a 15-week-old virgin female (V-15w). The right panel shows an enlarged view of the area defined on the left. The arrows indicate a cluster of ICAM1-positive luminal cells. Bars, 40 μm. (C) Double immunofluorescence staining of ICAM-1 and K8 in a large mammary duct at early gestation (P-8d). The right panel shows enlarged view of the area defined on the left. The arrows point to myoepithelial cells expressing ICAM-1 at their apical and lateral surfaces. The arrowheads indicate luminal layer negative for ICAM-1. Bars, 40 μm. (D and E) Sections through an alveolus and a small duct from a mammary gland of 8-day-pregnant mouse (P-8d). (D) Double immunofluorescence labeling of ICAM-1 and α-SMA (SMA); (E) ICAM-1 and ER. DAPI served to stain the nuclei. The arrows point to clusters of ICAM1-positive cells. The arrowheads indicate clusters of ER-positive cells negative for ICAM-1. Bars, 10 μm.
Figure 9—figure supplement 1
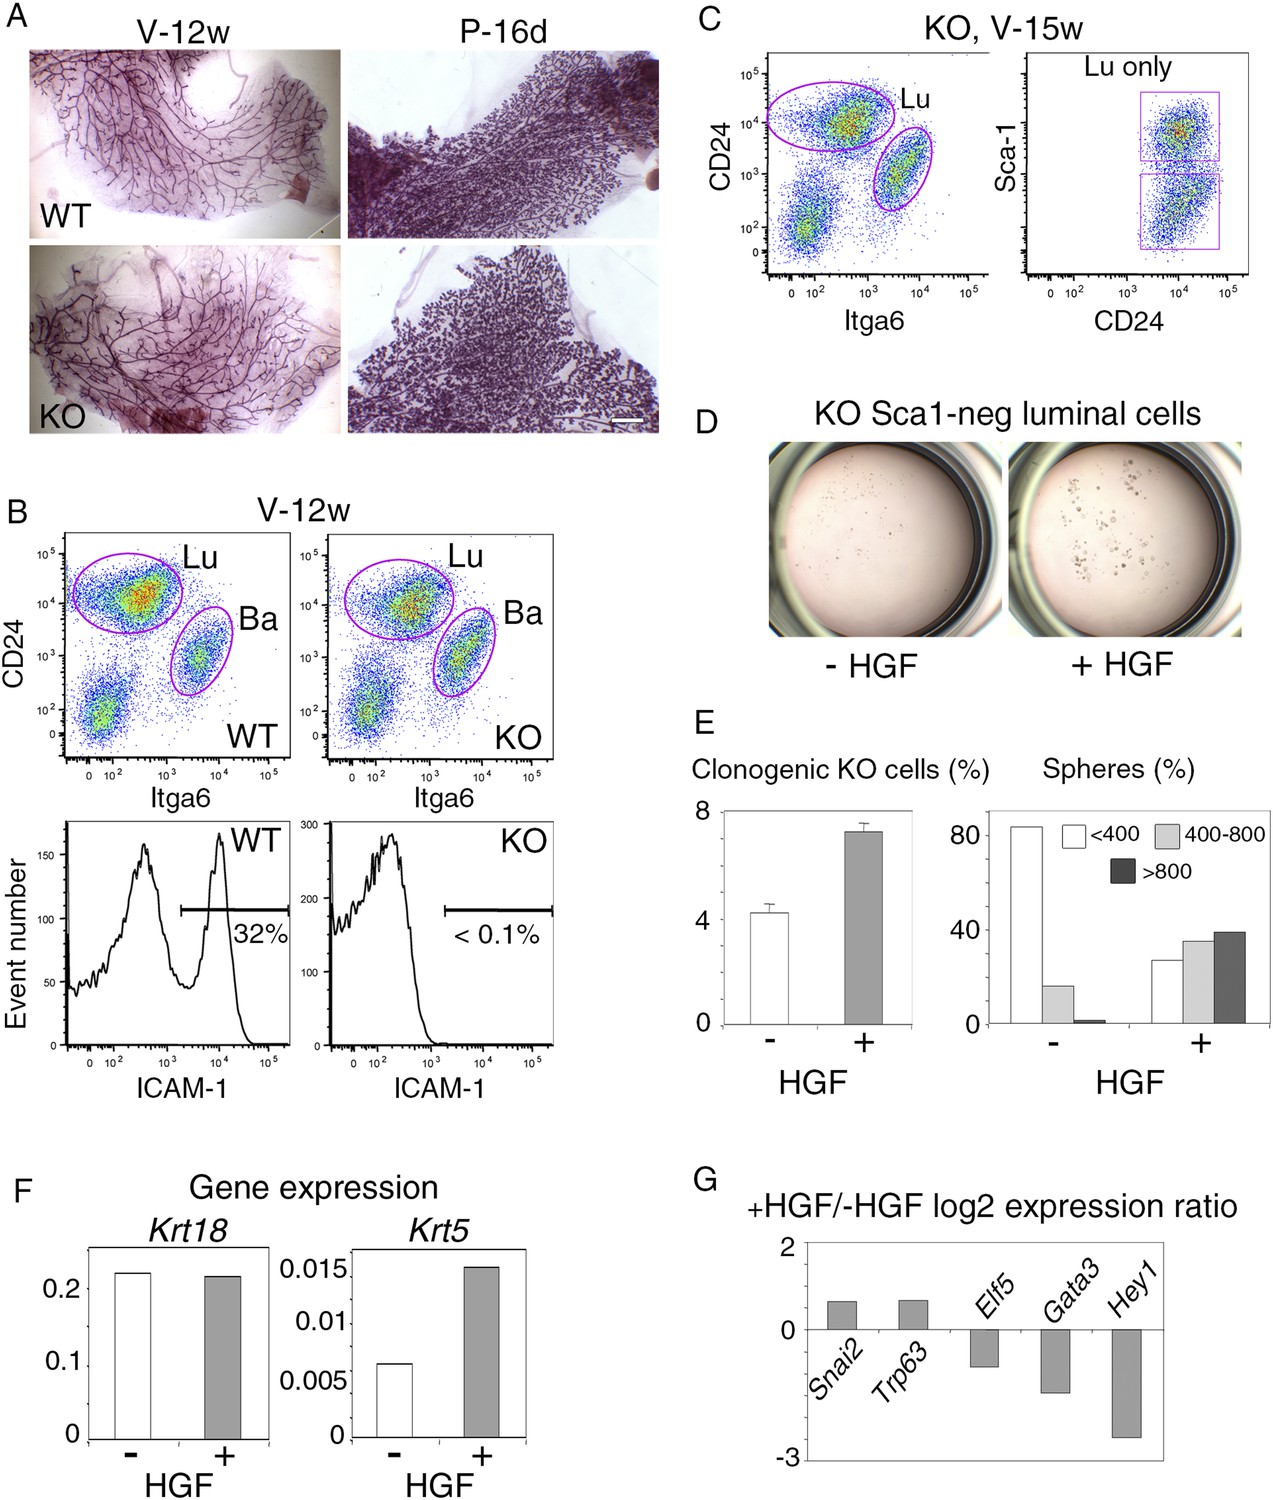
Response of luminal progenitors isolated from Icam1-deficient mammary epithelium to HGF stimulation.
(A) Representative images of carmine-stained mammary glands from adult wild-type (WT) and Icam1-KO mice. V-12w, 12-week-old virgin and P-16d, 16-day pregnant females. Bar, 1.5 mm. (B) Flow cytometry analysis of CD24, Itga6, and ICAM-1 expression in mammary epithelial cells freshly isolated from adult virgin WT and Icam1-KO females. Upper panels: Dot plots of CD24 and Itga6 distribution showing luminal and basal cell compartments. The percentages of luminal cells were equal to 74 ± 9% and 67 ± 9% (data from four independent sorting experiments) in WT and KO epithelium, respectively. Lower panels: Corresponding histograms of ICAM-1 expression in the whole mammary cell population. (C) Flow cytometry analysis of CD24, Itga6 and Sca-1 expression in mammary epithelial cells isolated from adult virgin Icam1-KO females. Left panel: Dot plots of CD24 and Itga6 distribution. Right panel: Dot plots of CD24 and Sca-1 expression in the luminal cell population. (D) Representative microphotographs of primary mammospheres derived from purified Icam1-KO Sca1-neg luminal cells and grown in the presence or absence of HGF for 12 days. (E) Characteristics of primary mammospheres derived from purified Icam1-KO Sca1-neg luminal cells. Left panel: average percentages (±S.E.M) of clonogenic cells in non-stimulated and HGF-stimulated cultures. Data from one cell preparation with three separate wells are shown. Right panel: sphere size distribution (in arbitrary units) in HGF-treated and untreated cultures. At least 250 spheres were analyzed per conditions. (F) Krt18 and Krt5 expression levels in spheres derived from untreated and HGF-treated Icam1-KO Sca1-neg luminal cells. The values were normalized to Gapdh expression. (G) Comparative expression levels of basal-specific, EMT-associated and luminal-specific genes in spheres derived from untreated and HGF-treated Icam1-KO Sca1-neg luminal cells. The q-PCR data are expressed as log2 ratios of values normalized to Gapdh. The comparator values were those obtained with untreated spheres.
Figure 10
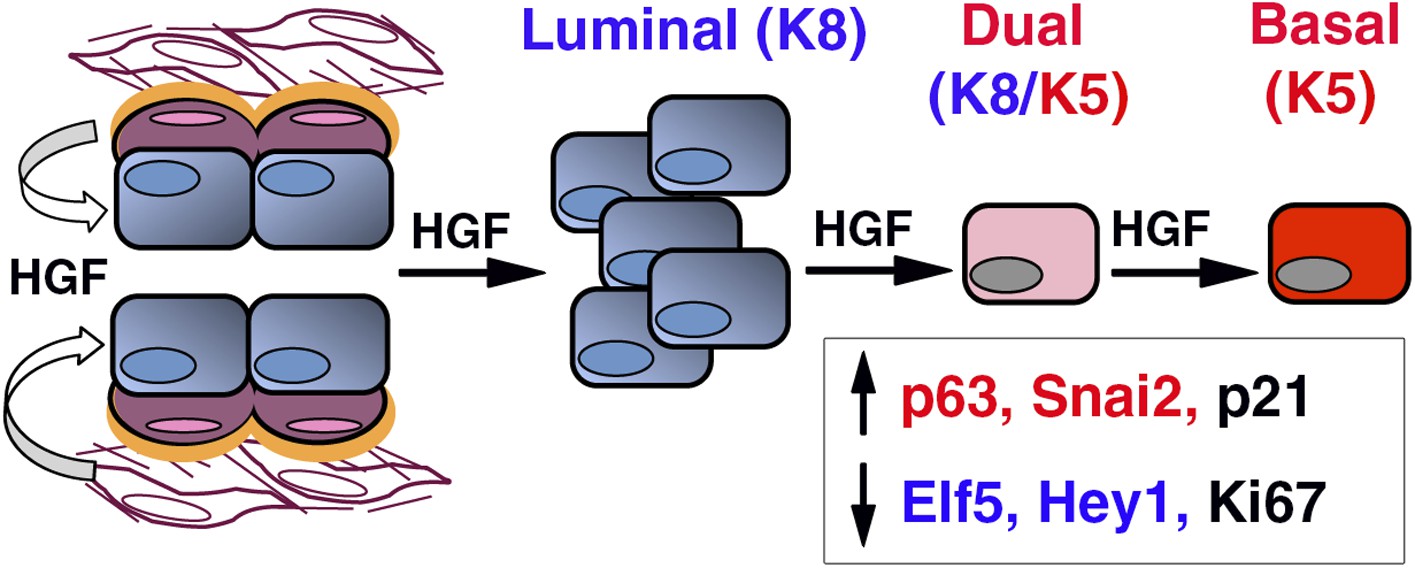
HGF/Met signaling in the mammary tissue.
Luminal progenitors express Met, whereas stromal and basal myoepithelial cells produce HGF. Paracrine HGF/Met signaling can control the survival and proliferation of luminal progenitors and affects their fate by modulating antagonistic regulators of basal- (p63, Snail2) and luminal-specific (Elf5, Hey1) regulators.
Additional files
-
Supplementary file 1
Regenerative capacity of cells isolated from untreated and HGF-treated primary spheres.
- https://doi.org/10.7554/eLife.06104.026
-
Supplementary file 2
List of primers for q-PCR.
- https://doi.org/10.7554/eLife.06104.027
Download links
A two-part list of links to download the article, or parts of the article, in various formats.
Downloads (link to download the article as PDF)
Open citations (links to open the citations from this article in various online reference manager services)
Cite this article (links to download the citations from this article in formats compatible with various reference manager tools)
Paracrine Met signaling triggers epithelial–mesenchymal transition in mammary luminal progenitors, affecting their fate
eLife 4:e06104.
https://doi.org/10.7554/eLife.06104


