Quality control of transcription start site selection by nonsense-mediated-mRNA decay
- Centre National de la Recherche Scientifique, France
- Institut Pasteur, France
Figures
Figure 1 with 2 supplements
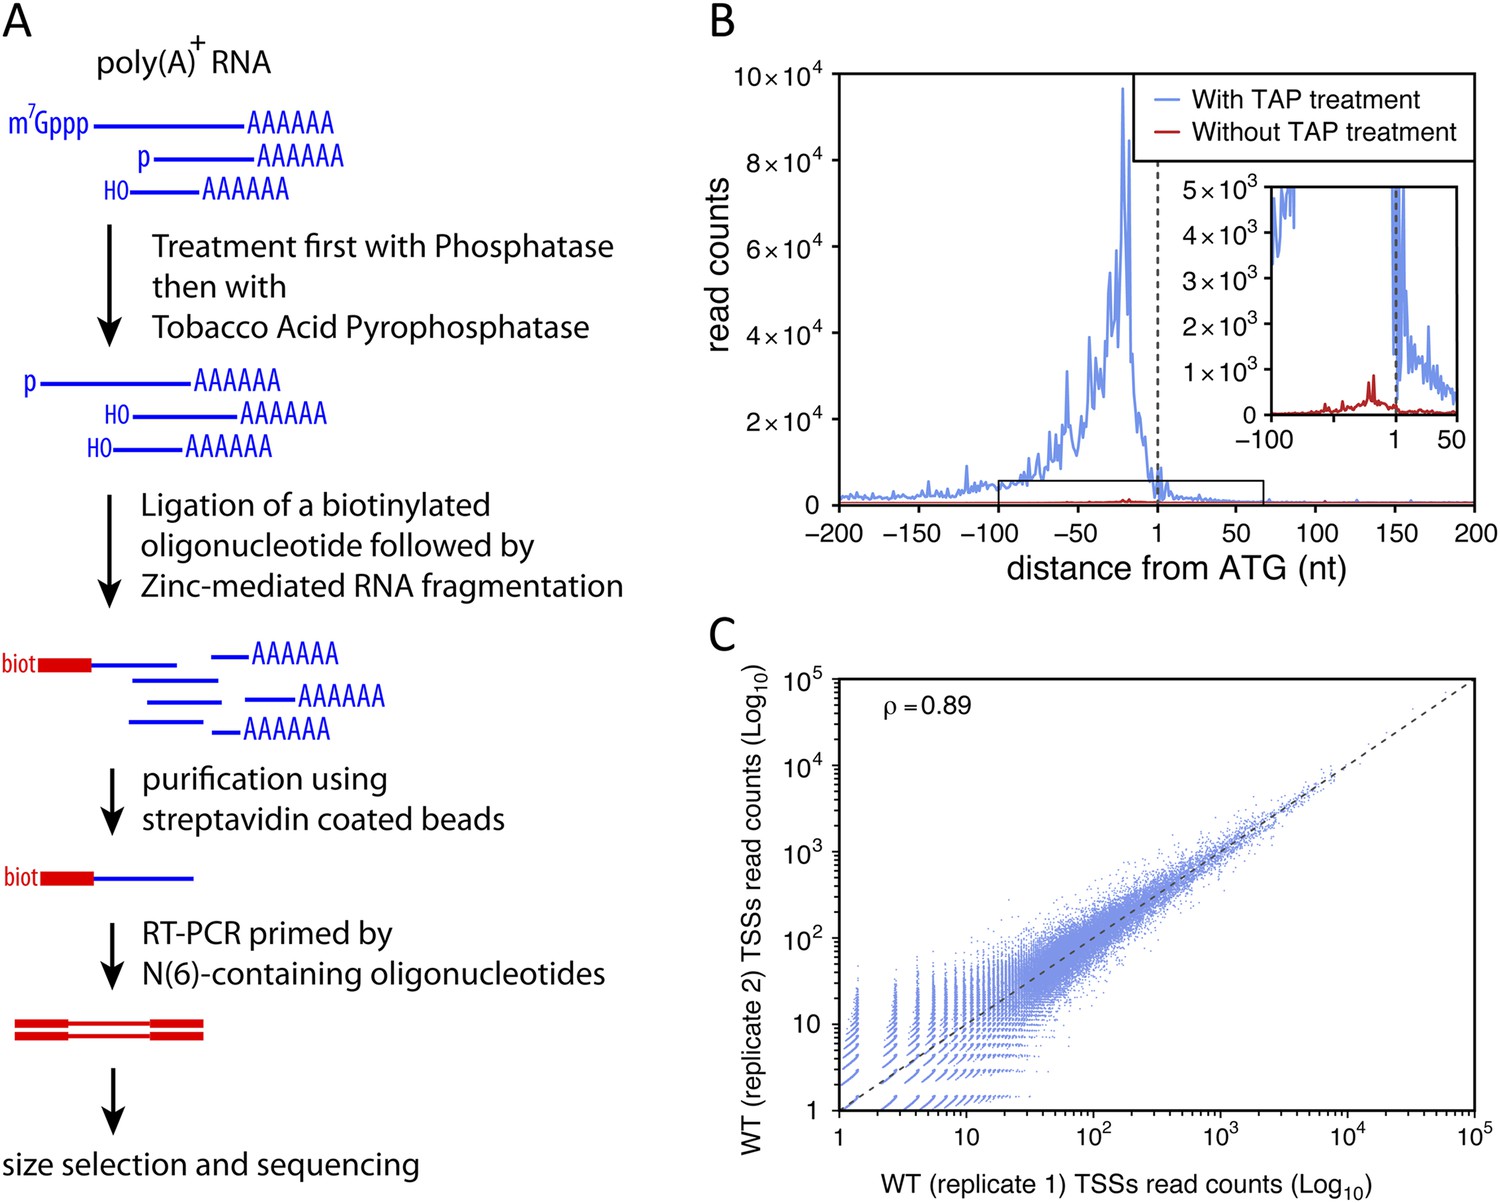
Transcription start site sequencing.
(A) Schematic view of the methodology used to produce the transcription start site (TSS) sequence-tag libraries (RNA molecules are in blue, DNA molecules in red). (B) All protein-coding genes were aligned on the A of their annotated ATG start codon and the distribution of the TSSs read counts was computed for each position in a window from −200 to +200 nucleotides for samples treated (blue curve) or not (red curve) with tobacco acid pyrophosphatase (TAP). The insert within the figure shows a zoomed view of the −100 to +50 nucleotide region. (C) Correlation between two biologically independent replicates (replicate 1: library L5p_03.WT, replicate 2: library L5p_04.WT; see Table 1). The Pearson's correlation value (ρ) between the read counts of the 174,151 TSSs identified in the two data sets is indicated.
Figure 1—figure supplement 1
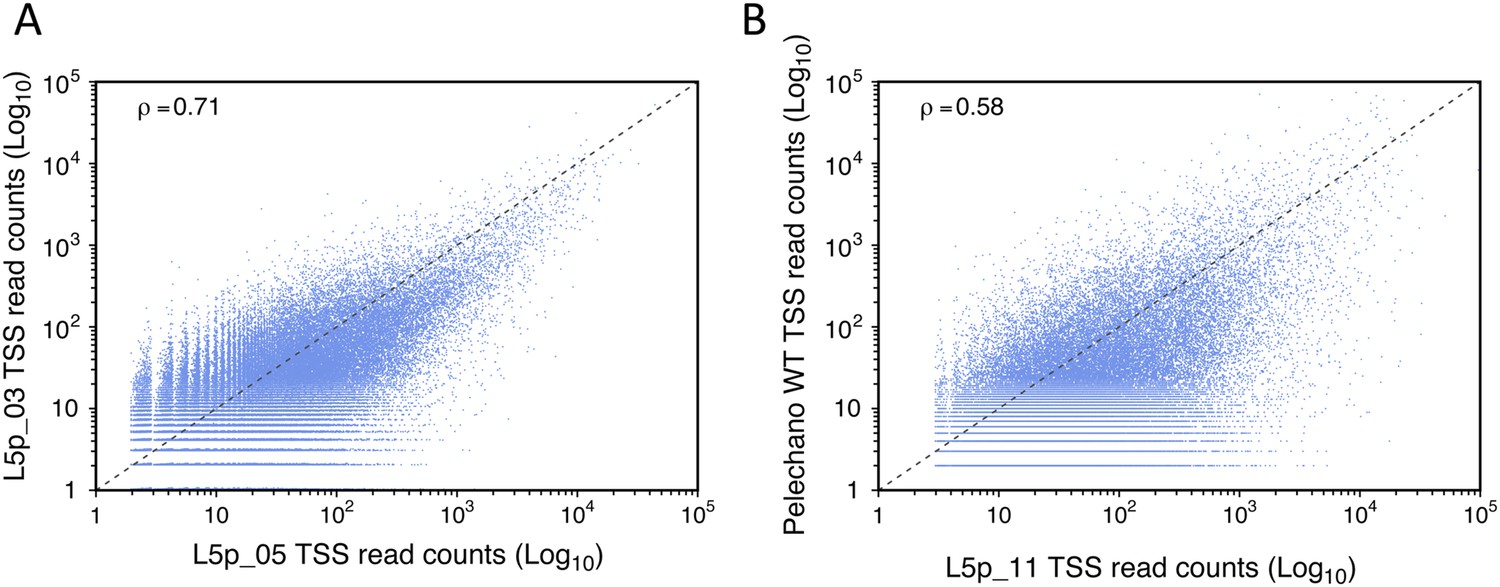
Reproducibility of transcription start site (TSS) sequencing.
Correlation between two data sets generated in our laboratory months apart (A) and between our data and those published by Pelechano et al. (2013) (B). The Pearson's correlation value (ρ) between the two data sets is indicated.
Figure 1—figure supplement 2

Transcription start site (TSS) consensus sequences.
(A) Consensus sequence around all the identified TSSs generated using the Web-LOGO algorithm (Crooks et al., 2004). The site of transcription initiation (the TSS) is labeled +1 while the preceding nucleotide position is labeled −1. (B) Percentage of mismatches between the actual genomic sequence and the first base (red squares) or all the other bases (blue dots) of the complementary DNAs (cDNAs) after alignment of the TSS reads on the genome. A, G, C, and T on the bottom line correspond to the genomic sequence. A strong percentage of mismatches (∼60%) was observed specifically for the first cDNA position when pyrimidines are encoded on the genome at the corresponding location. In 80% of the cases, these mismatches consisted of a pyrimidine to A mismatch. (C) As in (A) but taking into account only the TSSs for which a pyrimidine to A mismatch at the 5′-end of the cDNAs was observed. The vertical arrows pointing to an A indicate the fact that the +1 nucleotide position, a pyrimidine in the genome, corresponds to a mismatched A at the first position of the cDNA. Up to 30% of the cDNA 5′-ends mapping on a pyrimidine actually conform to this consensus. Note that the presence of a conserved A at position −7 while it is located at position −8 in the general consensus and the presence of the pyrimidine to A mismatch suggests that transcription may not start at the pyrimidine but rather at the following A. Indeed, if one would remove the base at the 5′-end of the cDNA reads and align these to the genome, they would then perfectly conform to the general consensus, including the A at position −8, suggesting that an extra A is added at the 5′-end of the transcript during its synthesis. (D) Schematic model depicting how a one nucleotide ‘backward-shift’ relative to the template occurring during the transcription of the first three consecutive As might lead to the incorporation of four As at the beginning of the transcript. This scenario is supported by the fact that for TSSs mapped at PyAAA sequences, the corresponding transcripts carried three or four As at about equal frequencies, which suggests that this ‘one nucleotide back-shifting’ phenomenon occurs about half of the time when transcription initiates on this particular motif.
Figure 2
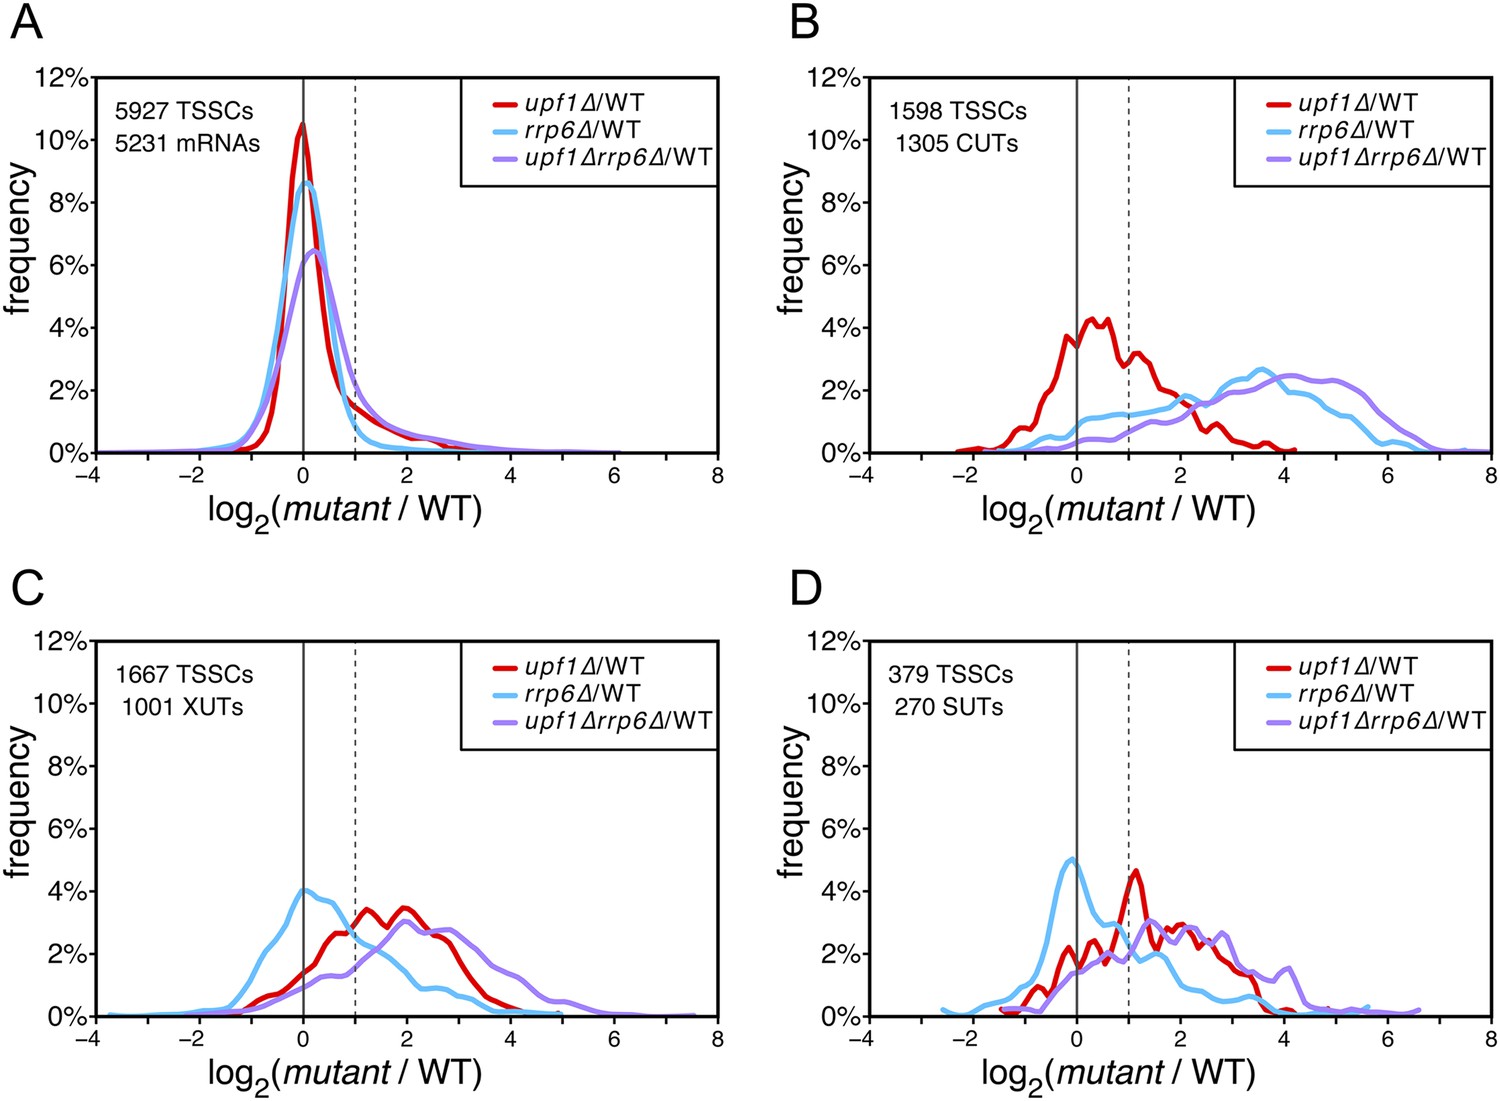
Differential effect of UPF1 and/or RRP6 deletion on mRNAs and pervasive transcripts.
Frequency distribution of the ratios of transcription start site clusters (TSSCs) read counts in upf1∆ (red), rrp6∆ (blue), or upf1∆rrp6∆ (purple) compared with wild-type (WT) for mRNAs (A), cryptic unstable transcripts (CUTs) (B), Xrn1-sensitive transcripts (XUTs) (C) and stable unannotated transcripts (SUTs) (D). The dashed vertical lines mark a twofold increase in TSSC read counts in the various mutants relative to the wild-type. The number of identified TSSCs and of features to which they were assigned is indicated for each transcript class. Note that CUTs, XUTs and SUTs constituting overlapping transcript populations, when a TSSC was assigned to a pervasive transcript annotated in more than one of these classes, we arbitrarily associated the corresponding TSSC in priority to CUTs, then to XUTs and finally to SUTs.
Figure 3 with 1 supplement
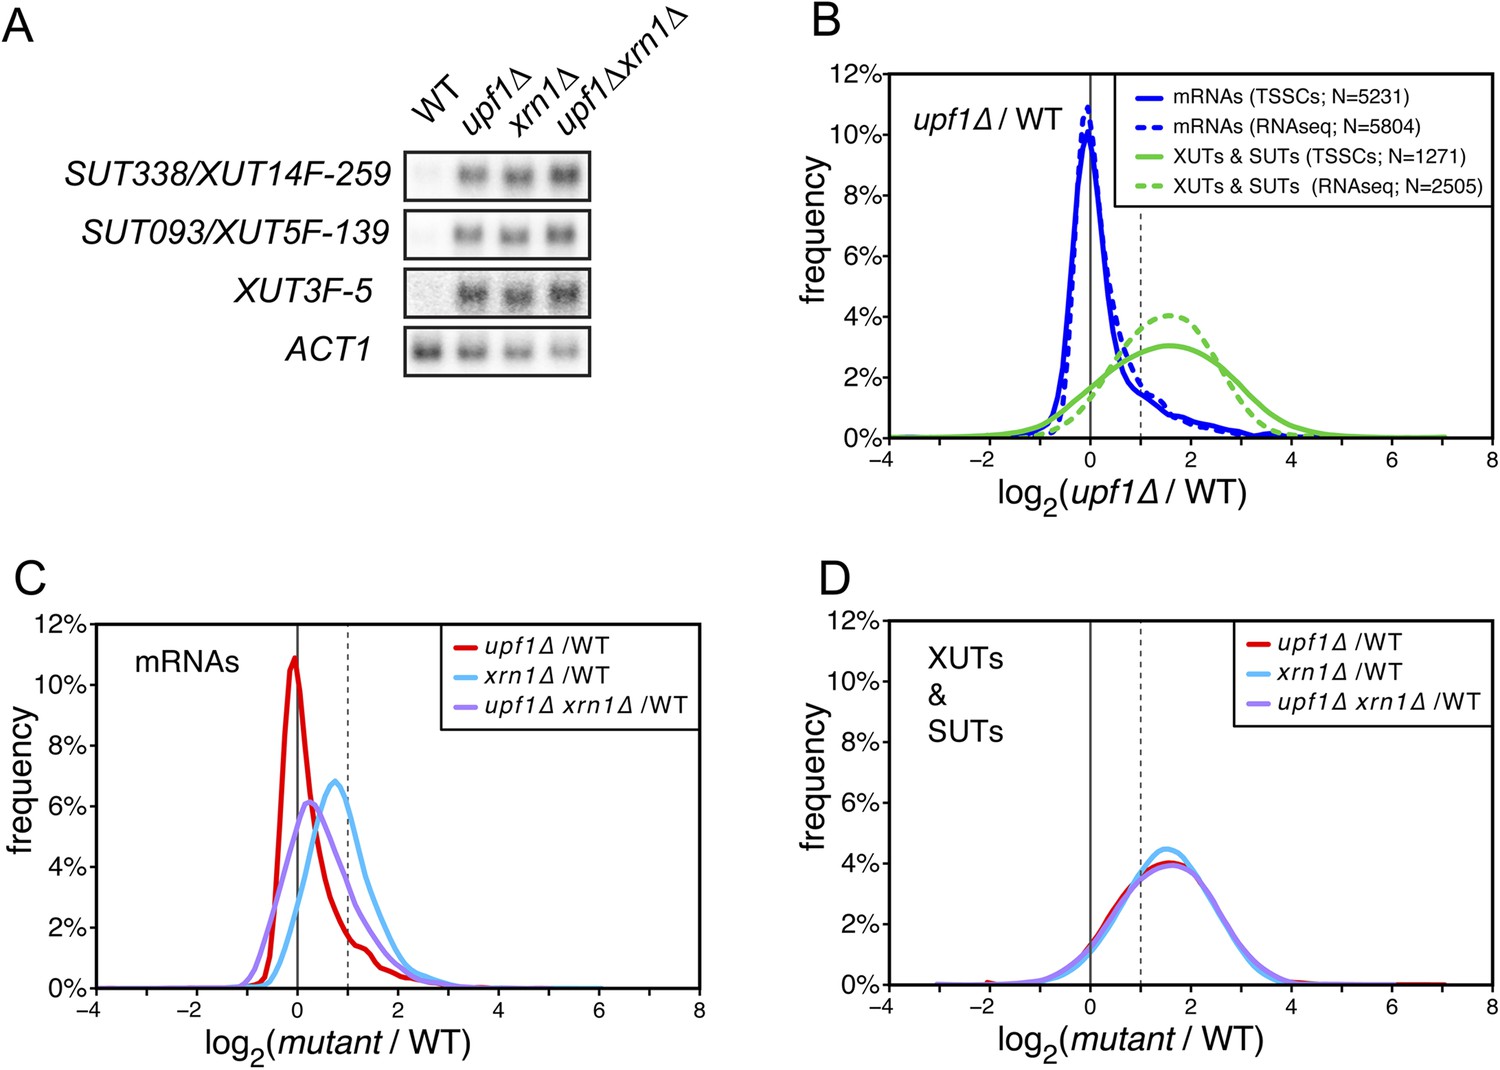
XUTs are primarily targeted for degradation by the nonsense-mediated mRNA decay (NMD).
(A) Northern blot analysis of three different Xrn1-sensitive transcripts (XUTs) in wild-type (WT), upf1∆, xrn1∆, and upf1∆xrn1∆ cells. ACT1 was used as a loading control. (B) Frequency distribution of the ratios of transcription start site clusters (TSSCs) read counts between upf1∆ and wild-type cells obtained with two different methods for library preparation and normalization procedures. ‘TSSCs’ refers to data obtained using the protocol developed to identify TSSs and ‘RNAseq’ to the protocol used to obtain the whole transcriptome (see ‘Materials and methods’). Only reads corresponding to annotated mRNAs, XUTs and SUTs were included in the analysis (see Supplementary file 2). (C) and (D) Frequency distribution of the ratios of read counts for upf1∆ (red), xrn1∆ (blue) or upf1∆xrn1∆ (purple) compared with wild-type for mRNAs and XUTs and SUTs respectively. The vertical dashed lines mark a twofold increase in read counts.
Figure 3—figure supplement 1
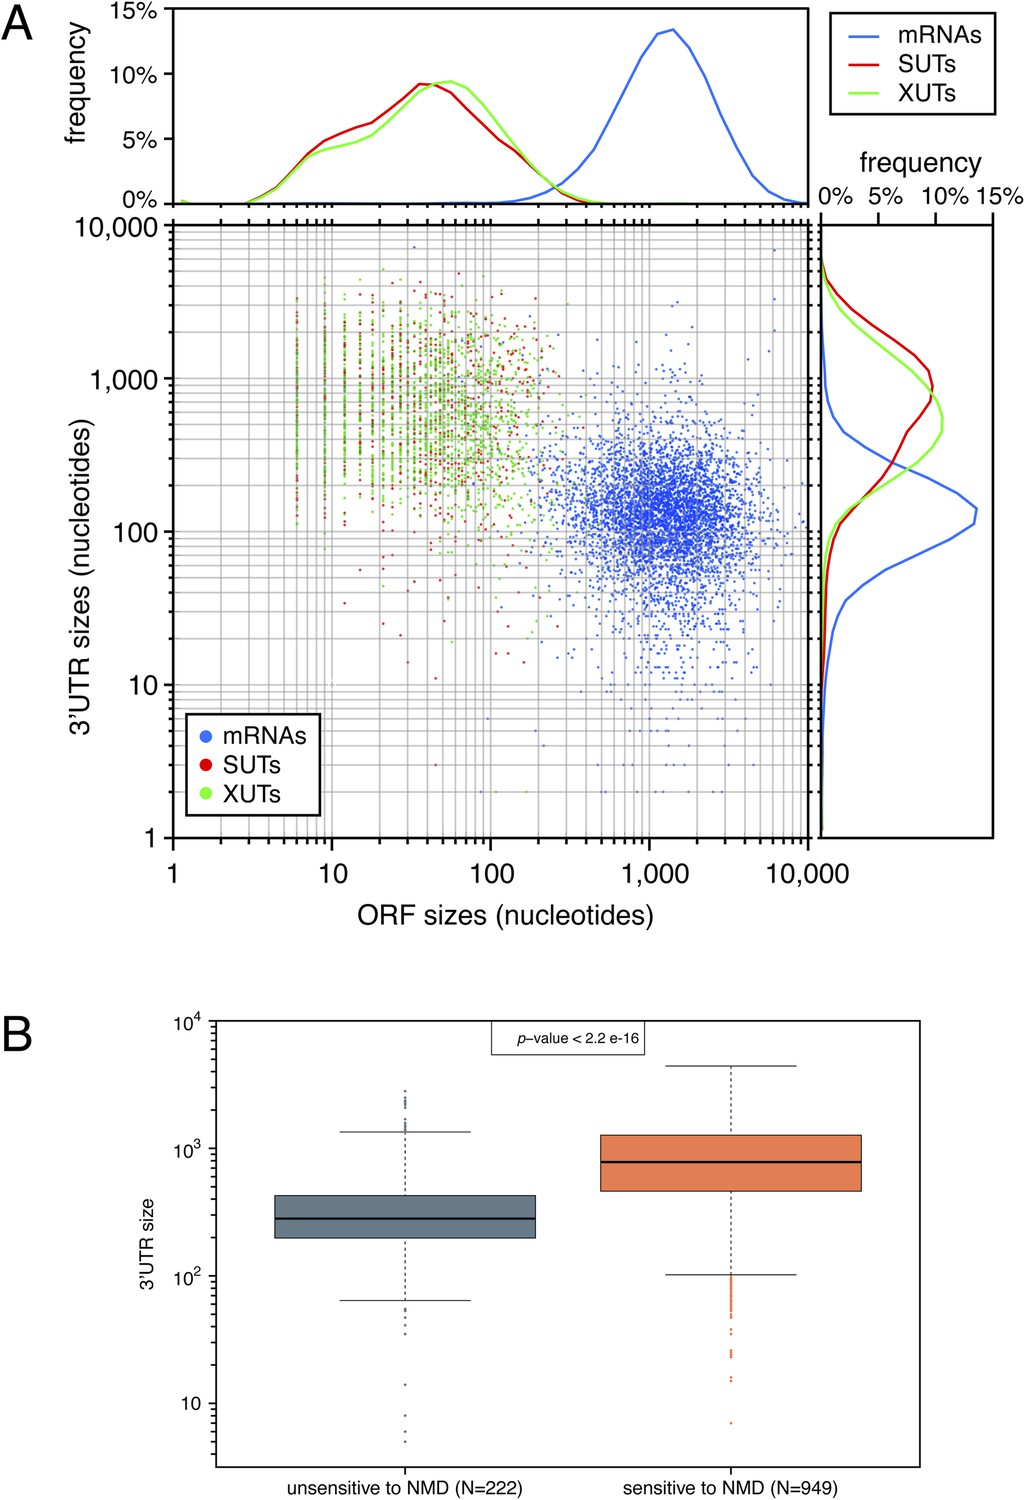
The presence of short open reading frames (ORFs) and long 3′-UTRs is a hallmark of natural nonsense-mediated mRNA decay (NMD) substrates.
(A) Comparison of ORF and 3′-UTR sizes for mRNAs (blue), stable unannotated transcripts (SUTs) (red), and Xrn1-sensitive transcripts (XUTs) (green). The 5′- and 3′-ends were determined for all classes of transcripts using previously published data (Xu et al., 2009; van Dijk et al., 2011; Pelechano et al., 2013). For SUTs and XUTs, we took into account for the analysis the size of the first potential ORF found after the 5′-end and the distance between the end of the transcript and the stop codon of this potential ORF. The median size of these ORFs was 14 amino acids for XUTs and SUTs, compared with 401 for annotated ORFs. The rightmost and uppermost panel displays the frequency distribution of the different features according to the size of their 3′-UTRs and to the size of their ORF respectively. (B) Box plots illustrating the distribution of the size of 3′-UTRs for XUTs and SUTs sensitive (red) or not (blue) to NMD.
Figure 4 with 2 supplements
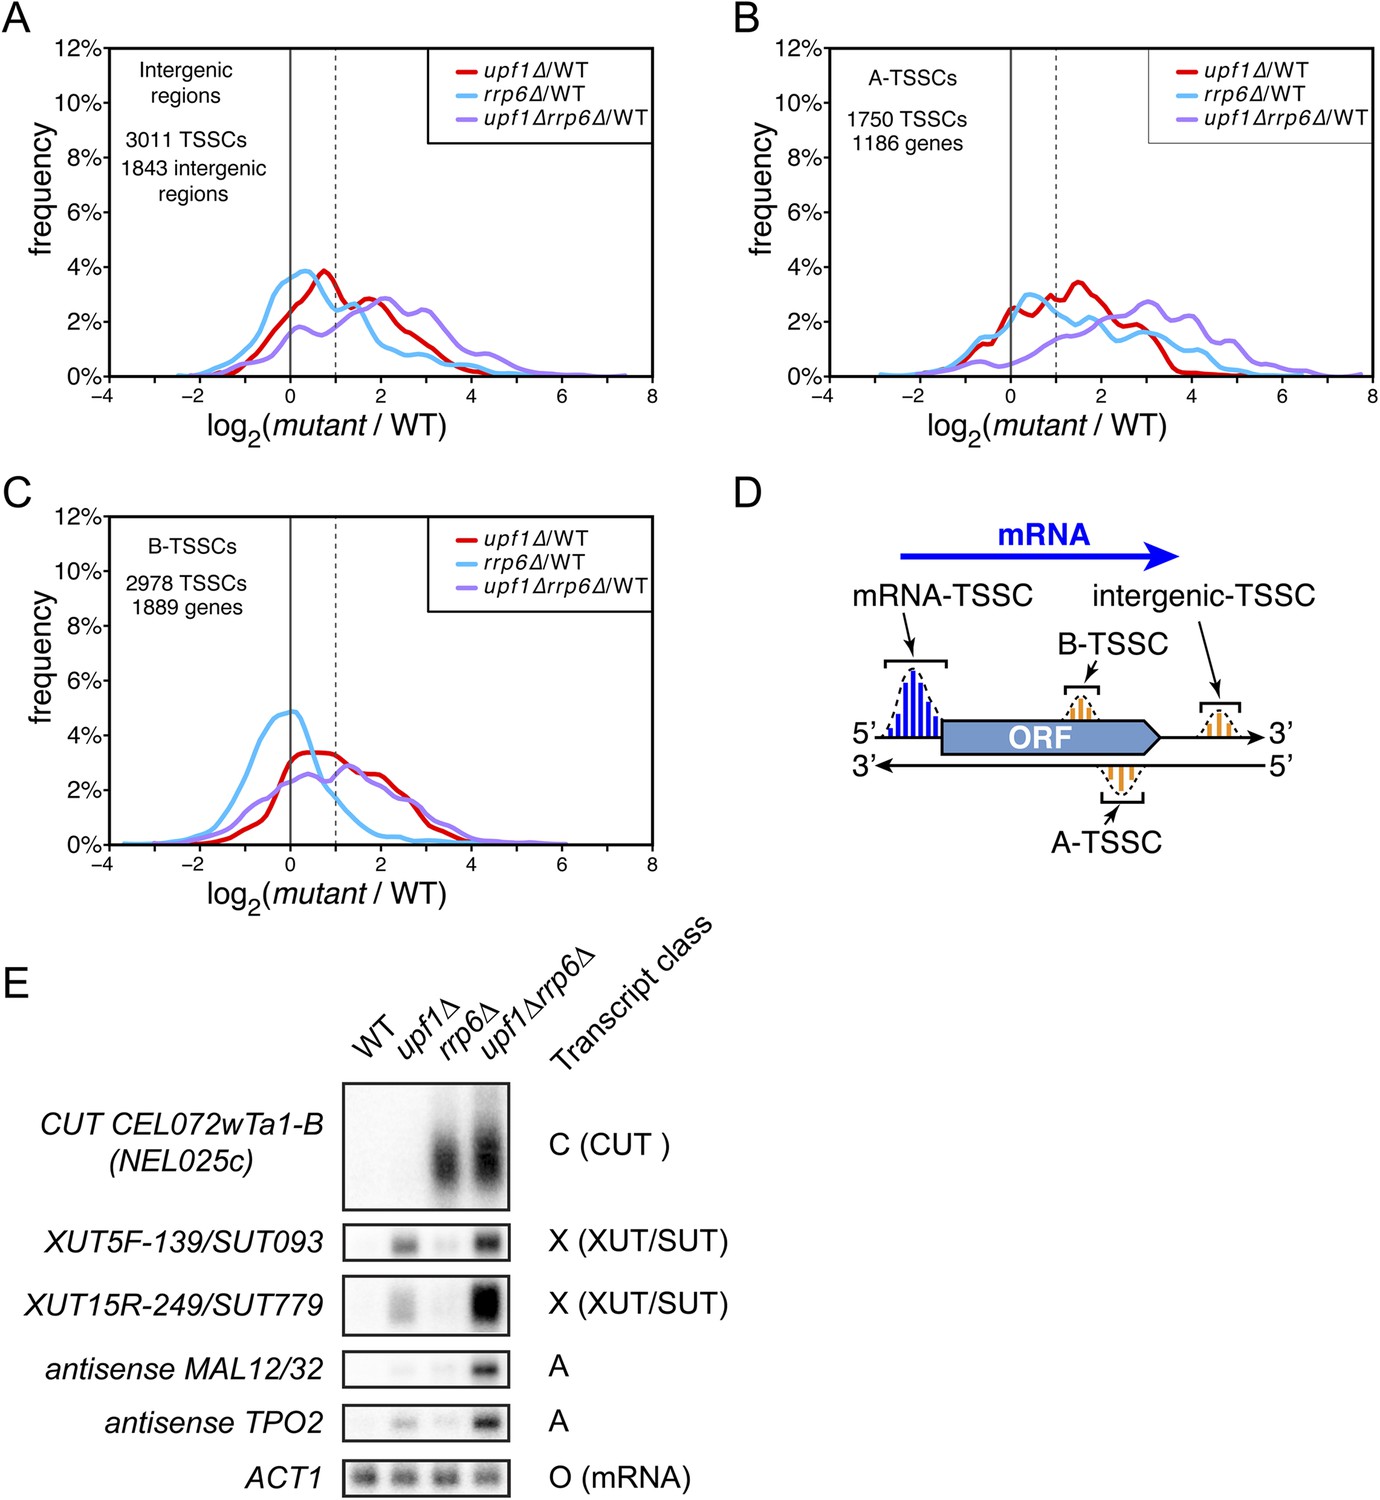
Novel transcripts revealed upon deletion of UPF1 and/or RRP6.
(A–C) Frequency distribution of the ratios of transcription start site clusters (TSSCs) read counts in upf1∆ (red), rrp6∆ (blue) or upf1∆rrp6∆ (purple) compared with wild-type for transcripts initiating within intergenic regions—‘intergenic TSSCs’ (A), from within an mRNA transcribed region but antisense to the mRNA—A-TSSCs (B) or within an mRNA transcribed region, but in the sense orientation with respect to the mRNA—B-TSSCs (C). (D) Schematic representation of the various classes of TSSCs described above. The small blue and orange vertical bars represent individual TSSs within TSSCs (dashed lines). (E) Northern blot analysis of poly(A)+ RNA from wild-type, upf1∆, rrp6∆ and upf1∆rrp6∆. The category to which the transcripts belong is indicated on the right. ACT1 was used as a loading control.
Figure 4—figure supplement 1
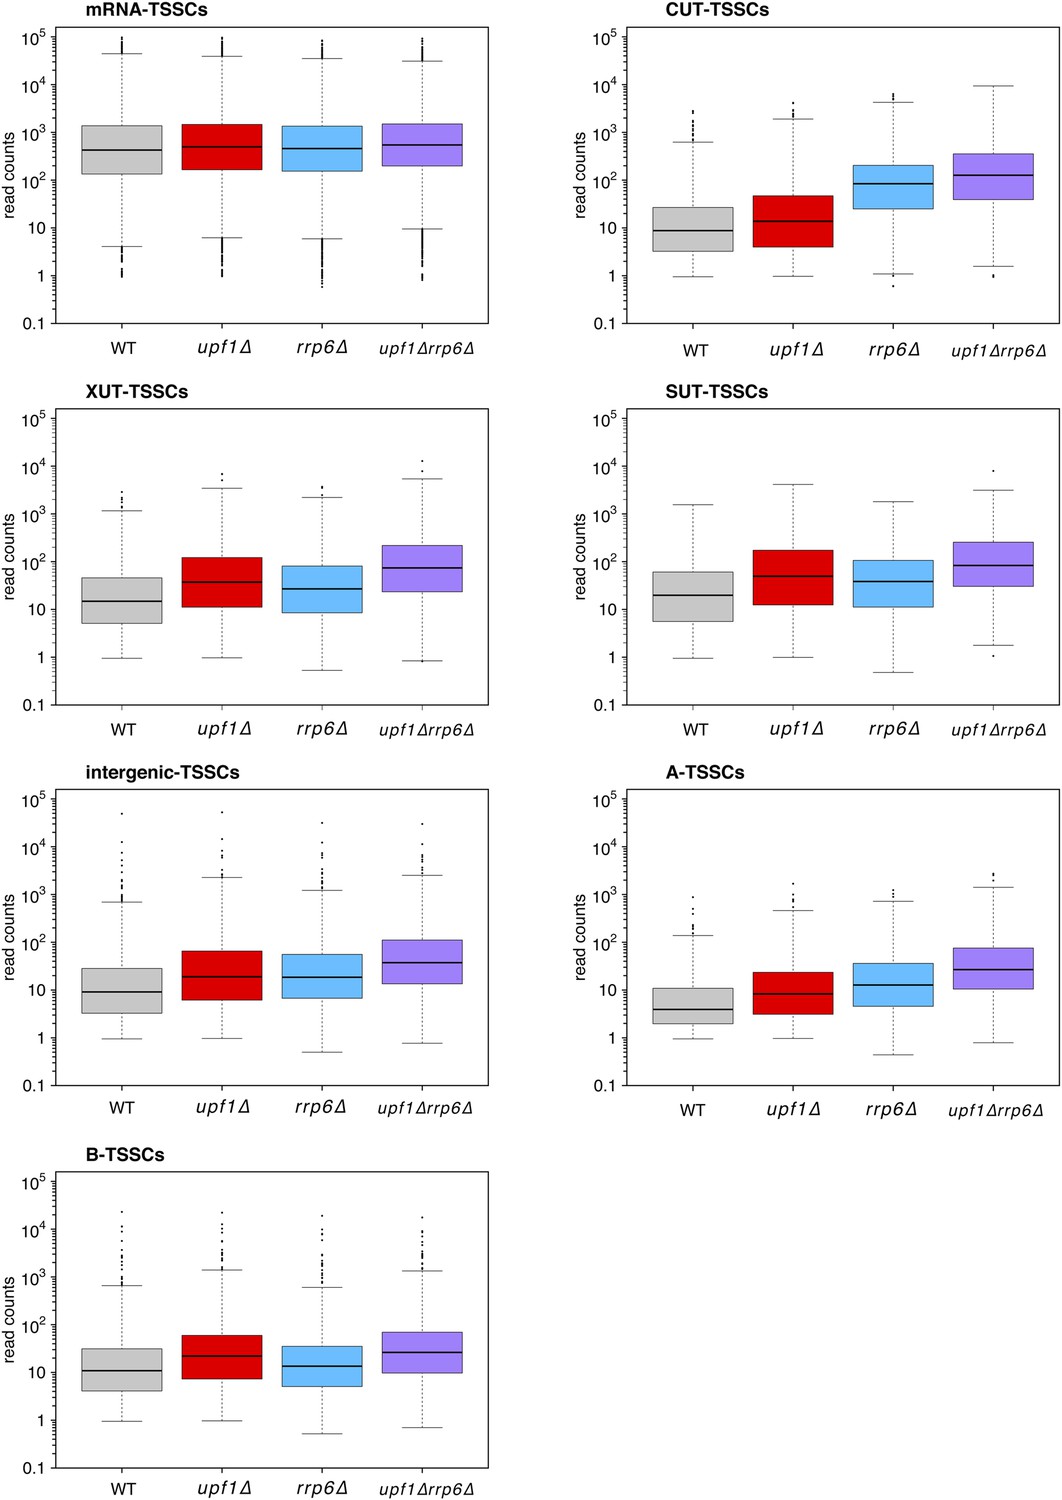
Distribution of read counts for different classes of transcripts.
Box plots illustrating the distribution of read counts for the different classes of transcription start site clusters (TSSCs) identified in this study for wild-type (WT) (grey), upf1∆ (red), rrp6∆ (blue), and upf1∆rrp6∆ (purple) cells.
Figure 4—figure supplement 2
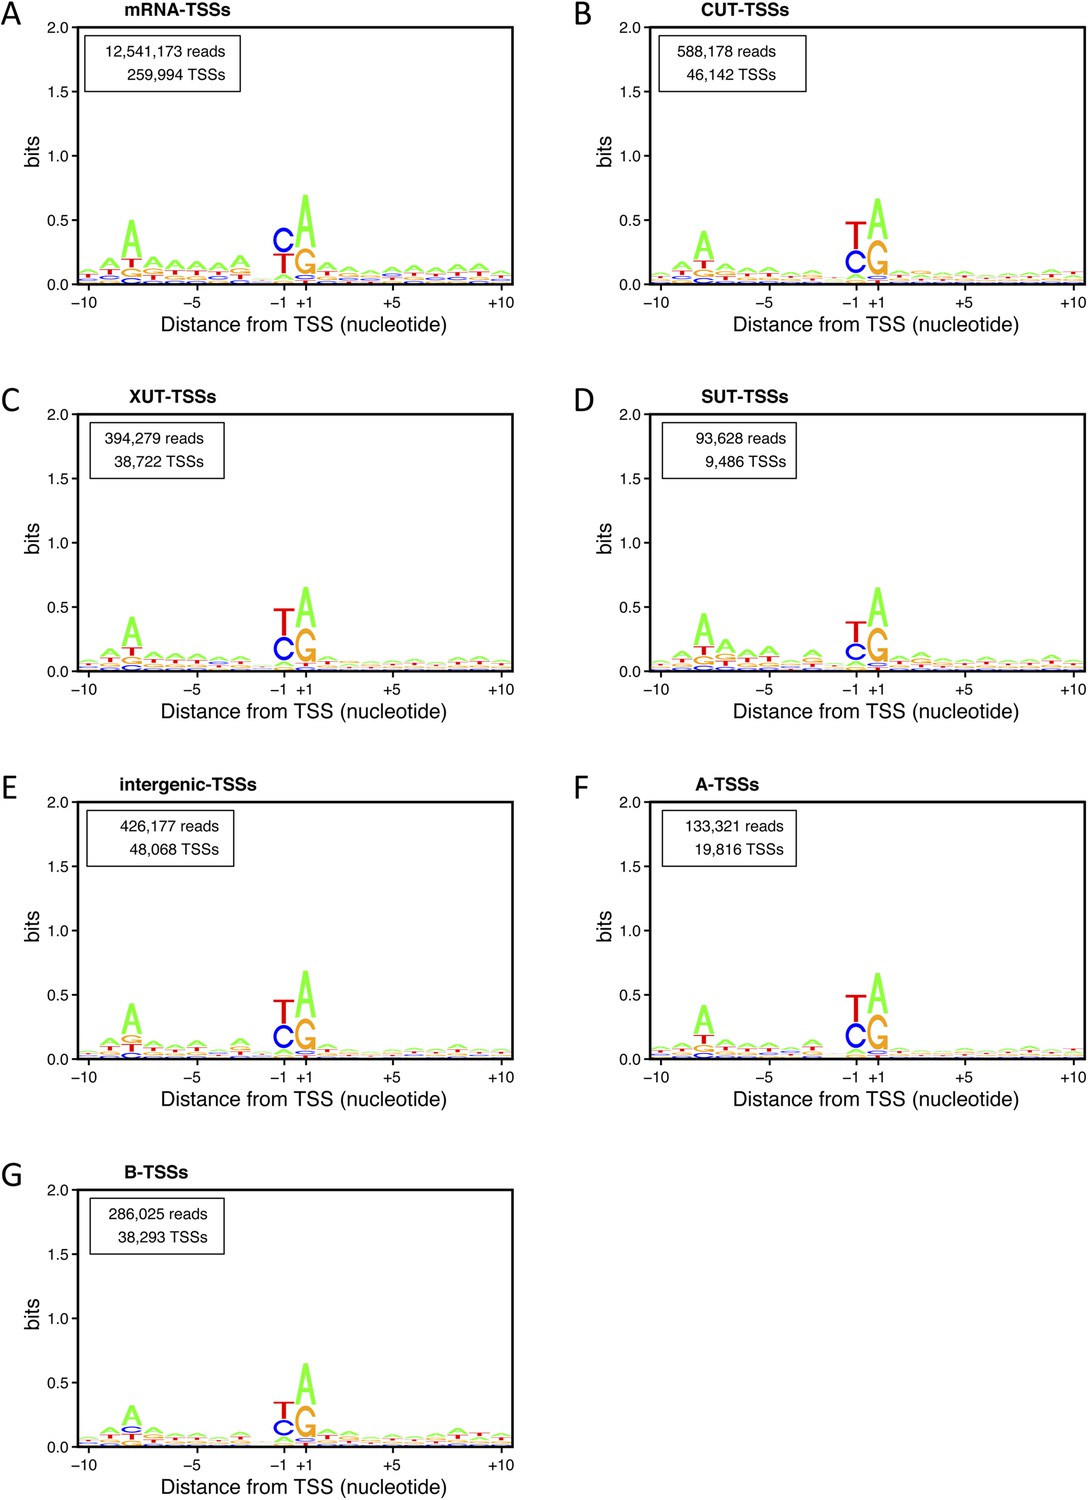
Transcription start site (TSS) consensus sequences for the different classes of transcripts.
Consensus sequences around the TSSs generated using the Web-LOGO algorithm (Crooks et al., 2004) for the different categories of TSS clusters (TSSCs) identified in this study: mRNAs (A), cryptic unstable transcripts (CUTs) (B), Xrn1-sensitive transcripts (XUTs) (C), stable unannotated transcripts (SUTs) (D), 'intergenic' transcripts (E), A intragenic (F) and B intragenic (G) transcripts. The numbers of reads and TSSs are indicated.
Figure 5 with 1 supplement

Effect of the absence of SET2 on transcription start sites (TSSs) identified inside open reading frames (ORFs).
(A) Frequency distribution of the ratios of TSS clusters (TSSCs) read counts in upf1∆set2∆ compared with upf1∆ cells for the intragenic A-TSSCs. The comparison was performed for all the TSSCs (blue line) and for the ones identified in a single upf1∆ mutant (red line). (B) As in (A) but for B-TSSCs.
Figure 5—figure supplement 1
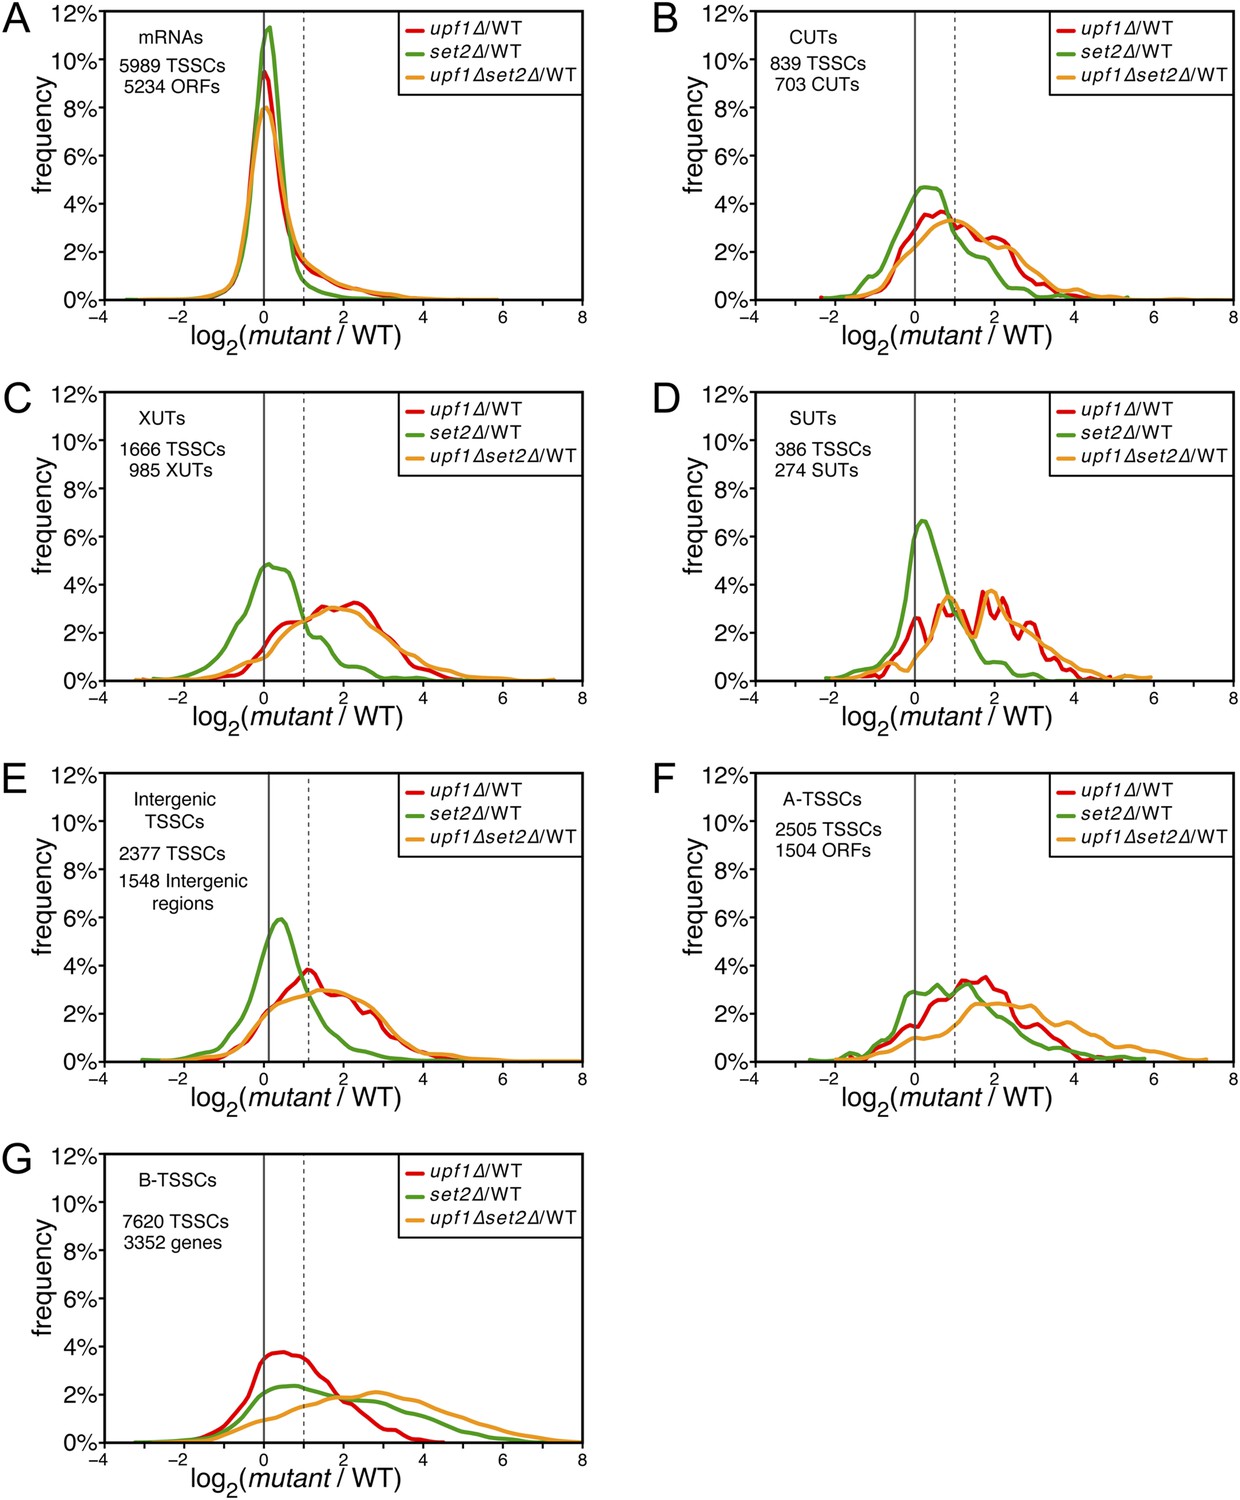
Deletion of SET2 specifically increases the expression level of intragenic transcription start site clusters (TSSCs).
(A–G) Frequency distribution of the ratios of TSSC read counts in upf1∆ (red), set2∆ (green) or upf1∆ set2∆ (orange) compared with wild-type for mRNAs (A), cryptic unstable transcripts (CUTs) (B), Xrn1-sensitive transcripts (XUTs) (C), stable unannotated transcripts (SUTs) (D), ‘intergenic’ (E), ‘A-’ (F) and B-TSSCs (G). The dashed vertical lines mark a twofold (log2 = 1) increase in TSS counts in the mutants relative to the wild-type. The numbers of identified TSSCs and of features to which they were assigned is indicated for each class.
Figure 6 with 2 supplements
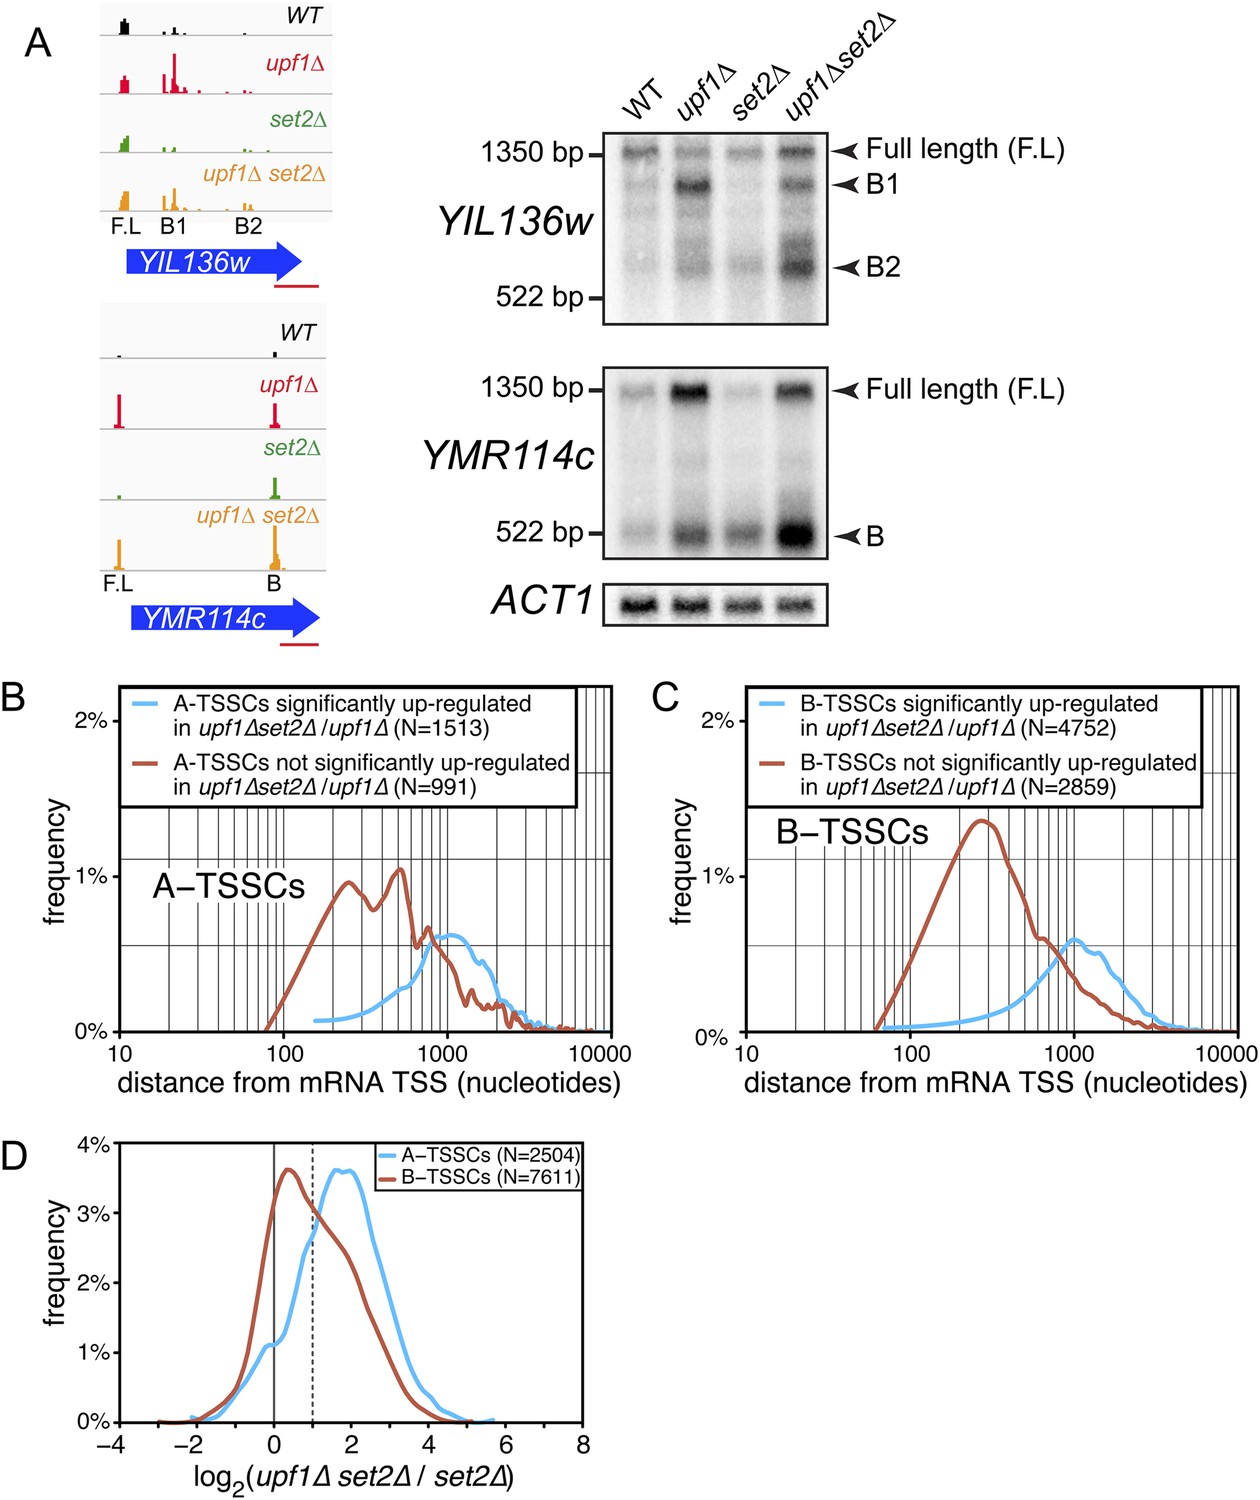
Transcription start site (TSSs) identified inside open reading frames (ORFs) show a differential sensitivity to the absence of SET2 according to their position along the mRNA.
(A) Visualization of the TSS reads at the YIL136w and YMR114c loci in the wild-type (WT; black), upf1∆ (red), set2∆ (green), and upf1∆set2∆ (orange) cells. The blue arrows represent ORFs and the horizontal red bar the position of the probes used for the Northern blots displayed on the right. Arrowheads in the right panel indicate the position of the full-length and internally initiated (B1, B2, and B) transcripts. (B) and (C) Frequency distribution of A-TSSCs and B-TSSCs read counts respectively in upf1∆set2∆ vs upf1∆ according to the distance from their associated mRNA TSS. Blue and red lines are for TSSCs sensitive and insensitive to the deletion of SET2 respectively. (D) Frequency distribution of read counts for the A- (blue) and B- (red) TSSCs in upf1∆set2∆ compared to set2∆ cells.
Figure 6—figure supplement 1
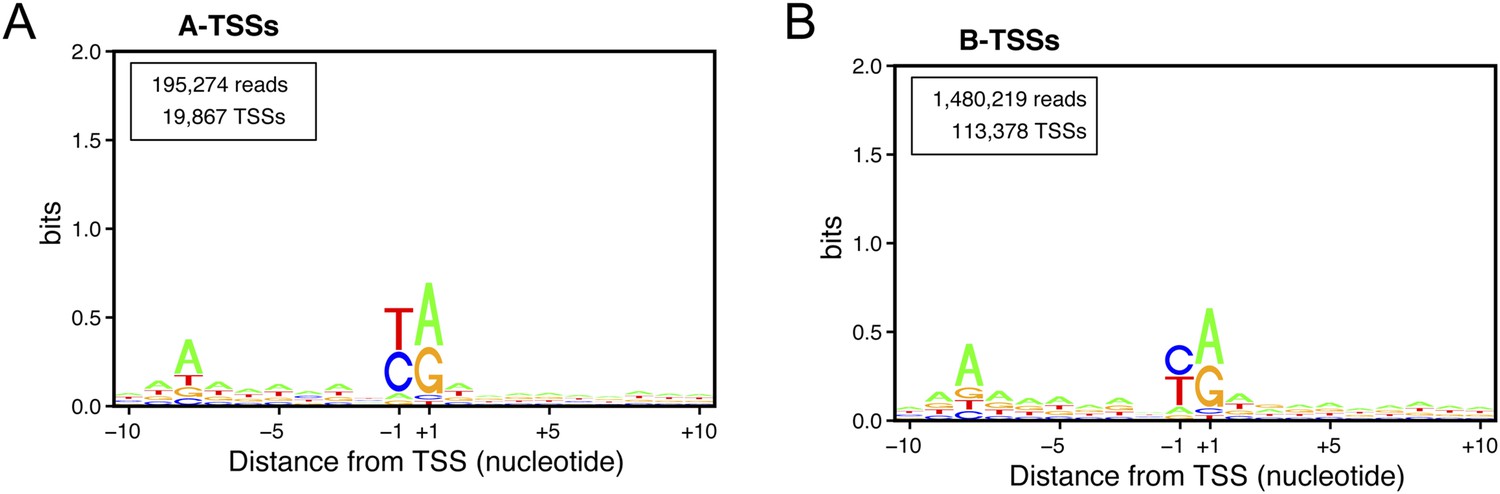
Consensus sequences around the transcription start sites (TSSs) for (A) A-TSSCs and (B) B-TSSCs identified in the upf1∆set2∆ mutant generated using the Web-LOGO algorithm (Crooks et al., 2004).
The numbers of reads and TSSs are indicated.
Figure 6—figure supplement 2
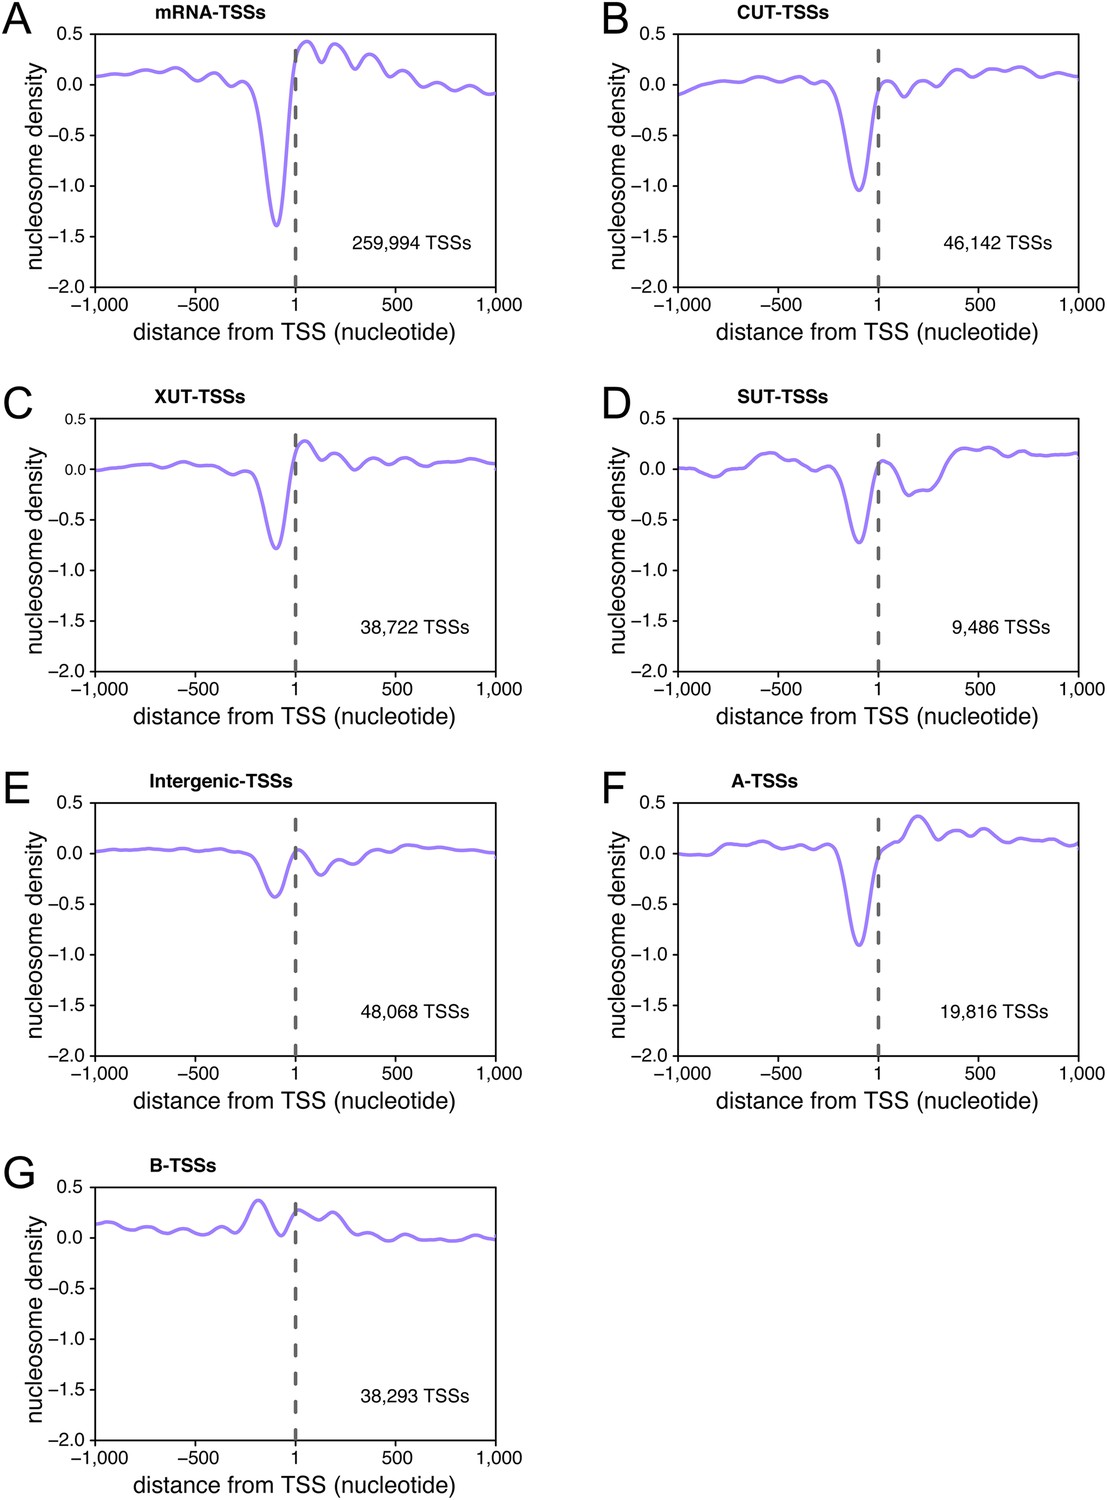
Transcription start sites (TSSs) are associated within nucleosome-free regions.
Average nucleosome density retrieved from Kaplan et al. (2009) plotted as a function of the distance of individual TSSs for TSSs belonging to the different categories of TSS clusters (TSSCs) identified in this study: mRNAs (A), cryptic unstable transcripts (CUTs) (B), Xrn1-sensitive transcripts (XUTs) (C), stable unannotated transcripts (SUTs) (D), 'intergenic' transcripts (E), A intragenic (F) and B intragenic (G) transcripts.
Figure 7 with 2 supplements
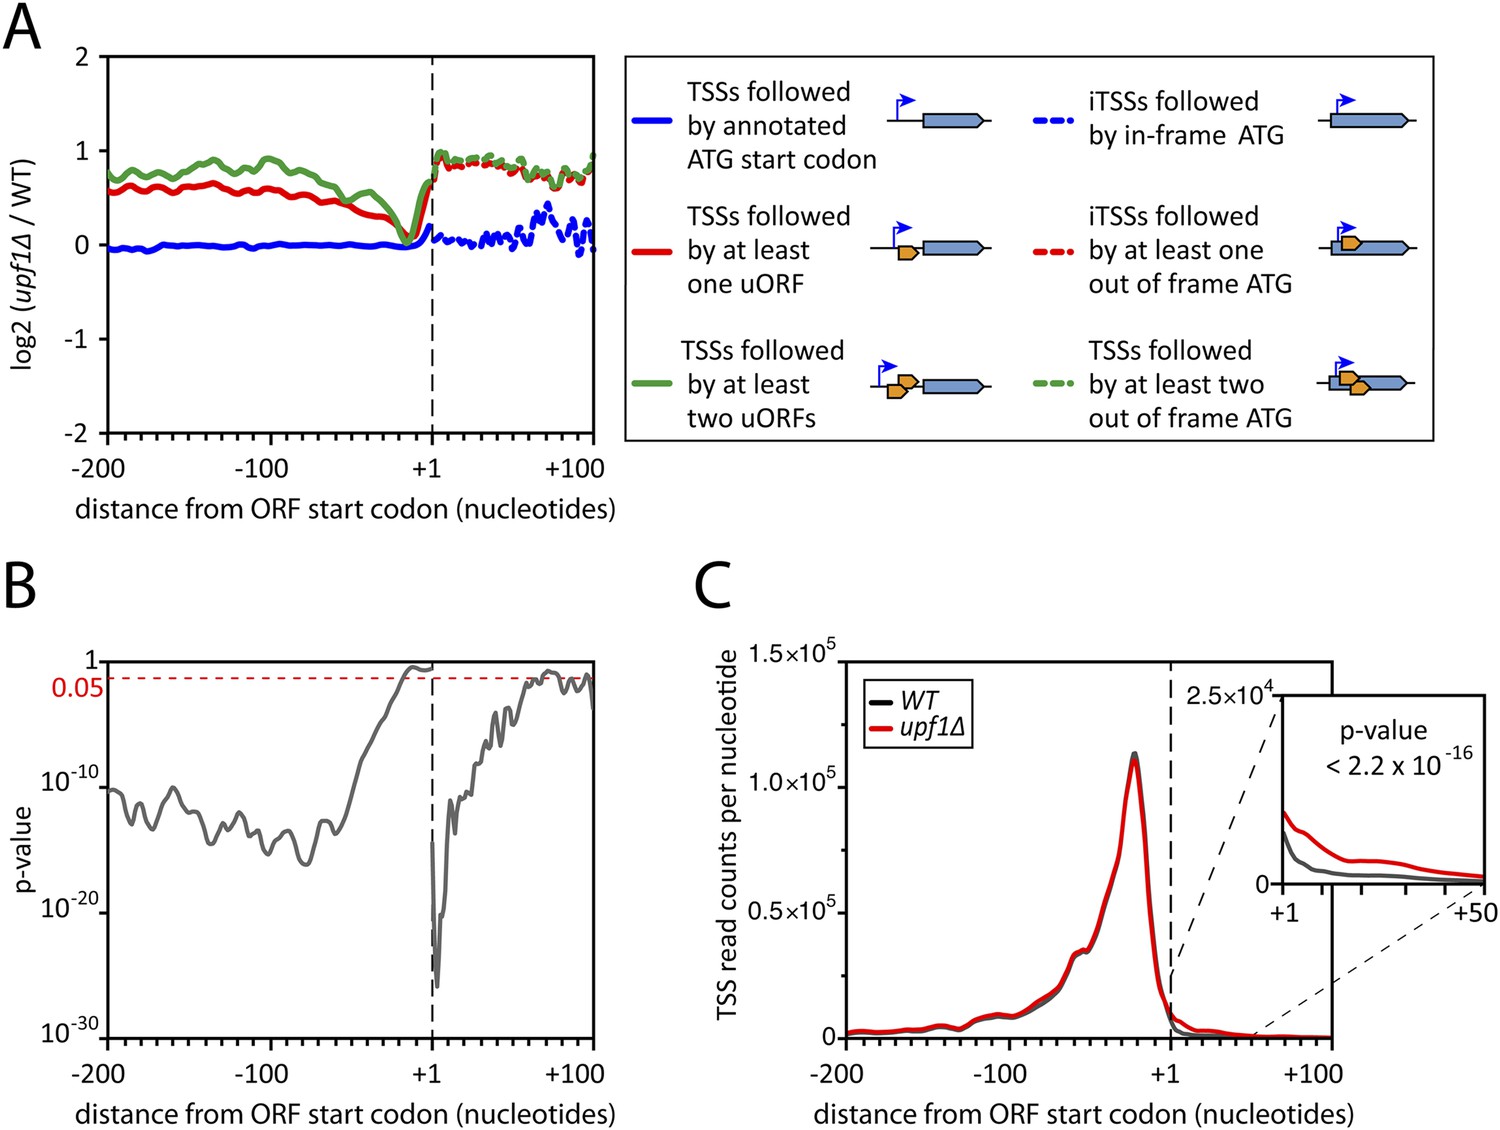
Deletion of UPF1 reveals numerous minor mRNA-associated transcription start sites (TSSs).
(A) Genes were aligned by their start codon and the log2 of ratios of TSS reads for upf1∆ vs wild-type was plotted for TSSs upstream or downstream (iTSSs) the annotated ATG start codons, as depicted in the right panel. The main open reading frames (ORFs) are represented by large blue arrows and upstream ORFs (uORFs) or small internal out-of-frame ORFs by small orange arrows. The thin blue arrows indicate the TSSs. (B) The curve represents the probability at each nucleotide position that the distributions of reads corresponding to the red and blue curves shown in A are the same. The dashed red line marks the 0.05 p-value. (C) Genes were aligned by their annotated start codons (A of the ATG at position +1) and the cumulative TSS read counts per nucleotide (smoothed over 11 nucleotides) was plotted for the wild-type (black) and upf1∆ (red) cells. Inset: Magnification of the +1 to +50 region. The p-value < 2.2 × 10⁻¹⁶ is the probability (ANOVA test) that the distributions of the values, per nucleotide, for the red and black curves are the same within the +1 to +50 nucleotides interval.
Figure 7—figure supplement 1
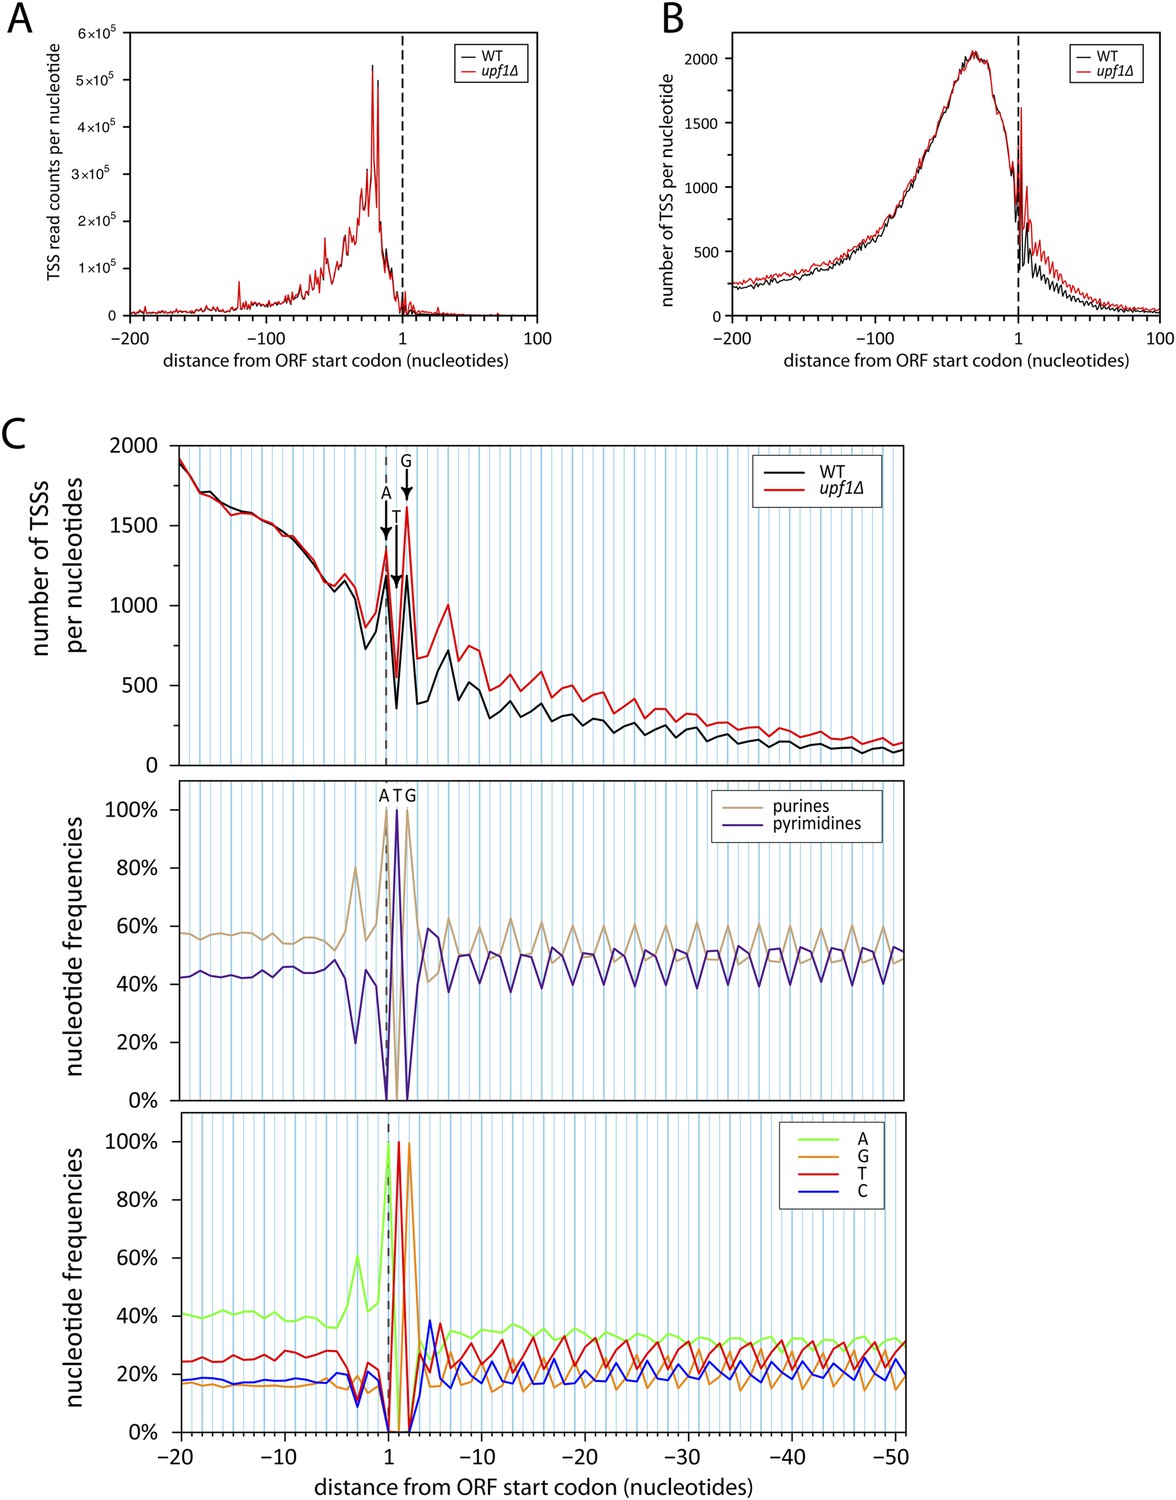
Initiation of iTSS at purines reflects a bias in codon composition.
(A) As for Figure 7C but without smooting. (B) Genes were aligned by their annotated start codons and the total number of transcription start sites (TSSs) per nucleotide was plotted for the wild-type (black) and upf1∆ (red) cells. (C) Zoom of panel (B) for the region −20 to +50 nucleotides around the annotated start codons (upper panel). Note that A and G of the start codon are frequently used for transcription initiation and iTSSs display periodicity of three nucleotides. This periodicity can be explained by the fact that RNA polymerase II transcription initiates preferentially at purines (R) (Zhang and Dietrich, 2005), which are enriched at the first position of codons as previously reported (Mackiewicz et al., 1999) and depicted in the middle and bottom panels.
Figure 7—figure supplement 2
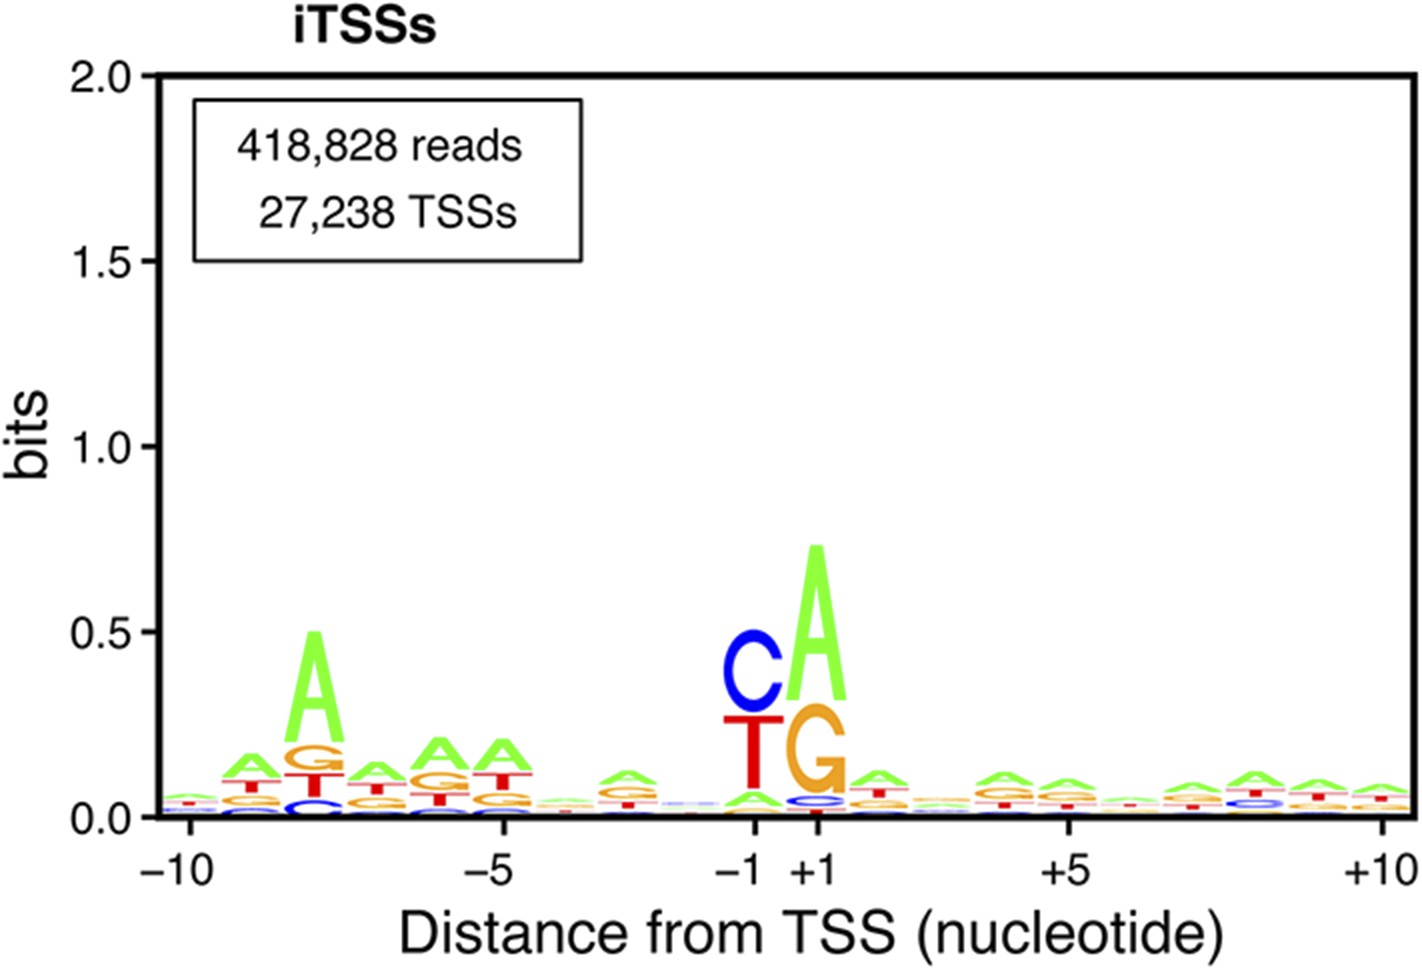
(iTSSs) consensus sequences.
Transcription start sites downstream of annotated ATGs (iConsensus sequences around the iTSSs generated using the Web-LOGO algorithm (Crooks et al., 2004). To avoid a potential bias due to the presence of the ATG start codon in all genes, only iTSSs mapping at least four nucleotides from the start codon were used for this analysis. The numbers of reads and TSSs are indicated.
Figure 8

Distribution of in-frame vs out-of-frame ATG codons and methionines for genes with or without transcription start sites downstream of annotated ATGs (iTSSs).
(A) Cumulative total number of transcription start sites (TSSs) per nucleotide in upf1∆ cells for TSSs directly followed by the annotated ATGs (blue line) or a upstream open reading frame (uORF) (red line) and for TSSs downstream the annotated ATGs (iTSSs) and followed by an out-of-frame ATG (red dashed line) or by an in-frame ATG (blue dashed line). (B) Proportion of in-phase ATGs (+1 frame) following an annotated start codon, binned over nine nucleotides, for protein-coding genes with (red; 3327 genes) or without (blue; 1904 genes) iTSS reads in upf1∆, as defined in the text. The dashed line indicates the expected value for a random distribution. Genes with iTSSs reads are significantly depleted of in-frame ATGs relative to all ATGs in the first 100 nucleotides when compared with genes without iTSSs reads (p-value = 3.13 10−5; ANOVA). (C) Proportion (log2) along the ORFs of in-frame codons, normalized over the regions downstream the first 300 nucleotides of genes, for all codons (binned over nine nucleotides) for the two sets of genes defined in B. The ATG codon is in red. (D) Frequency of methionines per amino acid position along the ORFs for the two sets of genes defined in (B). The p-values (ANOVA method) for the difference in methionine composition over the regions between 0–100 and 100–1000 nucleotides are indicated on the figure.
Tables
Table 1
Libraries generated and analysed in this study
| Library | Genotype | Total reads count | Unique reads count | Unique reads count mapped on S. cerevisiae genome | Unique reads count mapped on S. pombe genome |
|---|---|---|---|---|---|
| TSS-sequencing | |||||
| L5p_01 | WT | 8,650,655 | 5,862,245 | 5,631,307 | – |
| L5p_01 | upf1∆ | 9,624,626 | 7,161,842 | 6,733,121 | – |
| L5p_01 | rrp6∆ | 10,949,693 | 7,640,701 | 7,155,101 | – |
| L5p_01 | upf1∆rrp6∆ | 10,839,311 | 7,681,910 | 7,231,052 | – |
| L5p_02 | WT | 10,139,398 | 4,207,854 | 3,949,042 | – |
| L5p_02 | upf1∆ | 10,607,408 | 4,325,398 | 4,067,154 | – |
| L5p_02 | rrp6∆ | 22,861,396 | 10,269,822 | 9,711,133 | – |
| L5p_02 | upf1∆rrp6∆ | 13,803,020 | 6,526,805 | 6,207,357 | – |
| L5p_03 | WT | 11,525,631 | 4,670,586 | 4,343,264 | – |
| L5p_03 | upf1∆ | 9,832,590 | 3,338,679 | 3,122,942 | – |
| L5p_03 | rrp6∆ | 11,811,879 | 5,228,409 | 4,905,881 | – |
| L5p_03 | upf1∆rrp6∆ | 17,157,244 | 7,897,030 | 7,430,231 | – |
| L5p_04 | WT | 13,282,069 | 10,019,742 | 6,032,695 | – |
| L5p_04 | upf1∆ | 14,162,741 | 10,872,408 | 6,724,910 | – |
| L5p_04 | set2∆ | 14,714,187 | 11,048,398 | 6,591,345 | – |
| L5p_04 | upf1∆set2∆ | 16,958,167 | 12,121,894 | 8,081,113 | – |
| L5p_05 | WT | 11,270,824 | 4,446,988 | 4,172,618 | – |
| L5p_05 | upf1∆ | 12,093,631 | 4,599,307 | 4,323,962 | – |
| L5p_05 | set2∆ | 18,047,134 | 7,132,585 | 6,724,933 | – |
| L5p_05 | upf1∆set2∆ | 12,719,564 | 5,637,310 | 5,333,480 | – |
| L5p_06 | WT | 12,253,253 | 4,800,799 | 4,463,020 | – |
| L5p_06 | upf1∆ | 10,481,413 | 3,402,317 | 3,181,752 | – |
| L5p_06 | set2∆ | 12,179,190 | 4,448,762 | 4,167,876 | – |
| L5p_06 | upf1∆set2∆ | 14,269,228 | 5,584,019 | 5,227,982 | – |
| L5p_07 | upf1∆rrp6∆ + TAP | 8,890,286 | 2,973,612 | 1,621,712 | 1,134,673 |
| L5p_07 | upf1∆rrp6∆ − TAP | 13,836,172 | 3,214,470 | 149,092 | 2,700,018 |
| L5p_08 | upf1∆rrp6∆ + TAP | 9,689,188 | 2,768,418 | 1,341,975 | 1,209,108 |
| L5p_08 | upf1∆rrp6∆ − TAP | 9,765,672 | 2,390,794 | 82,685 | 2,074,096 |
| L5p_09 | upf1∆set2∆ + TAP | 11,885,938 | 3,793,668 | 1,976,161 | 1,555,818 |
| L5p_09 | upf1∆set2∆ − TAP | 11,105,585 | 2,936,749 | 117,202 | 2,552,264 |
| L5p_10 | upf1∆set2∆ + TAP | 11,665,986 | 3,797,708 | 1,343,091 | 2,147,100 |
| L5p_10 | upf1∆set2∆ − TAP | 11,000,429 | 2,476,135 | 59,450 | 2,145,439 |
| RNAseq | |||||
| LT_01 | WT | 8,104,047 | 7,257,423 | 6,634,522 | 1,761,046 |
| LT_01 | upf1∆ | 11,137,269 | 10,129,315 | 9,257,158 | 2,440,195 |
| LT_01 | xrn1∆ | 11,619,211 | 10,631,126 | 9,737,924 | 2,310,274 |
| LT_01 | upf1∆xrn1∆ | 7,947,627 | 7,299,151 | 6,645,353 | 1,678,281 |
| LT_02 | WT | 34,611,003 | 27,825,118 | 22,658,503 | 3,635,624 |
| LT_02 | upf1∆ | 29,379,233 | 24,421,717 | 19,815,913 | 2,966,963 |
| LT_02 | xrn1∆ | 26,816,267 | 22,686,420 | 18,245,251 | 2,493,471 |
| LT_02 | upf1∆xrn1∆ | 25,466,016 | 21,800,532 | 16,996,728 | 2,436,568 |
Table 2
Yeast strains used in this study
| Strain | Genotype | Reference |
|---|---|---|
| BY4741 | Mat a, his3∆1, ura3∆0, leu2∆0, met15∆0 | (Brachmann et al., 1998) |
| LMA1057/3401 | BY4741 can1∆ | This study |
| LMA1774/2759 | BY4741 can1∆, upf1∆::HIS3MX6 | This study |
| LMA1676/3405 | BY4741 can1∆, rrp6∆::hphMX6 | This study |
| LMA1772 | BY4741 can1∆, upf1∆::KANMX6, rrp6∆::HPHMX6 | This study |
| LMA1790 | BY4741 can1∆, upf1∆::KANMX6 | This study |
| LMA2758 | BY4741 can1∆ | This study |
| LMA2760 | BY4741 can1∆, xrn1∆::KANMX6 | This study |
| LMA2762 | BY4741 can1∆, xrn1∆::KANMX6, upf1∆::HIS3MX6 | This study |
| LMA2921/3403 | BY4741 can1∆, set2∆::KANMX6 | This study |
| LMA2922 | BY4741 can1∆, set2∆::KANMX6, upf1∆::HIS3MX6 | This study |
| LMA3409 | BY4741 can1∆, upf1∆::HIS3MX6, rrp6∆::HPHMX6 | This study |
Table 3
Oligonucleotides used in this study
| Name | Sequence 5′-3′ | |
|---|---|---|
| ACT1-1407− | ACACTTGTGGTGAACGATAGATGG | P32 labelled probe |
| YMR114c-839+ | ATCGAGGTGTAAAGGGTG | Synthesis of probe |
| T7-YMR114C-1068−* | TAATACGACTCACTATAGGGCCTCTGGAGTCTTTCTGG | Synthesis of probe |
| YIL136w-1013+ | ACTGGTGGTCTGGATGG | Synthesis of probe |
| T7-YIL136w(+)115−* | TAATACGACTCACTATAGGGTGCCACTAATTTACTCCG | Synthesis of probe |
| NEL025c-35+ | AACAAATGCCAAGTCGGGAC | Synthesis of probe |
| T7-NEL025c-263−* | TAATACGACTCACTATAGGGAAACGTTTGGTAAGAACTC | Synthesis of probe |
| SUT093_fwd | GAGTCCAGCGTCTCTACAC | Synthesis of probe |
| T7-SUT093_rev* | TAATACGACTCACTATAGGGGACTTAATTGTCGTTGCTAGGAC | Synthesis of probe |
| SUT338_fwd | GAAAGACCGAAGGTGAAGAG | Synthesis of probe |
| T7-SUT338_rev* | TAATACGACTCACTATAGGGGTGGTACAGCCCTGTGTTCC | Synthesis of probe |
| SUT779_fwd | AACGAGGGAACTAGCCAG | Synthesis of probe |
| T7-SUT779_rev* | TAATACGACTCACTATAGGGCTCTTCATCATCTGTGGAG | Synthesis of probe |
| TPO2(+)131− | GTATGTAGAAATGTCCGACG | Synthesis of probe |
| T7-TPO2-1798+* | TAATACGACTCACTATAGGGGTAAGGGCTTGAGAC | Synthesis of probe |
| MAL12/32-1723− | GATTCTACCTTCCCATGG | Synthesis of probe |
| T7-MAL12/32-1161+* | TAATACGACTCACTATAGGGTCAAGGTCAGGAGATAGG | Synthesis of probe |
| XUT3F5-fwd | AGGAAAATGGGACTACAG | Synthesis of probe |
| T7-XUT3F5-rev* | TAATACGACTCACTATAGGGTGTAAAAGGGCACAGTC | Synthesis of probe |
| 3041† | 5BioTEG/CTTTCCCTACACGACGCTCTTCCGATCTNNNNCGCGrCrGrNrN | Ligation with TAP treated RNA |
| 3118† | 5BioTEG/CTTTCCCTACACGACGCTCTTCCGATCTNNNNGCCGrCrGrNrN | Ligation with fragmented RNA |
| 3038† | GTTCAGACGTGTGCTCTTCCGATCTNNNNNN | Reverse transcription |
-
*
The sequence in bold face corresponds to the T7 promoter sequence.
-
†
The sequence in bold face corresponds to the tag used to identify the 5′ end of the cDNAs. r stands for ribonucleotide.
Additional files
-
Supplementary file 1
TSS clusters identified in WT, upf1∆, rrp6∆ and upf1∆rrp6∆ cells.
- https://doi.org/10.7554/eLife.06722.024
-
Supplementary file 2
Reads count for whole transcriptome analysis in wild type, xrn1∆, upf1∆ and upf1∆xrn1∆ cells.
- https://doi.org/10.7554/eLife.06722.025
-
Supplementary file 3
TSS clusters identified in WT, upf1∆, set2∆ and set2∆upf1∆ cells.
- https://doi.org/10.7554/eLife.06722.026
-
Supplementary file 4
List of genes with identified iTSSs and/or uORFs.
- https://doi.org/10.7554/eLife.06722.027
Download links
A two-part list of links to download the article, or parts of the article, in various formats.
Downloads (link to download the article as PDF)
Open citations (links to open the citations from this article in various online reference manager services)
Cite this article (links to download the citations from this article in formats compatible with various reference manager tools)
Quality control of transcription start site selection by nonsense-mediated-mRNA decay
eLife 4:e06722.
https://doi.org/10.7554/eLife.06722


