NKX2-5 mutations causative for congenital heart disease retain functionality and are directed to hundreds of targets
- Victor Chang Cardiac Research Institute, Australia
- University of New South Wales, Australia
- Children's Medical Research Institute, Australia
- Monash University, Australia
- Université Libre de Bruxelles, Belgium
- Erasme Hospital, Belgium
- Academic Center for Education, Culture and Research, Iran
- University of Oxford, United Kingdom
- Olivia Newton-John Cancer Research Institute, Australia
- Deakin University, Australia
Figures
Figure 1 with 9 supplements
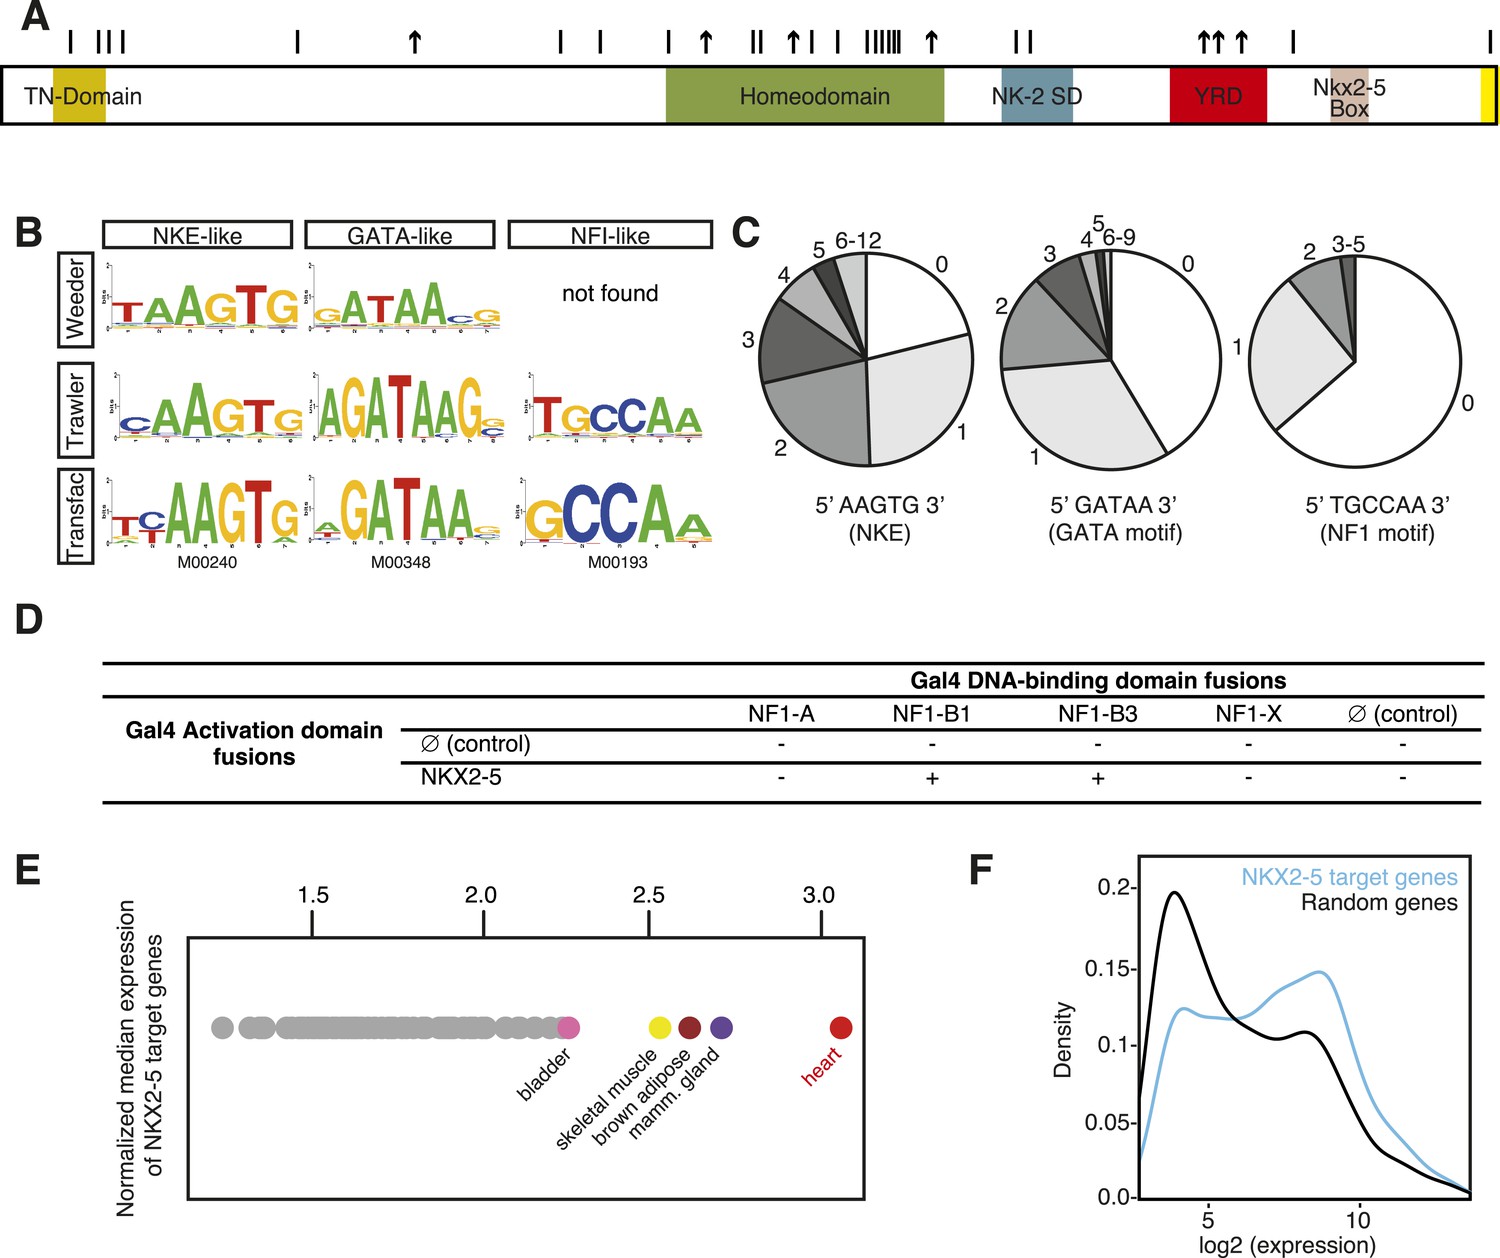
DNA adenine methyltransferase identification (DamID) identifies a robust set of NKX2-5 targets in HL-1 cardiomyocytes.
(A) Structure of the human NKX2-5 protein (TN, tinman domain; NK2SD, NK-2 specific domain; YRD, tyrosine-rich domain). Bars and arrows indicate missense and termination mutations associated with congenital heart disease (CHD), respectively. (B) Top over-represented motifs discovered de novo in NKX2-5 peaks using Trawler or Weeder. NKX2-5, GATA, and Nuclear Factor 1 (NF1) binding motifs deposited in TRANSFAC are shown. (C) Distribution of NKX2-5, GATA, and NF1 binding sequences in NKX2-5 peaks. (D) Yeast-two-hybrid assay. NKX2-5 and NF1 proteins were fused to Gal4-activation and DNA-binding domains, respectively. Positive signs (+) show interaction as growth on selective medium from three independent experiments. (E) Normalized median expression of NKX2-5-target genes in 91 murine cell types (data collected from BioGPS). Tissues with the highest median expressions are shown in colour, including heart (red). (F) Expression of NKX2-5 target genes and random genes in HL-1 cells. Data collected from (Mace et al., 2009).
Figure 1—figure supplement 1
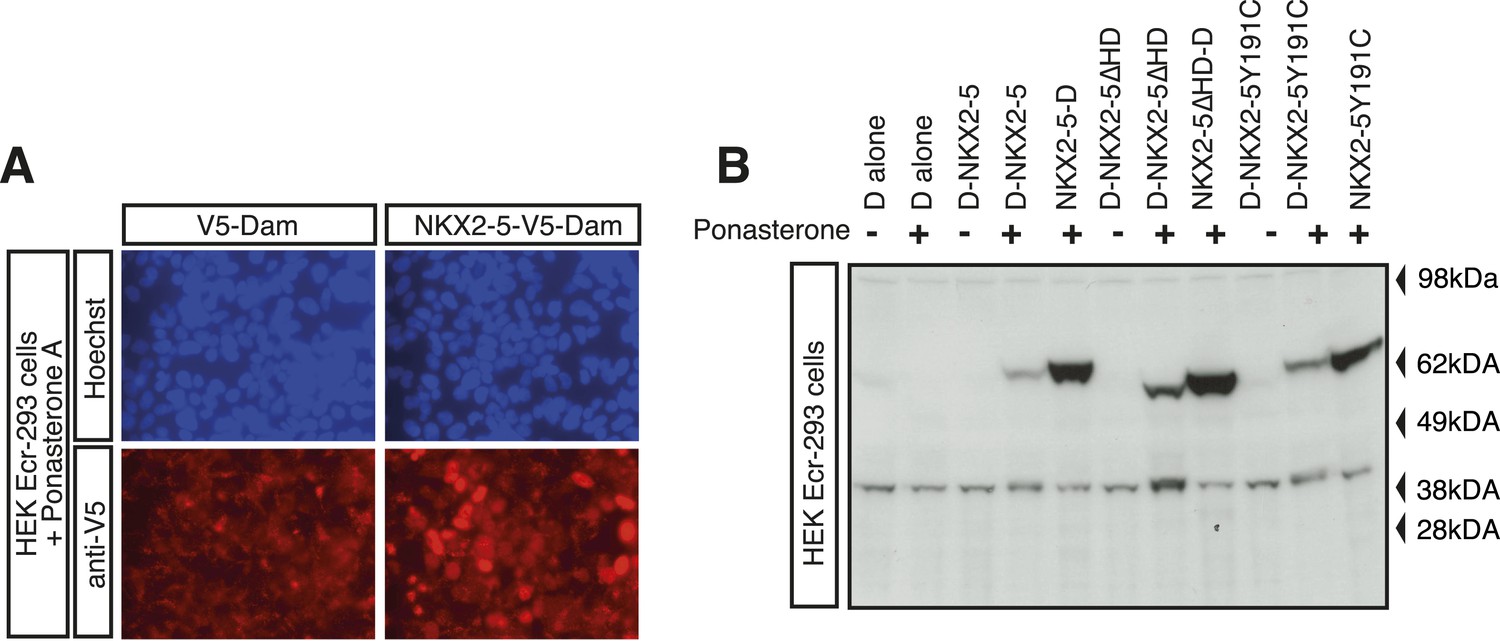
DamID validation in HL-1 cardiomyocytes.
(A) Expression of V5-tagged DNA adenine methyltransferase (Dam) and NKX2-5-Dam in HEK Ecr-293 cells in presence of 10 mM Ponasterone A detected by immunofluorescence microscopy using anti-V5 antibodies. (B) Expression of Dam alone (‘D’) and Dam/NKX2-5 fusion proteins (WT, ∆HD, and Y191C) in HEK Ecr-293 cells in absence (−) or presence (+) of 5 mM Ponasterone A detected by western blotting using anti-NKX2-5 antibodies.
Figure 1—figure supplement 2
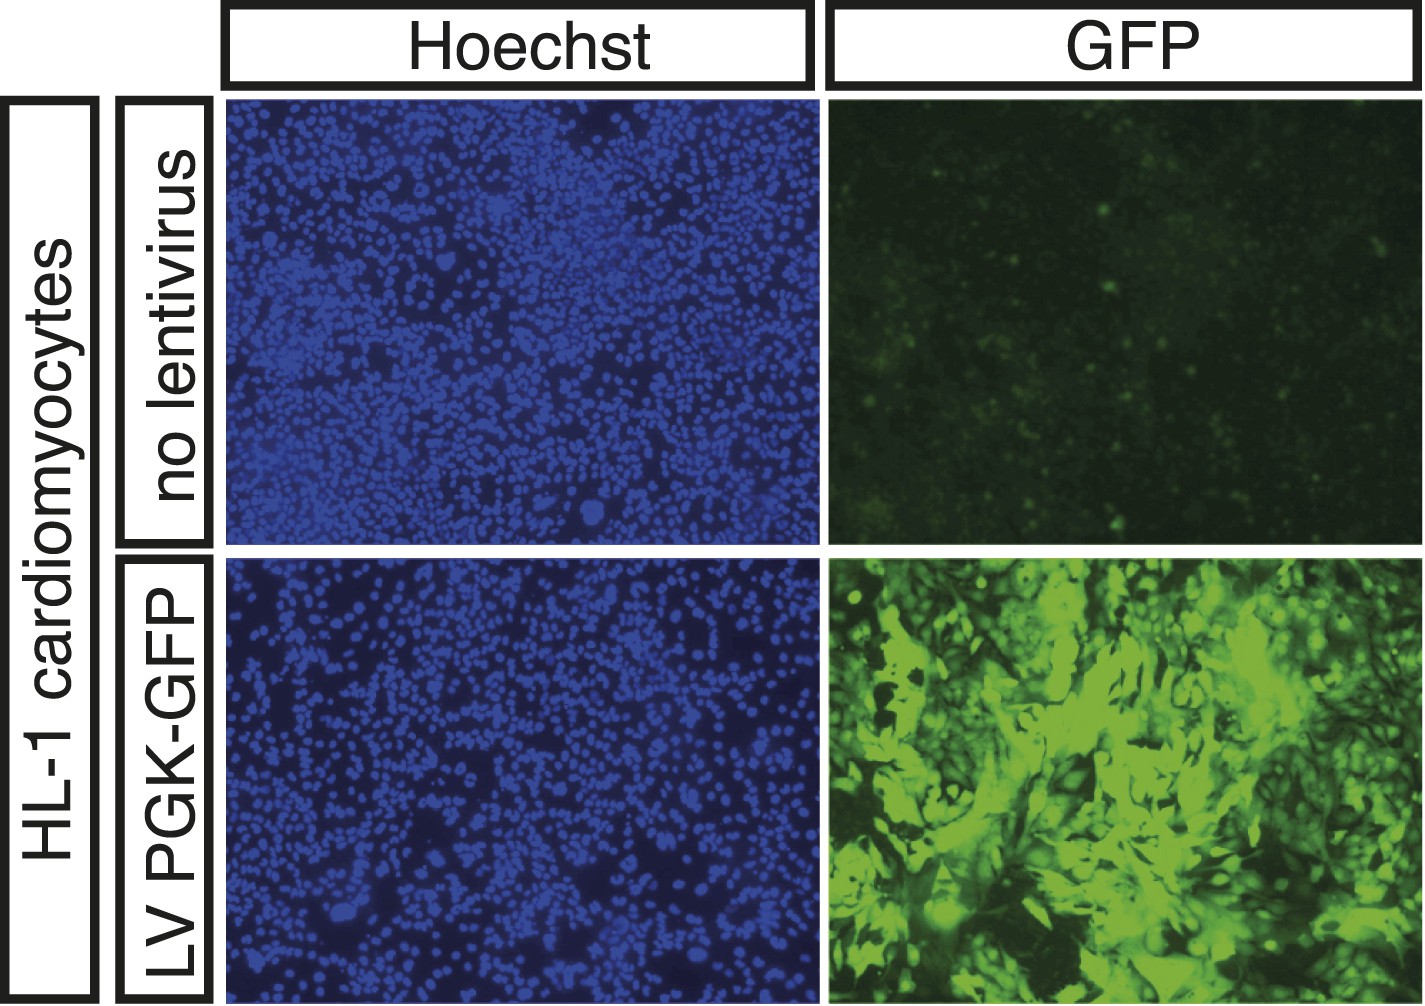
Expression of PGK-GFP control 24 hr post-transduction of HL-1 cells transduced with lentivirus (LV).
https://doi.org/10.7554/eLife.06942.005
Figure 1—figure supplement 3
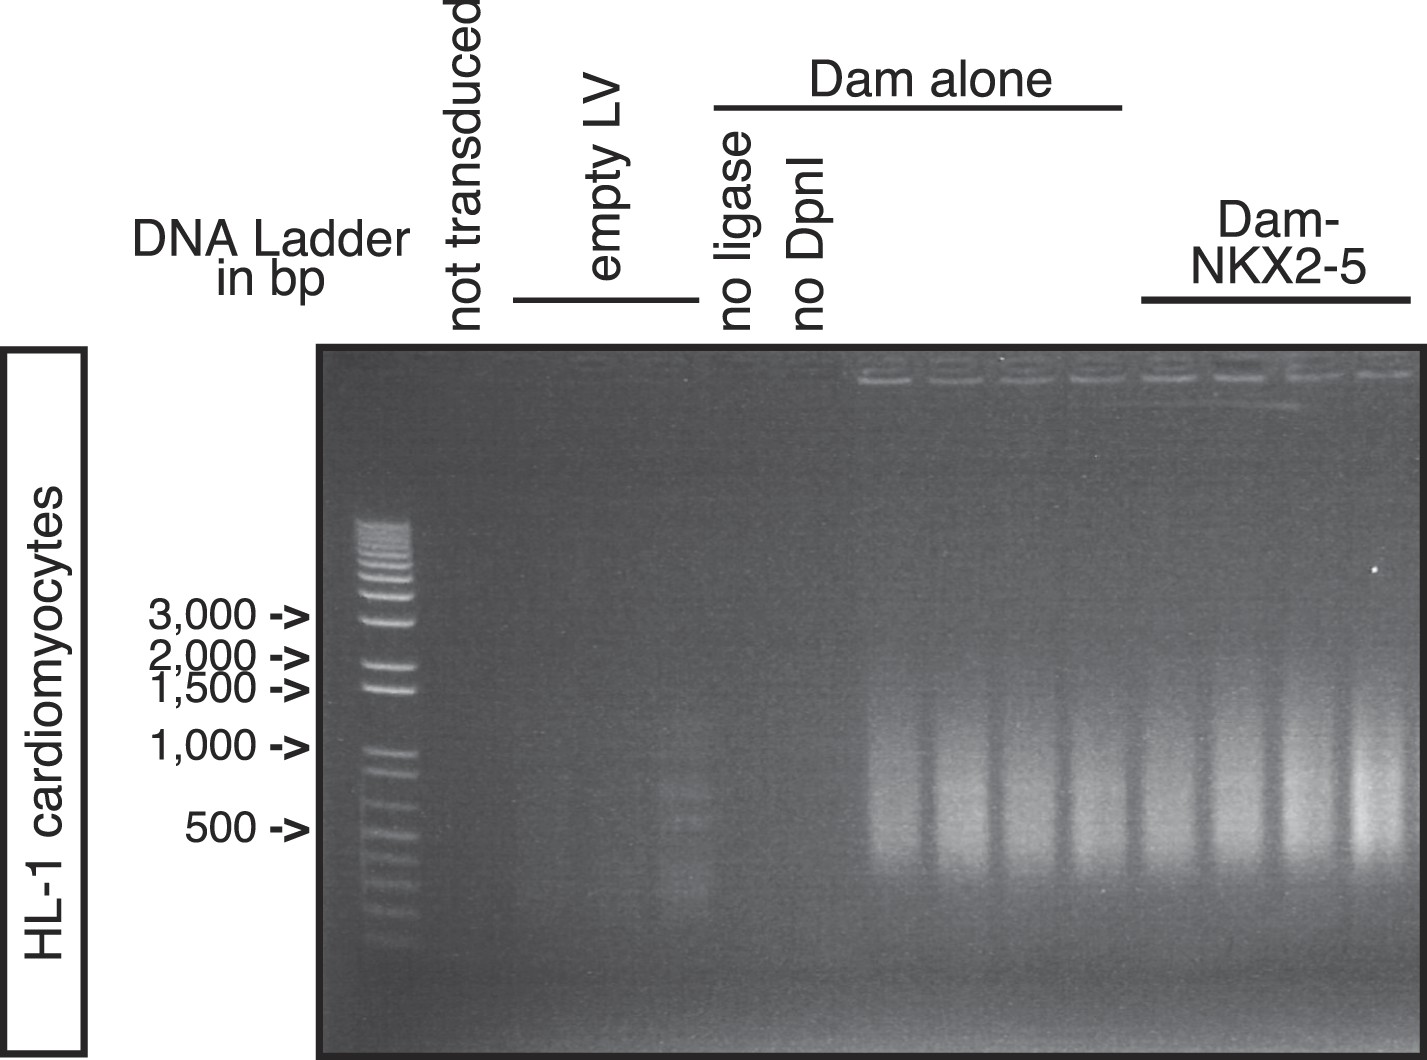
PCR-amplified methylated fragments of HL-1 genomic DNA 40 hr post-transduction with Dam alone and Dam-NKX2-5.
Controls are ‘not transduced’ cells, or cells transduced with empty lentivirus (‘LV’), or with Dam alone and amplified with ‘no ligase’ or ‘no DpnI’.
Figure 1—figure supplement 4
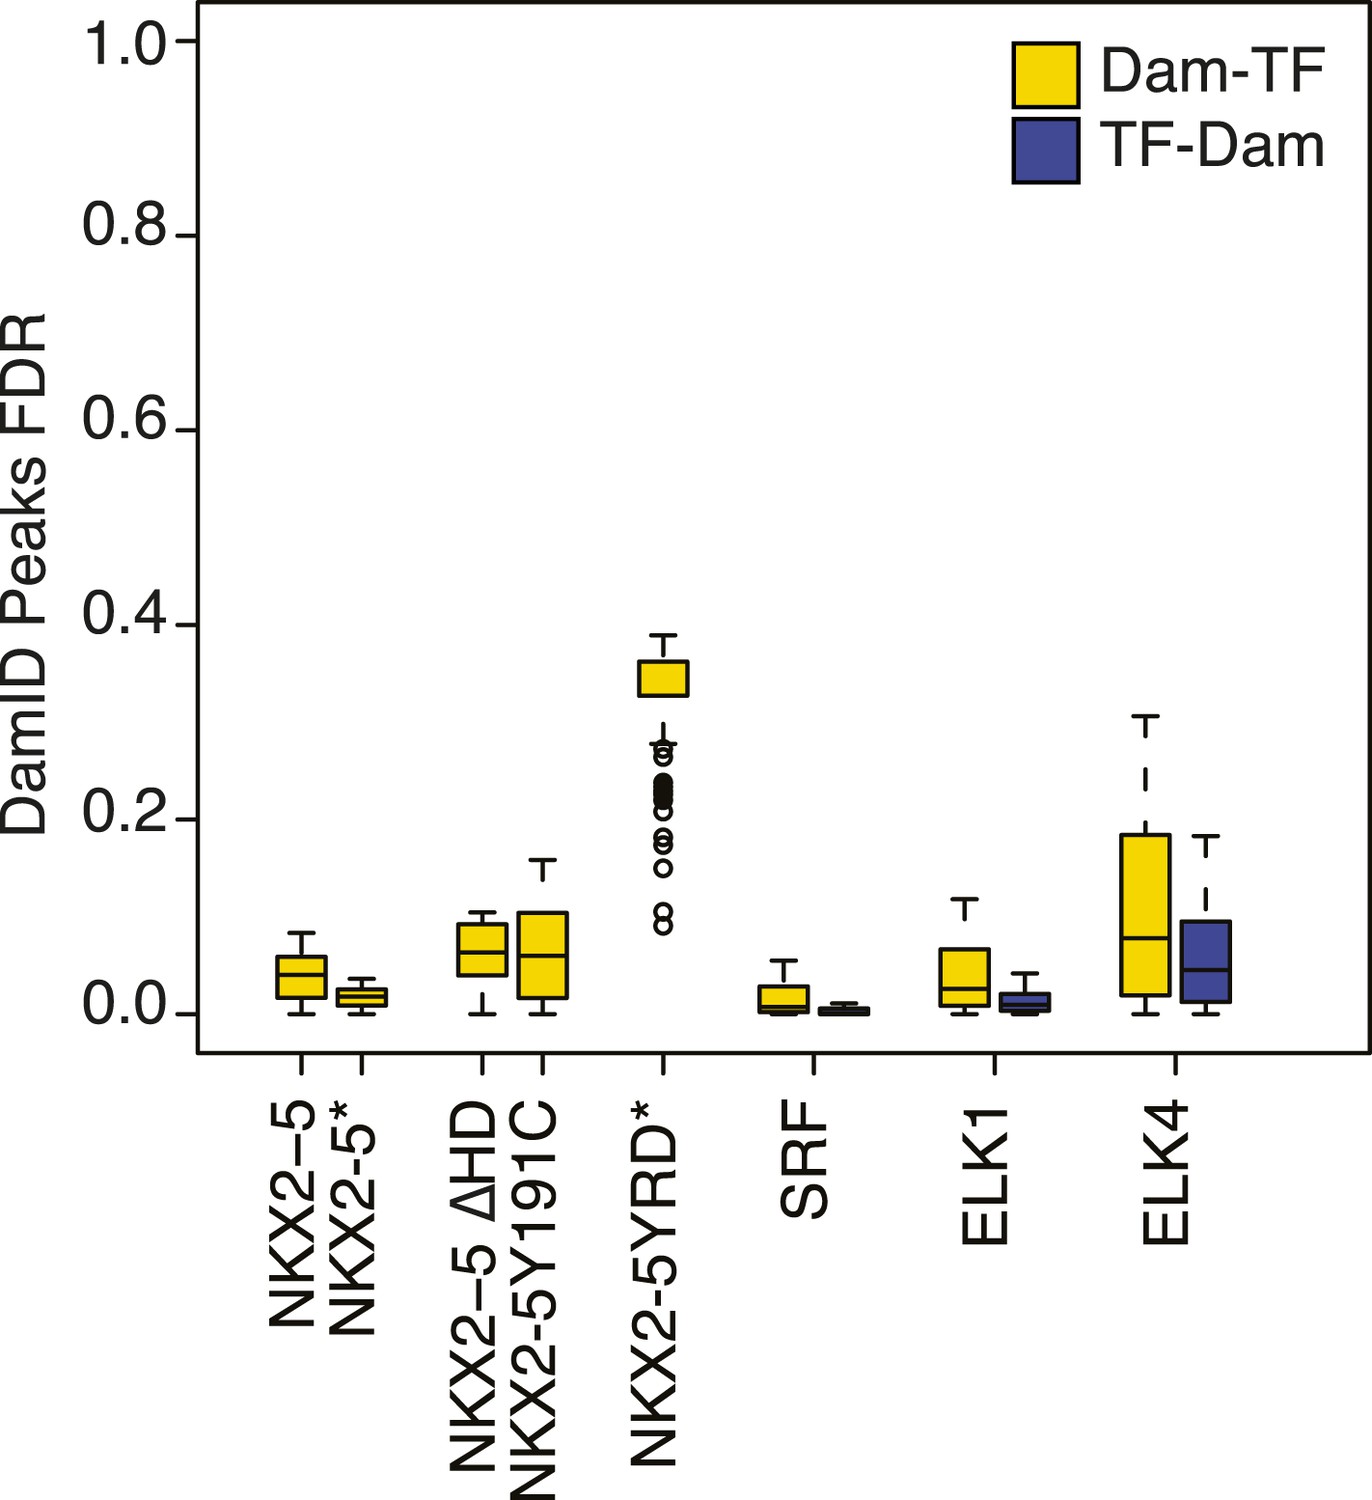
False discovery rate of Dam/TF fusion protein binding peaks as determined using CisGenome/TileMapv2 with moving average ≥ 3.5.
https://doi.org/10.7554/eLife.06942.007
Figure 1—figure supplement 5

Chromatin immunoprecipitation (ChIP)-PCR validation of NKX2-5 WT target peakes determined by DamID.
https://doi.org/10.7554/eLife.06942.008
Figure 1—figure supplement 6
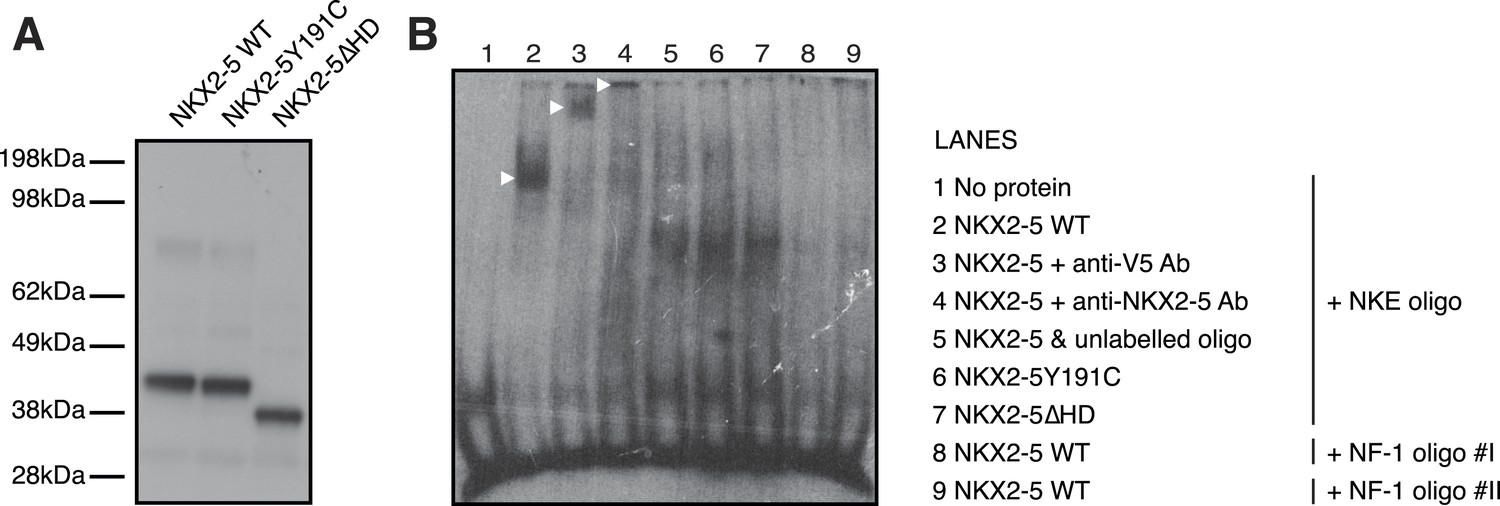
NKX2-5 binds the NKE but not the NF1-like motif.
(A) Cell-free expression of NKX2-5 WT, NKX2-5Y191C, and NKX2-5∆HD proteins revealed by western-blotting using anti-V5 antibodies. (B) Electrophoretic mobility shift assay using NKX2-5 and DIG-labelled NKE (lanes 1–7) and NF-1 oligos (lanes 8–9). Controls include no protein (lane 1), supershifts after addition of anti-V5 (lane 3) or anti-NKX2-5 (lane 4) antibodies and competition with unlabelled oligos (lane 5). See ‘Material and methods’ for details.
Figure 1—figure supplement 7
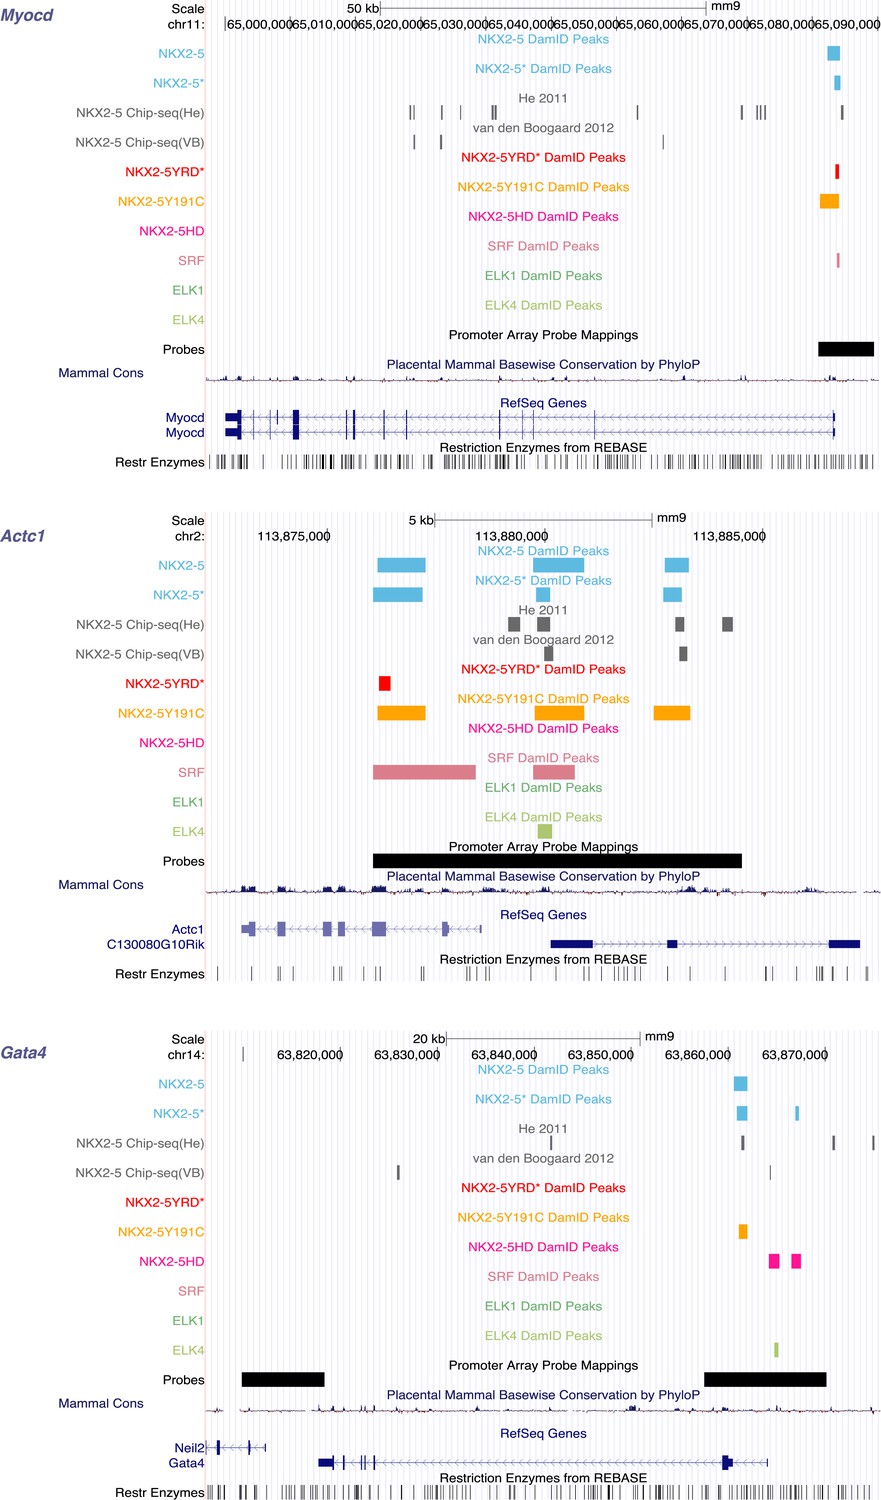
Identification of NKX2-5, SRF, and ELK1/4 target genes in HL-1 cells.
UCSC Genome Browser screen shots showing DamID TF association in HL-1 cells with known NKX2-5 target genes (Myocd [Ueyama et al., 2003], Actc1 [Chen and Schwartz, 1997], and Gata4 [Riazi et al., 2009]).
Figure 1—figure supplement 8

Nuclear localisation of NKX2-5 and histone modifications in HL-1 cardiomyocyte nuclei.
Scale bars represent 10 mm.
Figure 1—figure supplement 9
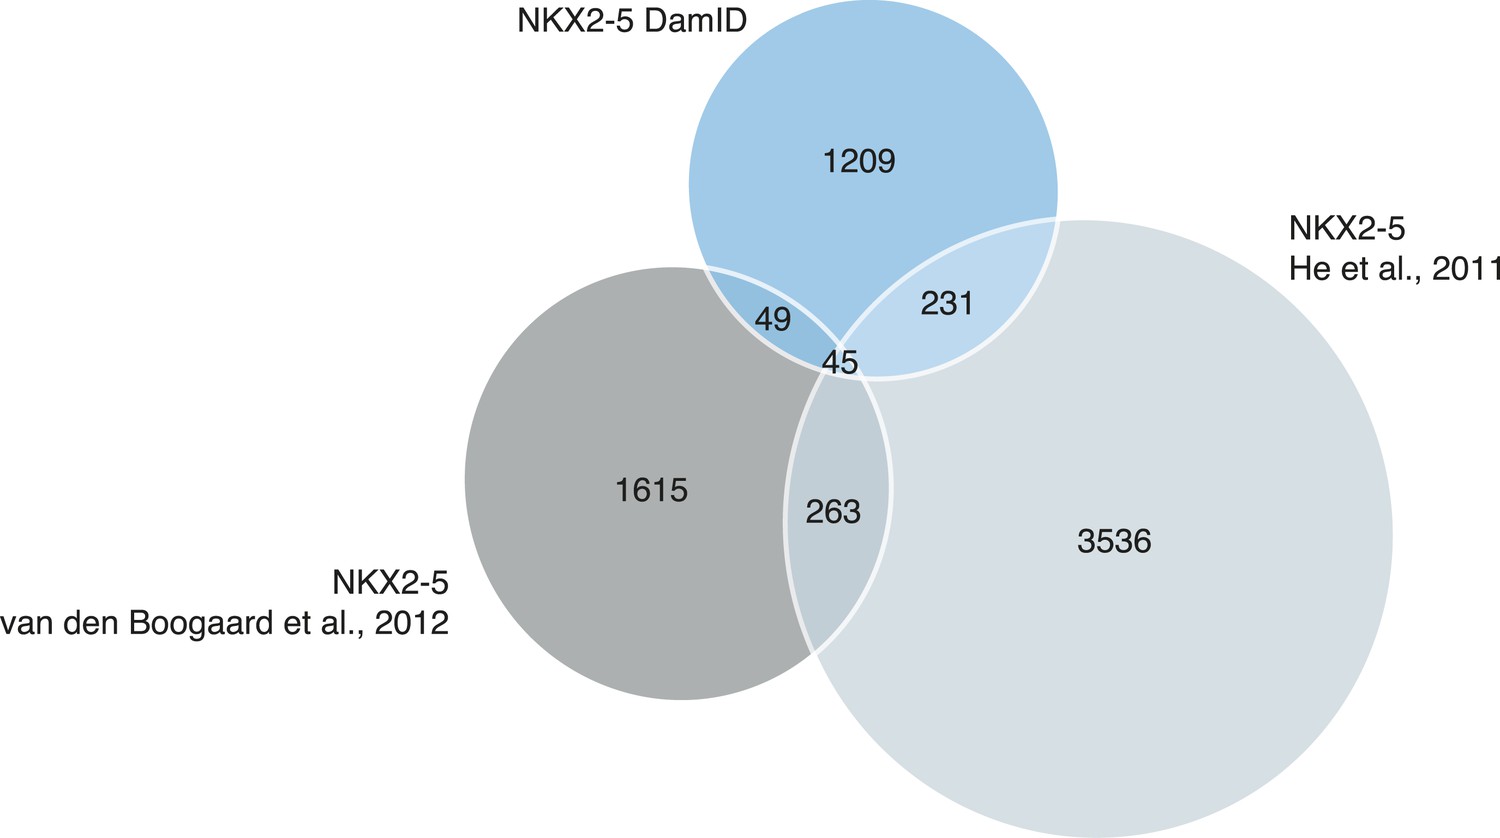
Proportional Venn diagram showing the overlapping binding peaks between NKX2-5 determined by DamID (this study) or ChIP-seq (He et al., 2011 ) and (van den Boogaard et al., 2012).
Only peaks that fall in the regions covered by the Affymetrix mouse promoter microarrays are represented.
Figure 2 with 3 supplements
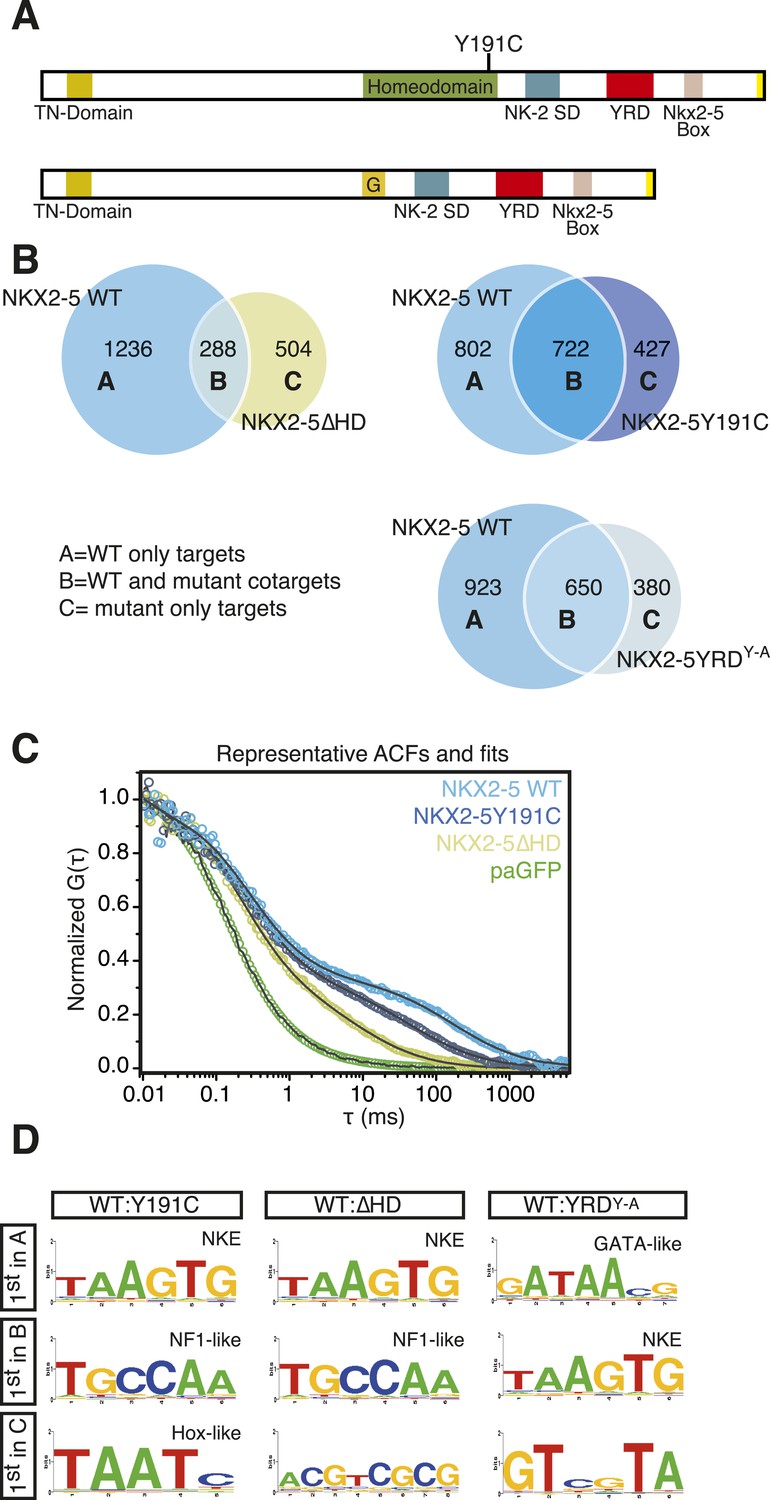
NKX2-5 mutants bind to hundreds of targets in HL-1 cells.
(A) Structure of NKX2-5Y191C and NKX2-5∆HD mutant proteins (‘G’ indicates a Glycine linker). (B) Overlapping binding peaks between NKX2-5 WT and mutants. Proportional Venn diagrams show peaks unique to WT NKX2-5 (A sets); common to WT and mutant proteins (B sets); unique to mutant proteins (C sets). (C) Representative autocorrelation function (ACF) curves and fits for NKX2-5 WT and mutant proteins measured by photoactivatable fluorescence correlation spectroscopy (paFCS) in HL-1 cells. (D) Top over-represented motifs discovered de novo using Weeder in A-, B- and C-target sets of NKX2-5 WT and mutant comparisons.
Figure 2—figure supplement 1
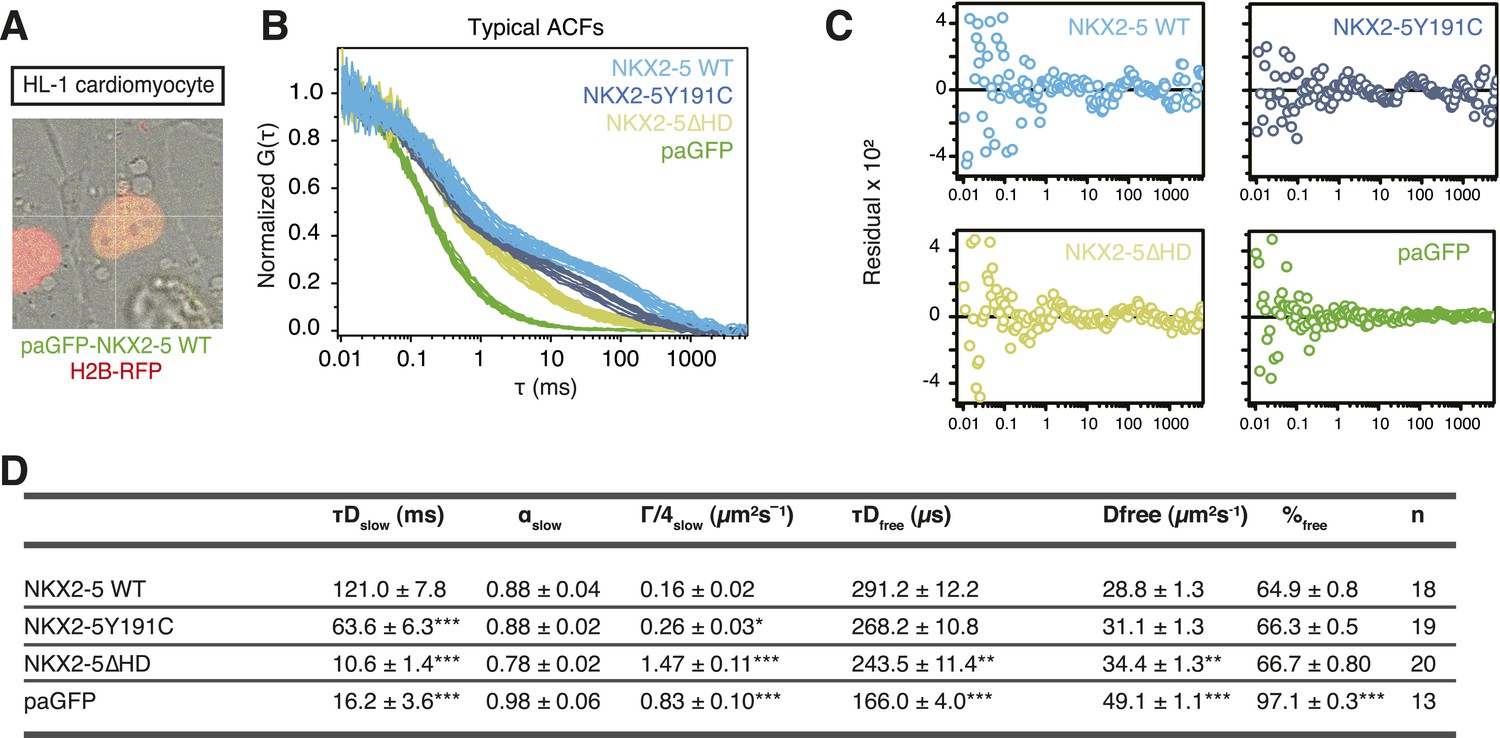
(A) Image showing paGFP-NKX2-5 and histone 2B-RFP fluorescence in a single HL-1 nucleus with fluorescence correlation spectroscopy (FCS) measurement performed at the crosshair point.
(B) Typical ACF curves for each NKX2-5 WT and mutant proteins measured by paFCS in HL-1 cells. (C) Individual fit residuals for data shown in Figure 2C. (D) Summary of diffusion parameters for photoactivatable GFP (paGFP)-fusion proteins in HL-1 cells. Data are mean ± standard error of n measurements. τDslow, dwell time of the slow-diffusing component; αslow, anomalous parameter of the slow-diffusing component; Γ/4slow, transport coefficient for anomalous diffusion (G = 4D for non-anomalous diffusion) of the slow-diffusing component; τDfree, dwell time of the free-diffusing component; Dfree, diffusion coefficient of the free-diffusing component; %free, percentage of the free-diffusing component. Statistical significance indicated as ***, p < 0.0001; **, p < 0.001; *, p < 0.01 by Student's t-test for differences compared with NKX2-5 WT.
Figure 2—figure supplement 2
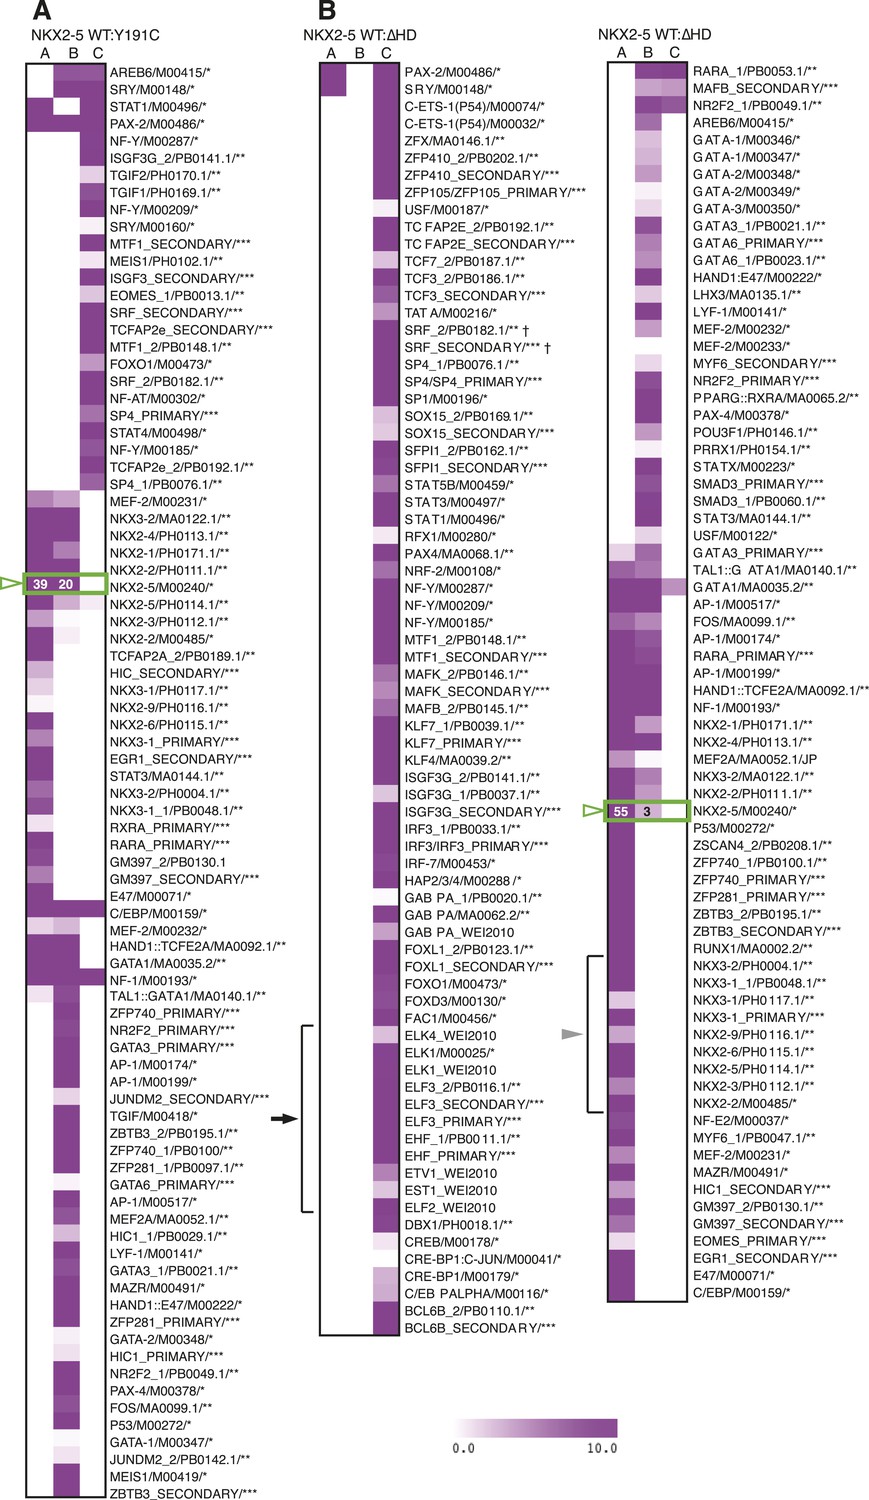
Enrichment of known motifs in NKX2-5 peak subsets.
Heat maps showing motifs significantly enriched in subsets of the NKX2-5 WT/Y191C (A) or NKX2-5 WT/∆HD (B) comparisons. TF-binding sites from the TRANSFAC (*), JASPAR (**) and UniPROBE (Badis et al., 2009) (***) databases with a positive raw Clover score in ≥1 set are shown. The NKE is highlighted in a green box and ETS-like motifs are highlighted with black arrow. SRF† shows the secondary SRF motif, not the CArG box.
Figure 2—figure supplement 3
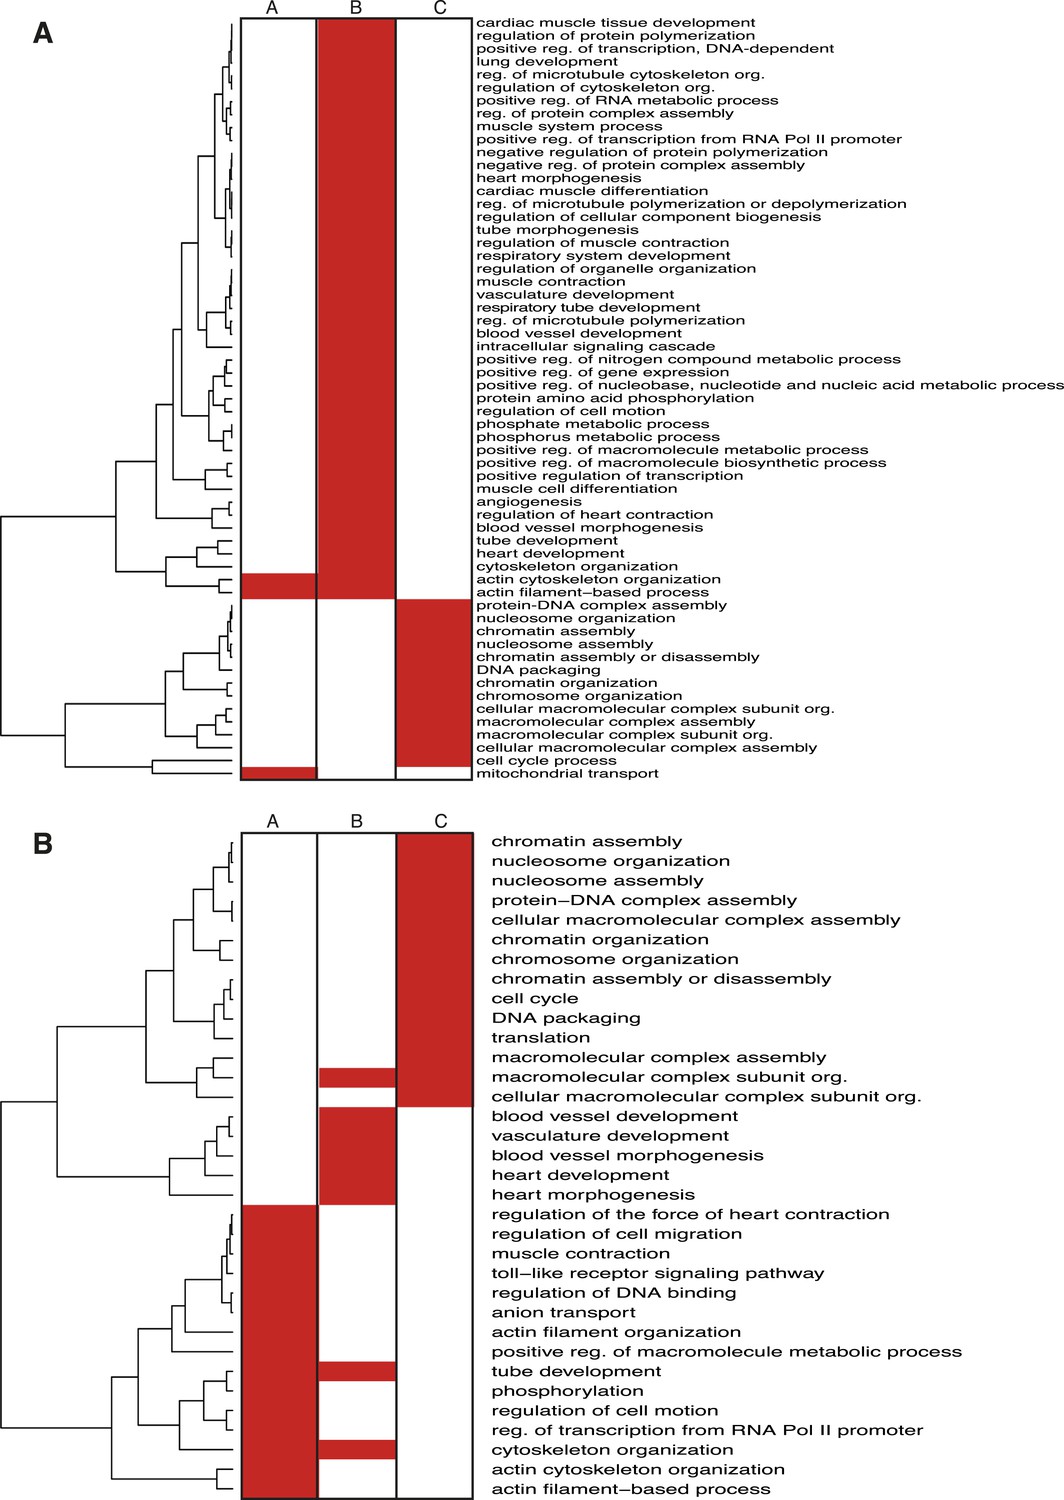
Enrichment of GO terms in NKX2-5 target subsets.
Heat maps showing GO terms enriched in target gene subsets of the NKX2-5 WT/Y191C (A) or NKX2-5 WT/∆HD (B) comparisons.
Figure 3 with 2 supplements
NKX2-5 mutant proteins retained partial functionality.
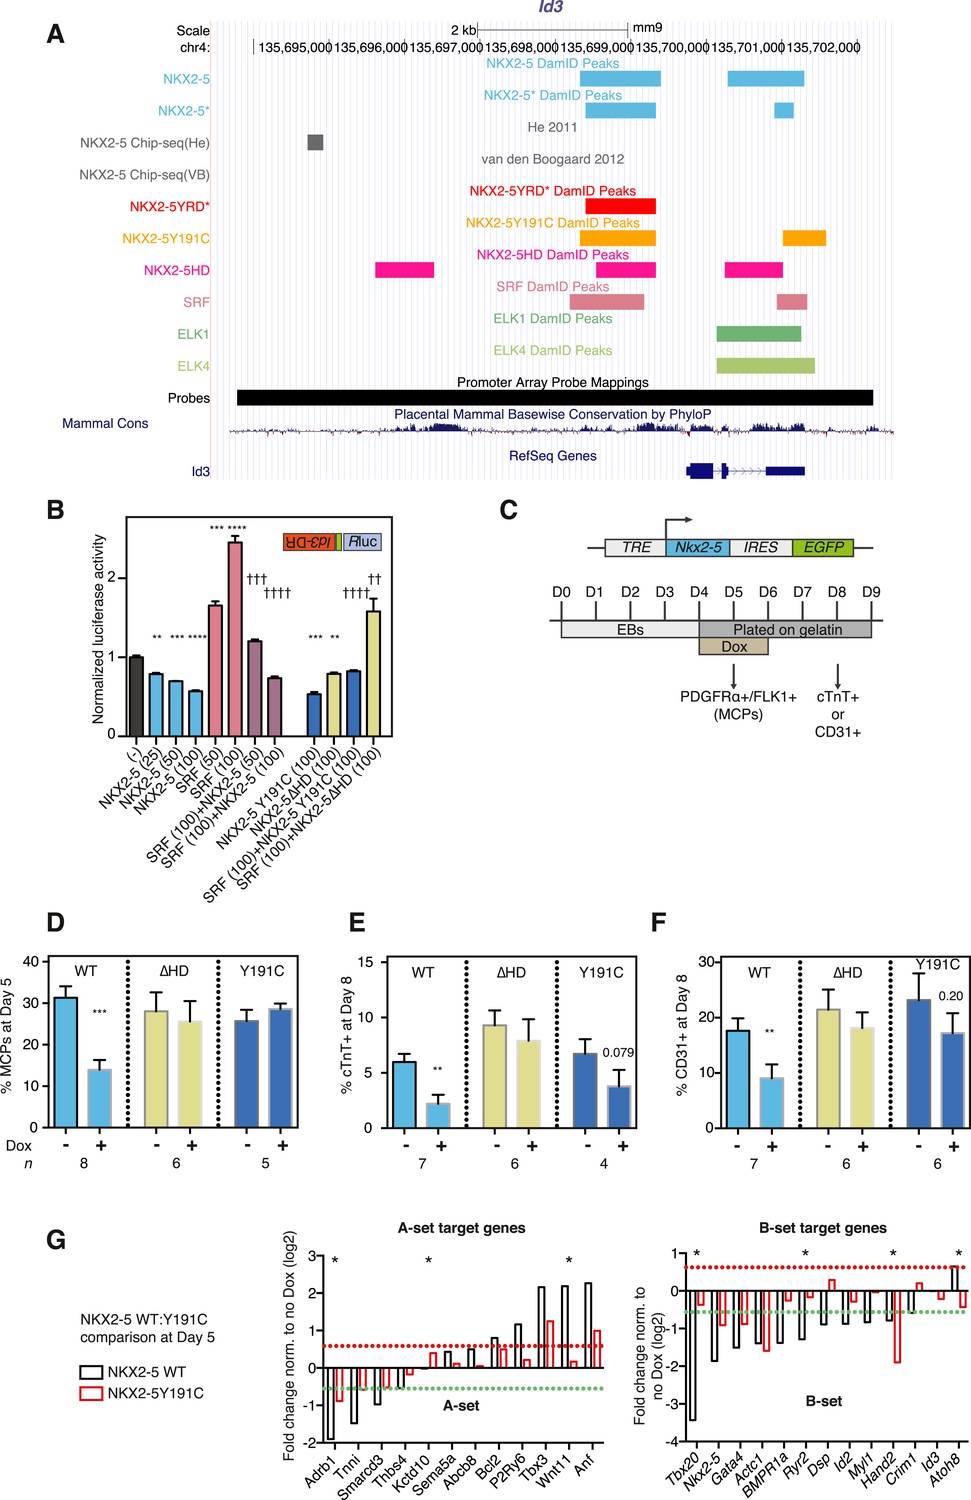
(A) UCSC Genome Browser screen shot showing DamID transcription factor (TF) association in HL-1 cells with Inhibitor of DNA binding 3 (Id3). (B) Normalised Rluc activity in HEK 293 cells transfected with NKX2-5 and serum response factor (SRF). Id3 DR was in the antisense orientation. p-values were calculated relative to controls (** p < 0.01; *** p < 0.001; **** p < 0.0001; ns = not significant) or SRF alone (†† p < 0.01; ††† p < 0.001; †††† p < 0.0001). The quantity of vector is given in ng. (C) Schematic representation of ‘Materials and methods’ for the generation of embryonic stem (ES) cell lines for inducible expression of NKX2-5 WT and mutants. Cardiac differentiation was initiated in embryoid bodies (EBs), followed by induction of cardiogenesis differentiation (from day 4) on plates. (D) FACS quantification of PDGFRa/FLK1+ multipotent cardiovascular progenitors (MCPs) in NKX2-5 dox-inducible ES cell lines (at day 5). The mean of 6–7 independent experiments is shown. (E, F) FACS quantification of cTNT + cardiomyocytes (D) and CD31+ endothelial cells (E) at day 8. (G) RT-PCR quantification of A- and B-set target genes in NKX2-5 WT or Y191C dox-inducible ES cell lines at day 5 in three independent experiments (24 hr post-induction). Results were normalised to expression in uninduced cells. p-values were calculated using a t-test (* p < 0.05).
Figure 3—figure supplement 1
WT and mutant NKX2-5 targets identified by DamID in HL-1 cells.
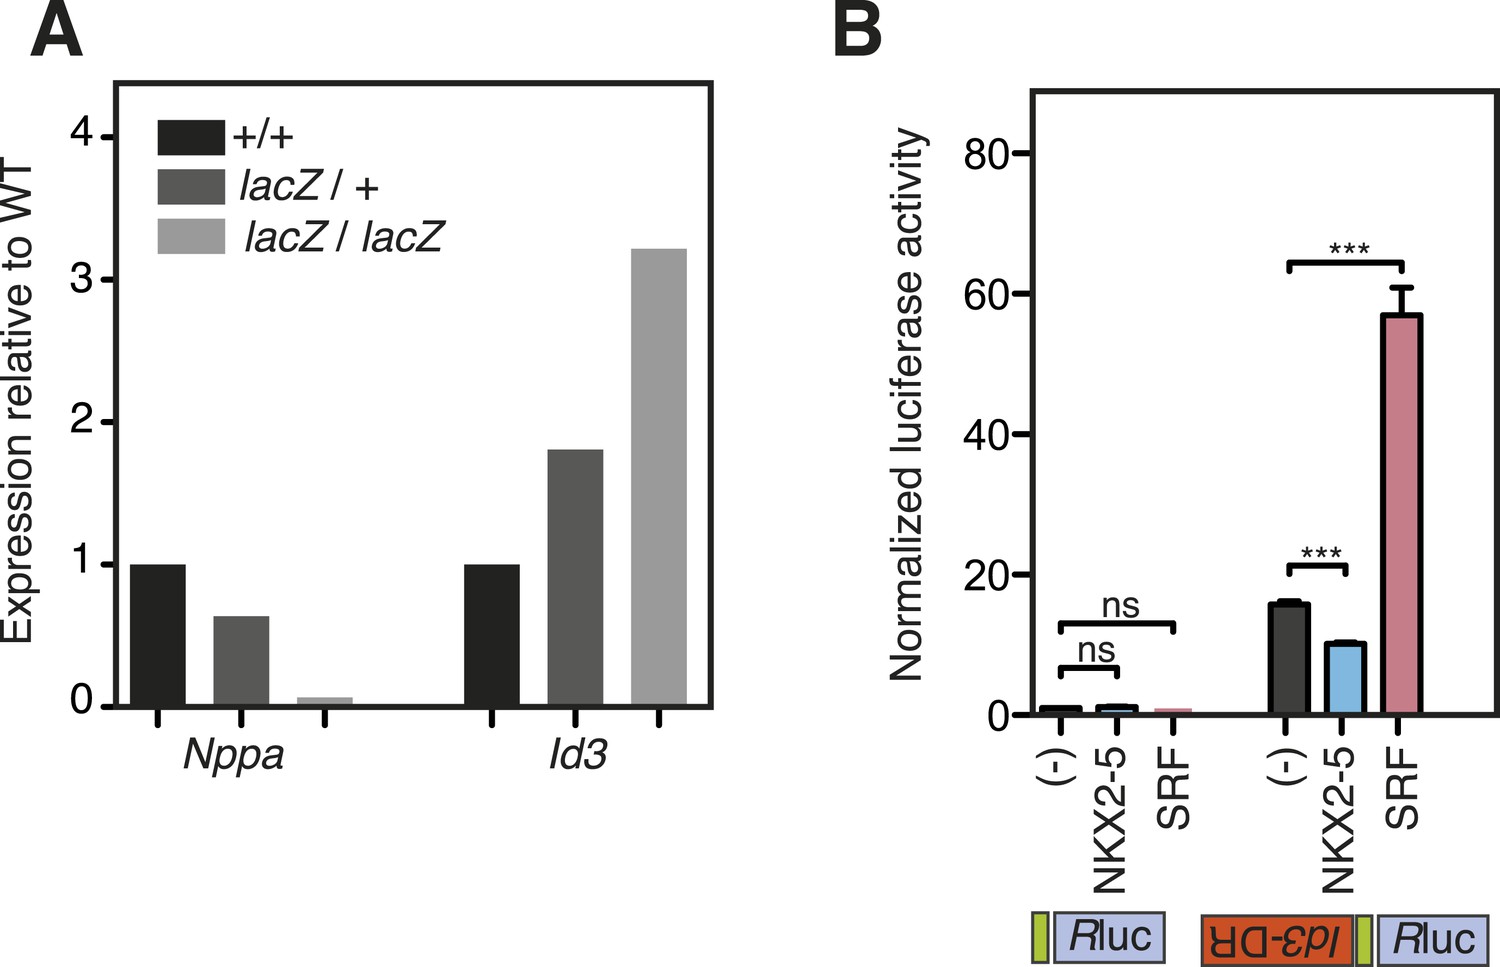
(A) Nppa and Id3 expression in Nkx2-5LacZ/+ heterozygous and Nkx2-5LacZ/LacZ null homozygous embryos relative to wild type (+/+) at E8.5. Expression was normalised to HPRT. (B) Normalised Renilla Luciferase (Rluc) activity in HEK 293 cells transfected with NKX2-5 and SRF. The 1270-bp Id3 DR region was cloned in sense or antisense orientations upstream of Rluc driven by a minimal TATA promoter. p-values were calculated relative to controls using an unpaired t-test (*** p < 0.001; ns = not significant).
Figure 3—figure supplement 2
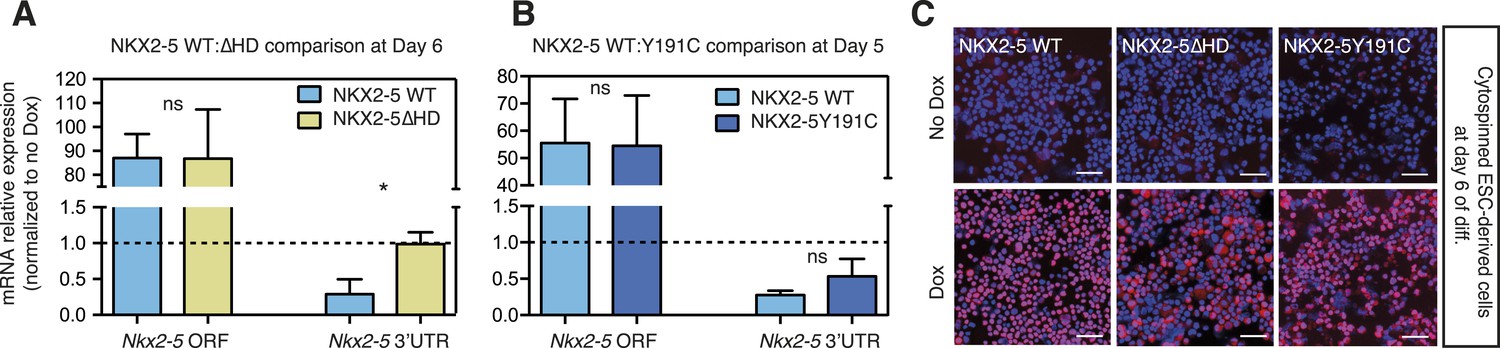
(A, B) RT-PCR quantification of Nkx2-5 ORF and endogenous Nkx2-5 (specifically detected using primers in the Nkx2-5 3′UTR, which is absent in the inducible construct) in NKX2-5 WT/Y191C/∆HD dox-inducible ES cell lines at day 6 (WT:∆HD comparison (A); 48 hr post-dox induction) and day 5 (WT:Y191C comparison (B); 24 hr post-induction).
Results were normalised to expression in uninduced cells. p-values were calculated using a t-test (* p < 0.05; ns = not significant). (C) Detection of induced NKX2-5 WT, NKX2-5Y191C, and NKX2-5∆HD by immunofluorescence microscopy in cytospinned cells at Day 6 (48 hr post-dox induction). Scale bars represent 50 mm.
Figure 4 with 3 supplements
The YRD is essential for interaction between NKX2-5 and NKX2-5ΔHD.
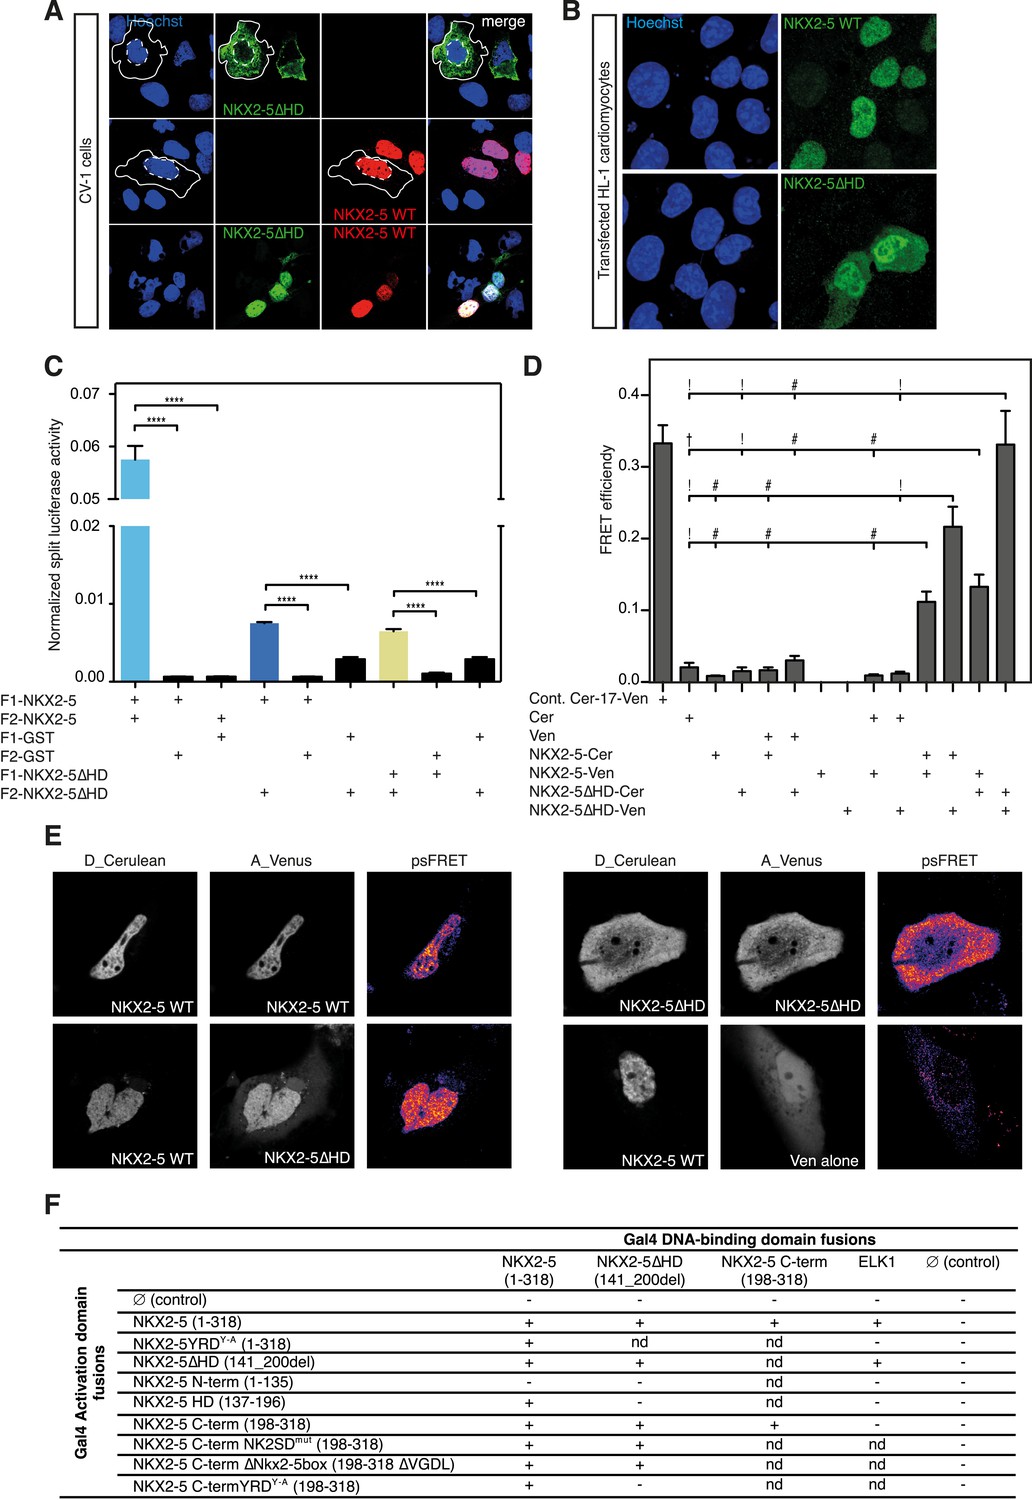
(A) Intracellular localisation of V5-tagged NKX2-5ΔHD and HA-tagged NKX2-5 WT. CV-1 cells were transfected with NKX2-5ΔHD only (top row), NKX2-5 WT only (middle row), or both (bottom row). Solid and dashed lines highlight the cellular and nuclear boundaries, respectively. (B) Intracellular localisation of transfected V5-tagged NKX2-5 WT (top row) and NKX2-5ΔHD (bottom row) in HL-1 cells. (C) NKX2-5 homo- and hetero-dimerisation measured by Rluc-PCA in HEK 293T cells. F1 and F2 represent the N- and C-terminal Rluc fragments, respectively. Data are represented as mean of the normalised luciferase activity ± SEM. Significance was calculated using an unpaired t-test (**** p < 0.0001). (D) NKX2-5 homo- and hetero-dimerisation measured by processed spectral Förster Resonance Energy Transfer (psFRET). Cerulean and Venus represent the donor and acceptor molecules. FRET efficiency is represented as mean ± SEM. p-values were calculated using a t-test between each pair and its appropriate controls. Significance is as follows: † for p-value < 0.05; ! for p-value < 0.001 ; # for p-value < 0.0001; values are given if p-value >0.05. (E) Representative psFRET images (false coloured using fire look up table) used in (D). (F) Yeast-two-hybrid assay. Proteins were fused to Gal4-activation and DNA-binding domains. Positive signs (+) show interaction as growth on selective medium from three independent experiments (nd = not determined). FRET, Förster Resonance Energy Transfer.
Figure 4—figure supplement 1
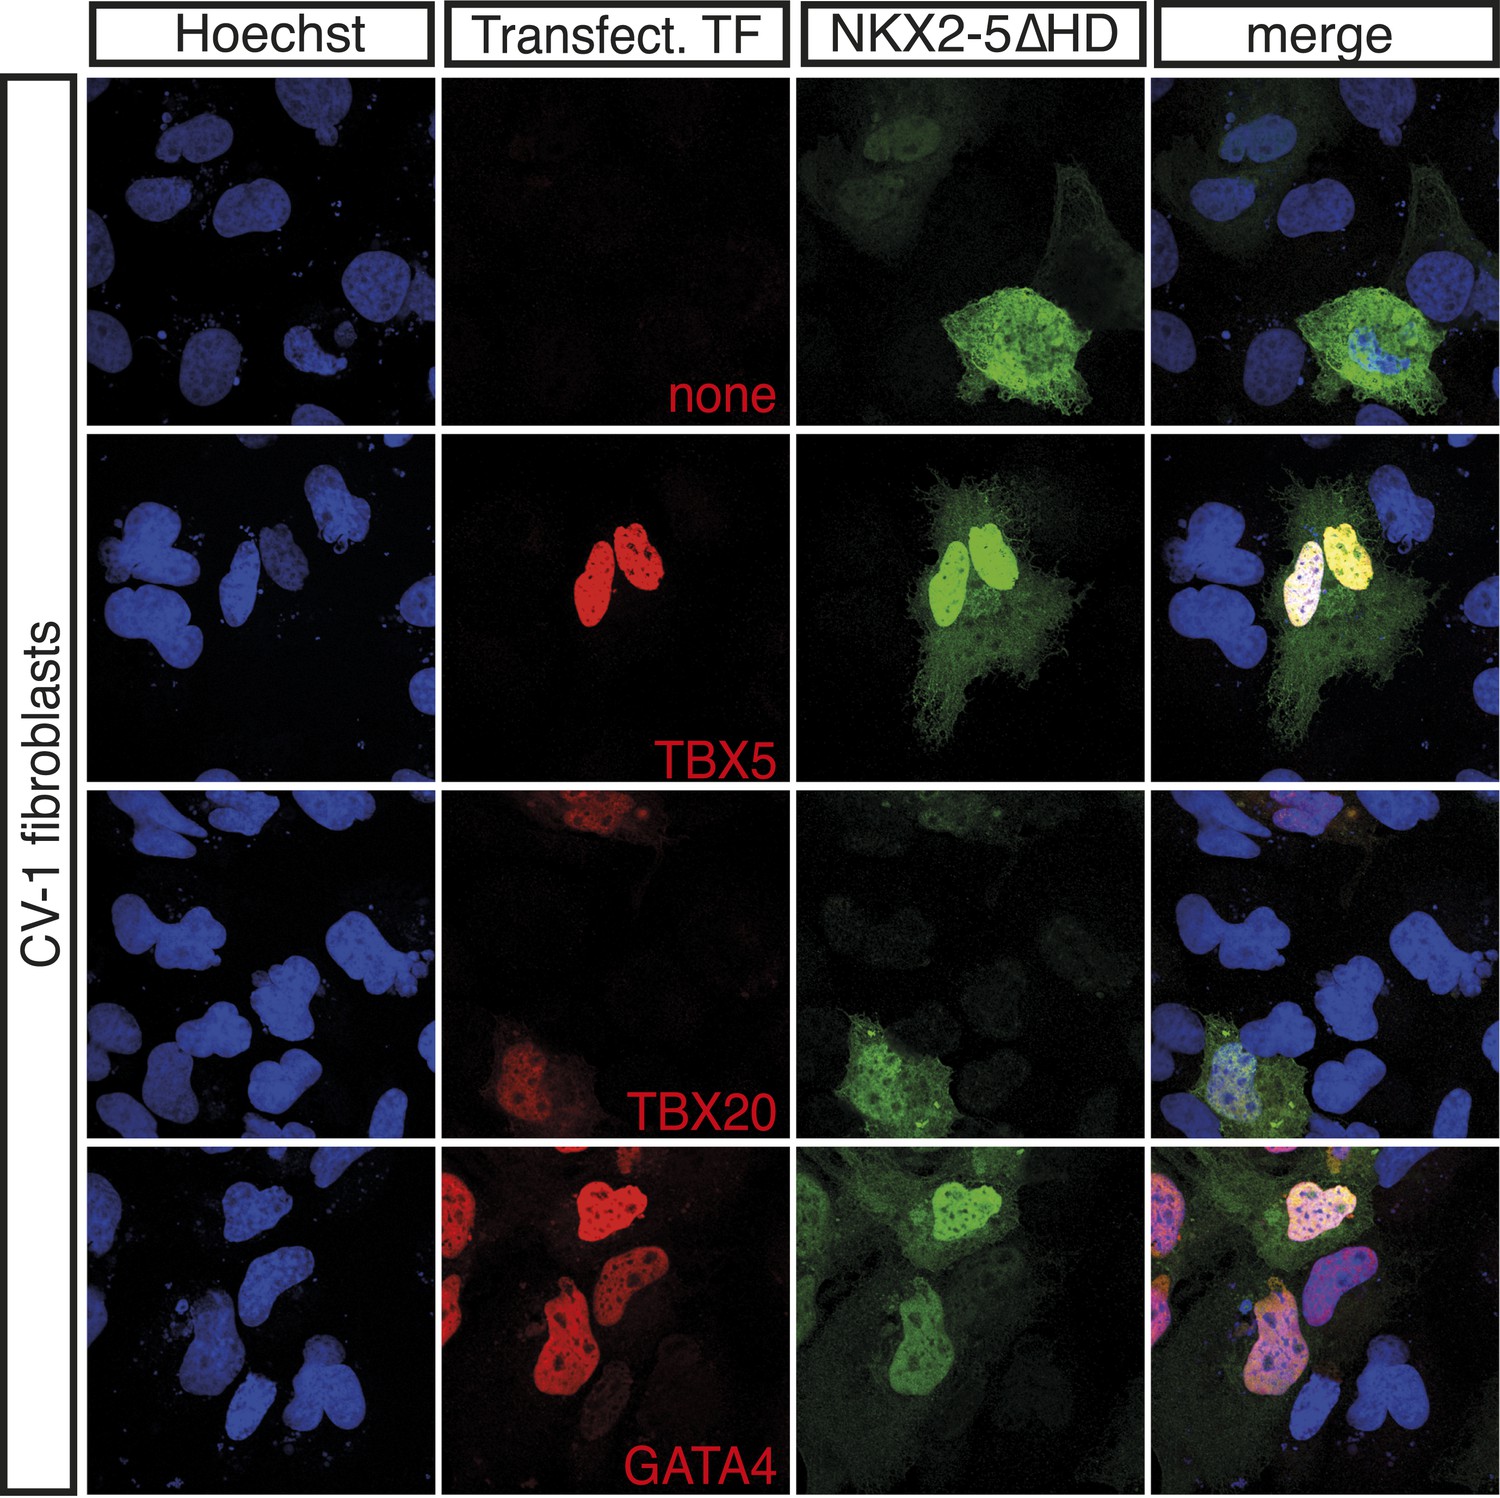
NKX2-5∆HD interacts with NKX2-5 cardiac cofactors and ETS-factors in vivo.
Expression of HA-tagged TBX5, TBX20, and GATA4 (red) induces nuclear translocation of V5-tagged NKX2-5DHD (green) in CV-1 cells.
Figure 4—figure supplement 2
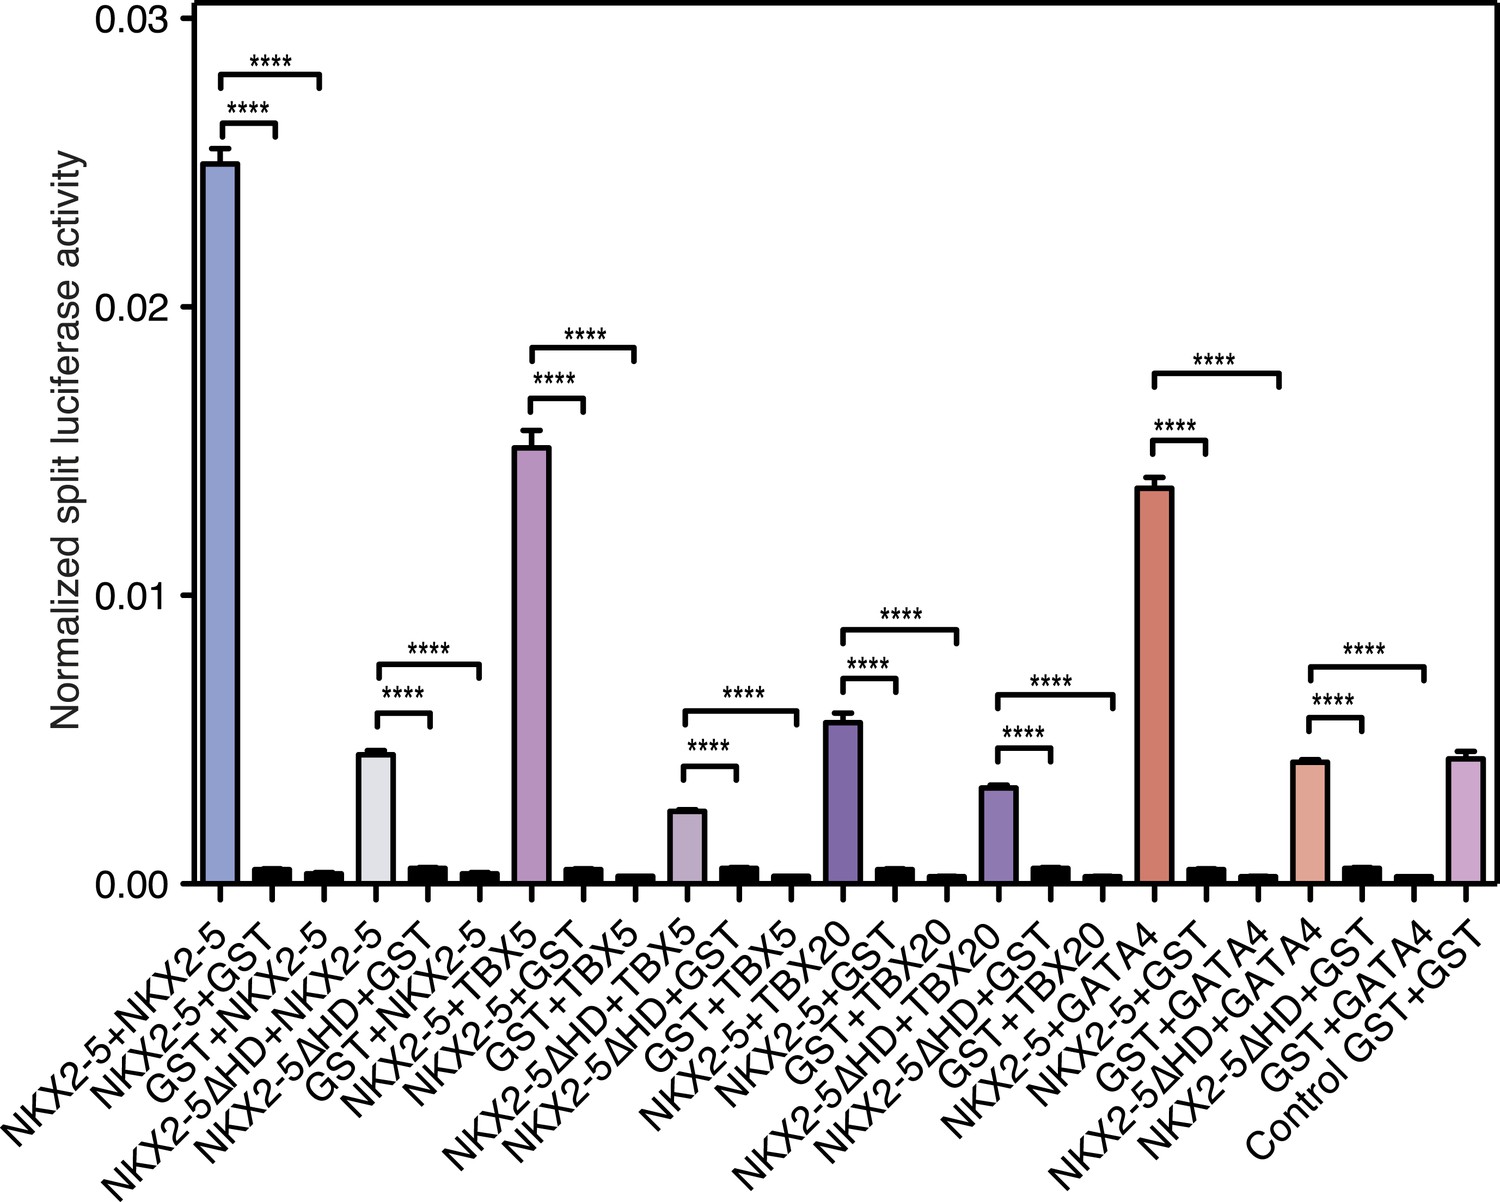
NKX2-5 dimerisation with TBX5, TBX20, and GATA4 measured by Rluc-PCA.
https://doi.org/10.7554/eLife.06942.022
Figure 4—figure supplement 3
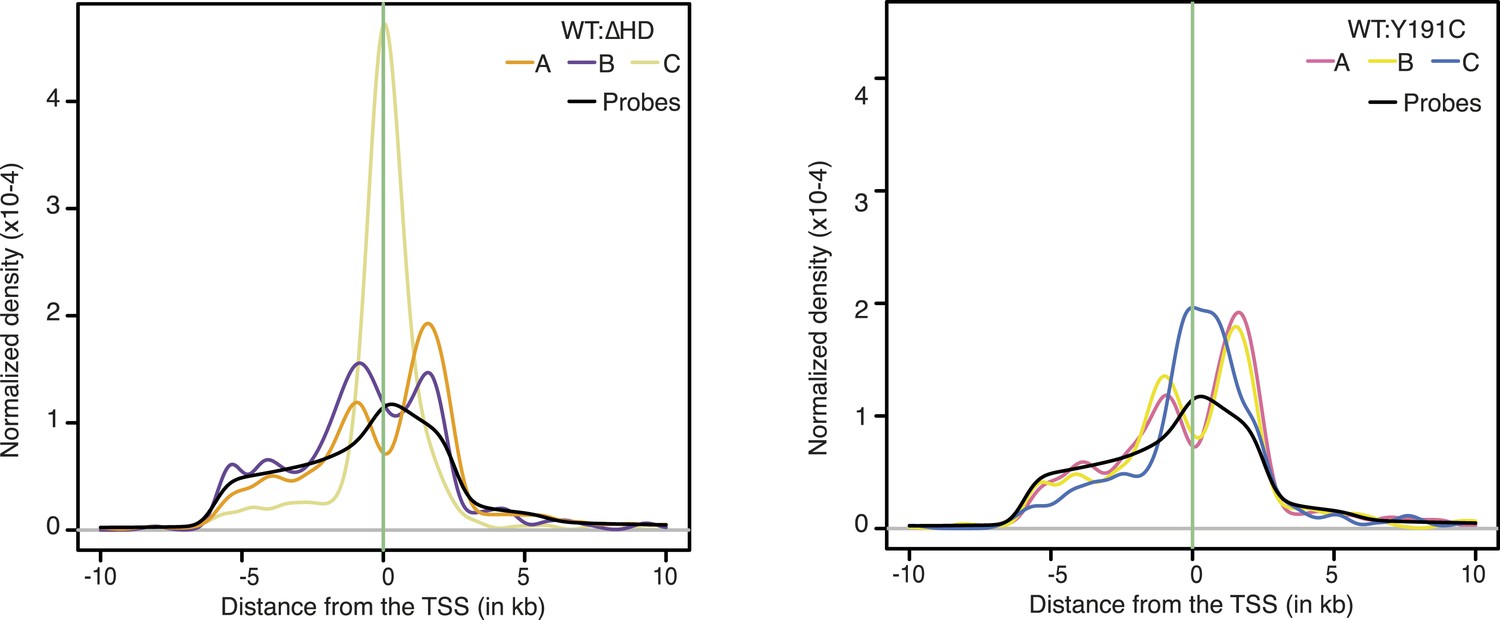
Density of NKX2-5 WT, NKX2-5∆HD, and NKX2-5Y191C peak sets and of probes relative to the TSS.
https://doi.org/10.7554/eLife.06942.023
Figure 5 with 2 supplements
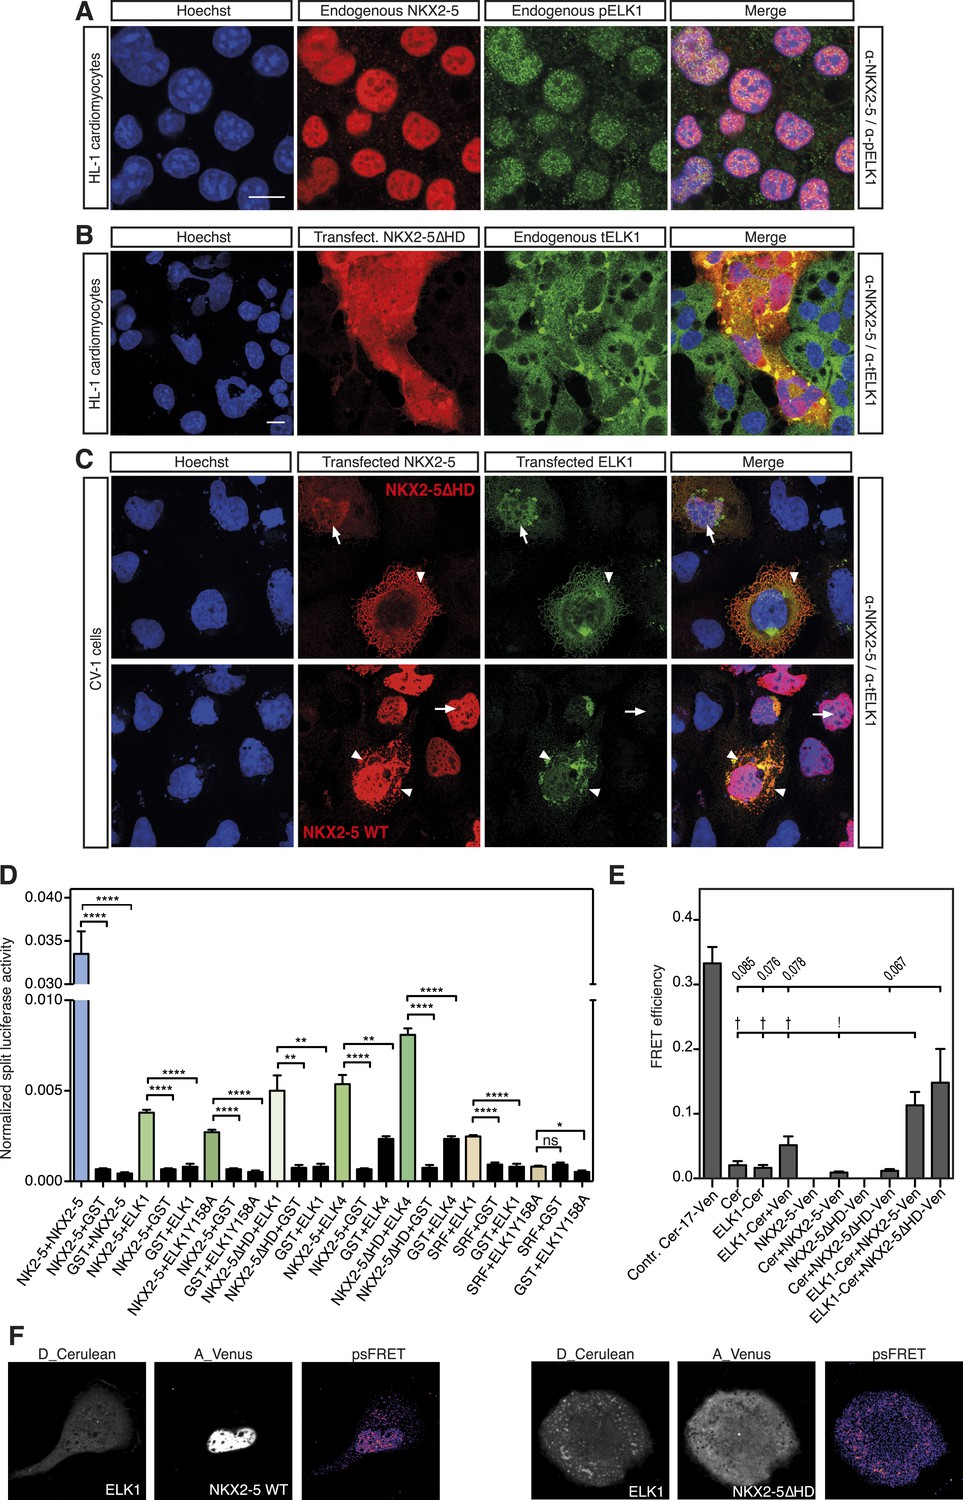
NKX2-5 WT and NKX2-5ΔHD interact with ELK1/4.
(A) Nuclear expression of endogenous NKX2-5 and pELK1 in HL-1 cells. Scale bar represents 10 µm. (B) Co-localisation of transfected V5-tagged NKX2-5ΔHD and endogenous total ELK1 in HL-1 cells. Scale bar represents 10 µm. (C) Co-localisation of transfected HA-tagged ELK1 and V5-tagged NKX2-5ΔHD or NKX2-5 WT in CV-1 cells. Arrowheads and arrows show cells with cytoplasmic and nuclear NKX2-5 staining, respectively. (D) Interactions between NKX2-5, NKX2-5ΔHD, or SRF and ELK4, ELK1, or ELK1Y159A measured by the Rluc-PCA in HEK 293T cells. (E) Interactions between ELK1 and NKX2-5 or NKX2-5ΔHD measured by psFRET in CV-1 cells. p-values: † <0.05; ! <0.001; values are given if p-value>0.05. (F) Representative psFRET images used in (E).
Figure 5—figure supplement 1
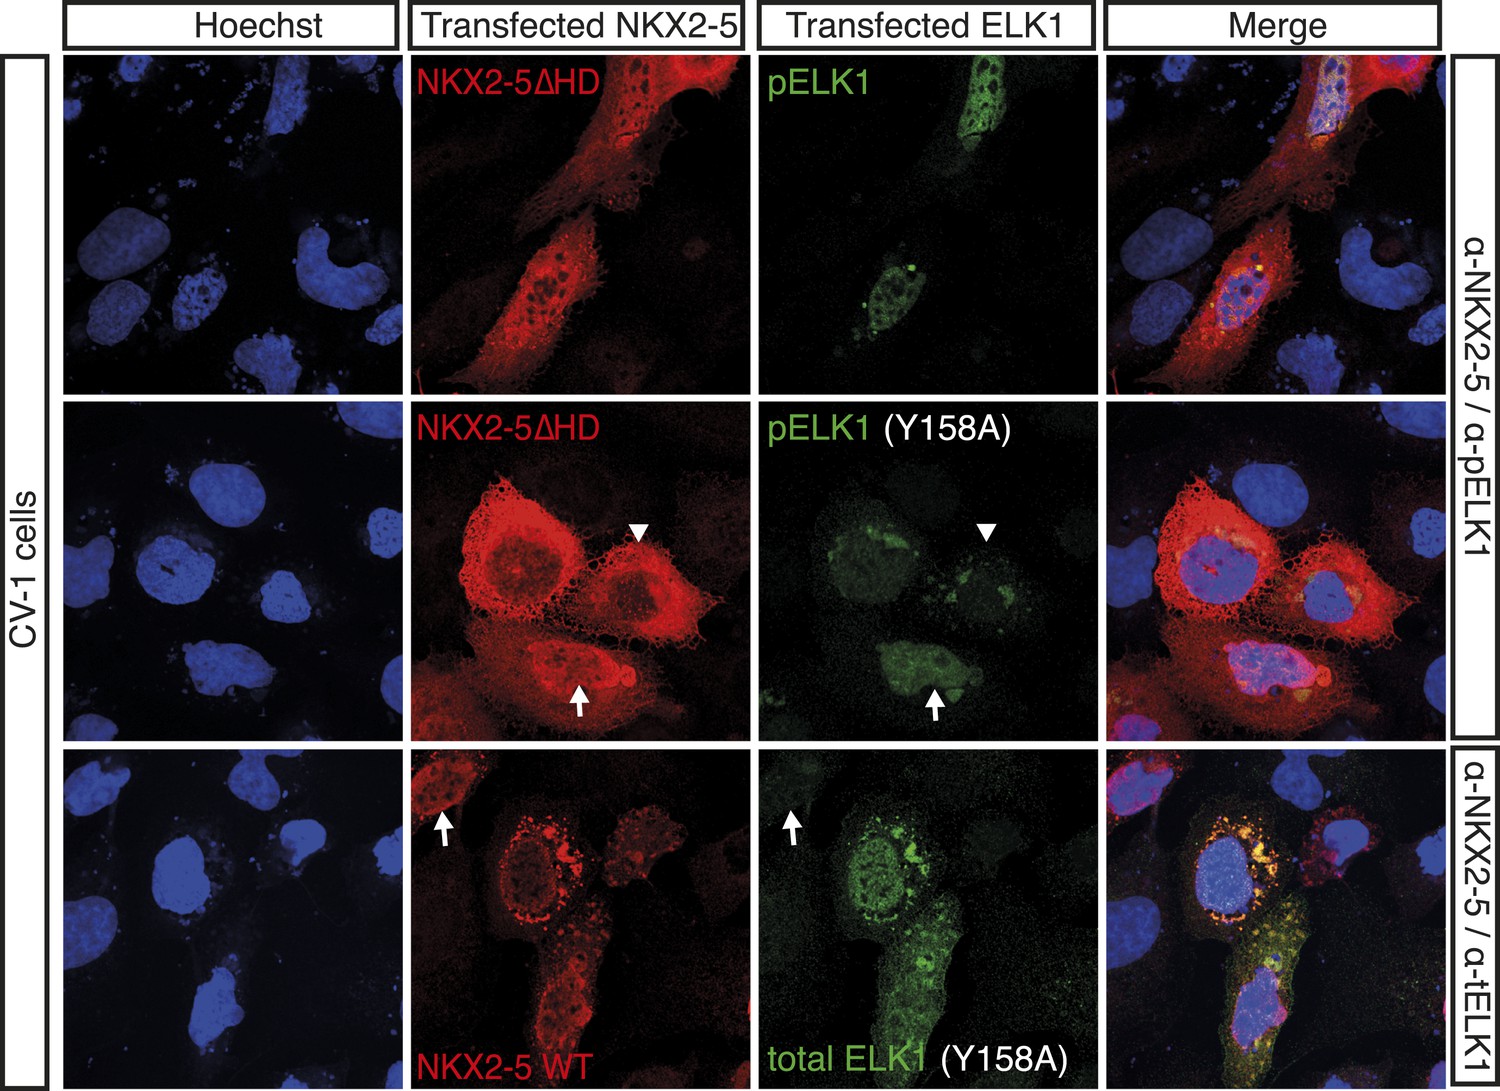
HA-tagged ELK1 expression (green) induces nuclear translocation of V5-tagged NKX2-5∆HD (red) in CV-1 cells.
Cells were co-transfected with NKX2-5∆HD and ELK1 (top); NKX2-5∆HD and ELK1Y158A (middle); or NKX2-5 WT and ELK1Y158A (lower). Anti-phosphorylated Elk1 antibody was used in top and middle panels. The arrowheads and arrows show cells with cytoplasmic and nuclear NKX2-5 staining, respectively.
Figure 5—figure supplement 2
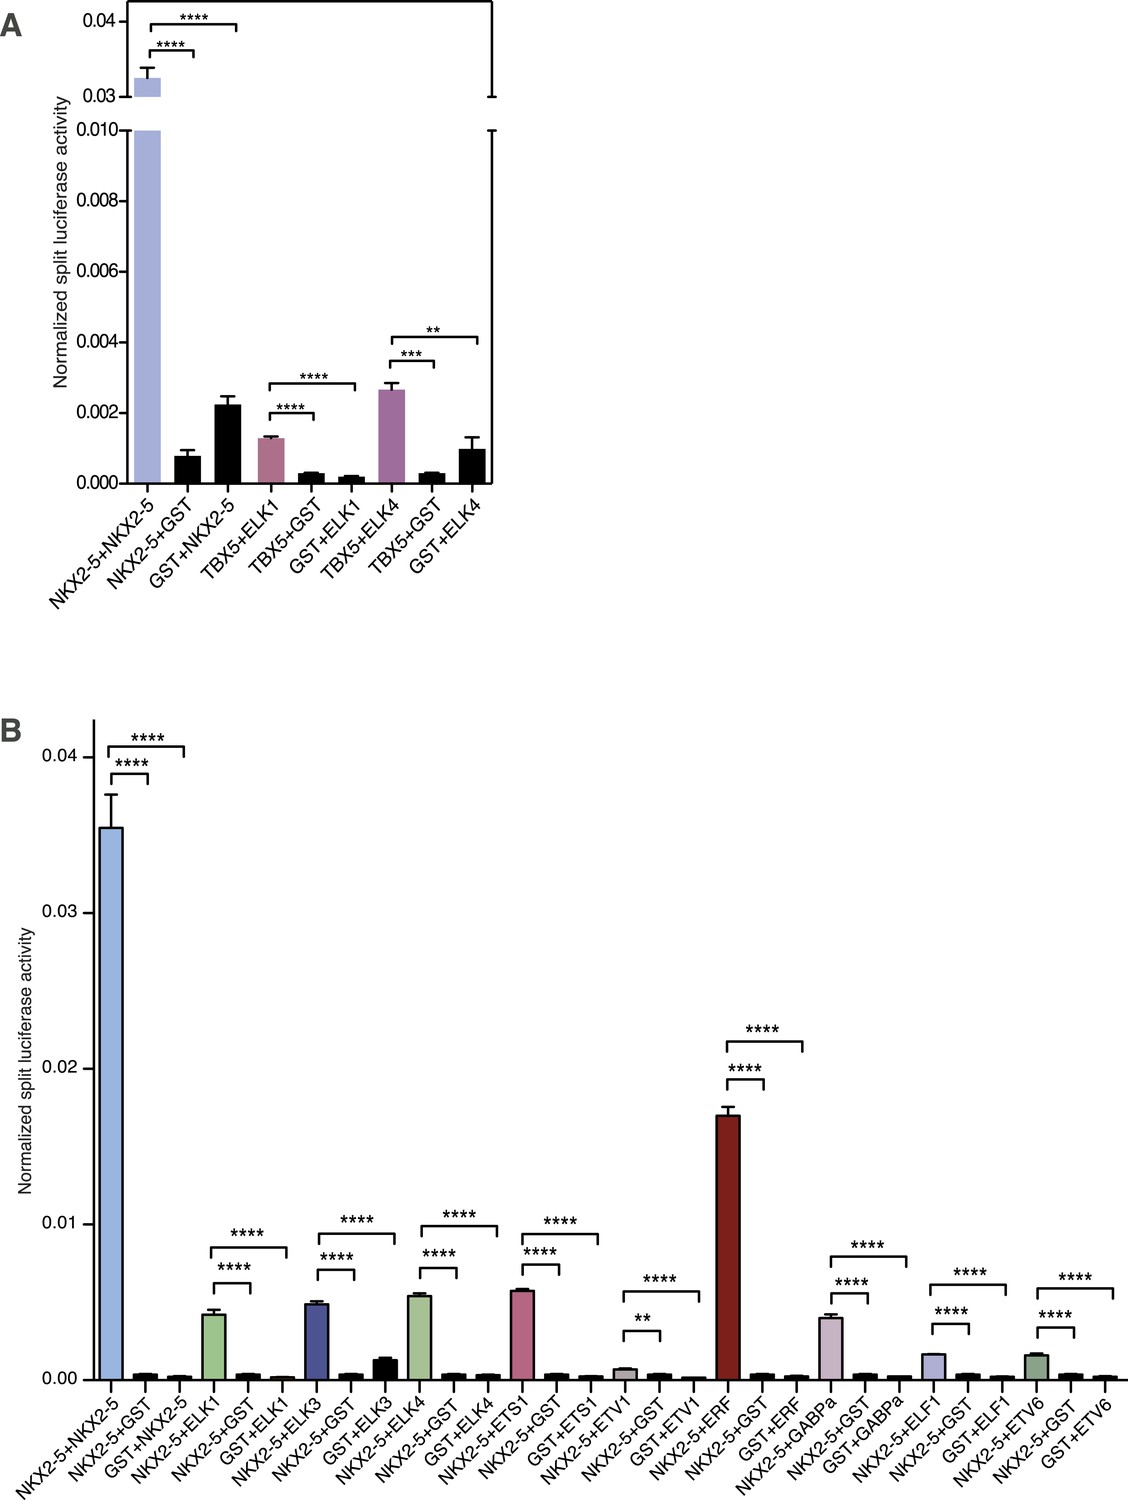
(A) Interactions between TBX5 and ELK1/ELK4 measured by the Rluc-PCA in HEK 293T cells (** p < 0.01; *** p < 0.001; ****p < 0.0001).
(B) NKX2-5 dimerisation with ETS factors measured by Rluc-PCA in HEK 293T cells.
Figure 6
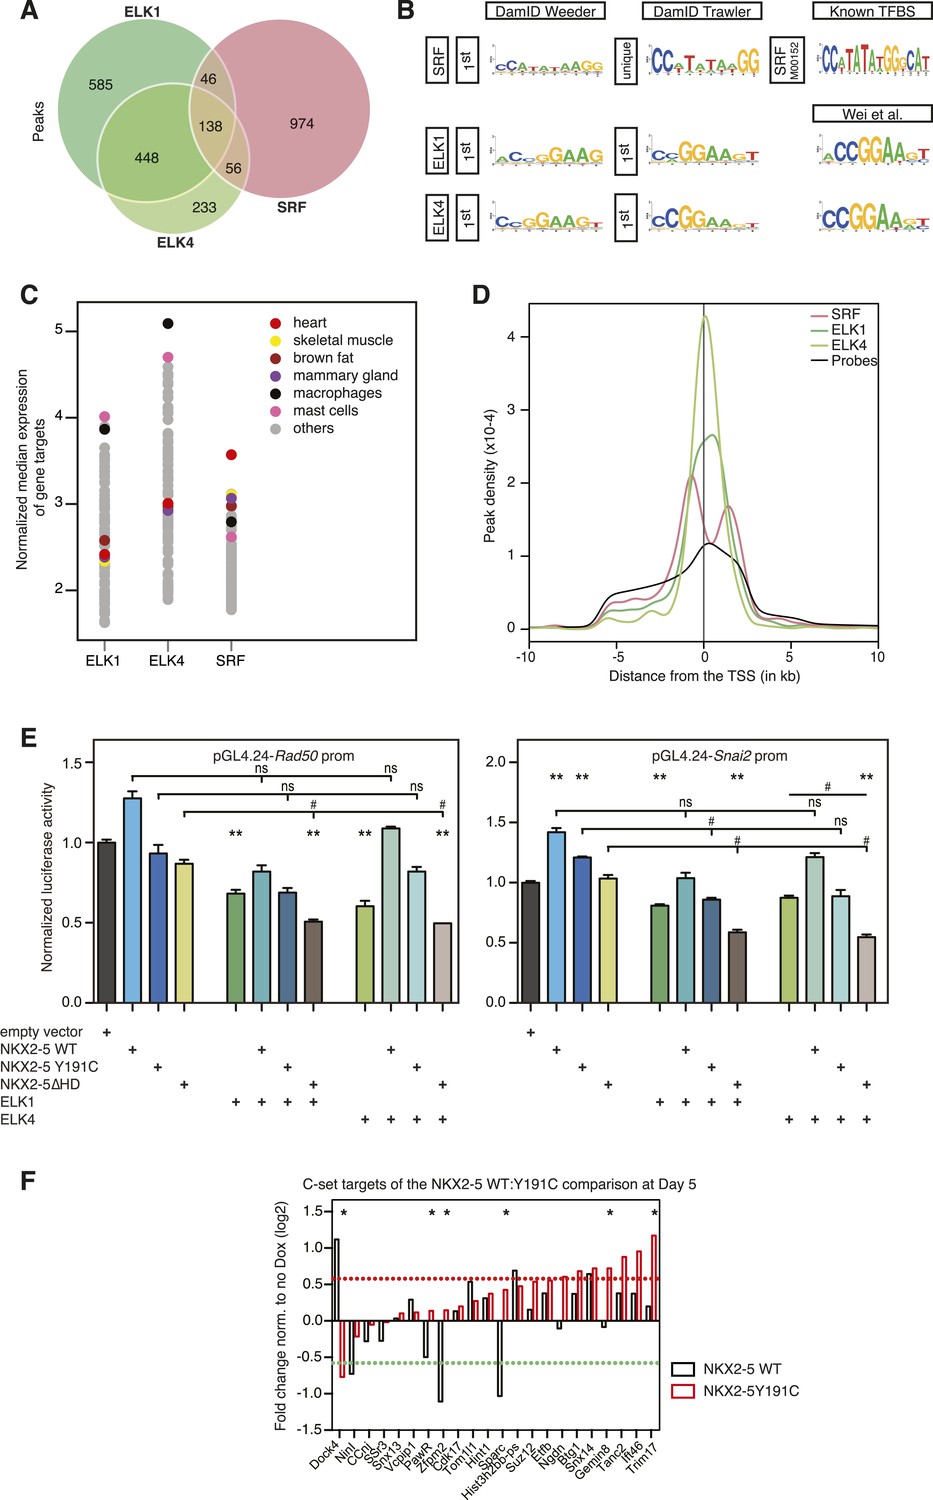
ELK1 and ELK4 co-occupy NKX2-5ΔHD off-targets in HL-1 cells.
(A) Overlapping peaks between ELK1, ELK4, and SRF as shown by proportional Venn diagram. (B) Top binding motifs discovered de novo with Weeder or Trawler in ELK1, ELK4, and SRF peaks. The TRANSFAC SRF motif and the ELK1/4 motifs determined by (Wei et al., 2010) in vitro are shown on the right. (C) Normalised median expression of ELK1, ELK4, and SRF target genes in 91 murine cell types, including the heart in red (data collected from BioGPS). (D) Density of ELK1, ELK4, and SRF peaks and probes relative to the TSS. (E) Normalised Rluc activity in HEK 293 cells. NKX2-5 WT and mutants were co-transfected with a pGL4.24 luciferase reporter under the control of the Rad50- or Snai2-promoters. p-values < 0.01 calculated relative to control are denoted by **. # shows significant difference (p < 0.01). (F) RT-PCR quantification of NKX2-5Y191C off-target genes in NKX2-5 WT or Y191C dox-inducible ES cell lines at day 5 (24 hr post-induction). Results were normalised to expression in uninduced cells. p-values were calculated using a t-test (* p < 0.05).
Figure 7

ELK1 and ELK4 are embedded in the cardiac gene regulatory network.
(A) Overlapping target genes between NKX2-5, ELK1/ELK4, and SRF visualised using Cytoscape (spring-embed layout). Cluster size is proportional to gene numbers. For each cluster, rectangles indicate the normalised median expression of target genes in 91 murine cell types (BioGPS). Cell types are ordered by increasing expression values from left to right. Top 3 over-represented DAVID Gene Ontology (GO) annotations are indicated for each cluster. (B) Regulatory interactions between Elk1/3/4 and cardiac TFs from DamID experiments and published data sets (network constructed with BioTapestry).
Additional files
-
Supplementary file 1
Targets of NKX2-5, ELK1, ELK4, and SRF identified by DamID in murine HL-1 cardiomyocytes. This file contains genomic coordinates of peaks bound by NKX2-5, NKX2-5Y191C, NKX2-5∆HD, ELK1, ELK4, and SRF and their respective target genes and GO over-representations determined using GREAT (McLean et al., 2010). This file also contains results of our de novo motif discovery analysis.
- https://doi.org/10.7554/eLife.06942.029
-
Supplementary file 2
Supplementary tables. List of antibodies (A) and primers used for qPCR and ChIP (B). (C) Peak calling from three independent Dam experiments.
- https://doi.org/10.7554/eLife.06942.030
Download links
A two-part list of links to download the article, or parts of the article, in various formats.
Downloads (link to download the article as PDF)
Open citations (links to open the citations from this article in various online reference manager services)
Cite this article (links to download the citations from this article in formats compatible with various reference manager tools)
NKX2-5 mutations causative for congenital heart disease retain functionality and are directed to hundreds of targets
eLife 4:e06942.
https://doi.org/10.7554/eLife.06942


