Maturation of a central brain flight circuit in Drosophila requires Fz2/Ca2+ signaling
- Tata Institute of Fundamental Research, India
Figures
Figure 1 with 2 supplements

dFz2 function is required in dopaminergic neurons during development for normal adult flight.
(A) Percentage flight times of individuals after knockdown of dFz2 in aminergic neurons (DdcGAL4), serotonergic neurons (TRHGAL4), dopaminergic neurons (THGAL4). Knockdown of dFz2 in aminergic neurons (DdcGAL4, first bar in red) and in dopaminergic neurons (THGAL4, third bar in red) showed reduced flight. Knockdowns were compared to their respective GAL4 controls (gray bars; *p < 0.001, Mann–Whitney U-test). (B) Percentage flight times of dFz2-IR heterozygotes (gray bars) and flies with knockdown of dFz2 in dopaminergic neurons (red bars) at specific developmental stages by temperature controlled THGAL4; GAL80ts expression are shown. Flies with knockdown during pupal development exhibit reduced flight similar to knockdown post-egg laying (PEL) as compared to controls (*p < 0.001, Mann–Whitney U-test). (C) Durations of rhythmic action potentials recorded from the DLMs of air-puff stimulated tethered flies. Bars represent the mean spike duration and diamonds represent the spike duration of an individual recording (*p < 0.001, Mann–Whitney U-test). (D) Representative traces of electrophysiological recordings from DLMs of individuals with dFz2 knockdown at the indicated developmental stages are shown. (E) Quantification of dFz2 transcript levels after knockdown by dFz2 RNAi in serotonergic (TRHGAL4) and dopaminergic (THGAL4) neurons. The Y-axis represents log2 fold changes calculated by the ΔΔCt method. Each value is the mean ± SEM of three independent experiments, obtained from three independent RNA samples (*p < 0.05, one-way ANOVA).
Figure 1—figure supplement 1
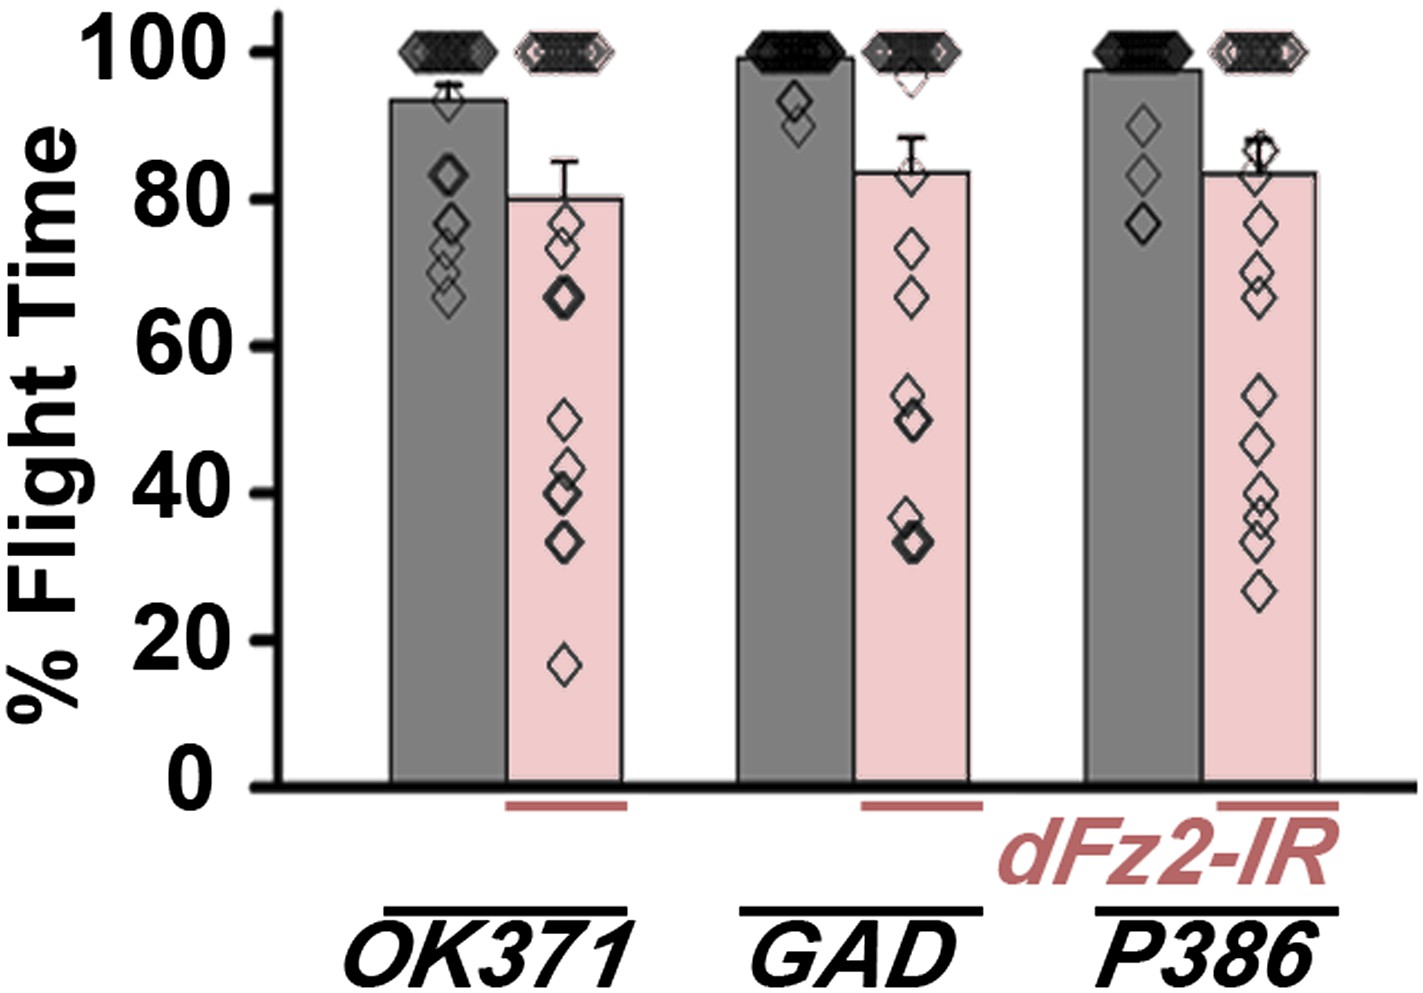
Normal flight in flies with knockdown of dFz2 in non-dopaminergic neurons.
Percentage flight times of individual flies after knockdown of dFz2 in glutamatergic (OK371GAL4), mostly GABAergic (GADGAL4) and a peptidergic neuron subset (P386GAL4). Knockdown of dFz2 in these neuronal domains (red bars) did not lead to flight deficits. Knockdown of dFz2 by specific GAL4s was compared to their respective GAL4 controls (gray bars) (*p < 0. 001, Mann–Whitney U-test).
Figure 1—figure supplement 2
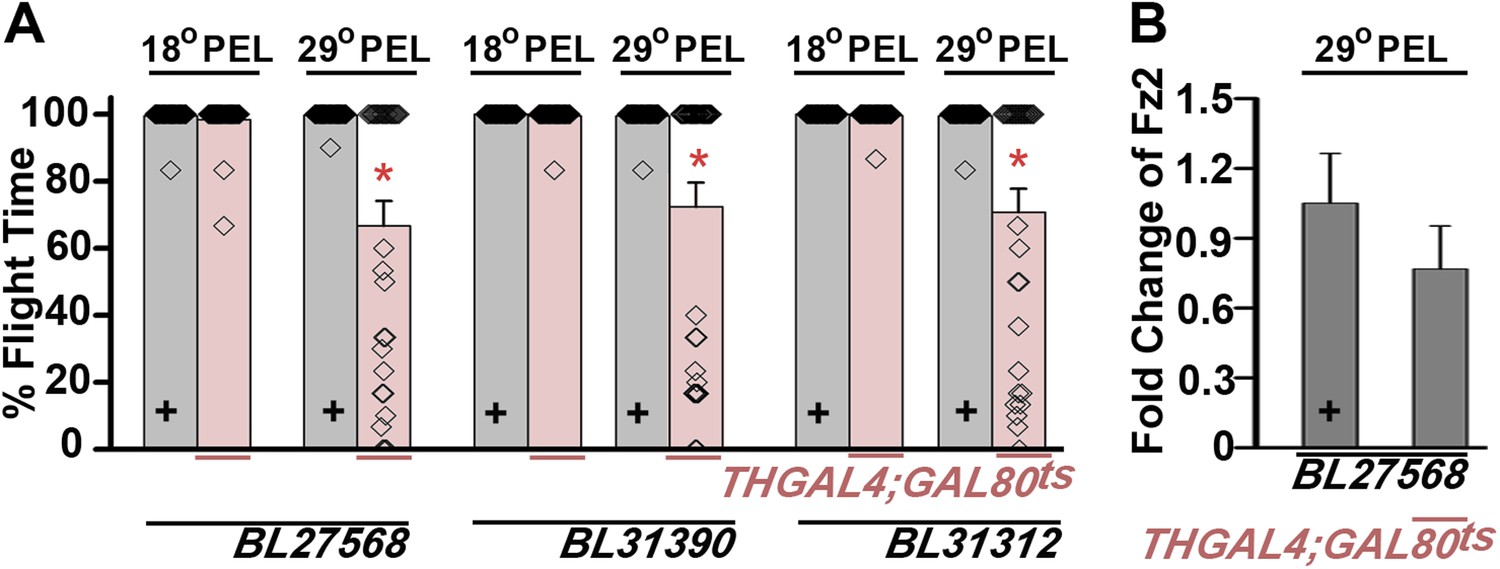
Expression of multiple dFz2-IR strains in dopaminergic neurons exhibits flight defects.
(A) Percentage flight times of dFz2-IR (BL27568, BL31390, BL31312) heterozygotes (gray bars) and flies with knockdown of dFz2 in dopaminergic neurons (red bars). Knockdown was achieved by temperature controlled THGAL4; GAL80ts expression. Flies, with knockdown post-embryonic development (PEL), exhibit significant flight defects as compared to controls (*p < 0.001, Mann–Whitney U-test). (B) Quantification of dFz2 transcript levels in THGAL4;GAL80ts;BL27568 (29°C PEL) is shown. No significant reduction in transcript levels was observed. The Y-axis represents log2 fold changes calculated by the ΔΔCt method. Each value is the mean ± SEM of three independent experiments obtained from three independent RNA samples.
Figure 2 with 3 supplements

RNAi-mediated knockdown of dFz2 function in Protocerebral Anterior Medial (PAM) dopaminergic neurons causes flight deficits.
(A) Expression pattern of THGAL4 in the anterior and posterior regions of the brain are shown. Dotted line markings show the neuronal clusters. PAM: protocerebral anterior medial; PAL: protocerebral anterior lateral; PPM1, PPM2, PPM3: protocerebral posterior medial 1, 2, and 3; PPL1, PPL2: protocerebral posterior lateral 1 and 2. (B) Percentage flight times of heterozygous GAL4 controls (gray bars) and GAL4-specific knockdown of dFz2 (red bars). Knockdown of dFz2 in PAM-expressing GAL4 individuals (THC1GAL4, NP6510GAL4, R58E02GAL4) resulted in significantly reduced flight times when compared to their respective GAL4 controls (*p < 0.001, Mann–Whitney U-test). (C) Durations of rhythmic action potentials recorded from the DLMs of air-puff stimulated tethered flies. Average Spike durations were reduced upon expression of dFz2 RNAi in NP6510GAL4 and R58E02GAL4 as compared to GAL4s controls (*p < 0.001, Mann–Whitney U-test). (D) Expression of THC1GAL4, THF2GAL4, NP6510GAL4, and R58E02GAL4 in the PAM neuronal cluster is shown. Except THF2GAL4, all other GAL4s express in dopaminergic PAM neurons. Expression was analyzed from 10 brain hemispheres.
Figure 2—figure supplement 1
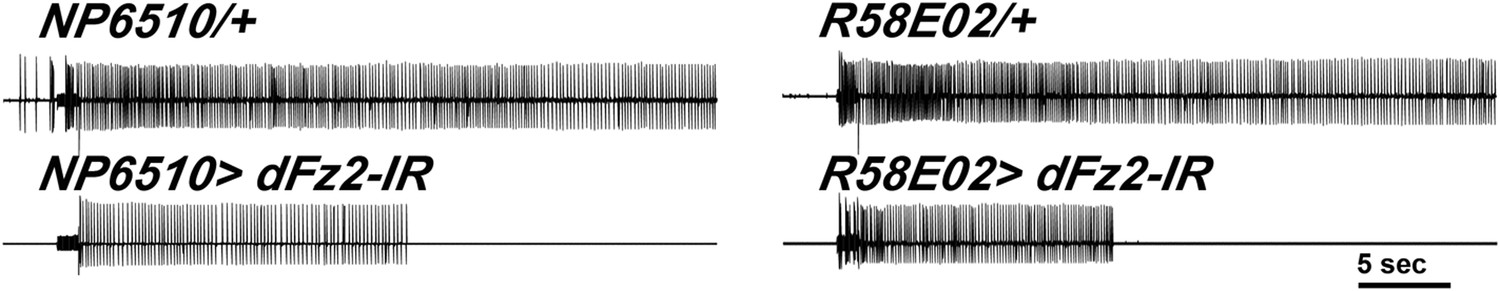
Electrophysiological traces showed reduced firing upon knockdown of dFz2.
Representative traces for electrophysiological recordings obtained from DLMs of flies of the indicated genotypes.
Figure 2—figure supplement 2
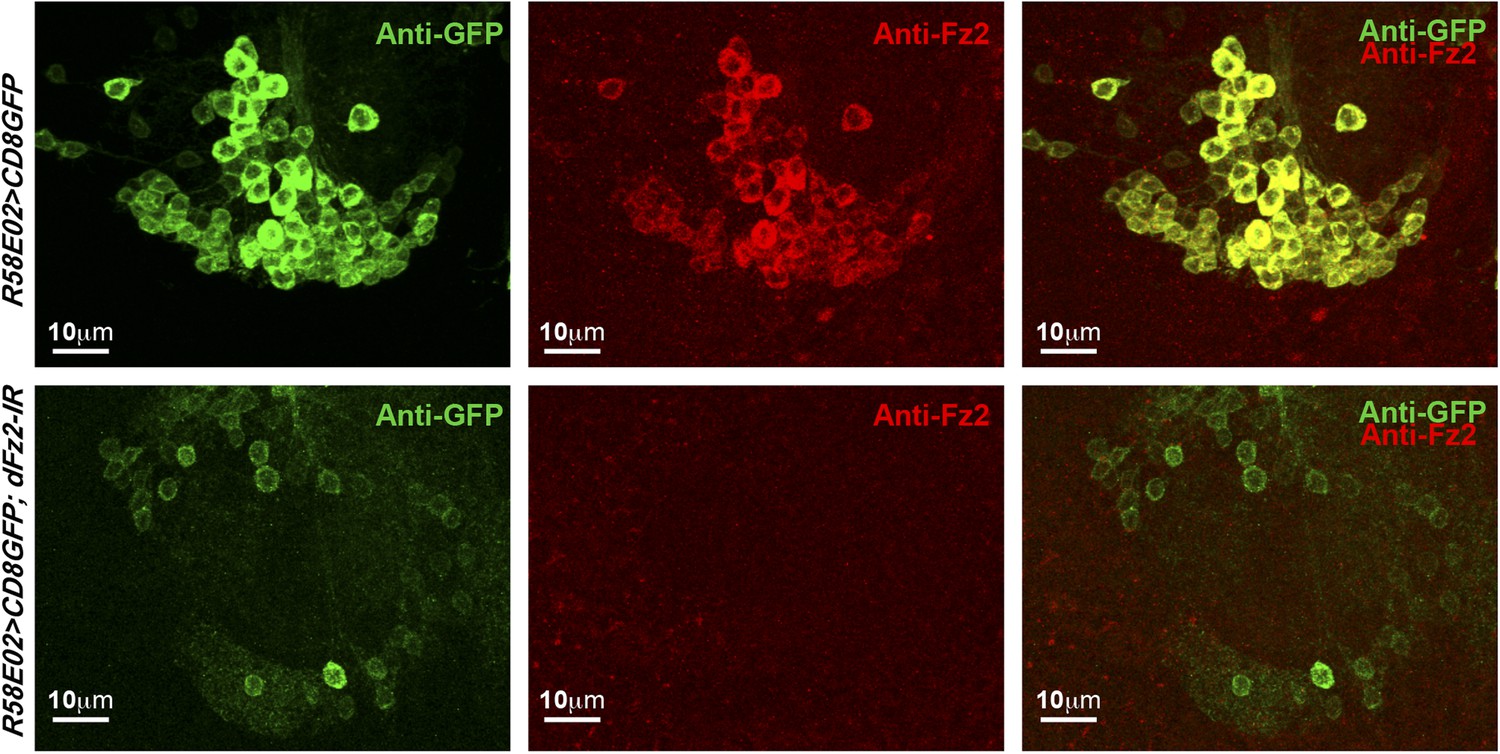
Expression of dFz2 in PAM dopaminergic neurons.
Expression of GFP (Anti GFP; green) and dFz2 (Anti Fz2; red) in PAM dopaminergic neurons of R58E02GAL4> mCD8GFP flies and R58E02GAL4> mCD8GFP; dFz2-IR flies. dFz2 immunostaining was absent upon expression of dFz2-IR.
Figure 2—figure supplement 3
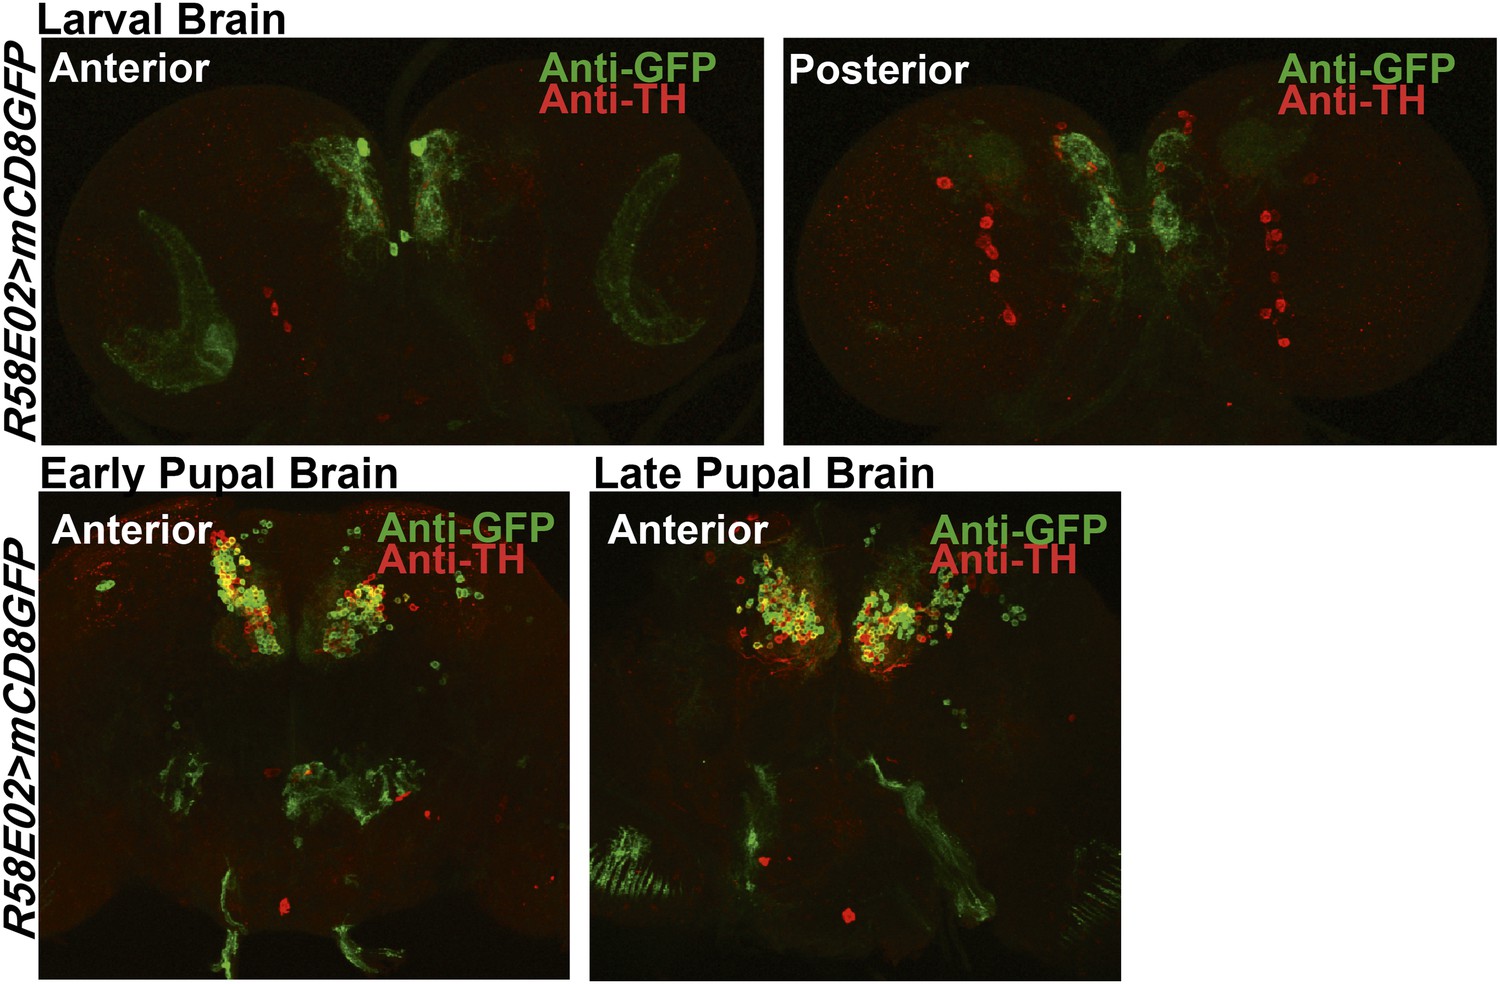
Expression of TH in PAM dopaminergic neurons during development.
Expression of GFP (Anti GFP; green) and TH (Anti TH; red) in the larval and pupal brain of R58E02GAL4>mCD8GFP organisms are shown. Separate confocal stacks for the anterior and posterior regions of the brain are shown. TH immunoreactivity (red) co-localizes with R58E02GAL4-driven mGFP (green) in pupae but not in larvae.
Figure 3 with 3 supplements
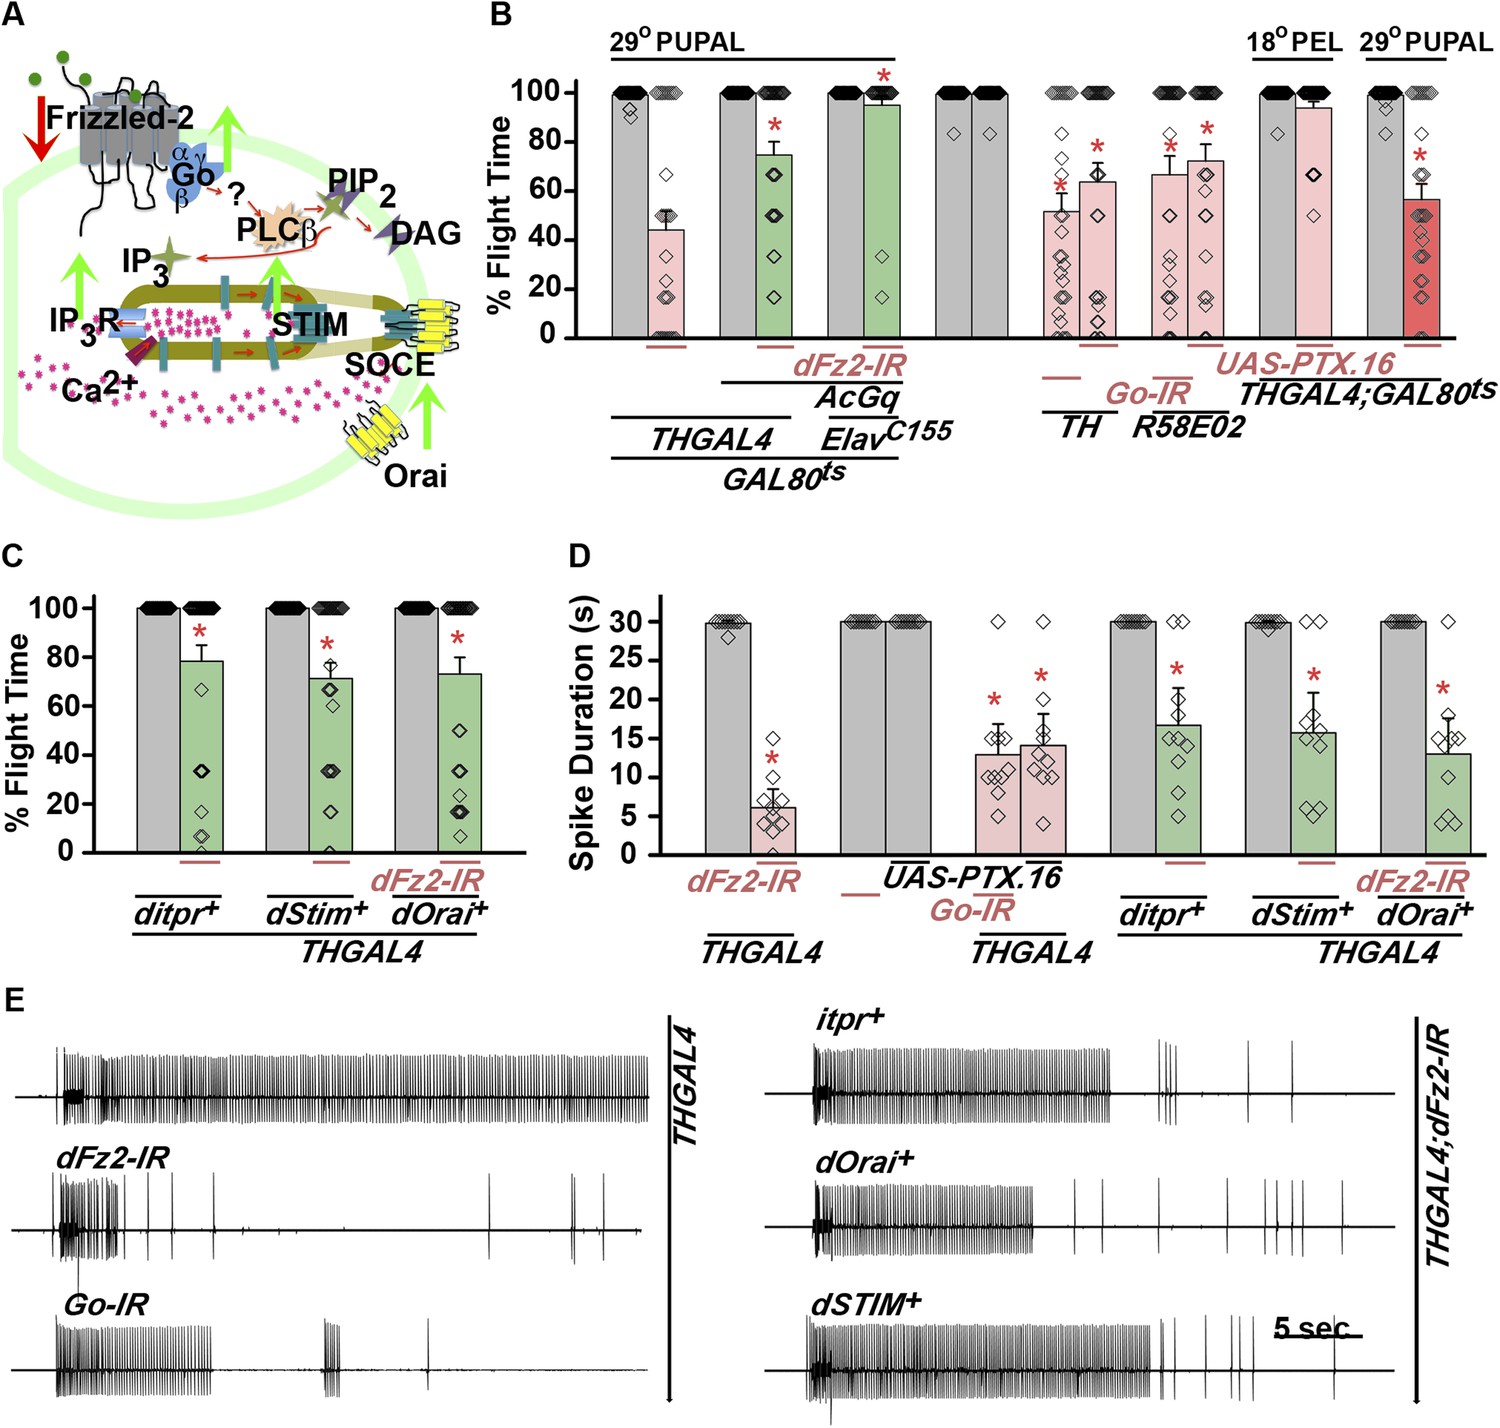
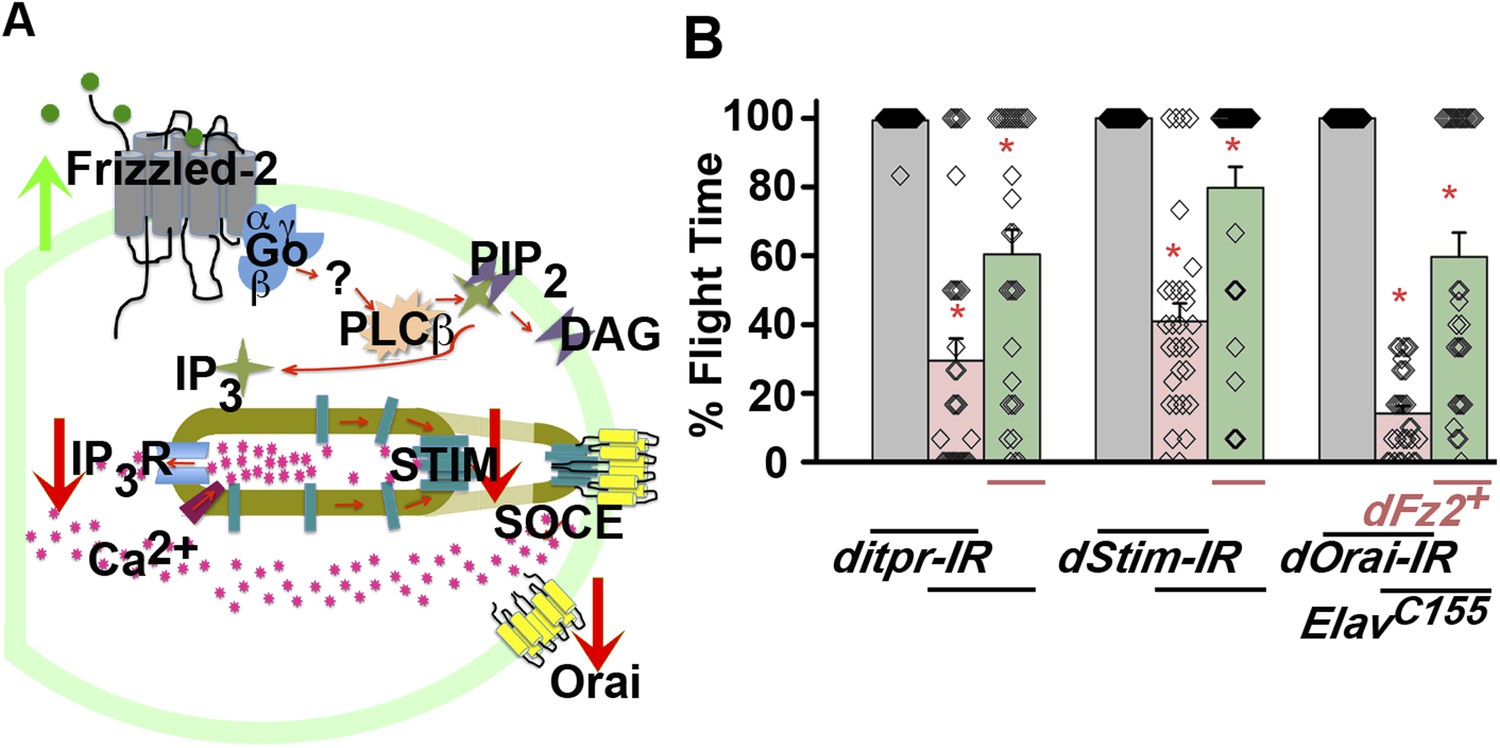
dFz2 function is mediated through G-protein Go and IP3-mediated calcium signaling in dopaminergic neurons.
(A) A schematic showing dFz2-mediated activation of Go followed by IP3R-mediated Ca2+ signaling pathway and Store-operated Ca2+ entry (SOCE) through dSTIM and dOrai. Red (down-regulation) and green (over-expression) arrows indicate the two strategies used for testing this signaling mechanism. (B) Percentage flight times of the indicated genotypes are shown. Knockdowns flight times were compared to their respective heterozygote controls, whereas AcGo rescue of dFz2 knockdown was compared to dFz2 knockdown (*p < 0.001, Mann–Whitney U-test). (C) Percentage flight times of heterozygous controls (gray bars) followed by over-expression of calcium signaling molecules (itpr+, dStim+, dOrai+) in flies with knockdown of dFz2 (green bars). Overexpression of calcium signaling molecules (itpr+, dStim+, dOrai+) rescued flight defects significantly when compared to flies with dFz2 knockdown (*p < 0.001, Mann–Whitney U-test). (D) Durations of rhythmic action potentials recorded from the DLMs of air-puff stimulated tethered flies. Spike durations were reduced upon expression of Go RNAi or UAS-PTX.16 in dopaminergic neurons and partially rescued upon over-expression of calcium signaling molecules (itpr+, dStim+, dOrai+) when compared to knockdown of dFz2 (*p < 0.001, Mann–Whitney U-test). (E) Representative electrophysiological recordings from DLMs of the indicated genotypes.
Figure 3—figure supplement 1
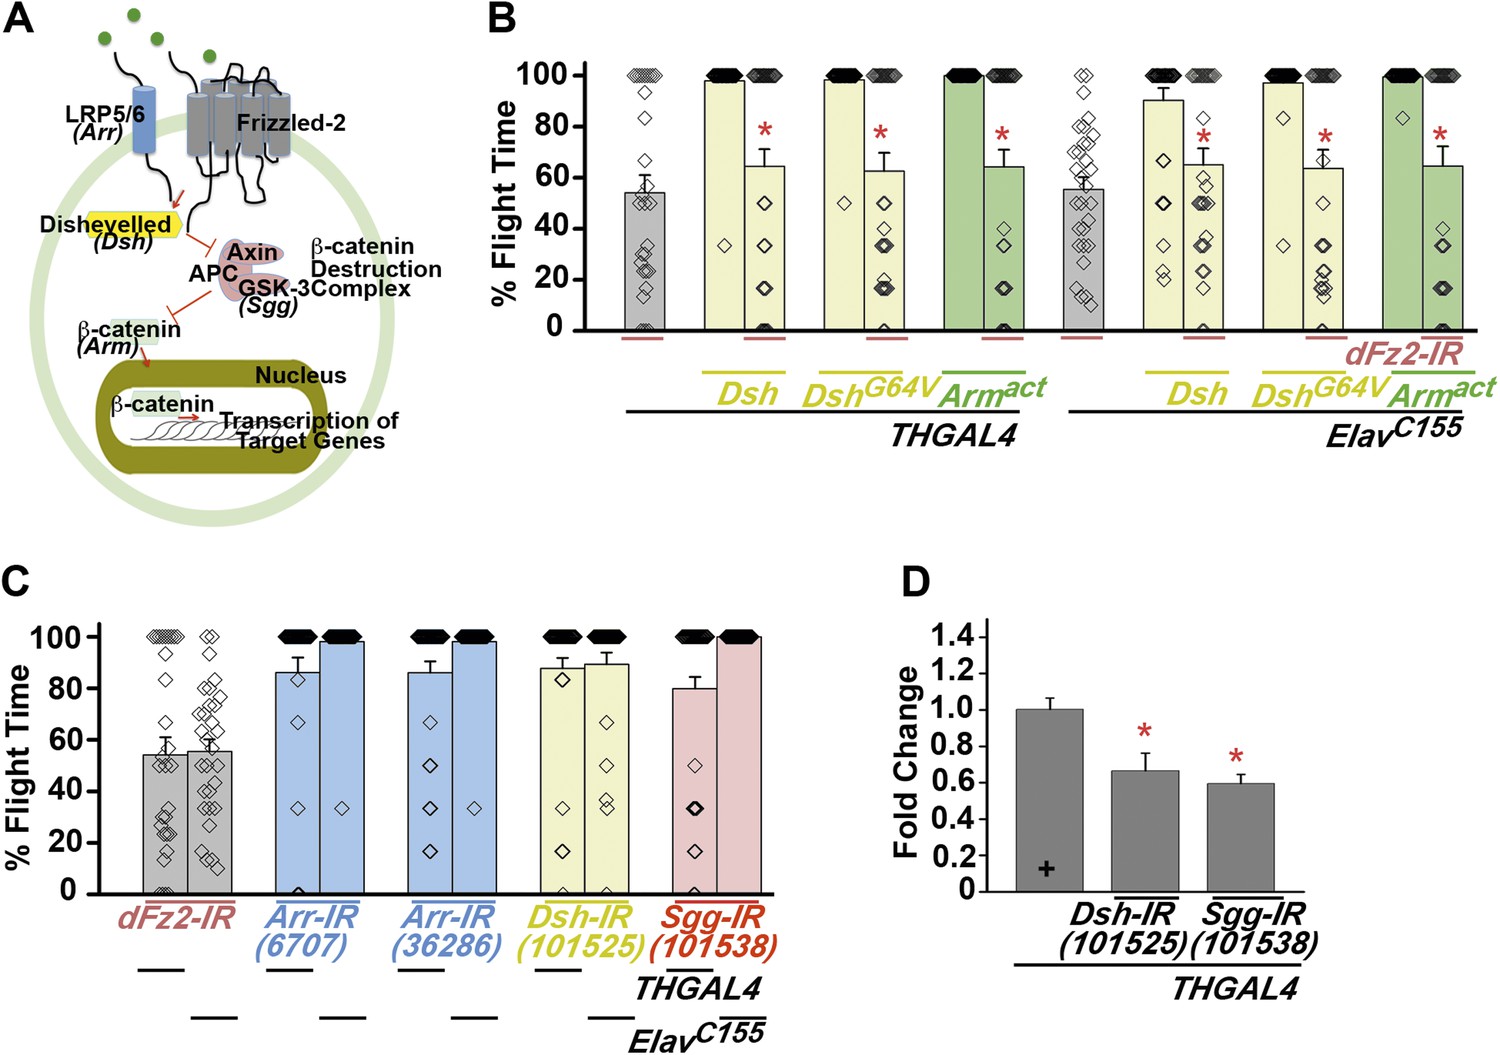
The canonical Fz2/β catenin signaling pathway does not function downstream of dFz2 in the context of flight circuit maturation.
(A) A schematic of canonical Wnt/dFz2 signaling. Upon activation by Wnt, in collaboration with a co-receptor (lipoprotein receptor-related protein or LRP5/6; encoded by gene Arrow in Drosophila), dFz2 activates the cytosolic protein Dishevelled, which is an inhibitor of a negative regulator, Axin of the pathway. Axin is required for formation of a β catenin destruction complex. Activated Dishevelled prevents formation of the β catenin destruction complex and hence stabilizes formation and accumulation of β catenin (encoded by Armadillo). β catenin moves to the nucleus and activates downstream signaling. (B) Percentage flight times for heterozygotes (gray bars); dopaminergic (THGAL4) and pan-neuronal (ElavC155GAL4) over-expression of Dishevelled (Dsh), point mutant in DIX-domain of Dishevelled (DshG64V) (yellow bars) or activated form of Armadillo (Armact) (green bars) in the background of dFz2 knockdown are shown. Over-expression of indicated transgenes was compared to the dFz2 knockdown and found not to be significantly different (p < 0.001, Mann–Whitney U-test). (C) Average percentage flight times (bars) of individuals (diamonds) with knockdown of LRP5/6 (Arr-IR; blue bars), Dishevelled (Dsh-IR; yellow bars) or GSK-3 (Sgg-IR; red bars) in dopaminergic (THGAL4) and pan-neuronal (ElavC155GAL4) domains. (D) Quantification of transcripts in total RNA isolated from heads, upon expression of RNAi for Dishevelled (Dsh-IR) and Shaggy (Sgg-IR) is shown. The Y-axis represents log2 fold changes calculated by the ΔΔCt method. Each value is the mean ± SEM of three independent experiments, obtained from three independent RNA samples. Gene expression was reduced significantly as compared to the THGAL4 control (*p < 0.05, one-way ANOVA).
Figure 3—figure supplement 2
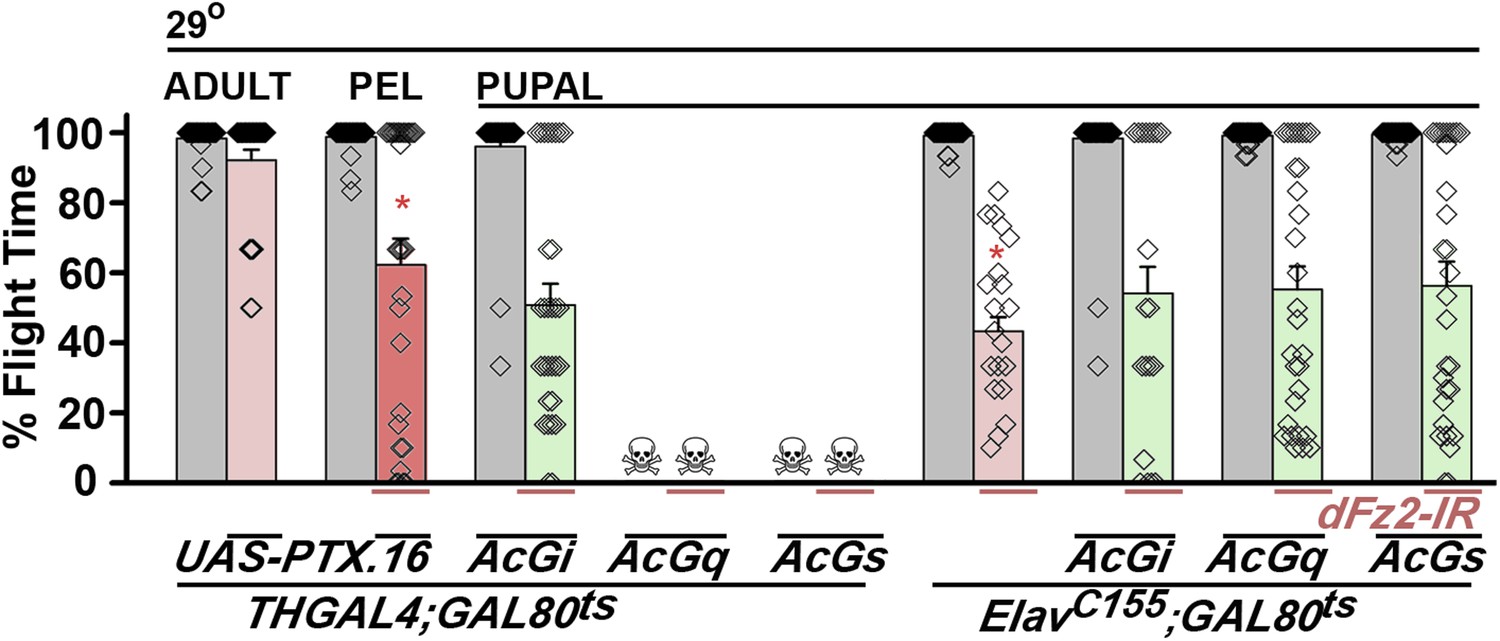
Go functions downstream of dFz2 in the context of flight circuit maturation.
Percentage flight times are shown for flies with dopaminergic specific expression of UAS-PTX.16 (red bars) at the indicated developmental stages obtained by temporal activation of THGAL4; GAL80ts. Flight deficits observed were significantly different from THGAL4; GAL80ts heterozygote controls (gray bars; *p < 0.001, Mann–Whitney U-test). Over-expression of AcGi, AcGq, or AcGs in the background of dopaminergic (THGAL4)-driven dFz2 knockdown either did not rescue flight or affected viability. Flight in organisms with pan-neuronal (ElavC155GAL4) knockdown of dFz2 (red bars), compared with constitutively active forms of Gi (AcGi), Gq (AcGq), or Gs (AcGs) in the background of dFz2 knockdown (green bars) during pupal development, was not significantly different (p < 0.001, Mann–Whitney U-test).
Figure 3—figure supplement 3
Non-canonical dFz2/Ca2+ signaling functions downstream of dFz2 in the context of flight circuit maturation.
(A) Schematic of putative non-canonical dFz2/Ca2+ signaling depicting the strategies used for testing this pathway. Red arrows represent knockdown and green arrows show over-expression of the indicated molecule. (B) Percentage flight times of individuals of the indicated genotypes. Over-expression of dFz2 partially rescues the flight defects shown by pan-neuronal knockdown of calcium signaling molecules (itpr, dStim, dOrai) (*p < 0.001, Mann–Whitney U-test).
Figure 4
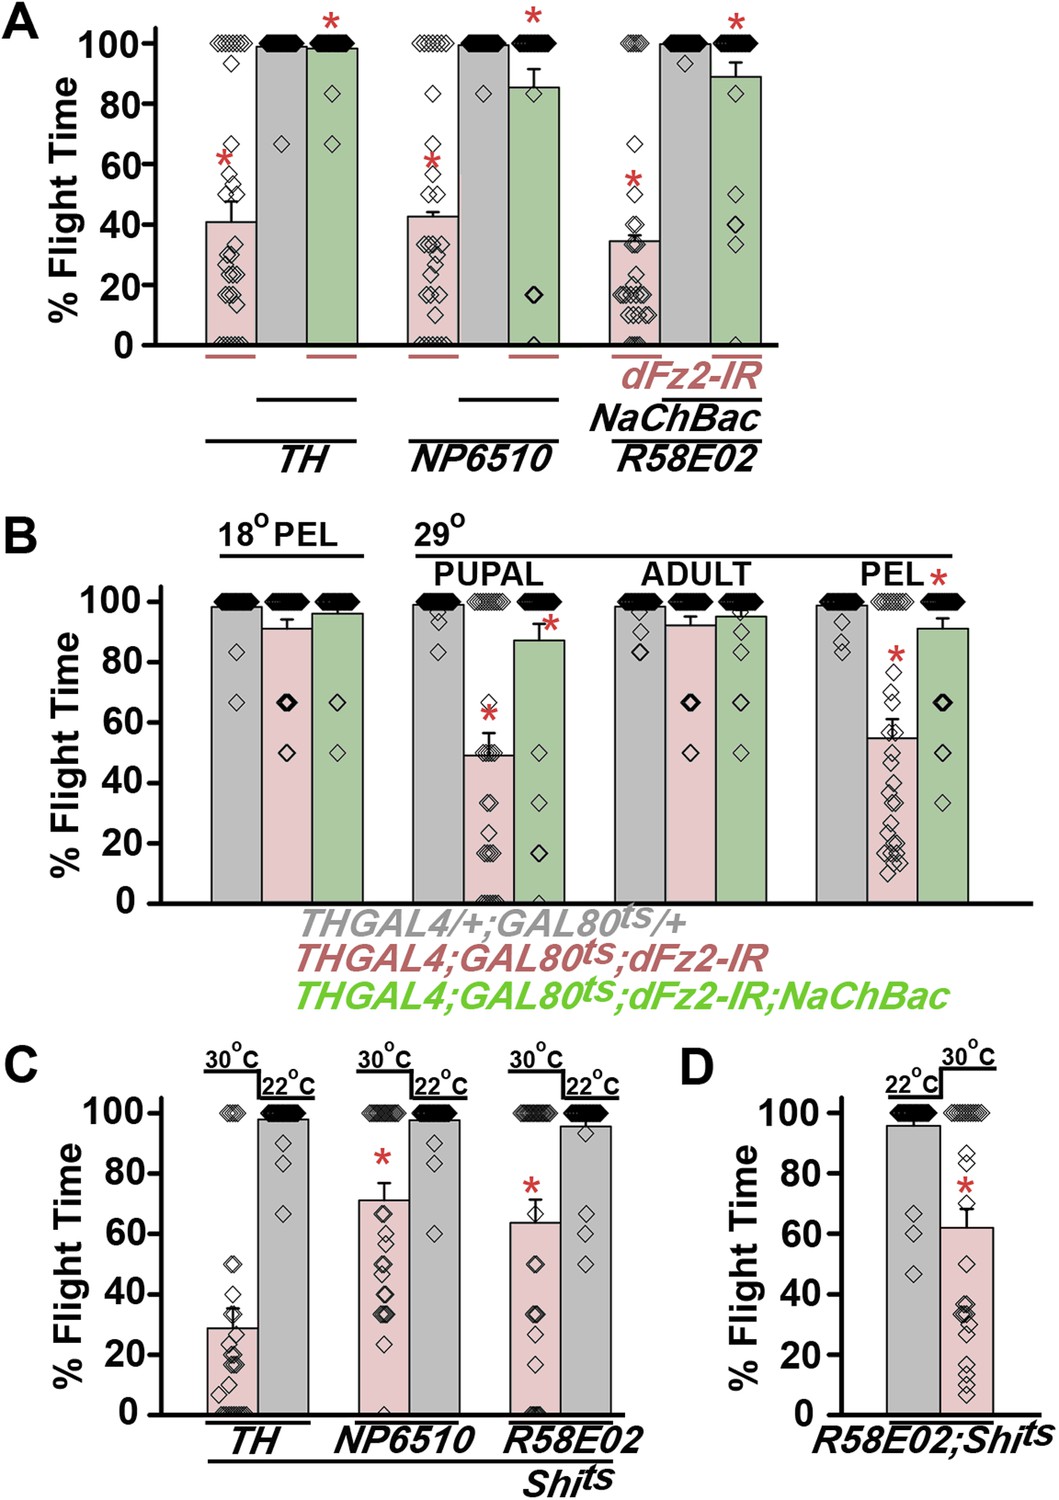
Knockdown of dFz2 affects neuronal activity of maturing flight circuit PAM neurons.
(A) Percentage flight times of individual heterozygous controls (gray bars), dFz2 knockdown (dFz2-IR) in dopaminergic neurons (THGAL4) and PAM neurons (NP6510GAL4, R58E02GAL4) (red bars) followed by over-expression of NaChBac in presence of dFz2-IR (green bars); (*p < 0.001, Mann–Whitney U-test). (B) Percentage flight times for heterozygotes of THGAL4;GAL80ts (gray bars) followed by stage-specific knockdown of dFz2 (red bars) and over-expression of NaChBac in flies with dFz2 knockdown (green bars) as indicated. Over-expression of NaChBac during pupal development rescued flight as did over-expression post-egg laying (PEL) (*p < 0.001, Mann–Whitney U-test). (C) Percentage flight times upon expression of Shibirets (Shits 30°C; red bars) either in pupal or no expression (Shits 22°C; gray bars). Expression was either in dopaminergic neurons (THGAL4) or PAM neurons (NP6510GAL4, R58E02GAL4). Flight was tested at 25°C. Expression of Shits in pupal resulted in reduced flight times. (D) Percentage flight times upon adult expression of Shibirets (Shits 30°C; red bars) or no expression (Shits 22°C; gray bars), in PAM neurons with R58E02GAL4. Flight was tested at 30°C. Expression of Shits resulted in reduced flight times (*p < 0.001, Mann–Whitney U-test).
Figure 5 with 3 supplements
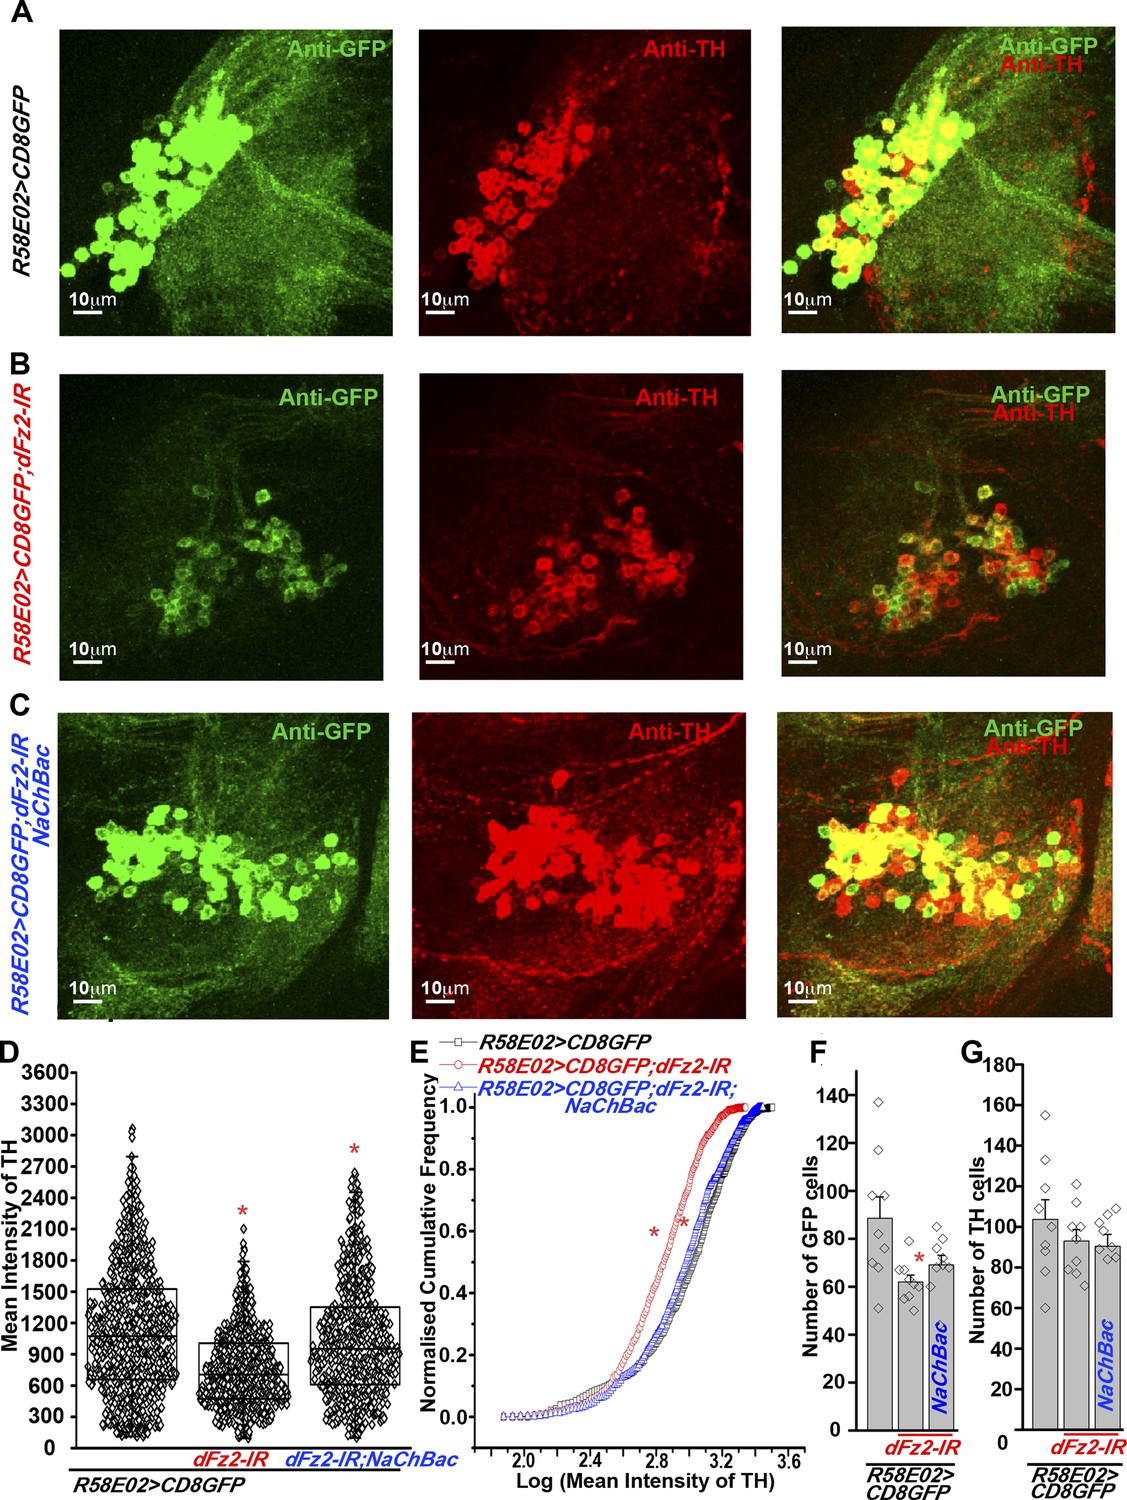
Expression of TH is reduced in PAM neurons by dFz2 knockdown.
(A) Expression of GFP (Anti GFP; green) and TH (Anti TH; red) is shown in PAM dopaminergic neurons marked by R58E02GAL4>mCD8GFP. (B) Significant reduction of GFP and TH immunoreactivity is observed in PAM neurons of R58E02GAL4>mCD8GFP; dFz2-IR individuals; which is (C) rescued by over-expression of NaChbac (R58E02GAL4> mCD8GFP; dFz2-IR;NaChBac). (D) Scatter plot with the mean intensity of TH expression in individual PAM neurons (N = 1280) in the indicated genotypes. Cells were obtained from 16 brain hemispheres; *p < 0.05, one-way ANOVA. (E) A Kolmogorov-Smirnov (K-S) plot analyzing the distribution of the mean intensity of TH immunoreactivity in PAM neurons. The frequency distribution is significantly shifted to the left for R58E02GAL4>mCD8GFP;dFz2-IR as compared to R58E02GAL4>mCD8GFP indicating a significantly higher percentage of cells with lower mean intensity. Frequency distribution of R58E02GAL4> mCD8GFP; dFz2-IR; NaChBac is shifted back towards the control distribution R58E02GAL4>mCD8GFP, indicating a significant rescue (*pK-S < 0.05). (F) Total number of GFP positive cells and (G) TH positive cells were counted in the indicated genotypes. No difference in the number of TH cells was found; however GFP cells were reduced upon dFz2 knockdown (*p < 0.05, one-way ANOVA).
Figure 5—figure supplement 1
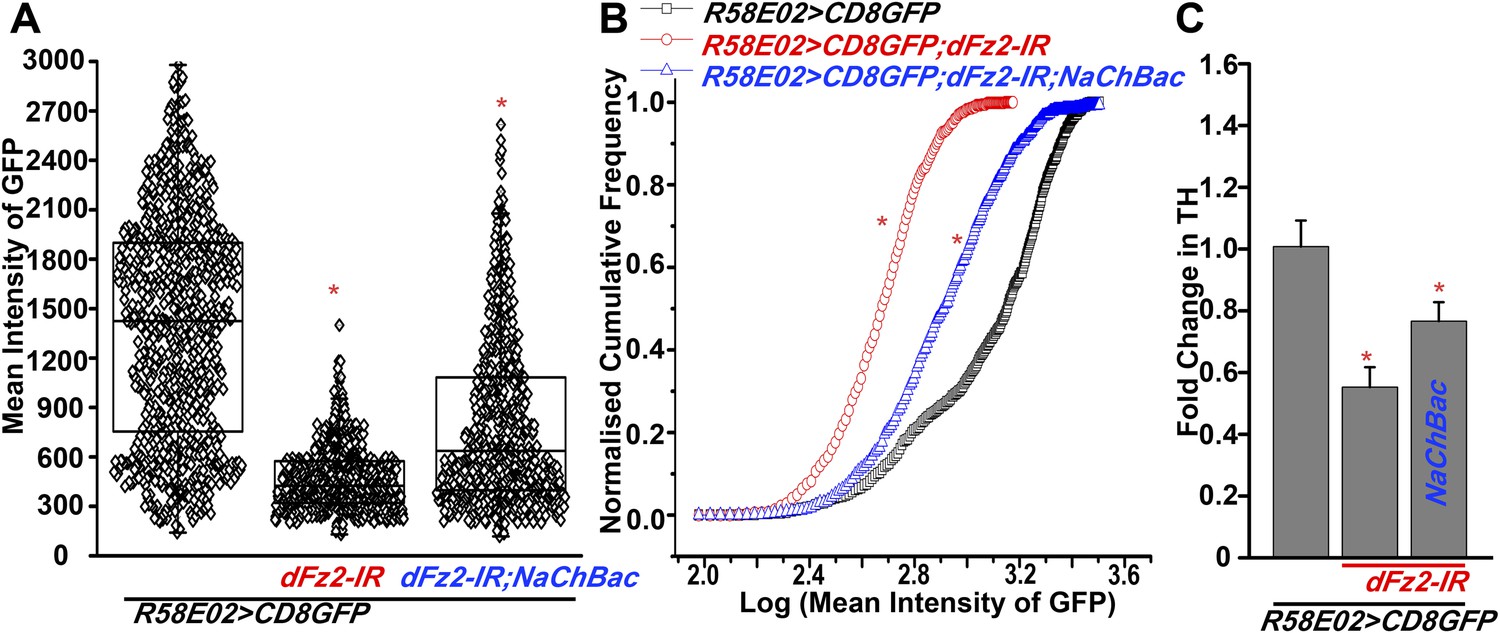
Expression of GFP is altered upon expression of dFz2-IR in PAM neurons using R58E02GAL4.
(A) Scatter plot of the mean intensity of GFP expression in individual PAM neurons (N = 1280) from 16 brain hemispheres of the indicated genotypes (*p < 0.05, one-way ANOVA). (B) Kolmogorov-Smirnov (K-S) plot analyzing the distribution of the cellular mean intensity shown in the scatter plot. The frequency distribution is shifted significantly to the left for R58E02GAL4>mCD8GFP;dFz2-IR as compared to R58E02GAL4>mCD8GFP indicating the presence of a higher percentage of cells with lower mean intensity. Frequency distribution of R58E02GAL4> mCD8GFP; dFz2-IR; NaChBac is shifted towards the right indicating rescue in the percentage of cells with higher mean intensity (*pK-S < 0.05). (C) Quantification of TH transcripts upon expression of RNAi for dFz2 with or without NaChBac in PAM neurons (R58E02GAL4). The Y-axis represents log2 fold changes calculated by the ΔΔCt method. Each value is the mean ± SEM of three independent experiments, obtained from three independent RNA samples. Gene expression of TH was rescued upon expression of NaChBac with dFz2-IR (*p < 0.05, one-way ANOVA).
Figure 5—figure supplement 2
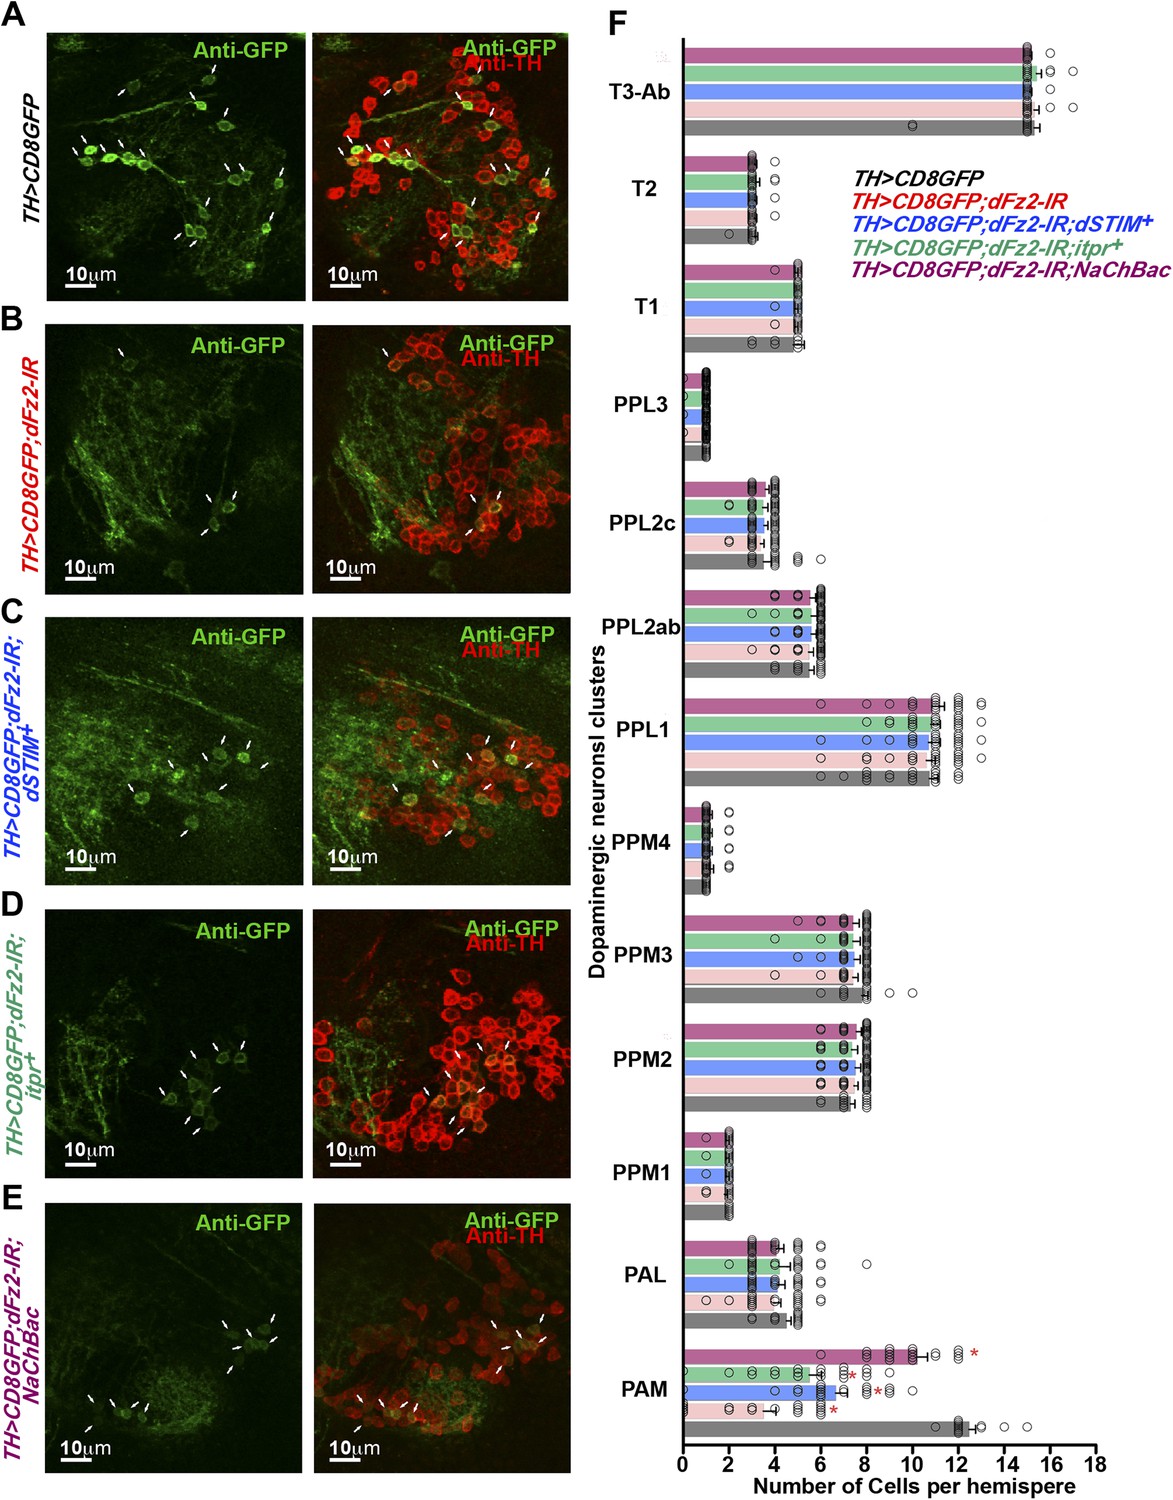
Altered GFP expression was seen upon expression of dFz2-IR in dopaminergic neurons.
(A) mGFP expression in the PAM dopaminergic neurons observed in brains of animals of the indicated genotypes. The number of PAM dopaminergic neurons was significantly reduced upon expression of (B) dFz2-IR (arrows). The number of GFP-positive cells was partially rescued by over-expression of either (C) dSTIM+ (arrows) or (D) itpr+ (arrows) or (E) NaChBac (arrows). (F) Quantification of cells in specified clusters of dopaminergic neurons, for the indicated genotypes, is shown. Clusters that were examined: PAM, protocerebral anterior medial; PAL, protocerebral anterior lateral; PPM1, PPM2, PPM3, protocerebral posterior medial; PPL1, PPL2, protocerebral posterior lateral and T1, T2, T3-Ab, thoracic ganglion. The bars represent mean number of cells and circles represent number of cells from ∼15 individual brain hemispheres. Cell number appeared reduced in the PAM cluster upon expression of dFz2-IR (PAM; red bar); this was partially rescued by over-expression of either dSTIM+ or itpr+ or NaChBac (PAM; blue, green, magenta bars) (*p < 0.05, one-way ANOVA).
Figure 5—figure supplement 3
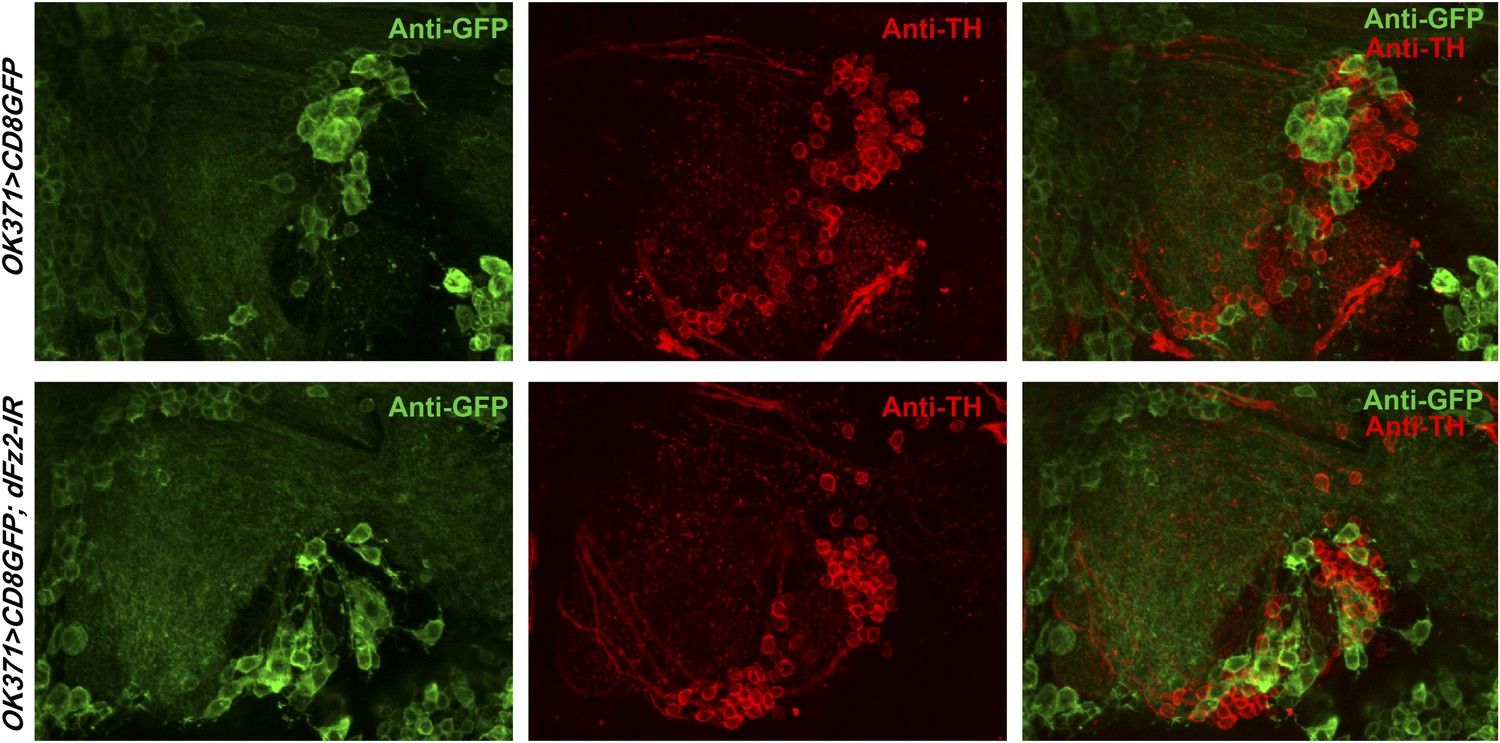
Knockdown of dFz2 in OK371GAL4-expressing neurons does not affect TH expression-positive PAM neurons.
Expression of GFP (Anti GFP; green) and TH (Anti TH; red) is shown in PAM neurons of the indicated genotypes. No change in the intensity of either GFP or TH immunostaining was observed upon knockdown of dFz2.
Figure 6 with 1 supplement
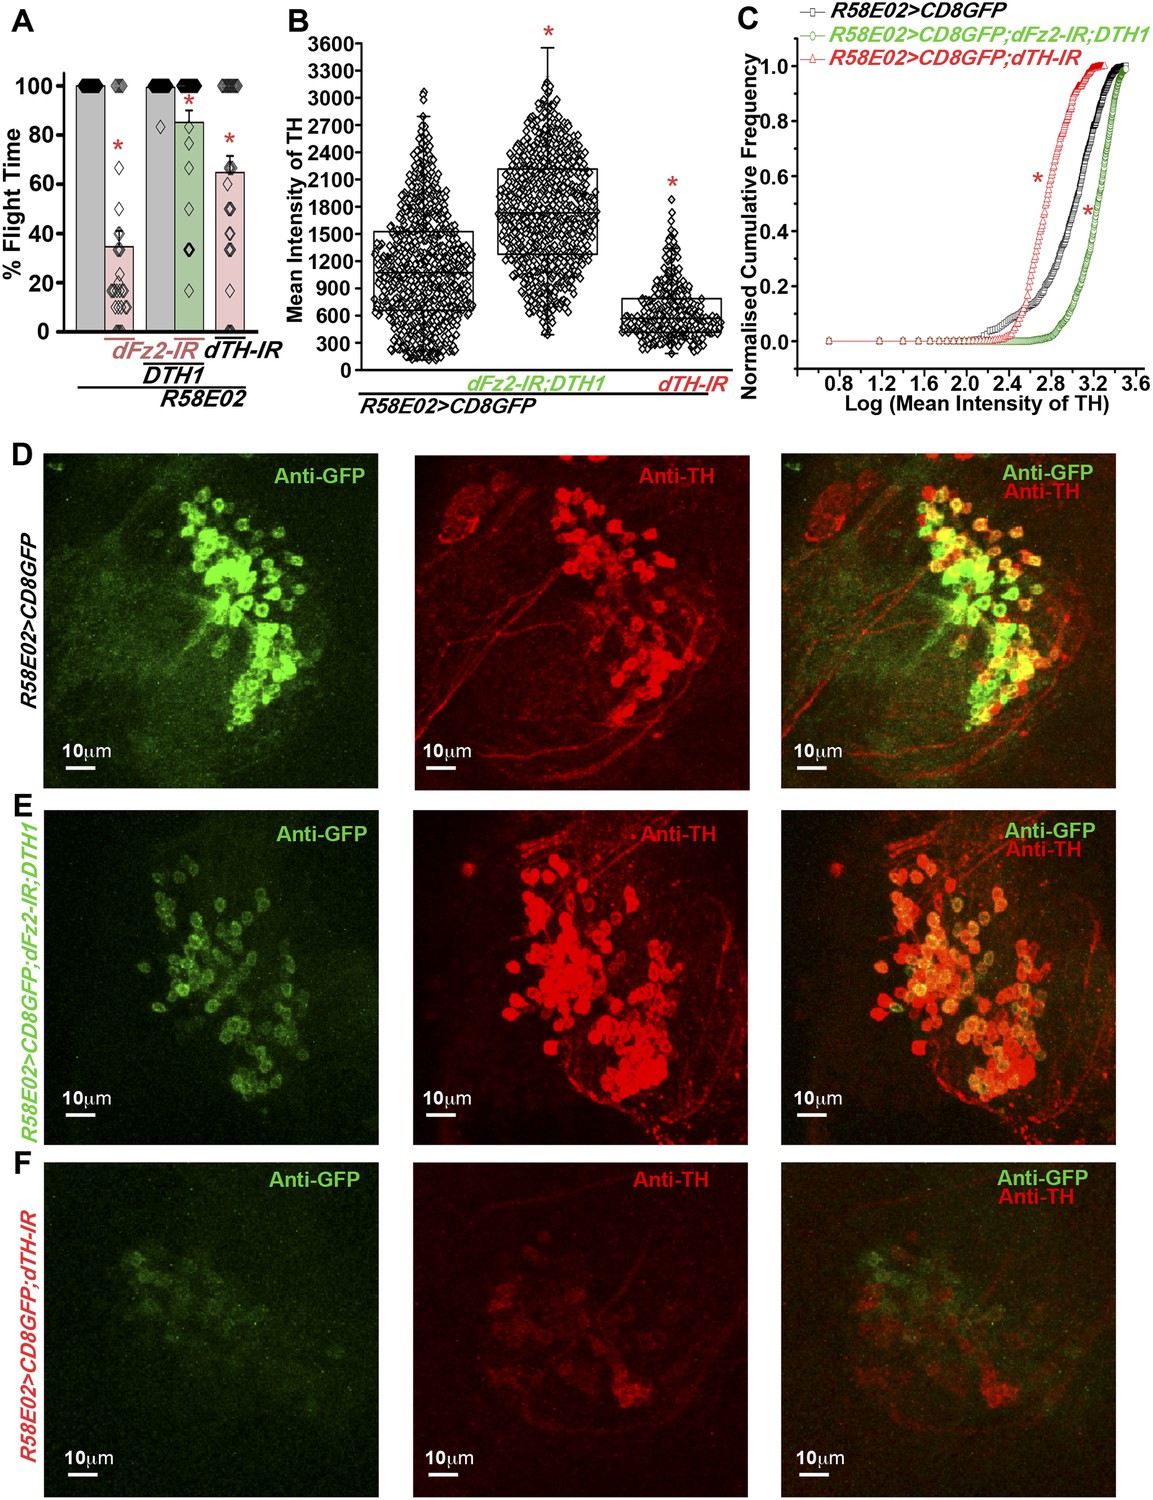
Expression of DTH1 in PAM neurons rescues flight defects shown by dFz2 knockdown.
(A) Percentage flight times of individual heterozygous control flies (gray bars), flies with expression of dFz2-IR and THRNAi (dTH-IR) in PAM neurons (R58E02GAL4) (red bars), and flies with over-expression of DTH1 in the presence of dFz2-IR (green bars). Expression of DTH1 rescued the flight defect of dFz2 knockdown flies to a significant extent (*p < 0.001, Mann–Whitney U-test). (B) Scatter plot of the mean intensity of TH expression in individual PAM neurons (N = 1280) from 16 brain hemispheres of the indicated genotypes (*p < 0.05, one-way ANOVA). (C) Kolmogorov–Smirnov (K-S) plot analyzing the distribution of the cellular mean intensity shown in B. The frequency distribution is significantly shifted to the left for R58E02GAL4> mCD8GFP;dTH-IR as compared to R58E02GAL4>mCD8GFP indicating a higher number of cells with lower mean intensity of TH. Frequency distribution of R58E02GAL4> mCD8GFP; dFz2-IR;DTH1 is shifted back to the right indicating fewer cells with lower mean intensity (*pK-S < 0.05). (D) Expression of GFP (Anti GFP; green) and TH (Anti TH; red) is shown in PAM dopaminergic neurons in R58E02GAL4>mCD8GFP, (E) R58E02GAL4>mCD8GFP; dFz2-IR; DTH1 and (F) R58E02GAL4> mCD8GFP;dTH-IR.
Figure 6—figure supplement 1
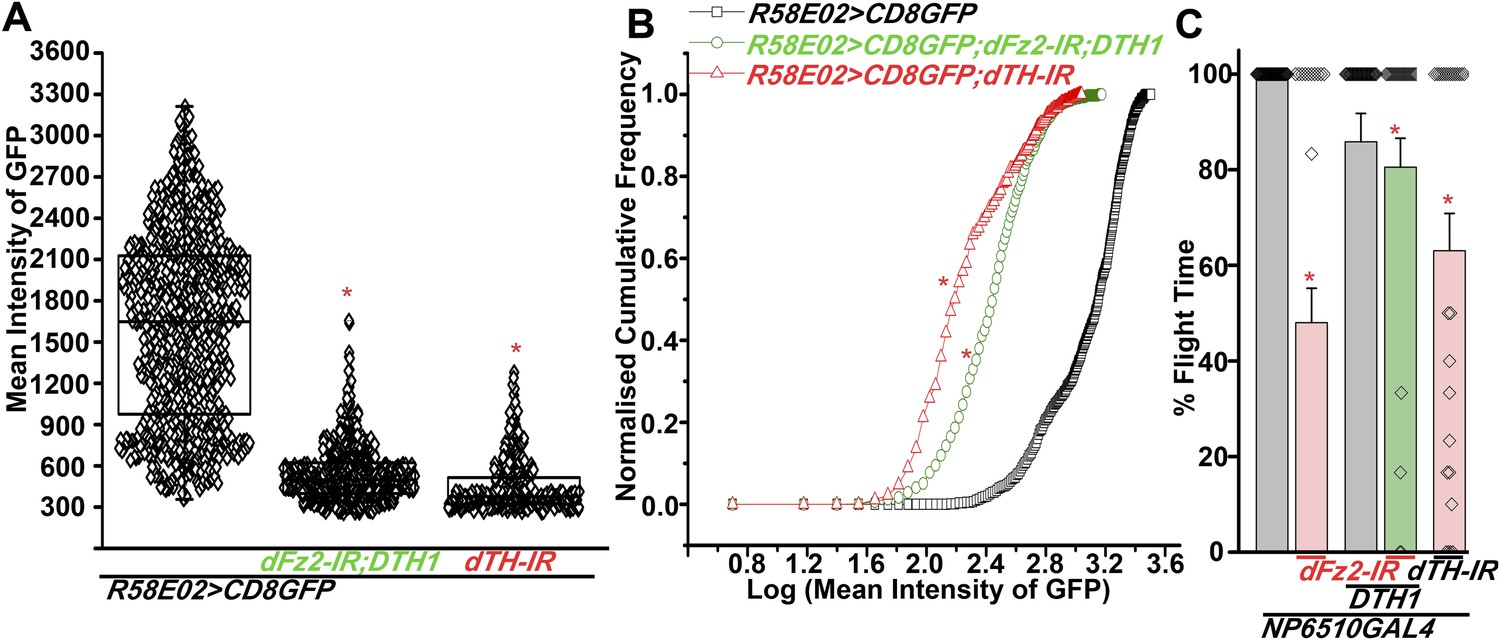
Expression of GFP is altered in PAM neurons upon knockdown of dFz2 in the presence of either DTH1 or dsDTH.
(A) Scatter plot of the mean intensity of GFP expression in individual PAM neurons (N = 1280) from 16 brain hemispheres of the indicated genotypes (*p < 0.05, one-way ANOVA). (B) Kolmogorov-Smirnov (K-S) plot analyzing the distribution of the cellular mean intensity shown in the scatter plot. The frequency distribution is significantly shifted to the left for R58E02GAL4>mCD8GFP; dFz2-IR; DTH1 and R58E02GAL4>mCD8GFP; dTH-IR individual cells as compared to R58E02GAL4>mCD8GFP expressing neurons indicating a higher percentage of cells with lower mean intensity (*pK-S < 0.05). (C) Percentage flight times of individual flies of the indicated genotypes. Expression of DTH1 rescued the flight defect of dFz2-IR expressing individuals to a significant extent (*p < 0. 001, Mann–Whitney U-test).
Figure 7 with 5 supplements
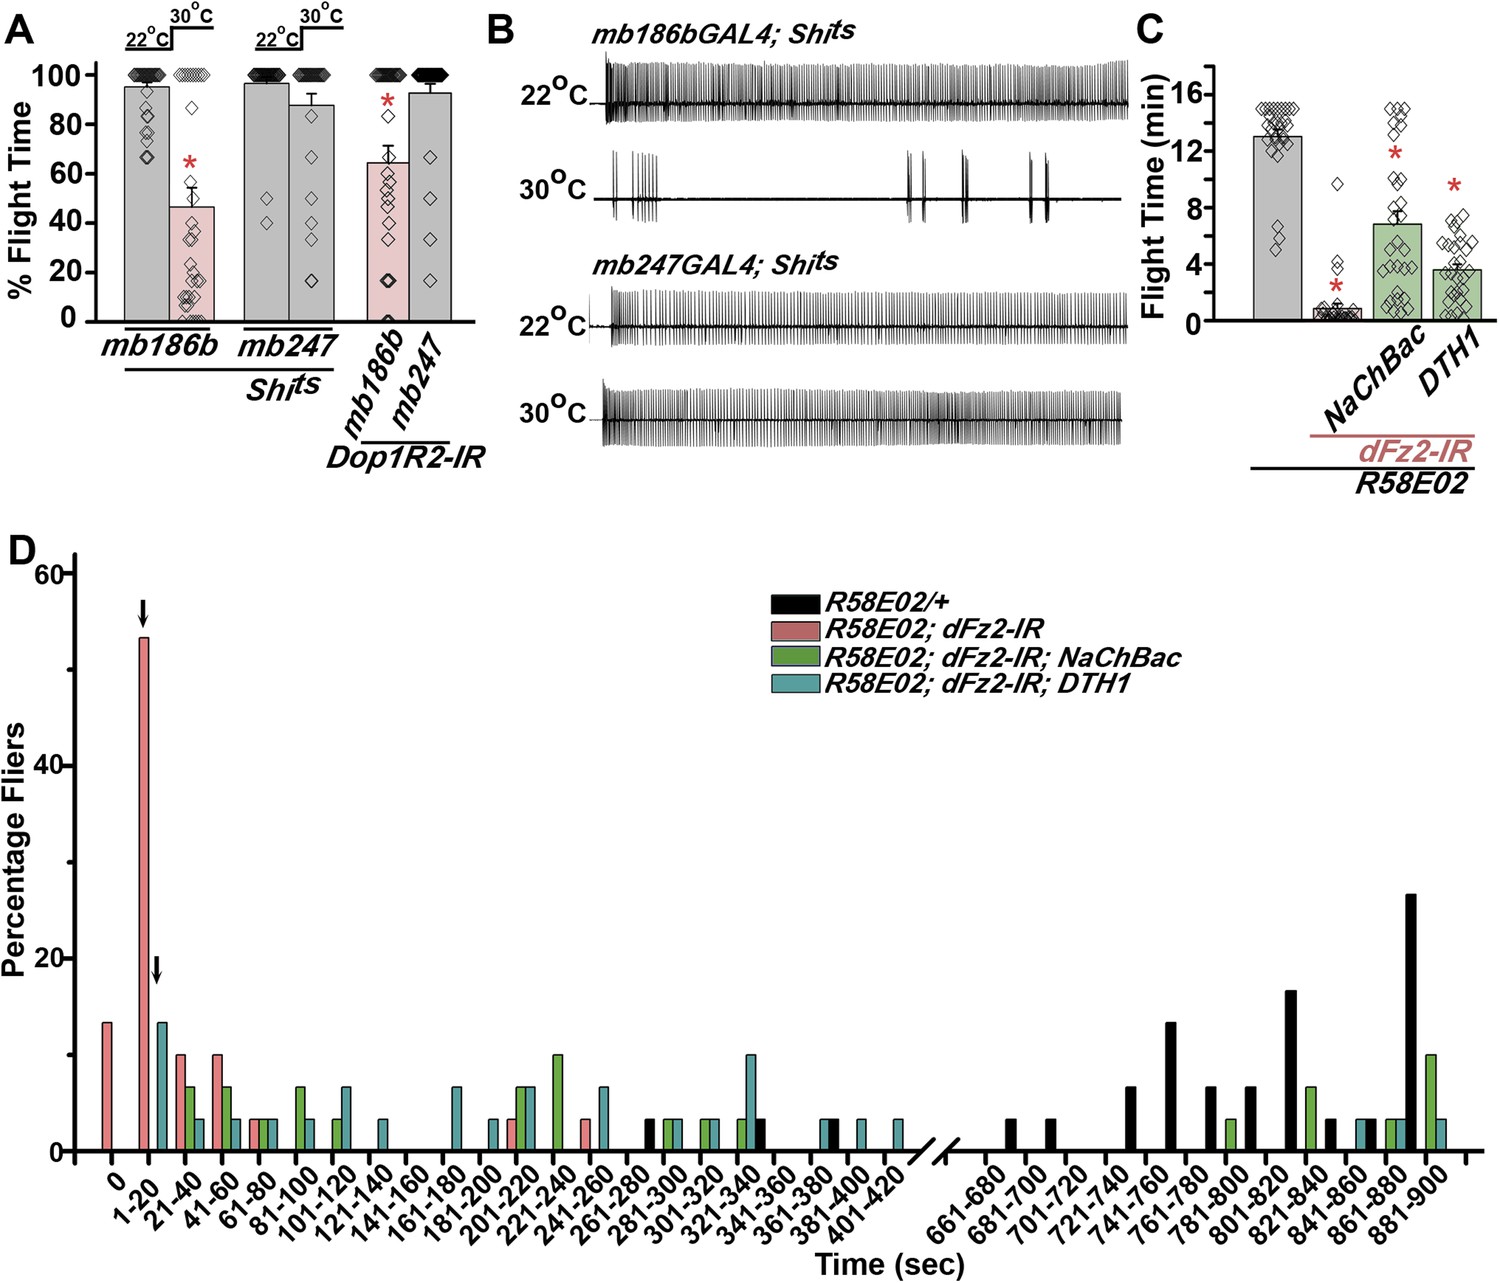
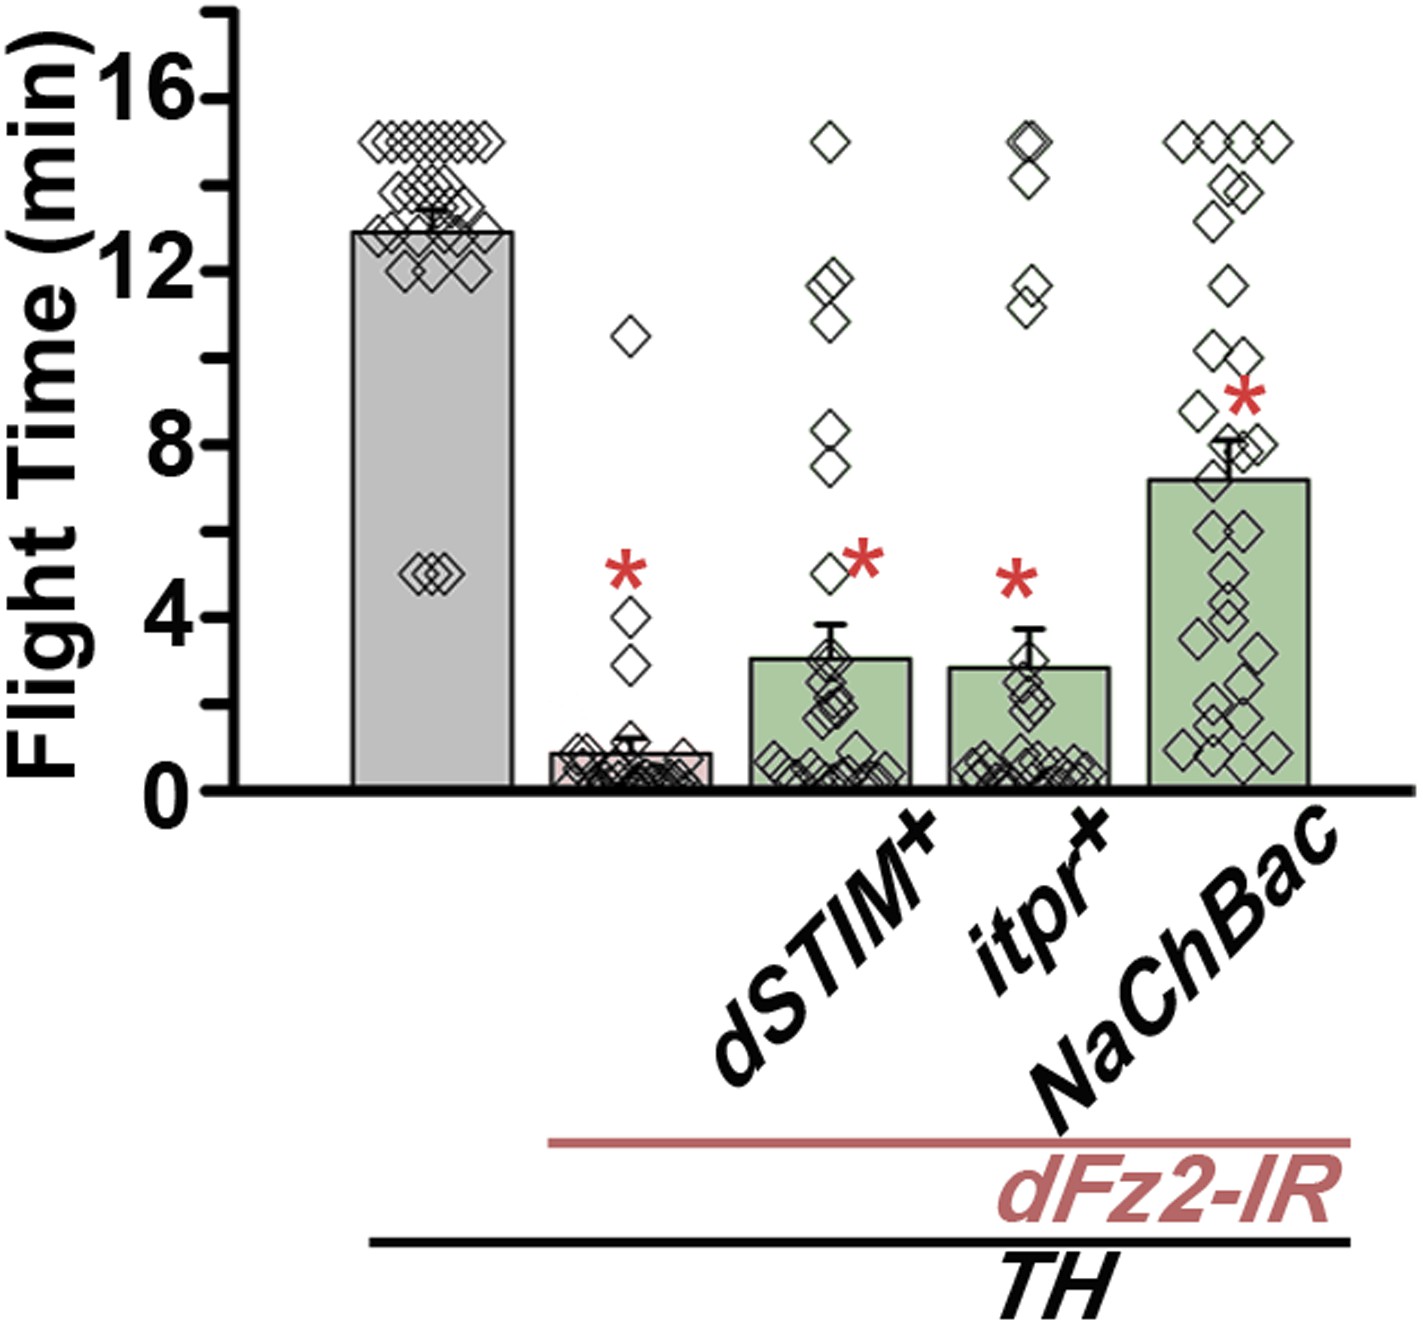
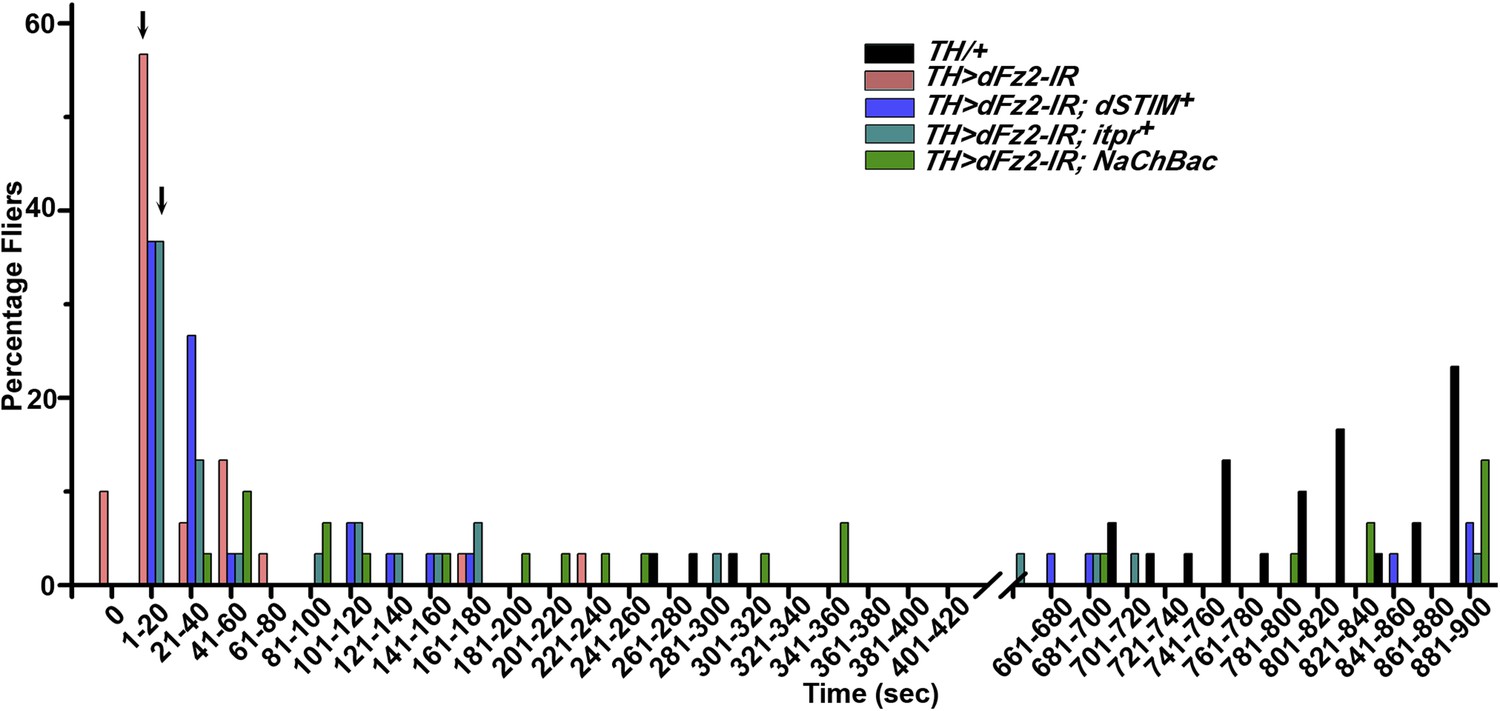
Mushroom body α’/β’ neurons regulate flight through Dop1R2.
(A) Percentage flight times of individual flies of the indicated genotypes. Flight defects were seen by reducing the activity of α’/β’ neurons (mb186bGAL4, red bar) and by knockdown of Dop1R2 in mushroom body α’/β’ neurons (*p < 0. 01, Mann–Whitney U-test). (B) Electrophysiological responses from the DLMs showed similar responses as observed during flight. (C) Flight times during longer flight tests monitored over 15 min are shown. Over-expression of NaChBac rescued flight time partially when compared to knockdown to dFz2 (*p < 0.001, Mann–Whitney U-test). (D) Percentage of flies that either do not initiate flight (0 s) or fly for time-periods within the binned intervals (20 s each) is shown for the indicated genotypes.
Figure 7—figure supplement 1
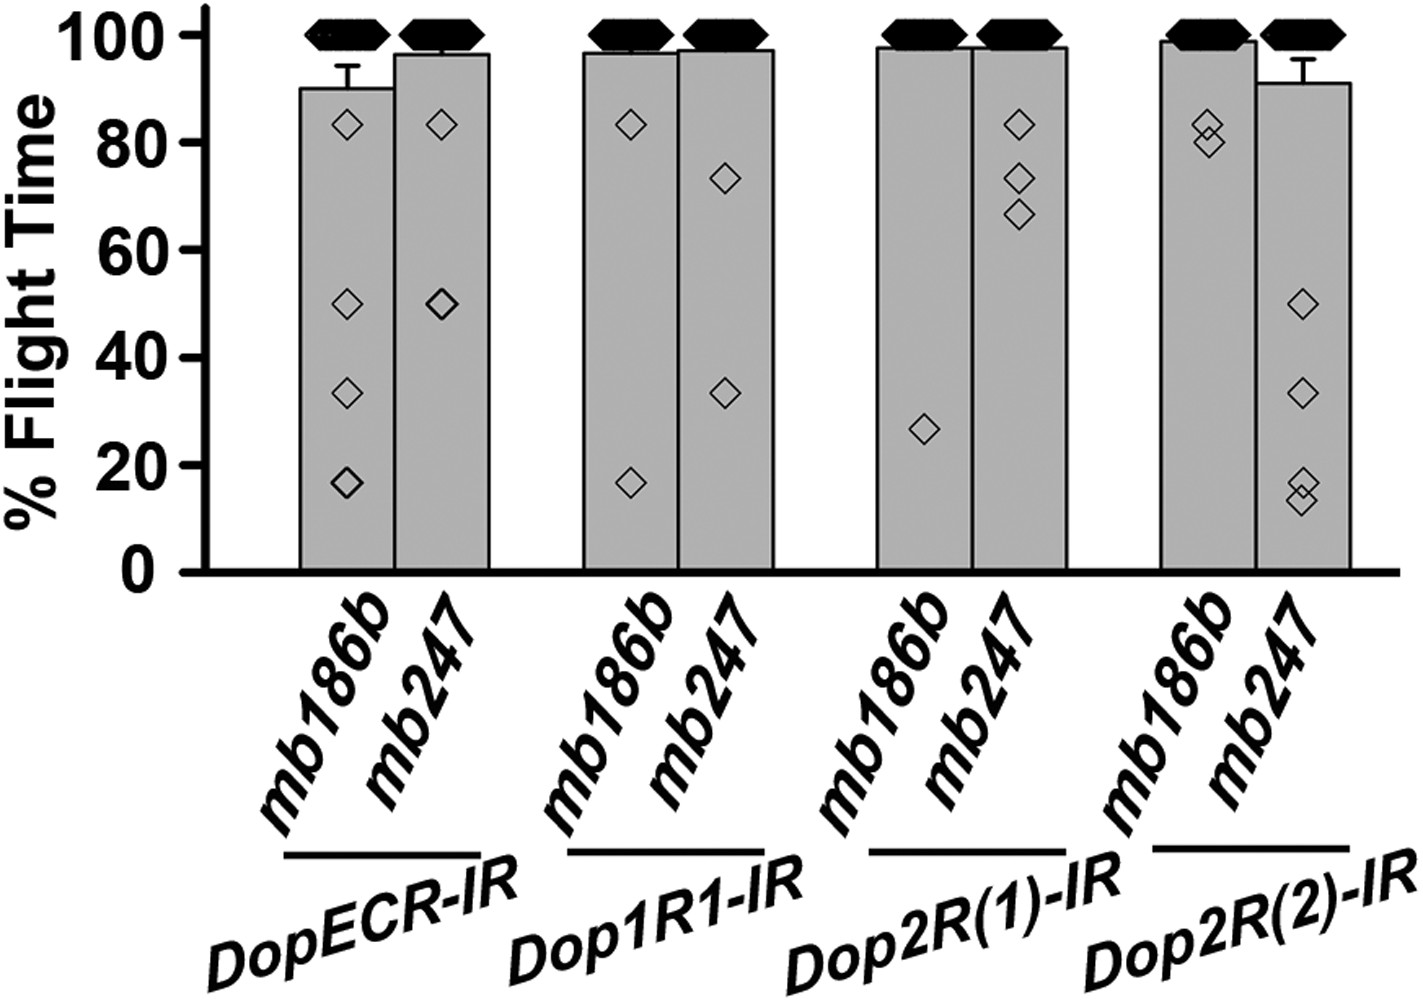
Dopamine receptor knockdown in MB neurons.
Percentage flight times of individuals upon knockdown of the indicated Dopamine receptors. The knockdowns were either in α’/β’ neurons (mb186bGAL4) or in α/β and γ neurons (mb247GAL4) of the mushroom body.
Figure 7—figure supplement 2
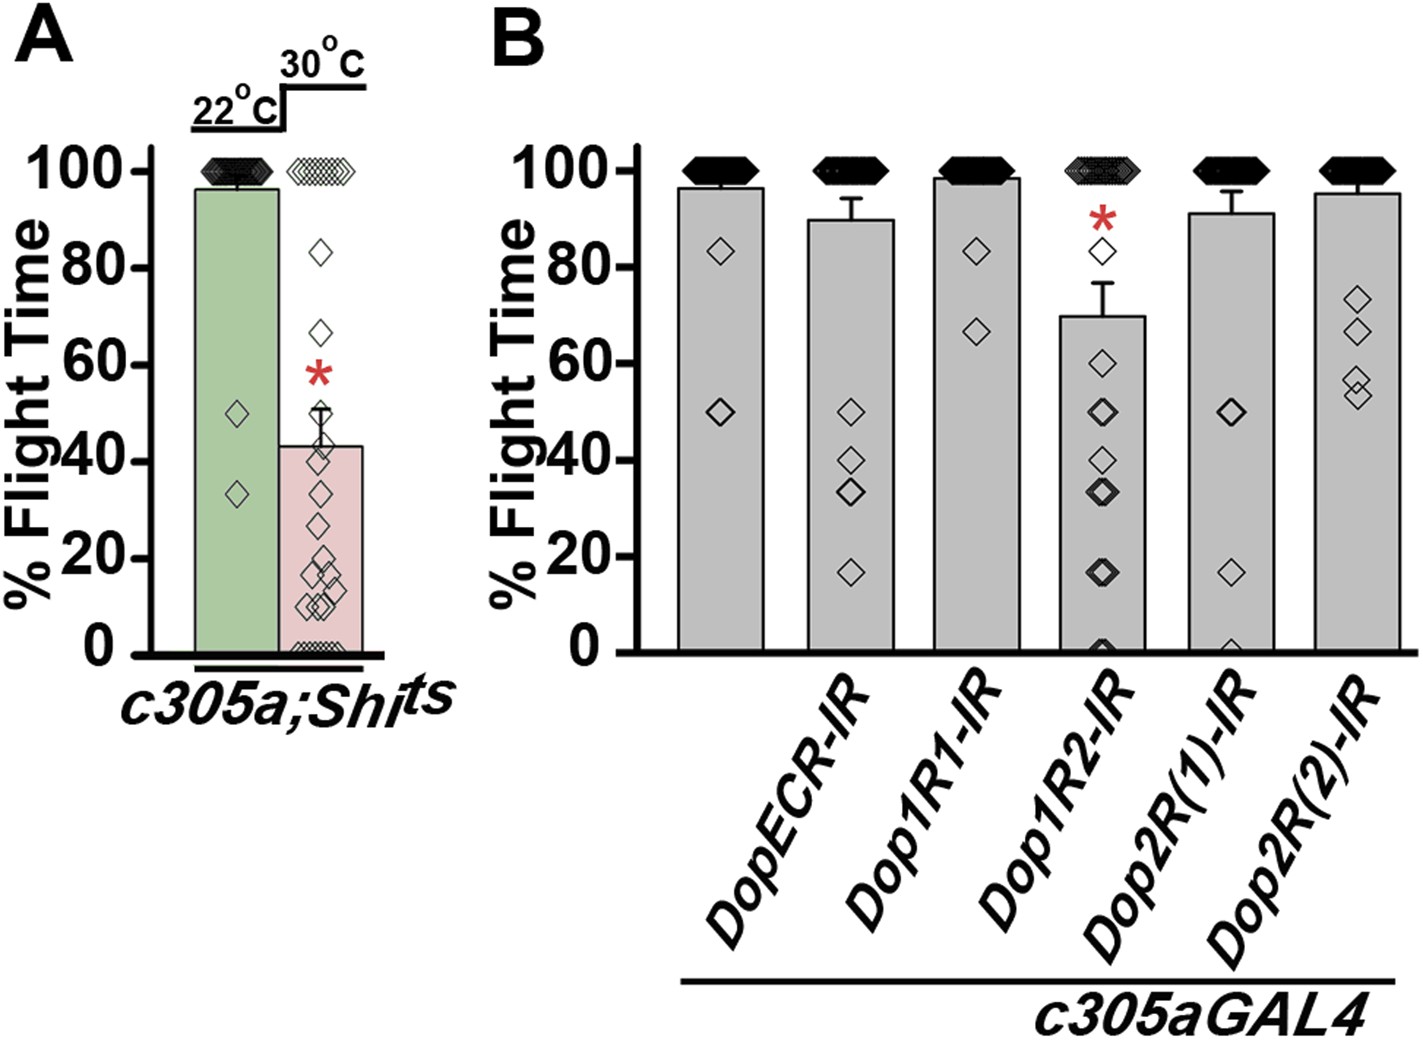
Synaptic activity in α’/β’ lobes required for flight.
(A) Percentage flight times of individual flies of the indicated genotypes. Flight defects were seen by reducing the activity (30°C) of α’/β’ neurons using c305aGAL4 (*p < 0. 01, Mann–Whitney U-test). (B) Percentage flight times of flies upon knockdown of Dopamine receptors. Knockdown of Dop1R2 using c305aGAL4 resulted in significant flight deficits (*p < 0. 01, Mann–Whitney U-test).
Figure 7—figure supplement 3
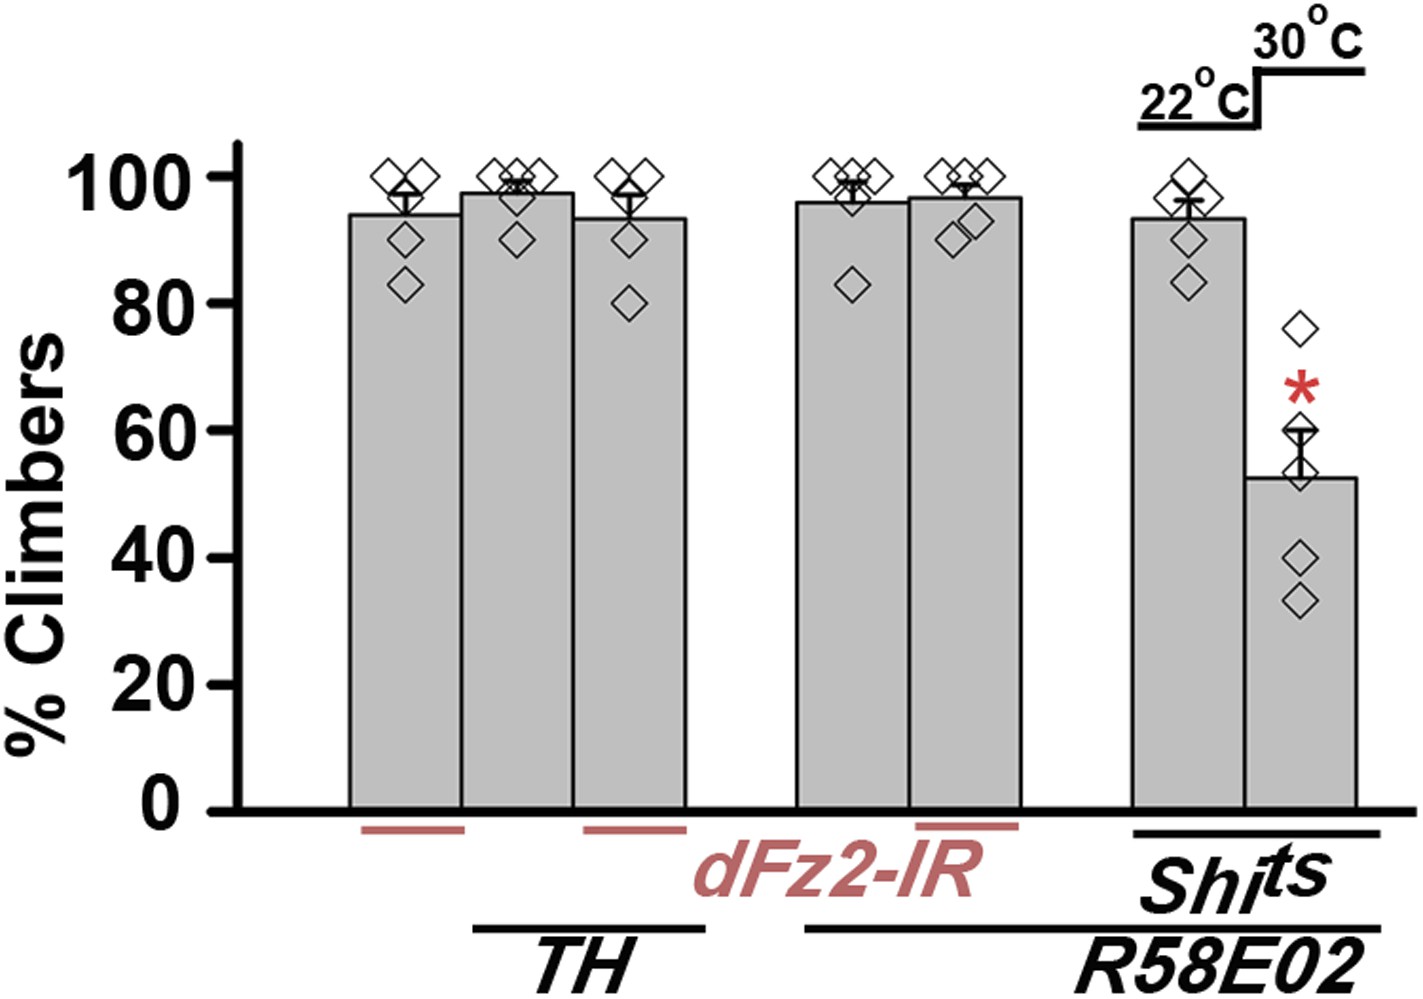
Knockdown of dFz2 does not affect climbing ability of flies.
Percentage climbers are shown for knockdown of dFz2 either in multiple dopaminergic neurons (THGAL4) or in the PAM dopaminergic cluster (R58E02GAL4). Blocking synaptic vesicle recycling by expression of UAS-Shits in PAM neurons (R58E02GAL4) in adults, by keeping the flies at 30°C for 15 min and immediately testing for climbing at 30°C, affected climbing times significantly (*p < 0.001, Mann–Whitney U-test).
Figure 7—figure supplement 4
Maintenance of flight requires dFz2/Ca2+ signaling in dopaminergic neurons.
Long flight times monitored for 15 min are shown for the indicated genotypes.
Figure 7—figure supplement 5
Maintenance of flight requires Fz2/Ca2+ signaling in dopaminergic neurons.
Percentage of flies that do not initiate (0 s) or fly for time periods within the binned intervals (20 s each) is shown for the indicated genotypes.
Videos
Video 1
dFz2 knockdown in dopaminergic neurons result in flight defect.
Real time video recording of air-puff induced flight in the following genotypes from left to right. (1) THGAL4/+, (2) THGAL4;dFz2-IR, (3) dFz2-IR/+. Following a gentle air-puff THGAL4;dFz2-IR flies were able to initiate but not maintain flight for as long as control flies of the genotypes THGAL4/+ and dFz2-IR/+.
Video 2
dFz2 knockdown in PAM neurons result in flight defect.
Real time video recording of air-puff induced flight in the following genotypes from left to right. (1) R58E02GAL4/+, (2) R58E02GAL4;dFz2-IR, (3) dFz2-IR/+. Following a gentle air-puff R58E02GAL4;dFz2-IR flies were able to initiate but not maintain flight for as long as control flies of the genotypes THGAL4/+ and dFz2-IR/+.
Video 3
Overexpression of IP3R in dopaminergic neurons rescues flight defects of dFz2 downregulation.
Real time video recording of air-puff induced flight in the following genotypes from left to right. (1) THGAL4;dFz2-IR;itpr+, (2) THGAL4;dFz2-IR, (3) dFz2-IR/+. Following a gentle air-puff THGAL4; dFz2-IR; itpr+ flies were able to initiate and maintain flight for a longer duration as compared to THGAL4;dFz2-IR.
Video 4
Flight defects in dFz2 knockdown individuals can be rescued by over-expression of dSTIM.
Real time video recording of air-puff induced flight in the following genotypes from left to right. 1) THGAL4; dFz2-IR; dSTIM+, 2) THGAL4; dFz2-IR, 3) dFz2-IR/+. Following a gentle air-puff THGAL4; dFz2-IR; dSTIM+ flies were able to initiate and maintain flight for a longer duration as compared to THGAL4; dFz2-IR.
Video 5
Increased neuronal activity in PAM neurons rescues flight in individuals with dFz2 knockdown.
Real time video recording of air-puff induced flight in the following genotypes from left to right. (1) R58E02GAL4;dFz2-IR;NaChBac, (2) R58E02GAL4;dFz2-IR, (3) dFz2-IR/+. Following a gentle air-puff R58E02GAL4; dFz2-IR;NaChBac flies were able to initiate and maintain flight for a longer duration as compared to R58E02GAL4;dFz2-IR.
Video 6
DTH over-expression in PAM neurons rescues flight in individuals with dFz2 knockdown.
Real time video recording of air-puff induced flight in the following genotypes from left to right. (1) R58E02GAL4;dFz2-IR;DTH1, (2) R58E02GAL4;dFz2-IR, (3) dFz2-IR/+. Following a gentle air-puff R58E02GAL4; dFz2-IR;DTH1, flies were able to initiate and maintain flight for a longer duration as compared to R58E02GAL4;dFz2-IR.
Tables
Table 1
Summary of expression pattern of GAL4s
| THC’ | THC1 | THF2 | NP6510 | R58E02 | |
|---|---|---|---|---|---|
| PAM | + | ++ | − | ++ | +++ |
| PAL | + | + | − | − | − |
| PPM1 | + | ++ | − | − | − |
| PPM2 | + | + | + | − | − |
| PPM3 | − | − | + | − | − |
| PPL1 | − | + | ++ | − | − |
| PPL2 | + | + | + | − | − |
| T1 | + | + | − | − | − |
| T2 | − | + | + | − | − |
| T3 | − | + | − | − | − |
| Ab | + | + | + | − | − |
-
Table summarizing the expression pattern of THC’GAL4, THC1GAL4, THF2GAL4, NP6510GAL4, and R58E02GAL4 in specified dopaminergic neuronal clusters. Clusters shown in Figure 2A and thoracic ganglion (T1, T2, T3, Ab) were examined for the expression. Plus (+) and minus (−) indicate the presence and absence of dopaminergic positive neurons, respectively. Double plus (++) and triple plus (+++) indicate the presence of >5 and >50 dopaminergic positive neurons, respectively. 10 brain hemispheres were analyzed for the expression.
Download links
A two-part list of links to download the article, or parts of the article, in various formats.
Downloads (link to download the article as PDF)
Open citations (links to open the citations from this article in various online reference manager services)
Cite this article (links to download the citations from this article in formats compatible with various reference manager tools)
Maturation of a central brain flight circuit in Drosophila requires Fz2/Ca2+ signaling
eLife 4:e07046.
https://doi.org/10.7554/eLife.07046


