ATM regulation of IL-8 links oxidative stress to cancer cell migration and invasion
- University of Texas at Austin, United States
- Institute for Research in Biomedicine, Spain
Figures
Figure 1 with 1 supplement
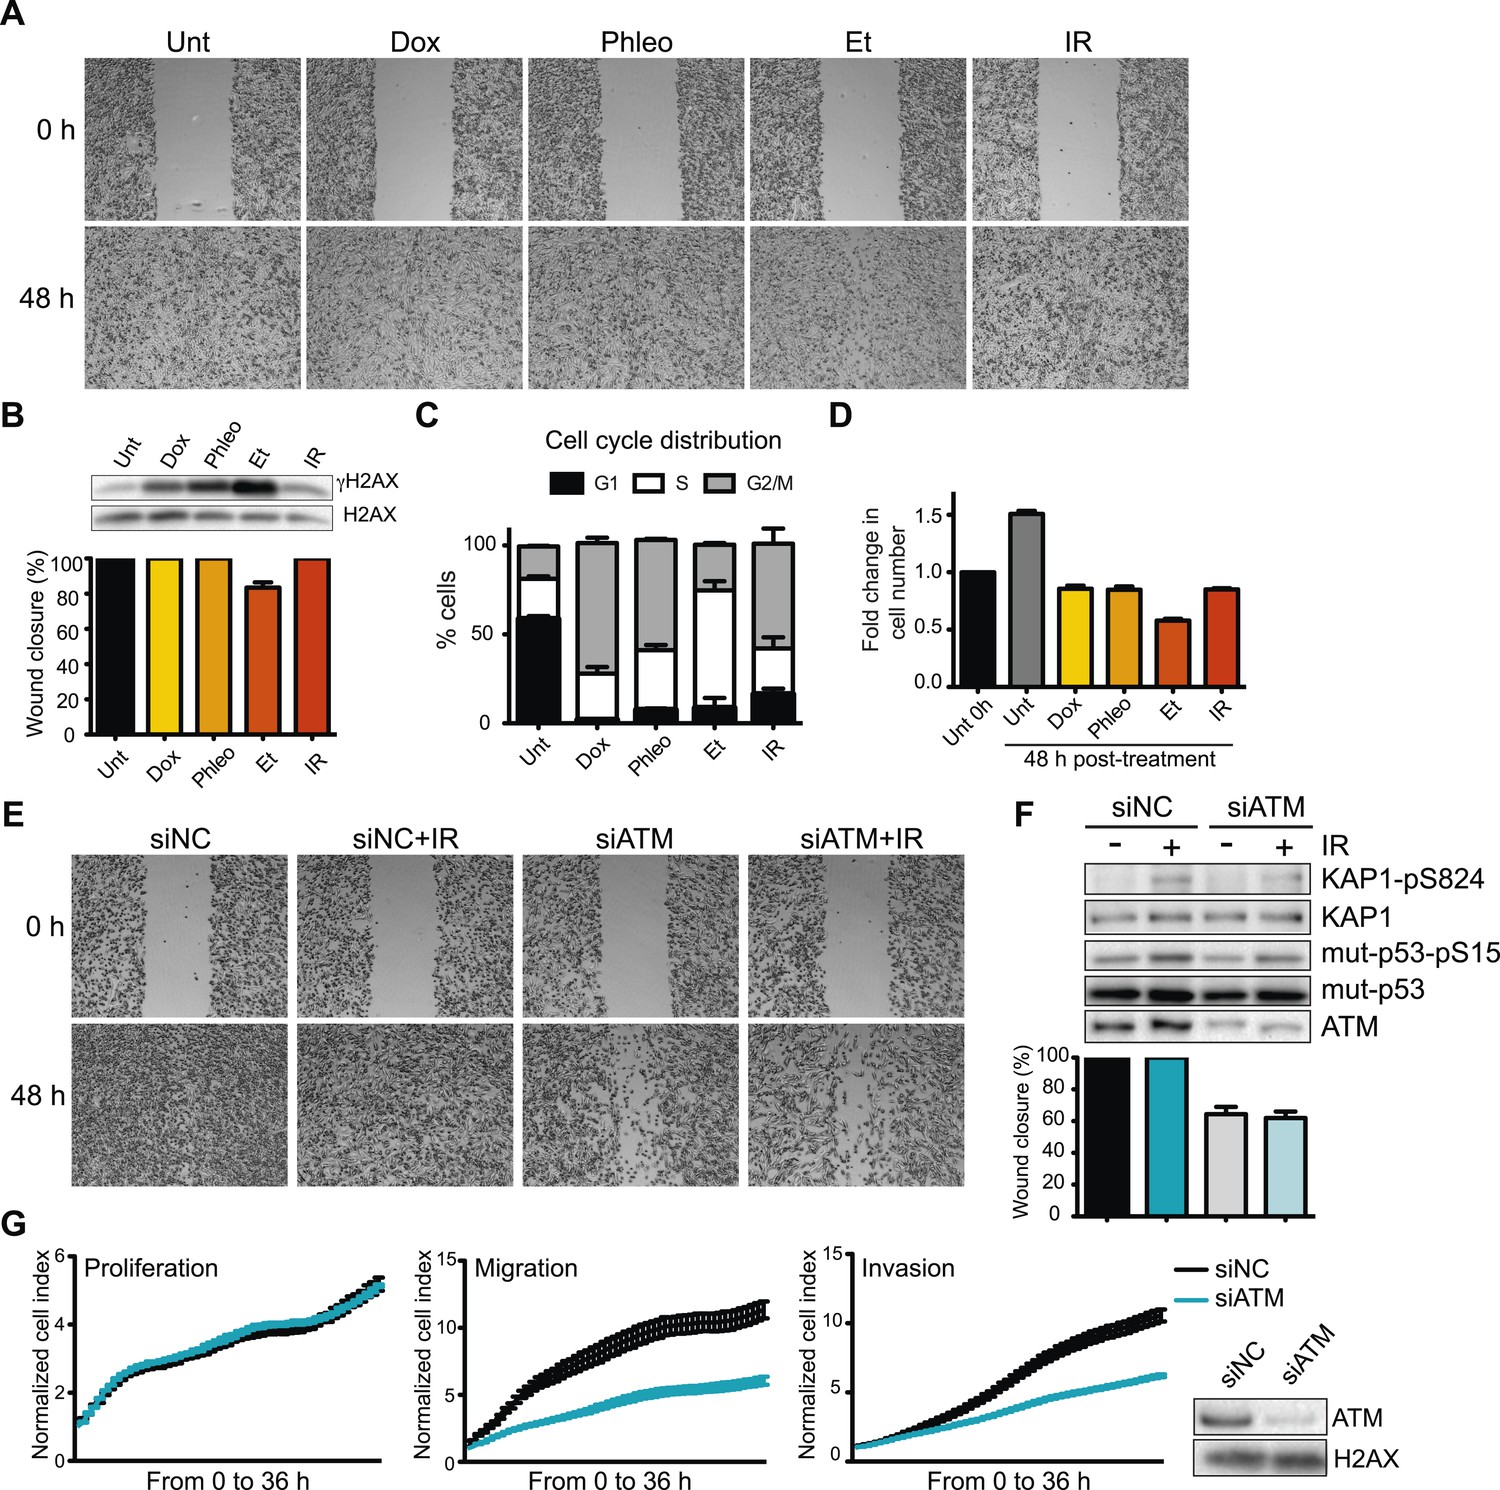
Ataxia-telangiectasia mutated (ATM) is required for cell migration and invasion in MDA-MB-231 cells.
(A) Wound-healing assays of MDA-MB-231 cells untreated (Unt) or treated with doxorubicin (Dox, 100 nM), phleomycin (Phleo, 90 μg/ml), etoposide (Et, 40 μM) or ionizing radiation (IR, 20 Gy). Drug treatments were for 48 hr. IR treatment was performed at time 0. All samples were analyzed post-48 hr from wound induction. Images were acquired at 0 and 48 hr. Representative images from three independent experiments are shown. (B) Verification of DNA damage induction and quantification of wound healing from (A). Top: Western blot analysis of samples from (A) with the DNA damage marker γH2AX. H2AX is a loading control. Bottom: Quantification of wound healing experiments from (A). (C) Cell cycle analysis of cells treated in panel A by flow cytometry. Cells were treated as in (A) and analyzed by FACS 48 hr post-treatment. (D) Proliferation of cells treated as in (A). After 48 hr, cells were trypsinized, counted and normalized to untreated cells at 0 hr. (E) ATM promotes cell migration in the absence of induced double-strand breaks (DSBs). Wound-healing assays were performed in siRNA-treated MDA-MB-231 human breast cancercells with siNon-coding (siNC) or siATM siRNAs. (F) Verification of DNA damage induction and quantification of wound healing from (E). Top: Western blot analysis of samples from (E) with the ATM markers KAP1-pS824 and mut-p53-pS15. Unmodified proteins are loading controls and ATM controls siRNA depletion. Bottom: Quantification of wound healing experiments from (E). (G) ATM depletion impairs cell migration and invasion, but not proliferation. Left panel: siNC or siATM cells were analyzed with xCELLigence Real-time cell analyzer (RTCA) to measure proliferation, migration and invasion in parallel and real-time. Experiments performed as detailed in ‘Materials and methods’. Right panel: ATM depletion 96 hr post-transfection. (mean ± s.e.m., n = 3).
Figure 1—figure supplement 1
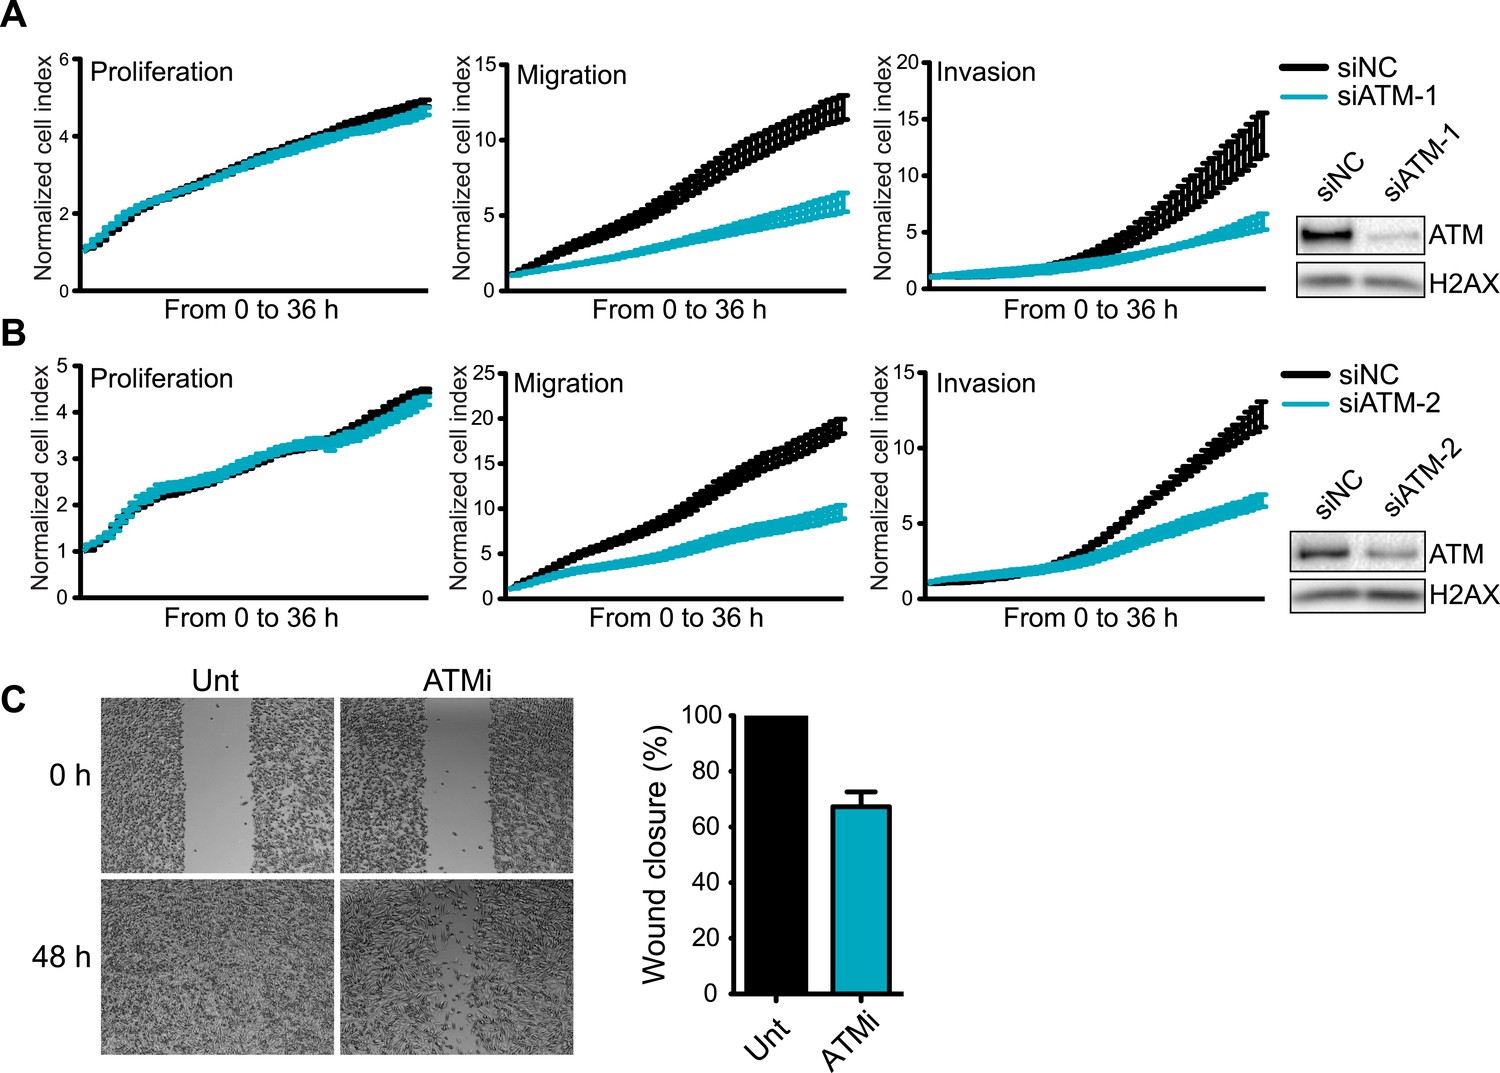
Knockdown of ATM impairs cell migration and invasion.
(A and B) ATM depletion by two independent siRNAs reduces migration and invasion in MDA-MB-231 cells. Proliferation, migration and invasion of cells in siATM-1 (A) and siATM-2 (B) compared to siNC control cells were analyzed as in Figure 1G. Western blot of ATM depletion for each individual siRNA are shown. H2AX is loading control. (C) Treatment with ATM kinase inhibitor reduces cell migration compared to untreated cells. Cells were analyzed as in Figure 1E. ATMi—KU-55933.
Figure 2 with 1 supplement
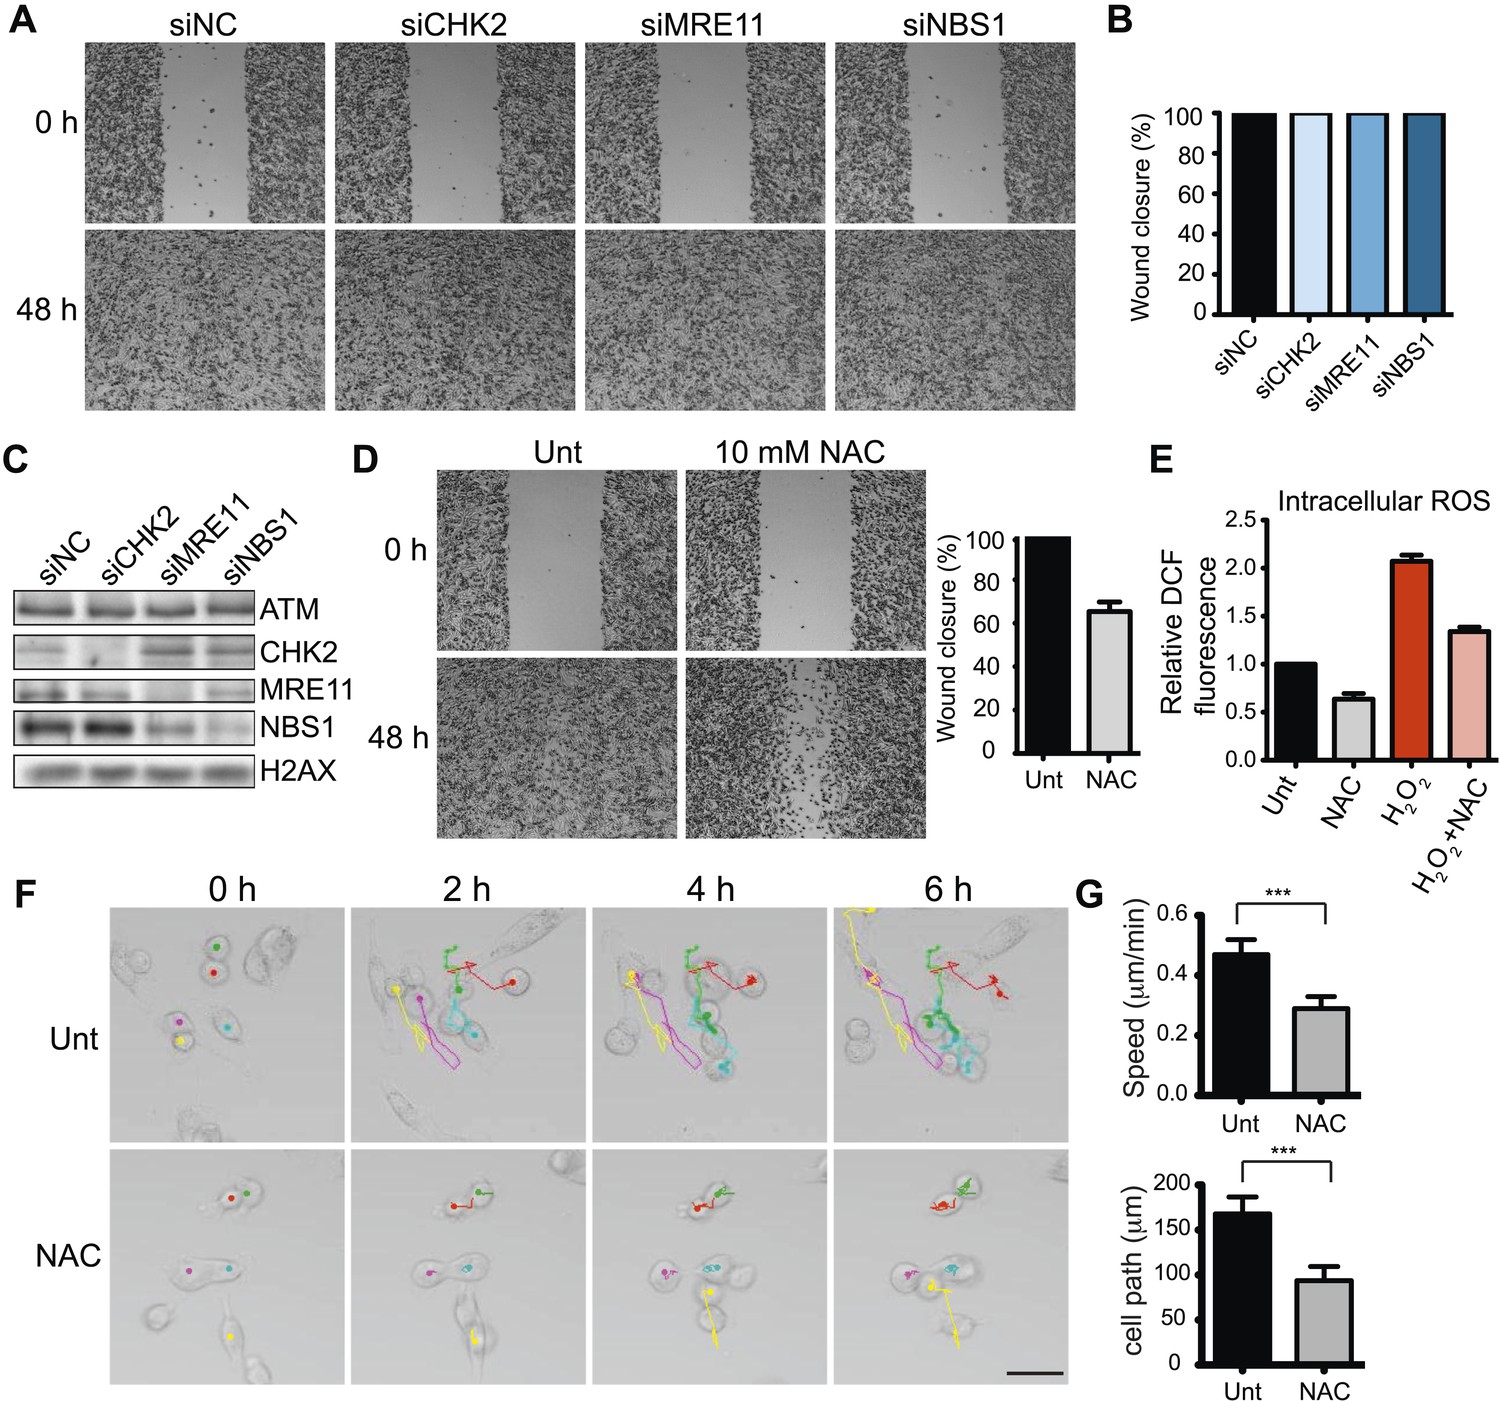
ATM promotes cell migration and invasion independently of DNA DSB signaling in MDA-MB-231 cells.
(A) DSB signaling is not involved in cell migration. Experiments were performed as in Figure 1A with the indicated siRNAs. (B and C) Quantification of wound healing (B) and siRNA depletions (C) in (A). (D) Reactive oxygen species (ROS) inhibitor N-acetylcysteine (NAC) reduces cell migration. Right panel: quantification of wound healing. (E) NAC treatment reduces endogenous ROS. Cells treated with 10 mM NAC were analyzed using an intracellular ROS detector as detailed in ‘Materials and methods’. 4 mM H2O2 treatment serves as a positive control. (F) Live-imaging analysis of cells treated with 10 mM NAC or left untreated. Images were acquired every 15 min for 6 hr and cell were tracked using ImageJ. Colored dots and lines represent individual cell paths. Scale bar, 37.5 μm. (G) Quantification of individual cell speed (μm/min) and cell path (μm) from (F). Cell parameters were quantified in ImageJ and represent mean data from >100 cells. Error bars = SD. *** p-value <0.0001, unpaired two-tailed t-test.
Figure 2—figure supplement 1
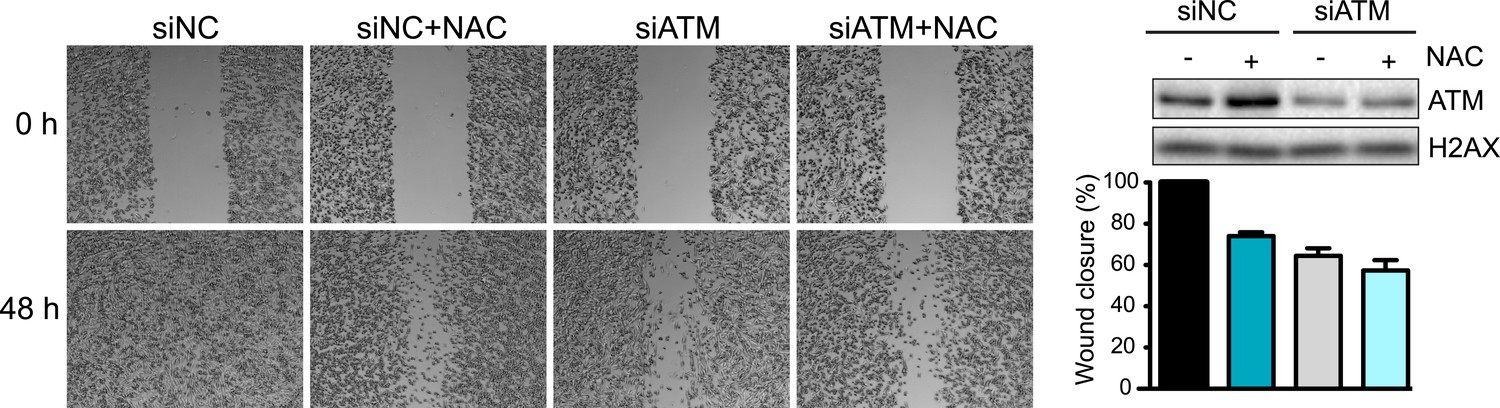
Inhibition of oxidative stress reduces cell migration and invasion.
ROS inhibitor NAC reduces cell migration to a similar extent as ATM-depletion. siATM and siNC control MDA-MB-231 cells were either untreated or treated with NAC and analyzed as in Figure 2D for cell migration. Right panel: Western blot of ATM depletion and quantification of cell migration for each sample.
Figure 3 with 1 supplement
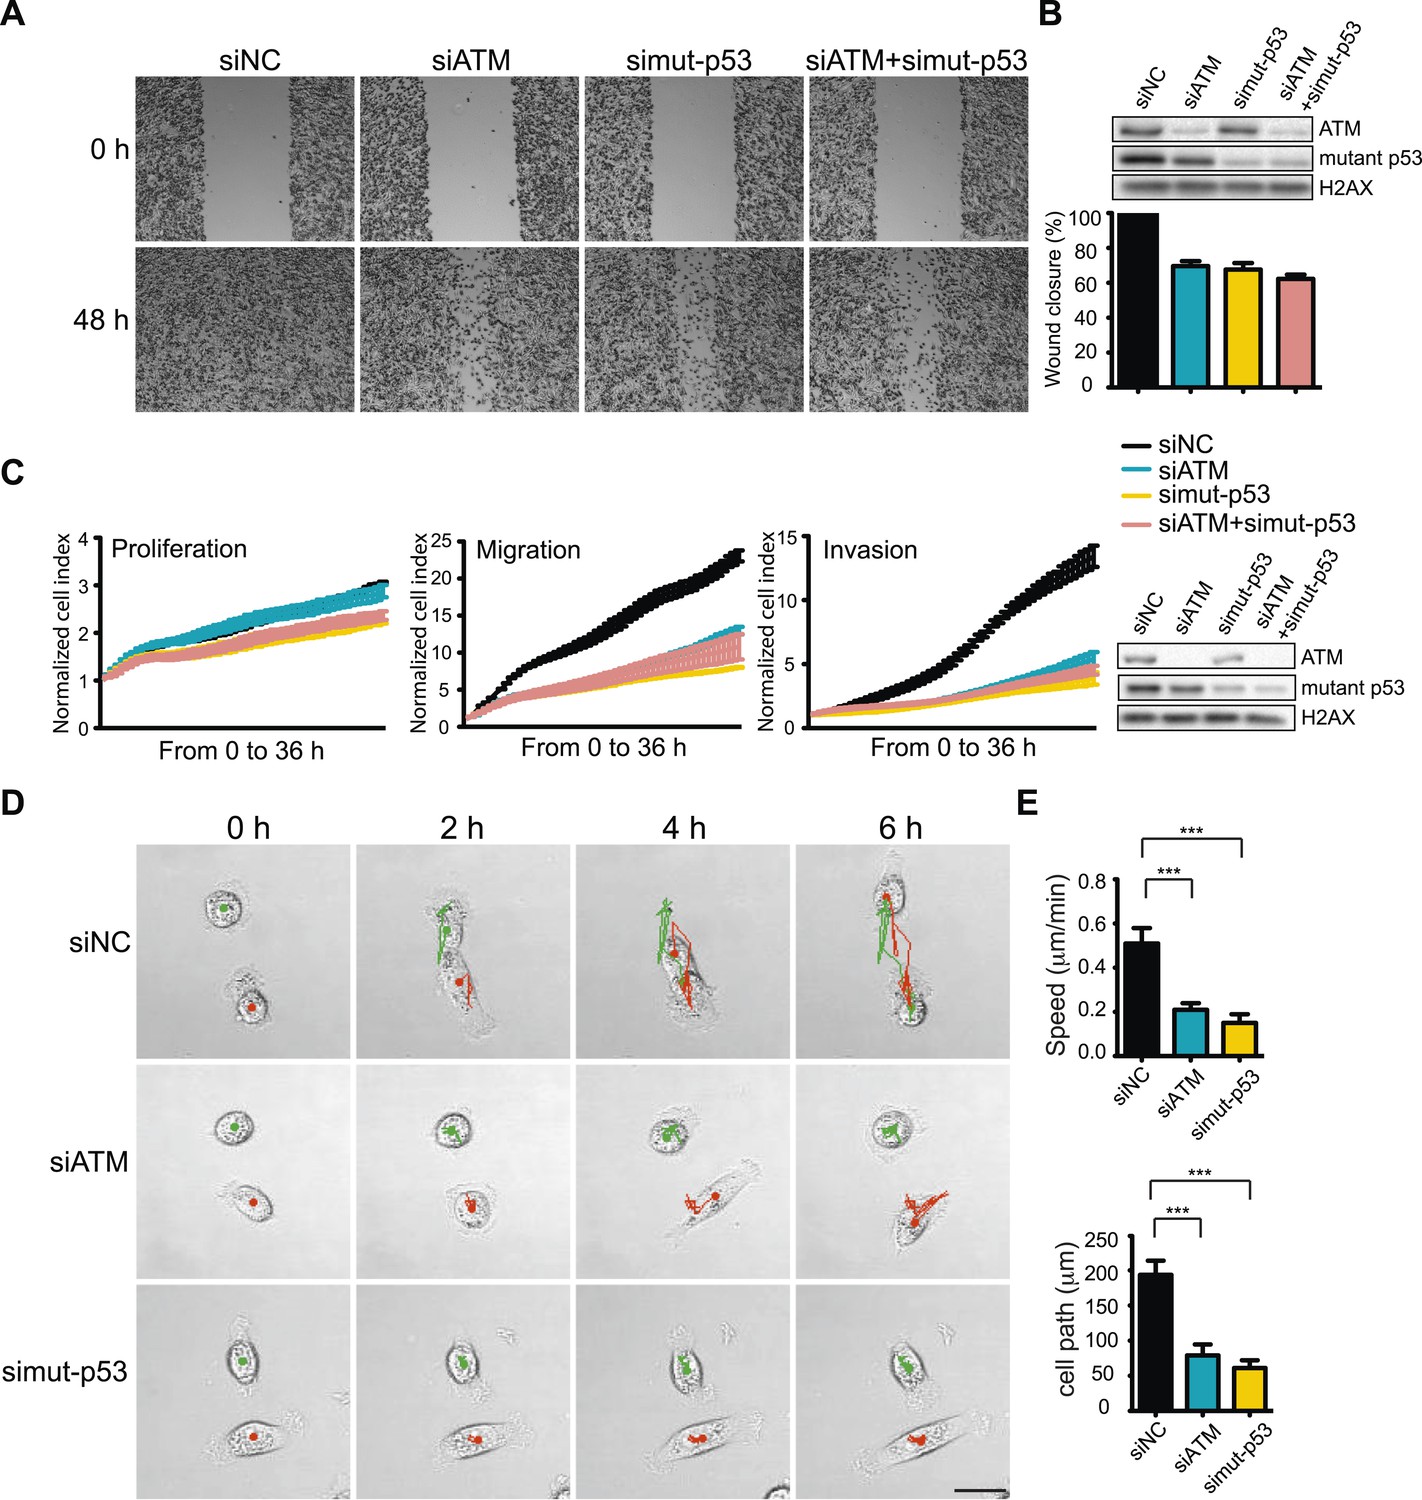
ATM-mutant p53 axis of the DNA damage response (DDR) promotes cell migration and invasion in MDA-MB-231 cells.
(A) ATM or mutant p53 depletion, as well as co-depletion, impairs cell motility similarly. Wound-healing assays were performed with the indicated siRNAs as in Figure 2A. (B) siRNA depletions and quantification of wound healing for (A). (C) Real-time analysis of cell dynamics in siATM, simutant-p53 and co-depleted cells. Experiments performed as in Figure 1G with indicated siRNAs. Right: ATM and mutant p53 levels in cell samples. (D) Live cell imaging of cell migration defects in ATM and mutant p53 depleted MDA-MB-231 cells. Experiments were performed and analyzed as in Figure 2F. Scale bar, 20 μm. (E) Quantification of individual cell speed (μm/min) and cell path (μm) from (D). Cell parameters were quantified as in Figure 2G. Error bars = SD. *** p-value <0.0001, unpaired two-tailed t-test.
Figure 3—figure supplement 1
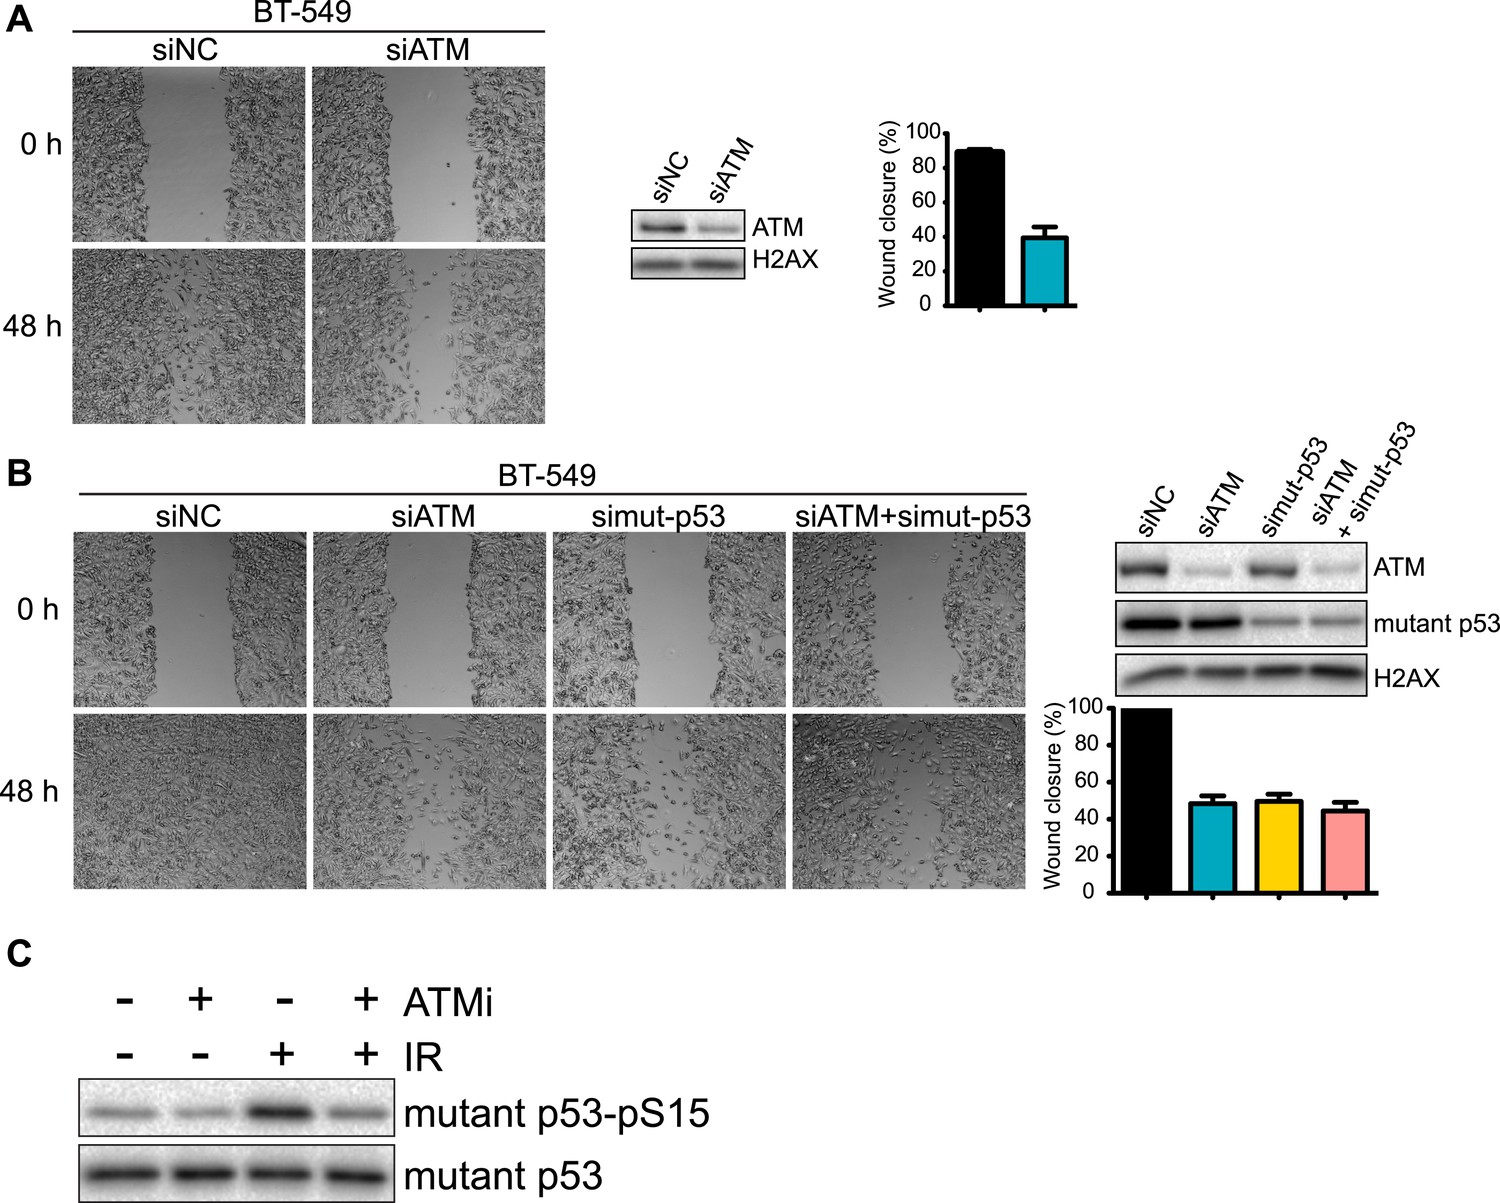
Analysis of ATM and mutant p53 functions in human breast cancer cells.
(A) ATM depletion impairs cell migration. Cells transfected with indicated siRNA were analyzed by wound-healing assays to determine cell motility. Right: Quantification of wound healing and ATM siRNA knockdown efficiency. (B) Reduction of ATM and/or p53 reduces cell migration. Cells were treated and analyzed with the indicated siRNAs as Figure 3A. Quantification of wound healing and depletion analysis is in right. (C) Treatment of MDA-MB-231 cells with ATM kinase inhibitor reduces mutant p53-pS35 compared to untreated cells. Experiments were performed as in Figure 1F.
Figure 4 with 2 supplements

ATM-mutant p53 regulates cytokine interleukin-8.
(A) Differential transcriptome expression analysis in siATM- and simut-p53- depleted cells identifies reduced IL-8 expression in both samples. Upper: Venn diagram of differentially expressed genes in simut-p53, siATM or both. Numbers indicate genes differentially expressed 1.5-fold or greater compared to siNC. Heatmap represents the 38 genes co-regulated similarly in siATM and simut-p53 cells. Expression data was normalized to control siNC cells. Cut-off = 1.5-fold normalized to siNC control cells. (B and C) qRT-PCR analysis of IL-8 mRNA levels in MDA-MB-231 (B) and BT-549 (C) siATM or sipmut-53 depleted cells. (D) IL-8 promoter activity by luciferase reporter assay in siATM and simut-p53 cells. Depletion of (E) NF-κB or (F) NEMO impairs IL-8 expression. (G) ATM or mutant p53 depletion abrogates NF-κB p65 nuclear localization. Cells treated with indicated siRNA were harvested to obtain cytoplasmic extract (CE) and nuclear extract (NE) to analyze NF-κB p65 localization. (H) ATM or mutant p53 deletion impairs NF-κB p65 binding to IL-8 promoter using chromatin immunoprecipitation (ChIP) analysis. Actin promoter serves as a negative control.
Figure 4—figure supplement 1
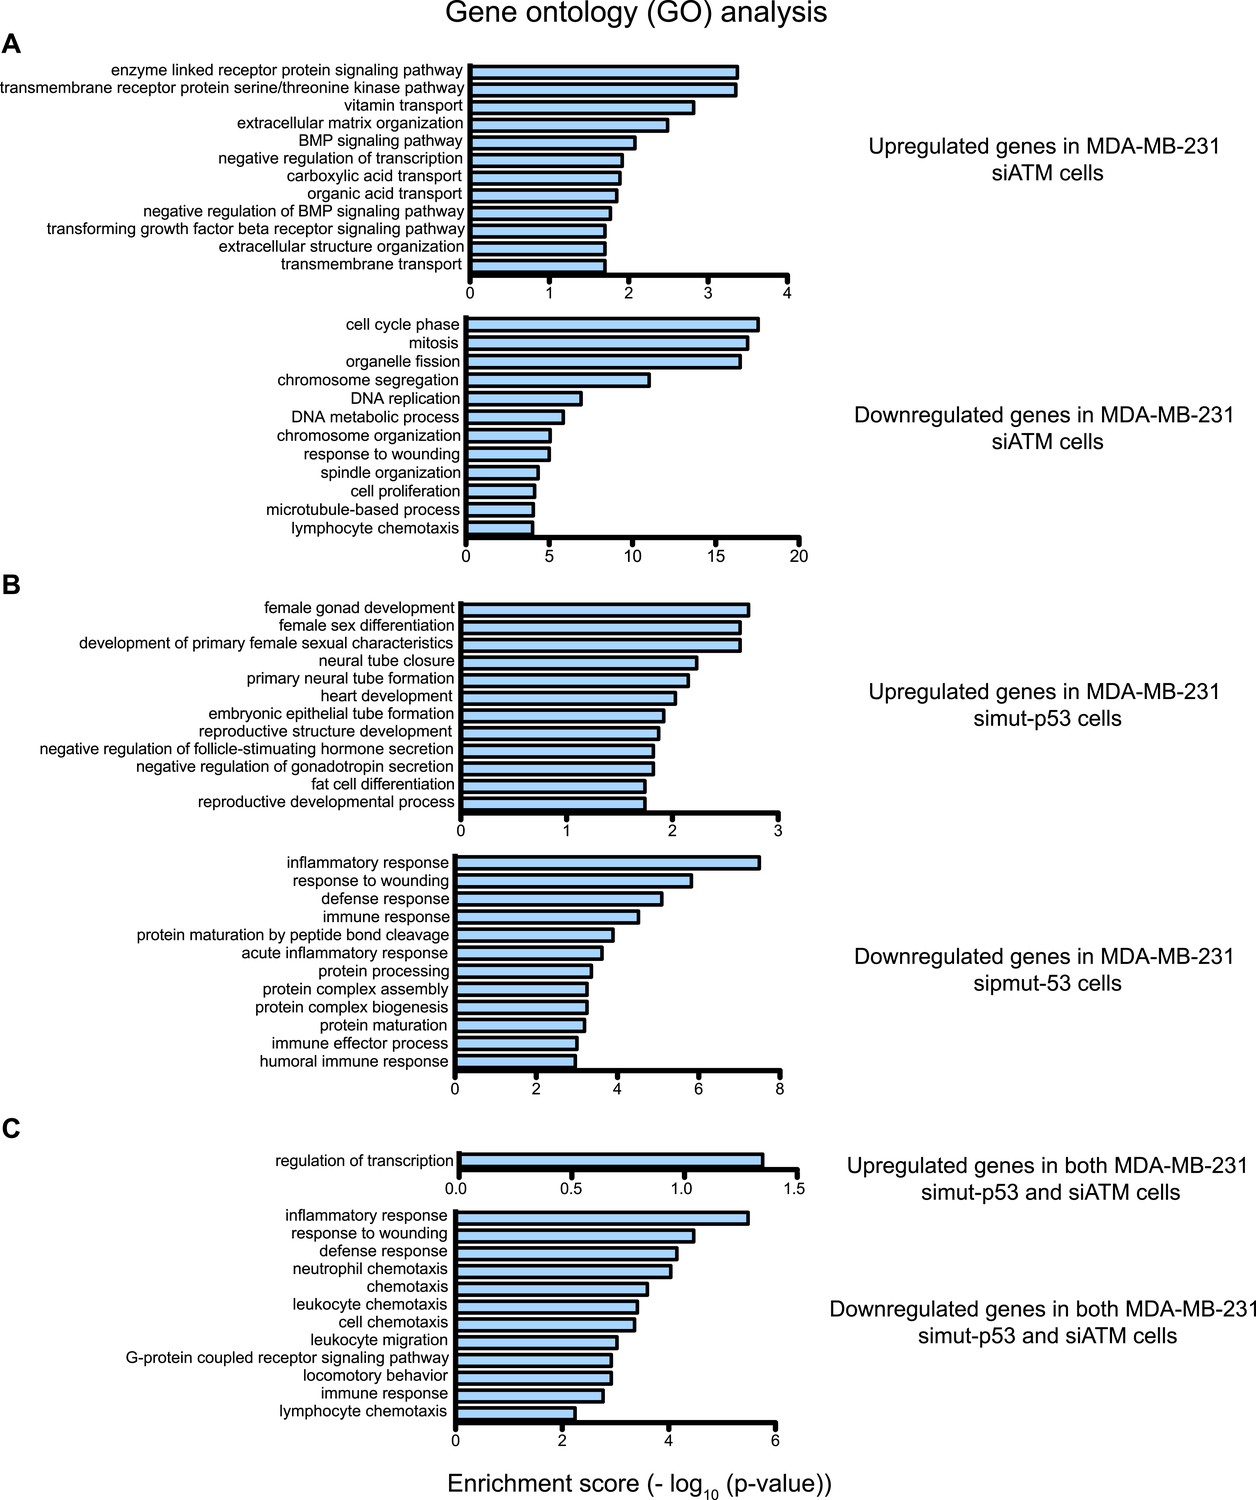
Gene ontology (GO) analysis of ATM and mutant p53 regulated genes in MDA-MB-231 cells.
(A–C) Functional classification of regulated genes in MDA-MB-231 from siATM (A), simut-p53 (B) and genes regulated similarly in both siATM and simut-p53 by more than 1.5-fold (C). GO analysis was analyzed using the ‘Functional Annotation Tool’ in DAVID (http://david.abcc.ncifcrf.gov/home.jsp) and biological process terms are shown. GO pathways are shown for the upregulated genes (top) and downregulated genes (bottom). X-axis plots—log10 p-values obtained by the GO analysis. The top 12 pathways are shown for each data set.
Figure 4—figure supplement 2
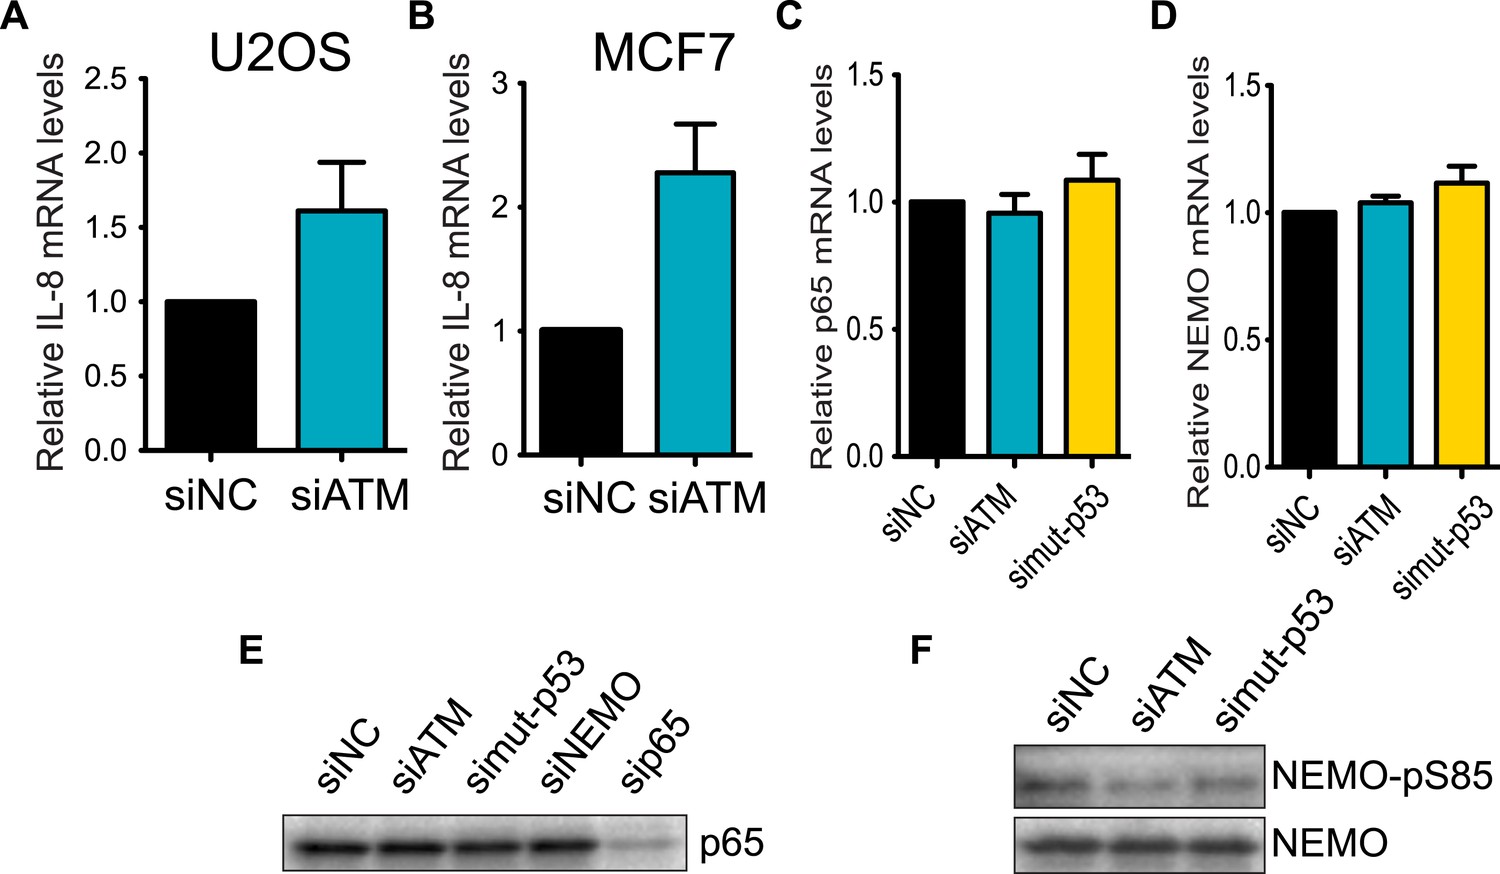
Regulation of IL-8 and NF-kB by ATM and p53.
ATM promotes IL-8 mRNA expression in the context of mutant p53 (A and B) Depletion of ATM in WT p53-containing cancer cell lines (A) U2OS or (B) MCF7 did not reduce IL-8 mRNA levels. (C and D) Depletion of ATM or mutantp53 does not reduce the mRNA levels of (C) p65 or (D) NEMO. (E) p65 protein levels are not reduced upon depletion of ATM, mutant p53 or NEMO. sip65 acts as a control. (F) Depletion of ATM or mutant p53 results in reduced phosphorylation of NEMO at Ser-85. All experiments were performed in MDA-MB-231 cells except A and B. Experiments were performed as in Figure 4.
Figure 5 with 1 supplement
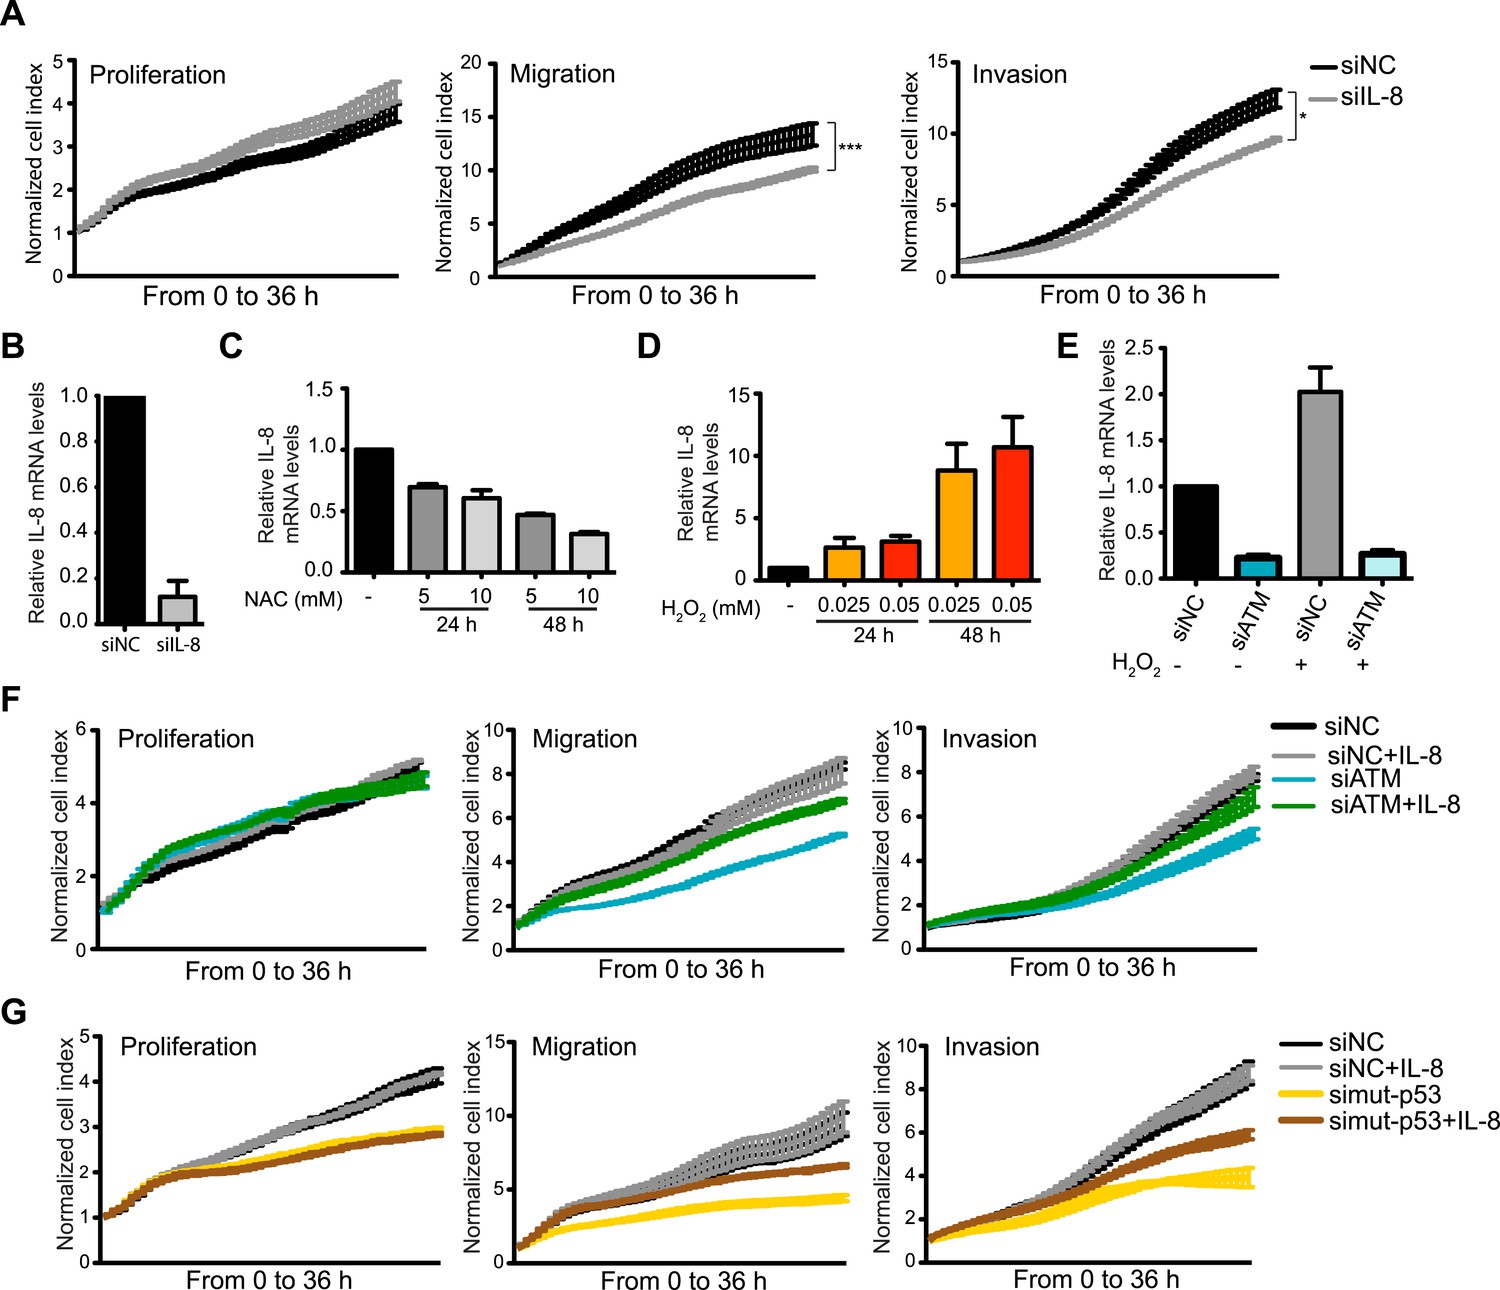
ATM promotes pro-metastatic IL-8-dependent cellular processes.
(A) IL-8 depletion reduces cell migration and invasion. Experiments performed as in Figure 1G. Error bars = SEM. * p-value <0.05, *** p-value <0.001, unpaired two-tailed t-test. (B) IL-8 qRT-PCR analysis from samples in (A). (C) ROS inhibitor NAC reduces IL-8 expression. (D) H2O2-induced oxidative stress increases IL-8 expression. (E) H2O2-induced IL-8 expression is dependent on ATM. Cells treated with indicated siRNAs were incubated with 0.025 mM H2O2 or mock treated and analyzed by qPCR. (F and G) IL-8 addition restores impaired migration and invasion for ATM-depleted (F) or mutant p53-depleted (G) cells. Experiments performed as in Figure 1G with or without recombinant IL-8. For all graphs, mean ± s.e.m., n = 3.
Figure 5—figure supplement 1
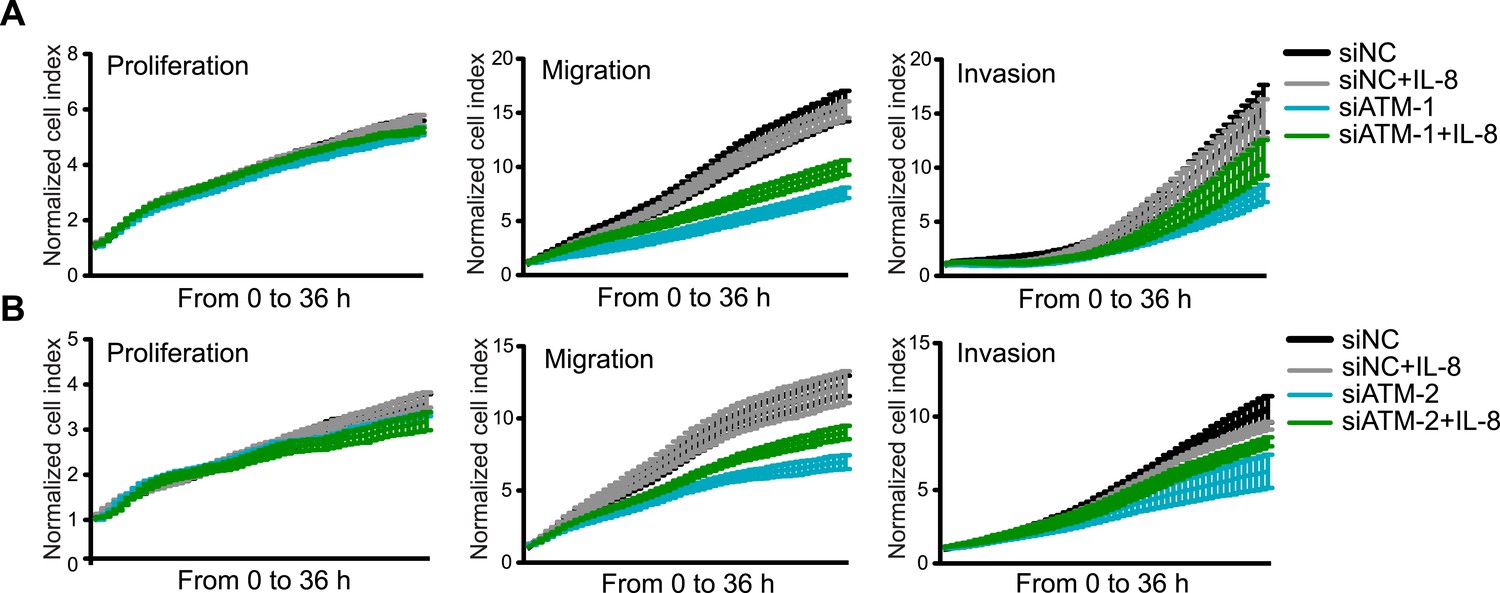
Exogenous addition of IL-8 rescues migration and invasion defects in ATM-depleted cells.
(A and B) IL-8 addition restores impaired migration and invasion for cells treated with independent siATM-1 (A) and siATM-2 (B) compared to siNC control cells. Experiments performed as in Figure 5F,G (mean ± s.e.m., n = 3).
Figure 6 with 2 supplements
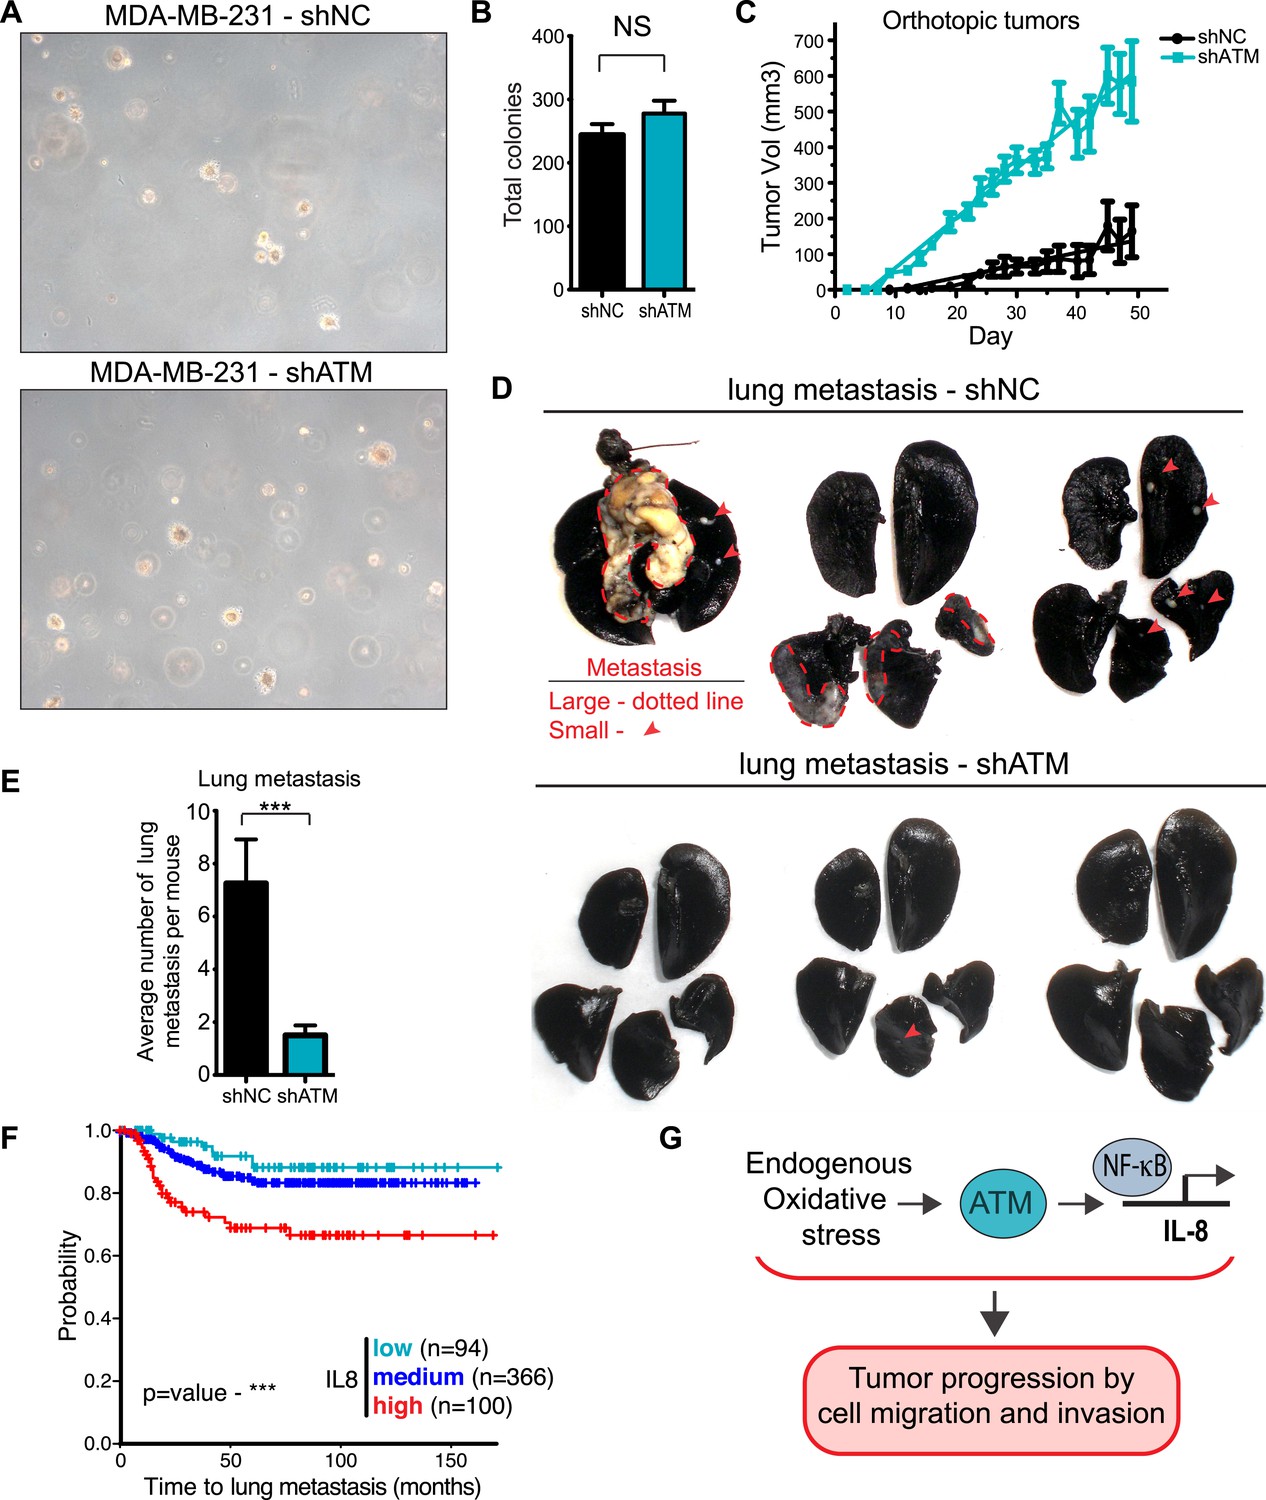
ATM promotes tumor progression in vivo.
(A) ATM is not required for colony growth in soft agar. Representative images of shNC and shATM are shown. (B) Quantification of soft agar assays. Colonies were counted from 10 fields of view. Differences between shNC and shATM are not significantly different (NS) by unpaired two-tailed t-test. (C) MDA-MB-231 shATM cells increase cancer cell proliferation compared to shNC cells by measuring orthotopic tumor growth. (D) ATM-depletion reduces lung tumor formation. Representative India ink stained lungs at necropsy from mice (N = 12 for each group) following tail-vein injection xenografting of shNC or shATM MDA-MB-231 cells. Lung tumors indicated by arrows and dotted lines. (E) Quantification of lung tumors from D. (F) Kaplan-Meier plot of probability of lung metastasis free survival in 560 breast cancer patients based on IL8 expression levels. (G) Model for ATM pathway in tumor progression.
Figure 6—figure supplement 1
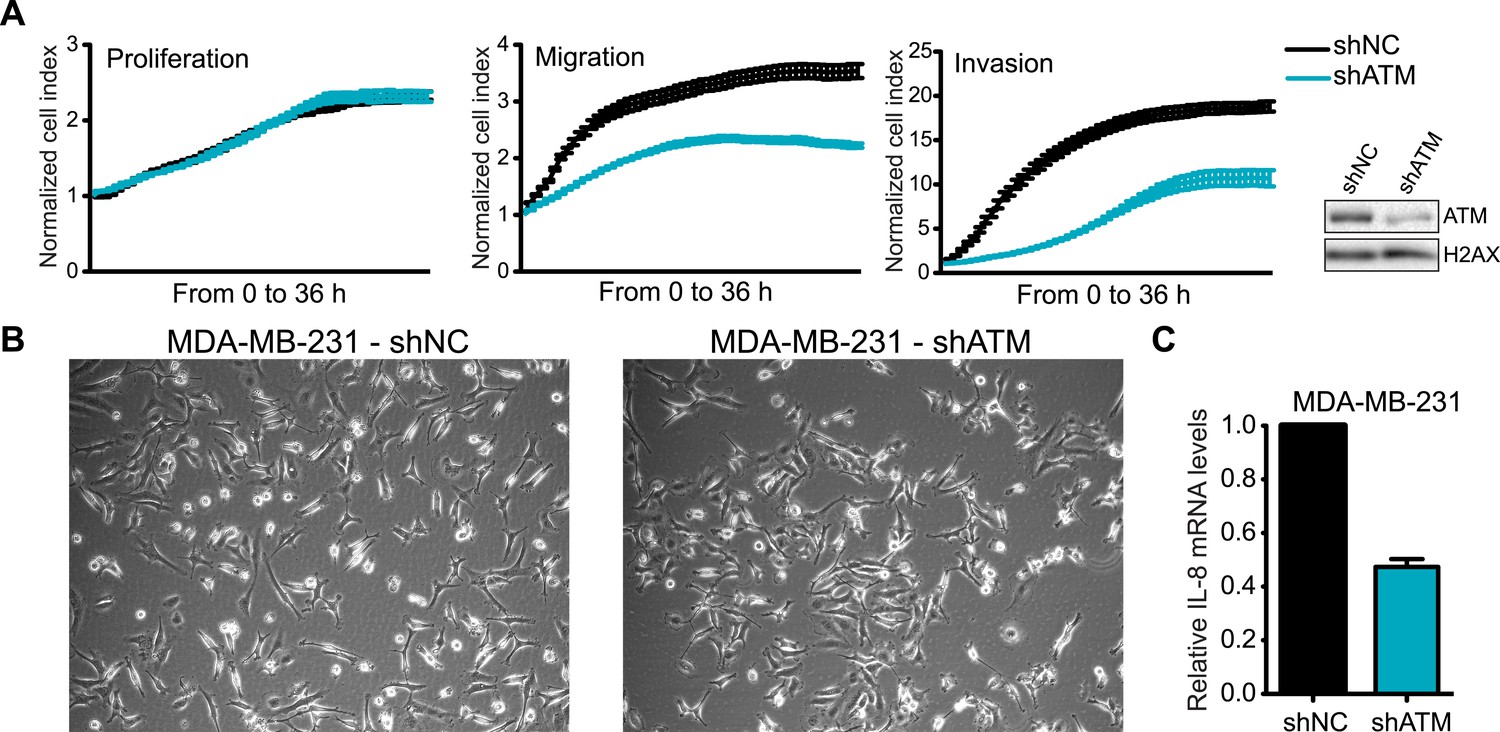
ATM is required for cell motility and IL-8 expression.
(A) shATM cells exhibit defects in cell migration and invasion but not proliferation compared to shNC cells. Experiments were performed as in Figure 1G. Western blot showed ATM depletion in shATM cells compared to shNC cells. (B) Morphology of shNC and shATM MDA-MB-231 cells. (C) IL-8 expression is reduced in shATM cells compared to shNC cells.
Figure 6—figure supplement 2
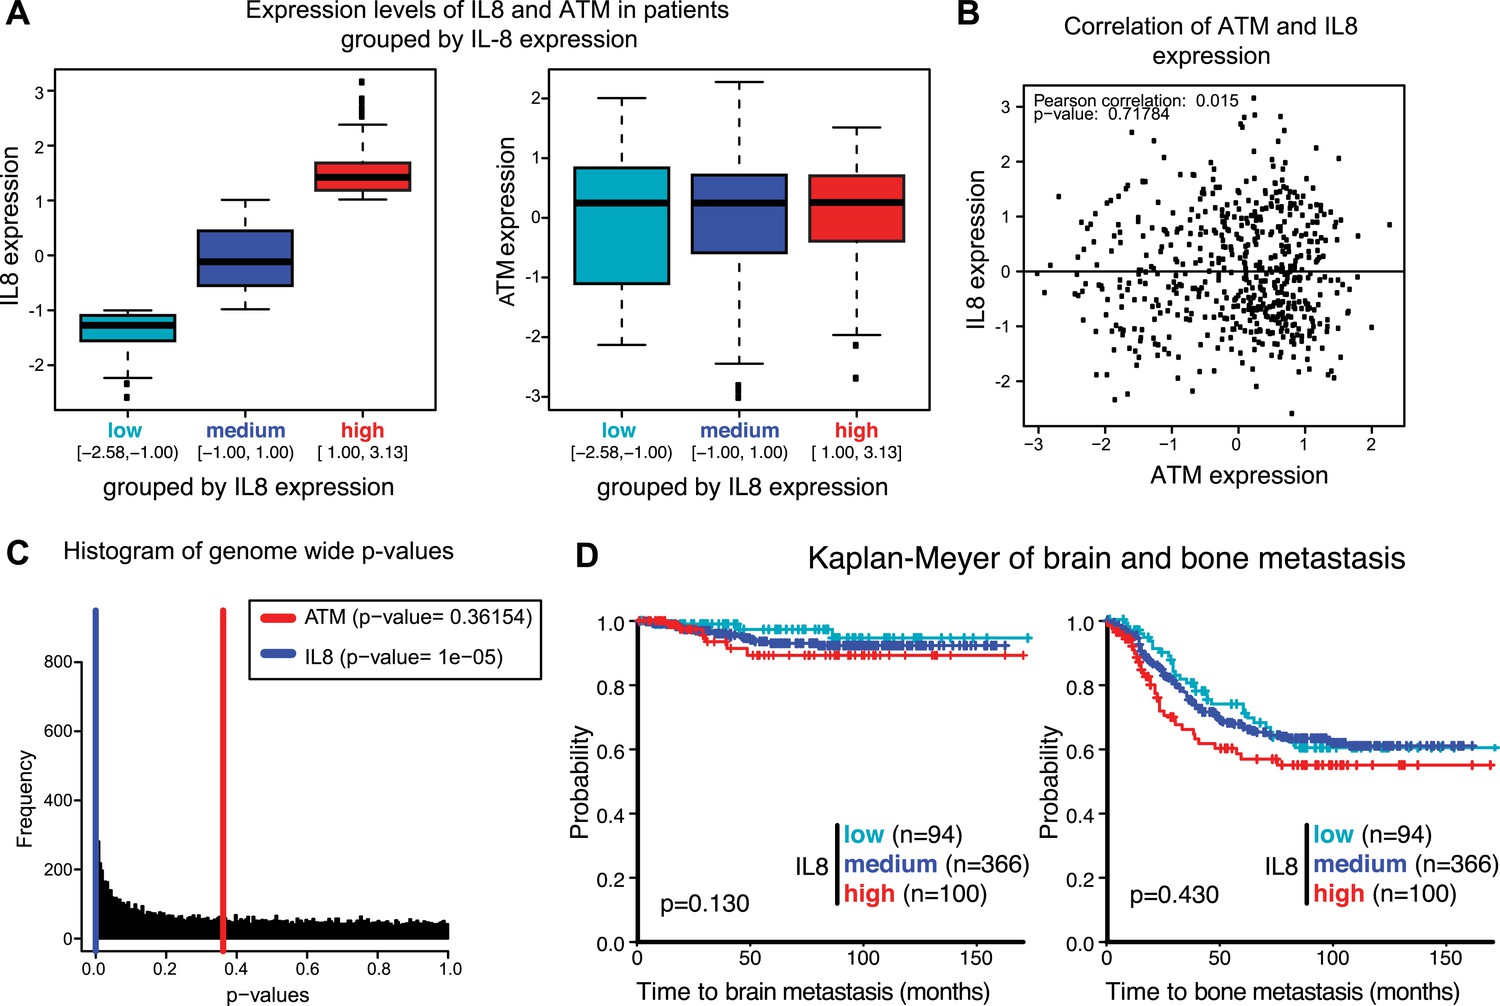
Analysis of gene expression data from breast cancer patients.
(A) Boxplot of IL8 (left panel) and ATM (right panel) expression in patients grouped according to IL8 expression (see Figure 6F). (B) Pearson analysis of correlation between ATM and IL8 in the 560 patient samples used in the analysis. (C) Histogram of p-values of a Univariate Cox proportional hazard regression for the expression of all genes in the microarray. In color we show the p-values obtained with IL8 expression (0.0033 percentile) and ATM expression (0.4676 percentile). (D) Kaplan-Meier plots of probability of brain and bone metastasis free survival in 560 breast cancer patients based on IL8 expression levels.
Videos
Video 1
Live cell imaging and tracking of untreated MDA-MB-231 cells for Figure 2.
Images were taken every 15 min for 6 hr and tracking was performed in ImageJ. Still images and quantifications are provided in Figure 2E,F.
Video 2
Live cell imaging and tracking of MDA-MB-231 cells treated with 10 mM NAC for Figure 2.
Images were taken every 15 min for 6 hr and tracking was performed in ImageJ. Still images and quantifications are provided in Figure 2E,F.
Video 3
Live cell imaging and tracking of siNC MDA-MB-231 cells for Figure 2.
Images were taken every 15 min for 6 hr and tracking was performed in ImageJ. Still images and quantifications are provided in Figure 3D,E.
Video 4
Live cell imaging and tracking of siATM MDA-MB-231 cells for Figure 3.
Images were taken every 15 min for 6 hr and tracking was performed in ImageJ. Still images and quantifications are provided in Figure 3D,E.
Video 5
Live cell imaging and tracking of si mutant p53 MDA-MB-231 cells for Figure 3.
Images were taken every 15 min for 6 hr and tracking was performed in ImageJ. Still images and quantifications are provided in Figure 3D,E.
Additional files
-
Supplementary file 1
Gene expression analysis. (A) Differentially expressed genes in siATM MDA-MB-231 cells. MDA-MB-231 cells depleted for ATM were analyzed for gene expression using Affymetrix GeneChip Human Gene 2.0 ST array. The gene list was generated from Affymetrix Transcriptome Analysis Concole (TAC) software. (B) Differentially expressed genes in si mutant p53 MDA-MB-231 cells. This gene list is generated as in A. (C) Genes regulated by both ATM and mutant p53 in MDA-MB-231 cells. This gene list was generated from data in A and B by choosing genes regulated similarly by both ATM and mutant p53.
- https://doi.org/10.7554/eLife.07270.022
-
Supplementary file 2
Statistical analysis of IL8 expression in metastasis to the indicated tissue. Univariate Cox proportional hazard regression for continuous variables (first row of table) and log-rank test of equality across strata for categorical variables (grouping of samples according to IL8 expression).
- https://doi.org/10.7554/eLife.07270.023
Download links
A two-part list of links to download the article, or parts of the article, in various formats.
Downloads (link to download the article as PDF)
Open citations (links to open the citations from this article in various online reference manager services)
Cite this article (links to download the citations from this article in formats compatible with various reference manager tools)
ATM regulation of IL-8 links oxidative stress to cancer cell migration and invasion
eLife 4:e07270.
https://doi.org/10.7554/eLife.07270


