A dynamic RNA loop in an IRES affects multiple steps of elongation factor-mediated translation initiation
- University of Colorado Denver School of Medicine, United States
- University of Pennsylvania, United States
- Columbia University, United States
Figures
Figure 1 with 2 supplements

Intergenic region (IGR) internal ribosome entry site (IRES) mechanism and loop 3.
(A) Schematic of the IGR IRES initiation factor-independent translation initiation mechanism. The IGR IRESs occupy the same binding sites as tRNAs in the ribosome. Elongation factor-catalyzed steps are shown in red type and arrows, and proposed reverse reactions are shown with gray arrows. (B) Secondary structure cartoon of an IGR IRES with domain III boxed and loop 3 in red. PKI in the figure denotes the pseudoknot base pairs that mimic the codon–anticodon interaction. (C) Cryo-electron microscopy (cryo-EM) reconstruction of the Taura Syndrome Virus (TSV) IGR IRES bound to Saccharomyces cerevisiae 80S ribosomes (Koh et al., 2014). The TSV IRES RNA model is shown in yellow, with loop 3 in red. Density within 8 Å of the IRES model is shown, at a threshold of 2.5. To the right is a close-up view of loop 3. (D) Same as panel C, but of a Cricket Paralysis Virus (CrPV) IGR IRES bound to Kluyveromyces lactis 80S ribosomes (Fernández et al., 2014). Density within 4 Å of the IRES model is shown, at a threshold of 2.5. (E) Same as panel C, but of a CrPV IGR IRES bound to Oryctolagus cuniculus 80S ribosomes with eukaryotic release factor 1 (eRF1) bound (Muhs et al., 2015). Density within 5 Å of the IRES model is shown, at a threshold of 3.0. (F) Diagram of the dual luciferase (LUC) reporter RNA used in all in vitro translation assays. IRES activity is determined as a ratio of Firefly LUC activity to Renilla LUC activity.
Figure 1—figure supplement 1
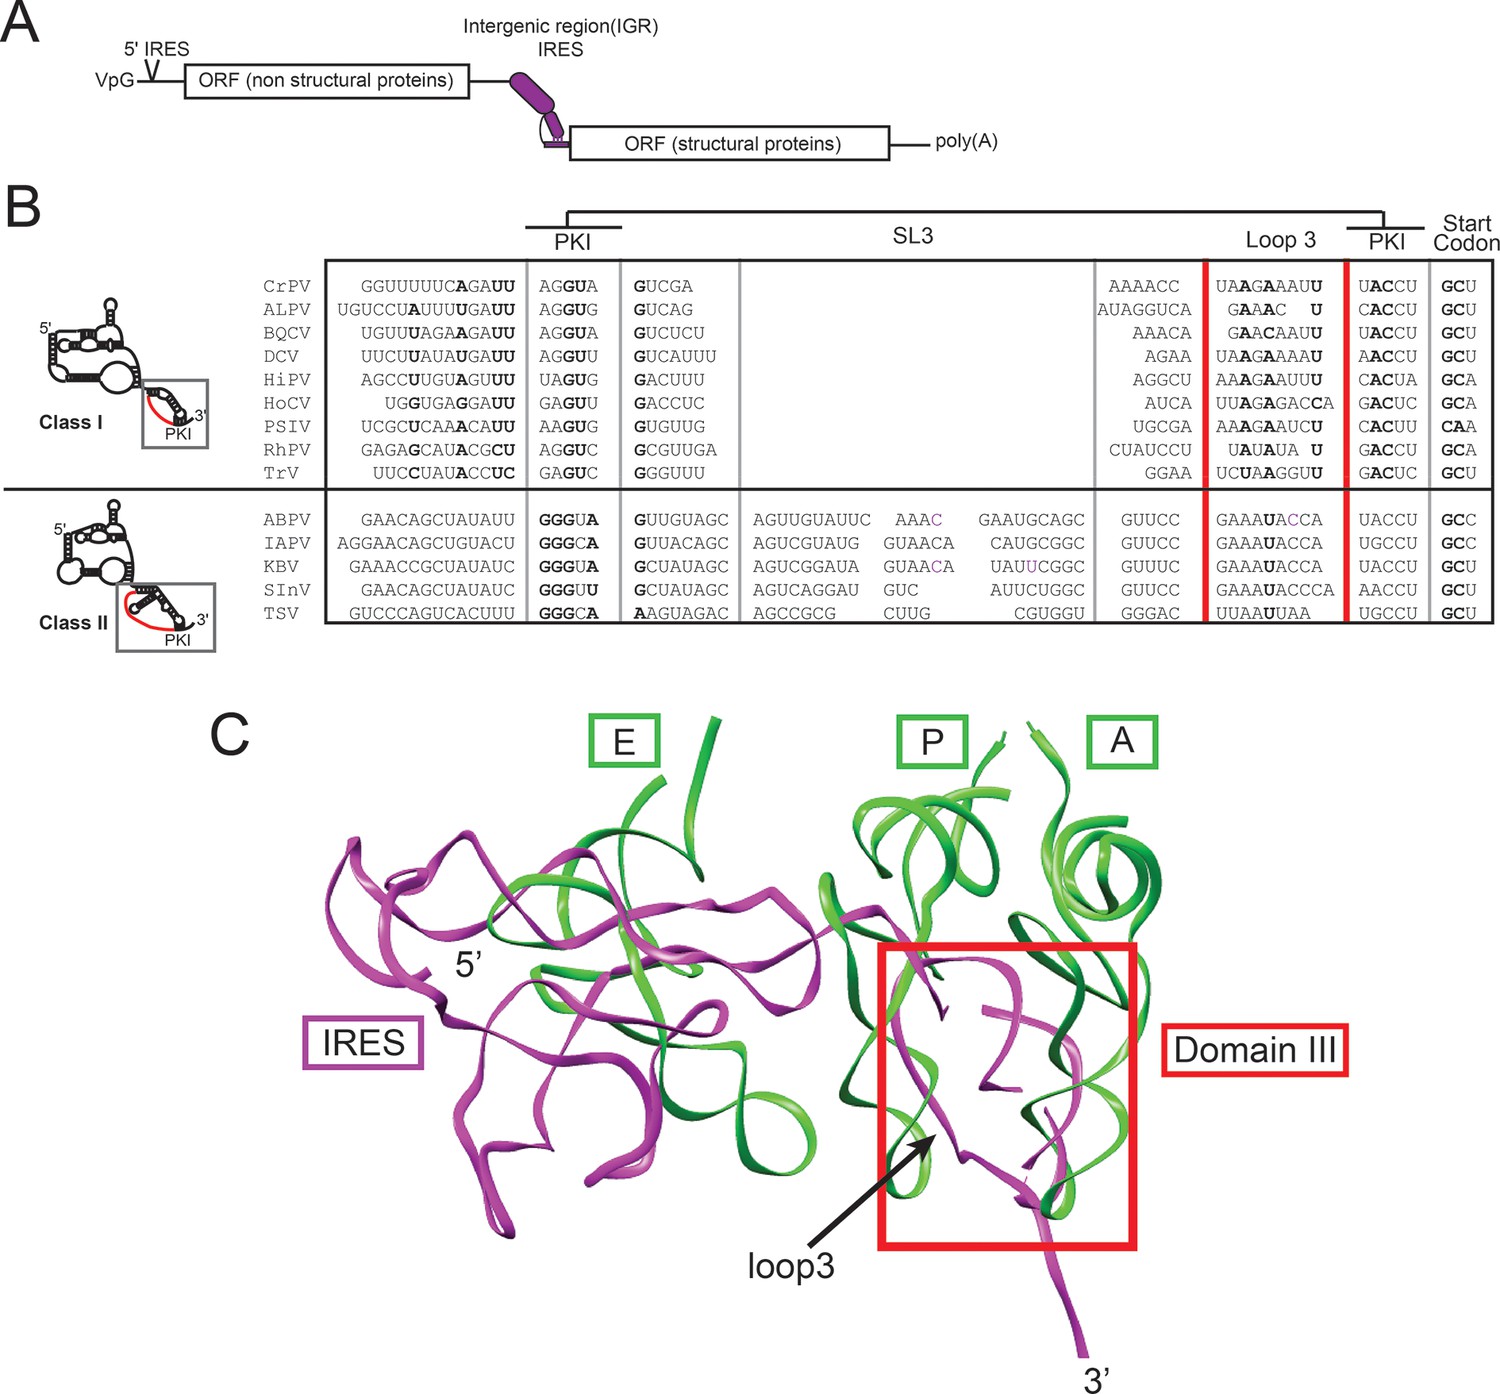
IGR IRES location in viral RNA, and alignment and structure of domain III.
(A) Diagram of the Dicistroviridae RNA genome. The IGR IRESs initiate translation of the second open reading frame. (B) Alignment of domain III sequences from 14 Dicistroviridae family members (class I and II). The location of loop 3 is indicated in red. Conserved sequence is in bold. CrPV, Cricket Paralysis Virus; ALPV, Aphid Lethal Paralysis Virus; BQCV, Black Queen Cell Virus; DCV, Drosophila C Virus; HiPV, Himetobi P Virus; HoCV, Homalodisca coagulata Virus; PSIV, Plautia stali Intestinal Virus; RhPV, Rhopalosiphum padi Virus; TrV, Triatoma Virus; ABPV, Acute Bee Paralysis Virus; IAPV, Israeli Acute Paralysis Virus; KBV, Kashmir Bee Virus; SInV, Solenopsis invicta Virus-1; TSV, Taura Syndrome Virus. (C) A model of the CrPV IGR IRES from cryo-electron microscopy (magenta) bound to an 80S ribosome (PDB ID: 4CUX) (Fernández et al., 2014) overlaid with A-, P-, and E-site tRNAs (green) bound in a 70S ribosome in the presence of paromomycin (PDB ID 2WDK) (Voorhees et al., 2009). Domain 3 of the IRES is boxed in red and loop 3 is indicated with an arrow.
Figure 1—figure supplement 2
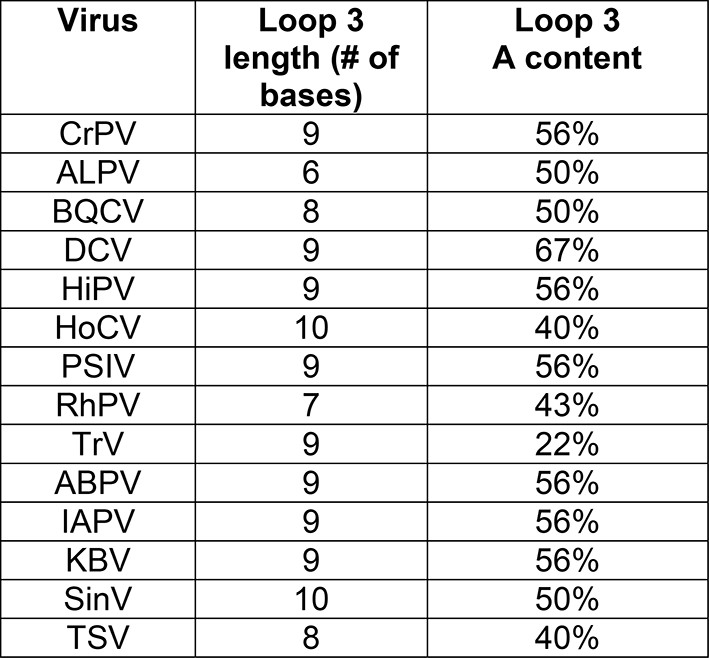
Loop 3 composition and length in diverse IGR IRESs.
https://doi.org/10.7554/eLife.08146.005
Figure 2 with 1 supplement
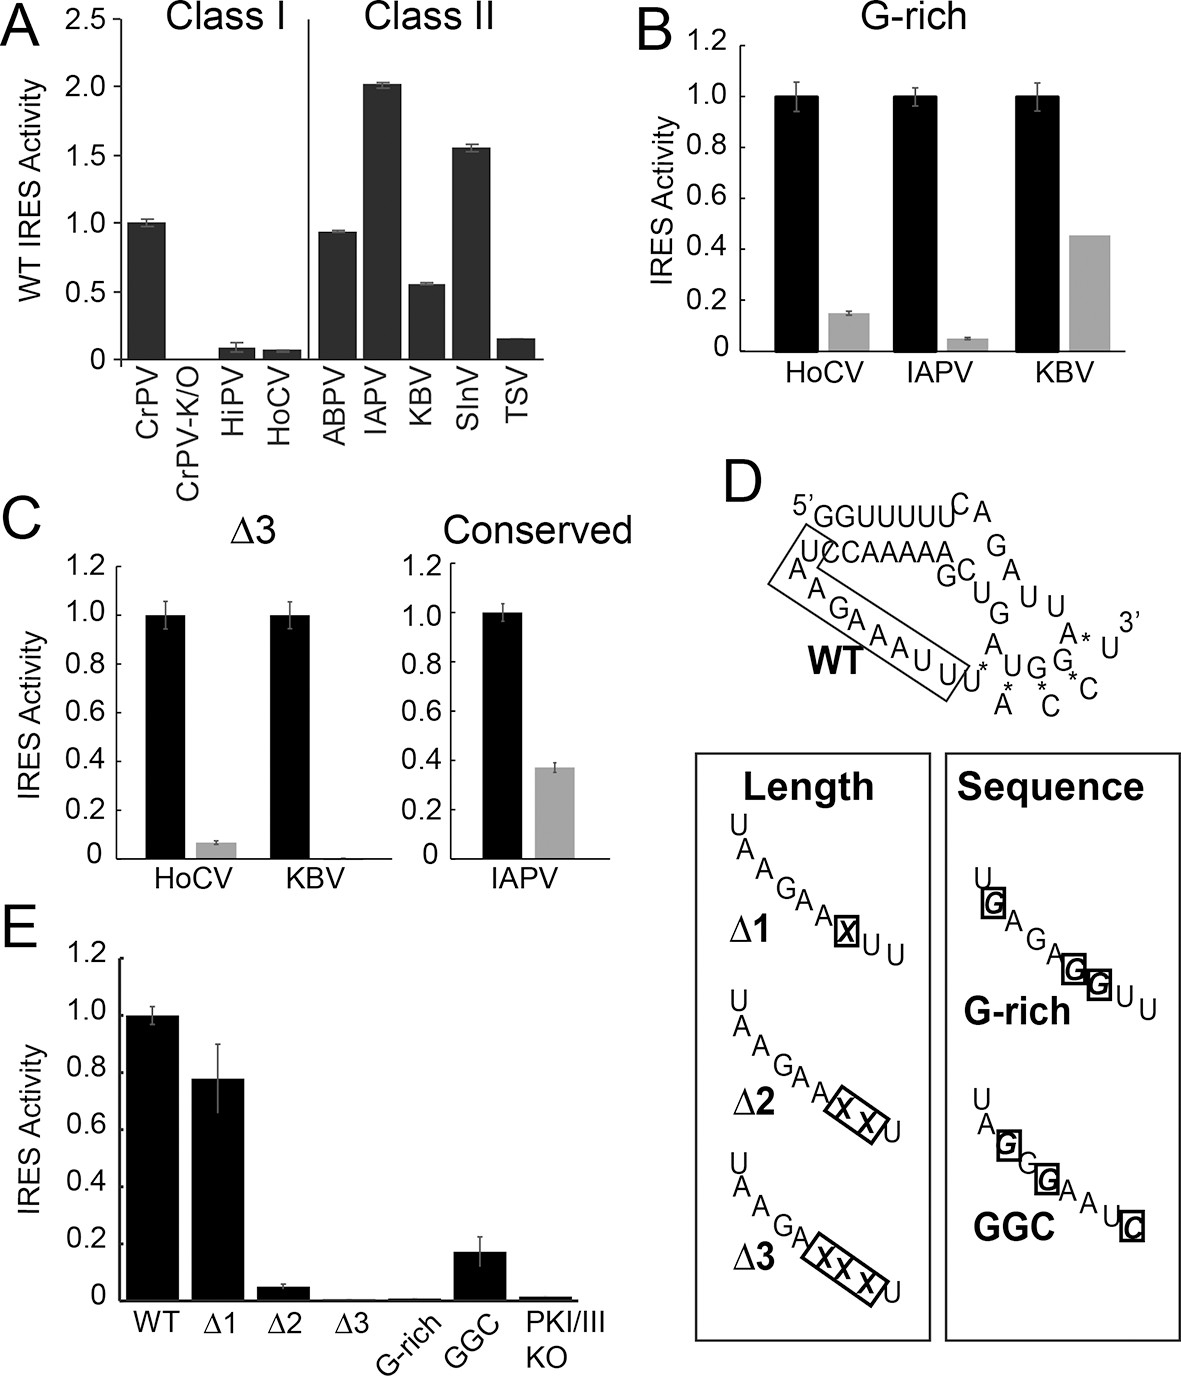
Function of diverse wild type (WT) and loop 3 mutant intergenic region (IGR) internal ribosome entry site (IRESs) in rabbit reticulocyte lysate (RRL).
(A) Activity of different WT IGR IRESs. Mutant Cricket Paralysis Virus (CrPV)-K/O has pseudoknots III and I disrupted and is the negative control (Jan and Sarnow, 2002; Costantino et al., 2008). (B and C) Function of WT IRESs (black bars) and loop 3 mutants (gray bars). WT levels are normalized to 1 for each IRES. (D) Diagrams of CrPV IGR IRES domain III mutants. Mutations are boxed and X indicates deletion of a nucleotide. (E) Activity of CrPV loop 3 mutants in RRL. Error bars represent standard error of the mean over at least three biological replicates.
Figure 2—figure supplement 1
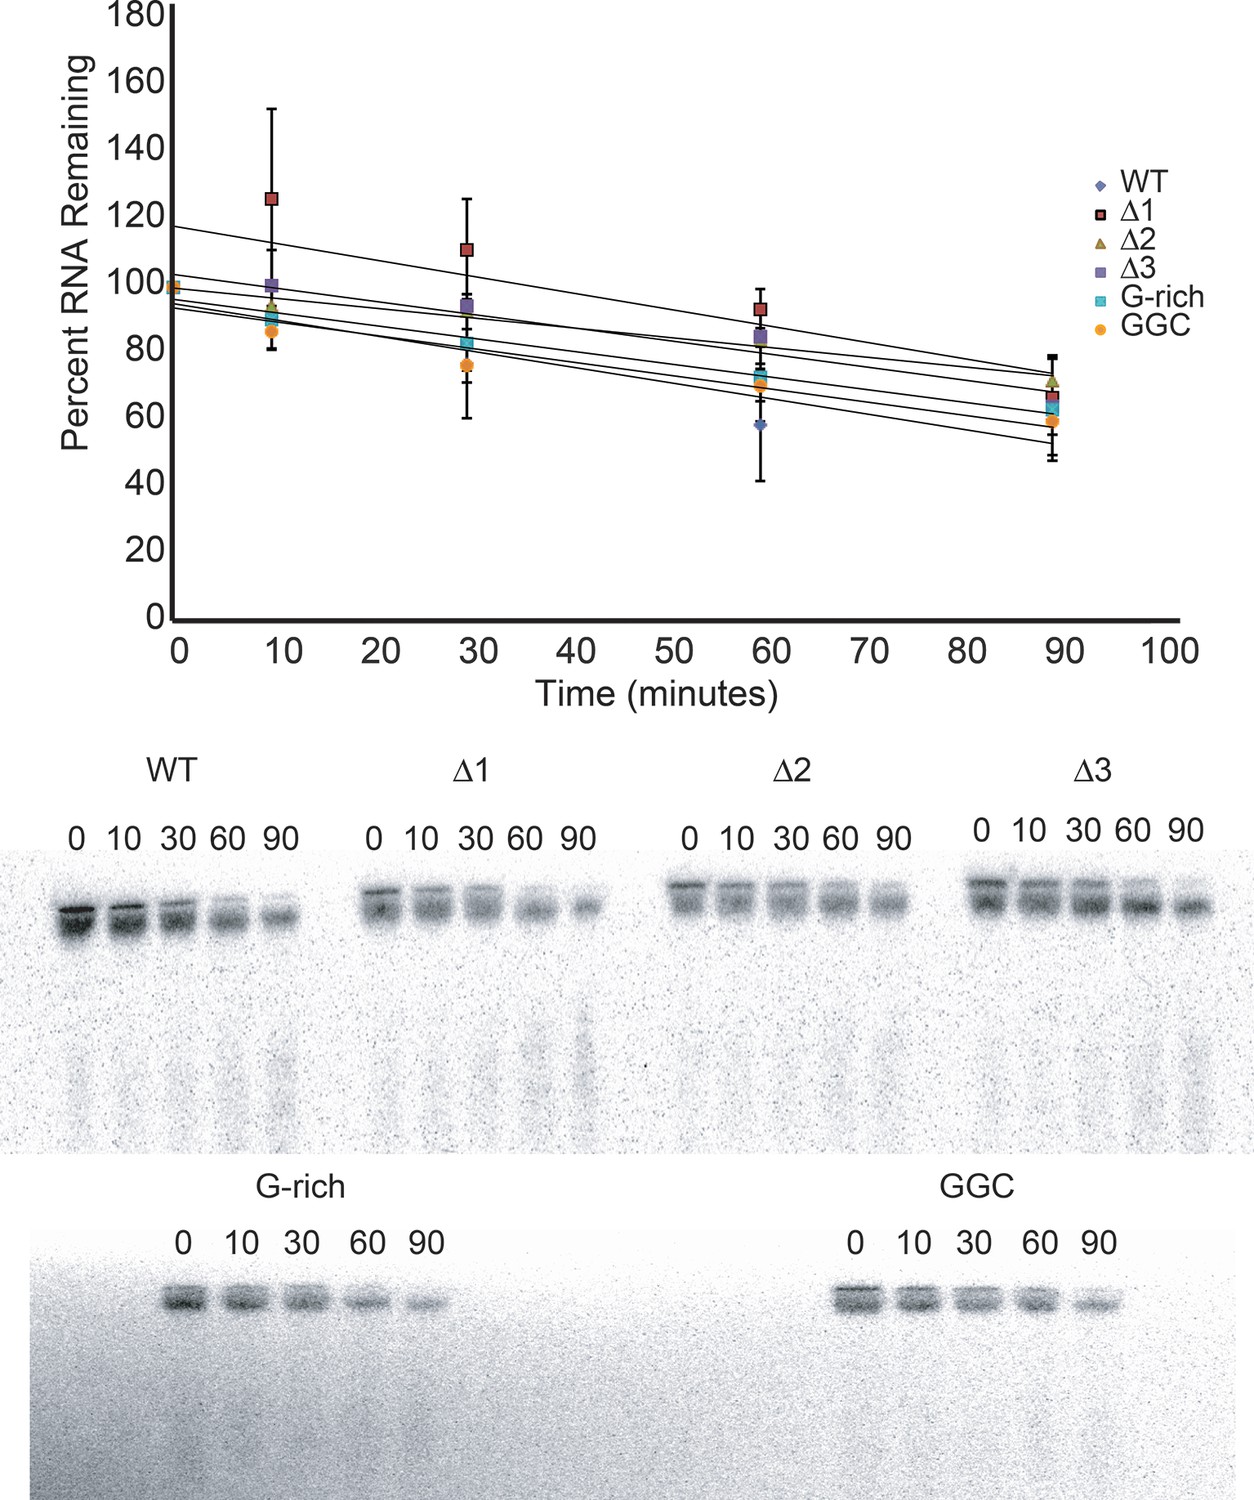
Degradation of input reporter mRNA in RRL.
Top: Input reporter mRNAs were body-labeled with 32P during transcription, purified, then incubated in RRL at 30°C for the times indicated. RNA was then recovered from the reactions, resolved on a denaturing polyacrylamide gel, and full-length RNA was quantitated by phosphorimaging. The graph indicates the average percent of each input RNA remaining as a function of time from three independent experiments, and a linear fit of these data. Error bars indicate one standard error from the mean. Bottom: An example of raw data from this experiment. Numbers indicate incubation time in minutes.
Figure 3 with 2 supplements

Ribosome docking, translocation, and reading frame maintenance.
(A) Toeprinting analysis of Cricket Paralysis Virus (CrPV) wild-type (WT) internal ribosome entry site (IRES) and loop 3 mutants in the free (f) and yeast 80S ribosome-bound (80S) forms, and in rabbit reticulocyte lysate (RRL) with or without 3 mg/ml cycloheximide (+/- CHX). The +14/15 toeprint indicates the position of the edge of the pretranslocation ribosome, and the +20/21 toeprint shows the position of the edge of the 2x translocated ribosome. Gels are representative of at least six independent experiments. (B) Quantification of translocated toeprint bands (+20/21/((+14/15)+(+20/21))) in RRL+CHX (n = 6–9), error bars represent standard error of the mean. (C) In vitro translation assay of dual luciferase reporters with +0 (normal), +1, or +2 reading frames. Error bars represent standard error of the mean of three independent experiments.
Figure 3—figure supplement 1
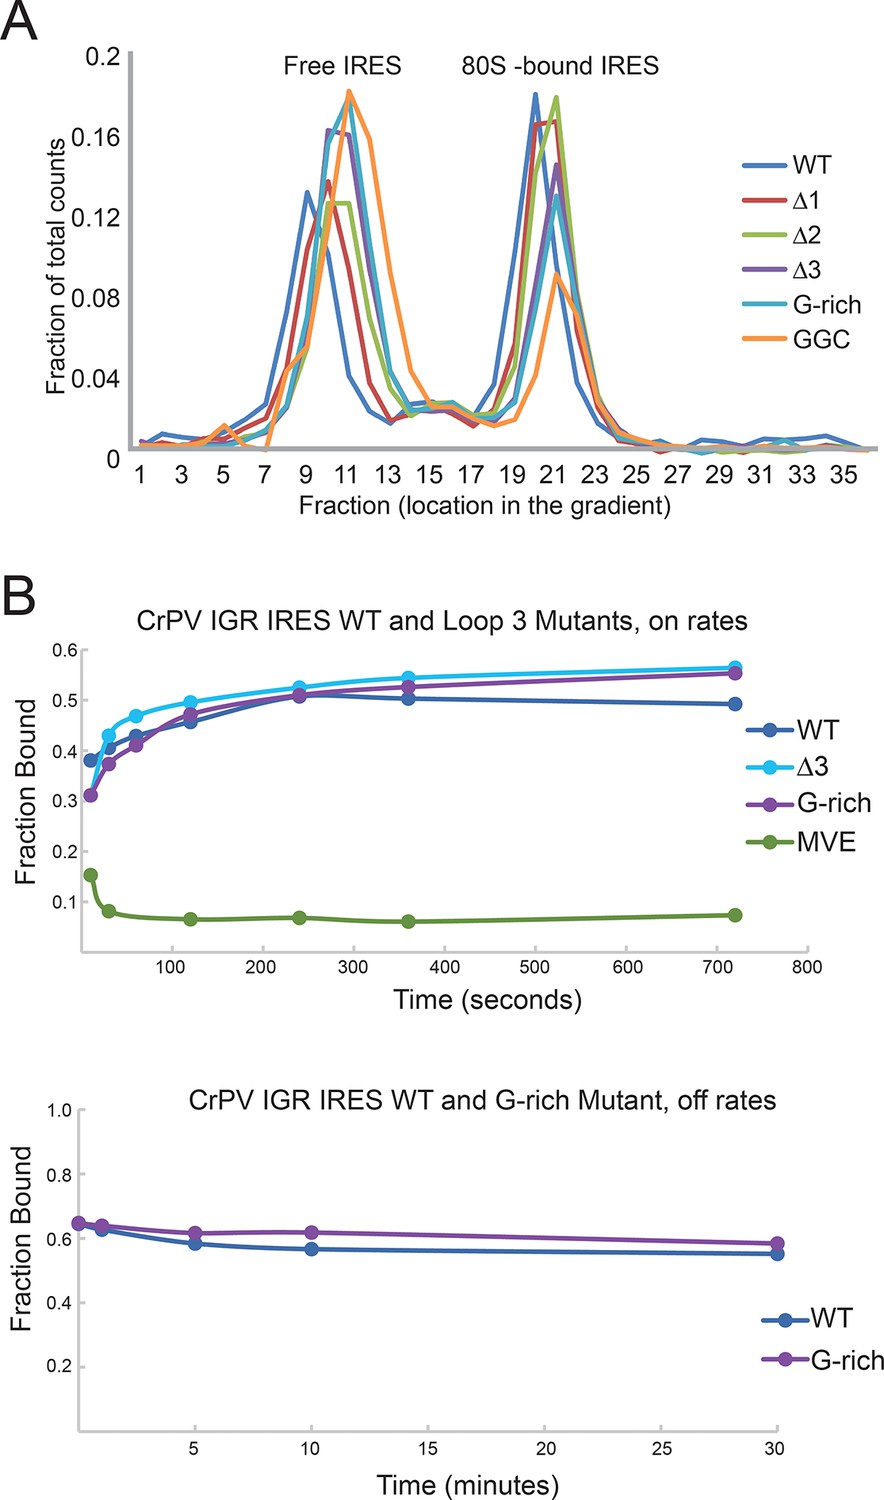
IGR IRES loop 3 mutants bind the 80S ribosomes.
(A) Assembly of 80S ribosomes on CrPV intergenic region (IGR) IRES loop 3 mutants in rabbit reticulocyte lysate. Radiolabeled CrPV IRES RNAs were incubated in RRL supplemented with hygromycin B for 20 min before separation of initiation complexes on a 15–30% sucrose gradient. Free and 80S-bound IRES complexes are indicated. (B) Approximate on- and off-rates of IRES-ribosome binding measured by filter binding. The on-rate experiment measures the association of IRES with ribosomes or ribosomal subunits as a function of time. Pure shrimp ribosomes were used for the on-rate experiment. The off-rate experiment used unlabeled competitor IRES RNA to detect dissociation of IRES from ribosomes as a function of time. Purified yeast subunits were used for the off-rate experiment.
Figure 3—figure supplement 2
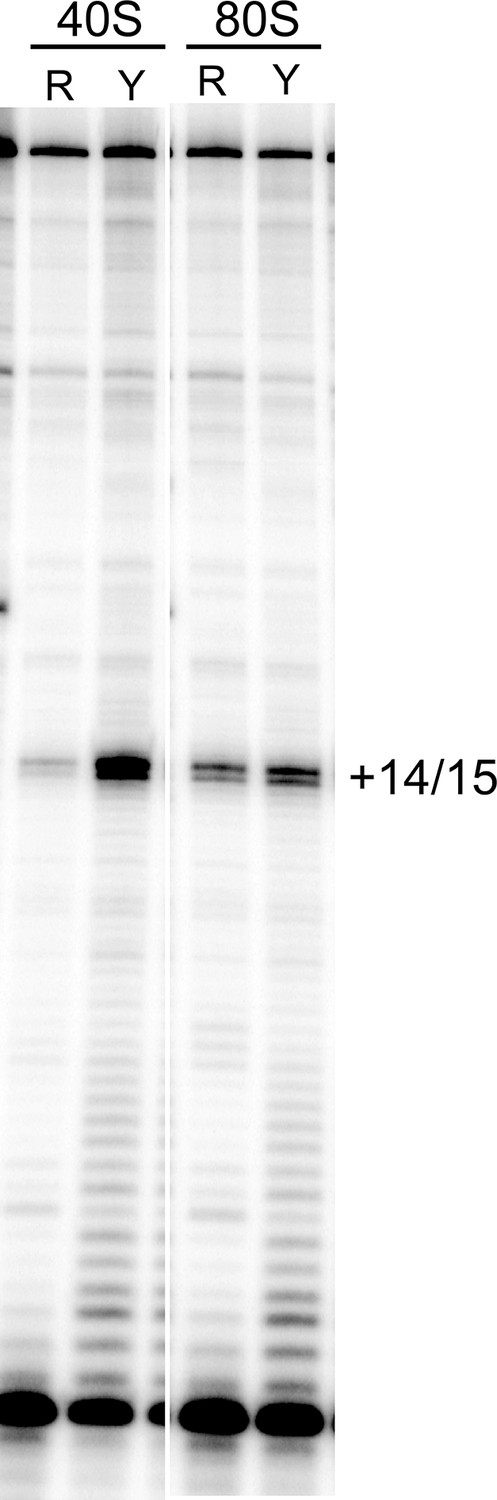
Toeprinting of WT CrPV IGR IRES with purified 40S subunits and 40S + 60S (80S) ribosomes from two sources.
R indicates rabbit; Y indicates yeast. The gel lanes shown are spliced from a single gel with irrelevant lanes removed. The locations of the toeprint with 40S and 80S are identical with both yeast and rabbit subunits.
Figure 4 with 1 supplement
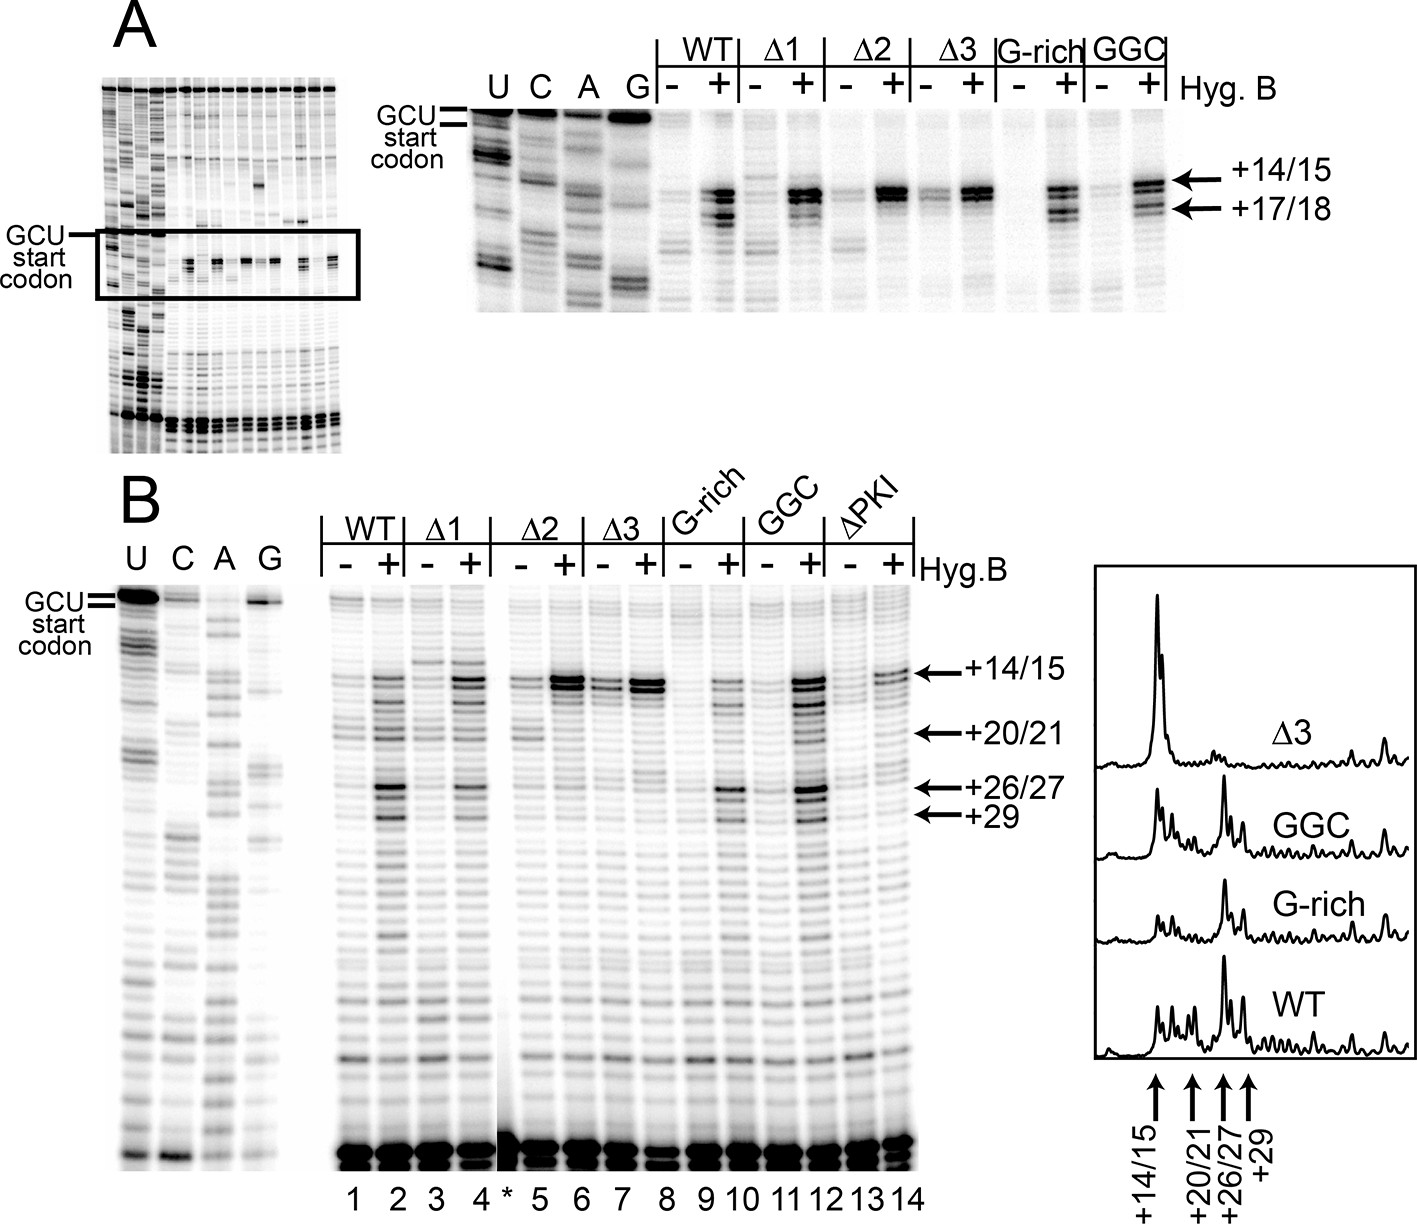
Toeprinting with hygromycin B.
(A) Toeprinting analysis in rabbit reticulocyte lysate (RRL) without or with 0.66 mg/mL hygromycin B (-/+). (B) Toeprinting analysis in RRL without or with 3.33 μg/mL hygromycin B (-/+) added after 1 min of incubation of the internal ribosome entry site (IRES) in lysate. Normalized traces of the wild type (WT), △3, G-rich, and GGC IRES RNAs in RRL+ hygromycin B are shown at right. Image is from a single gel, asterisk indicates where two irrelevant lanes were removed.
Figure 4—figure supplement 1
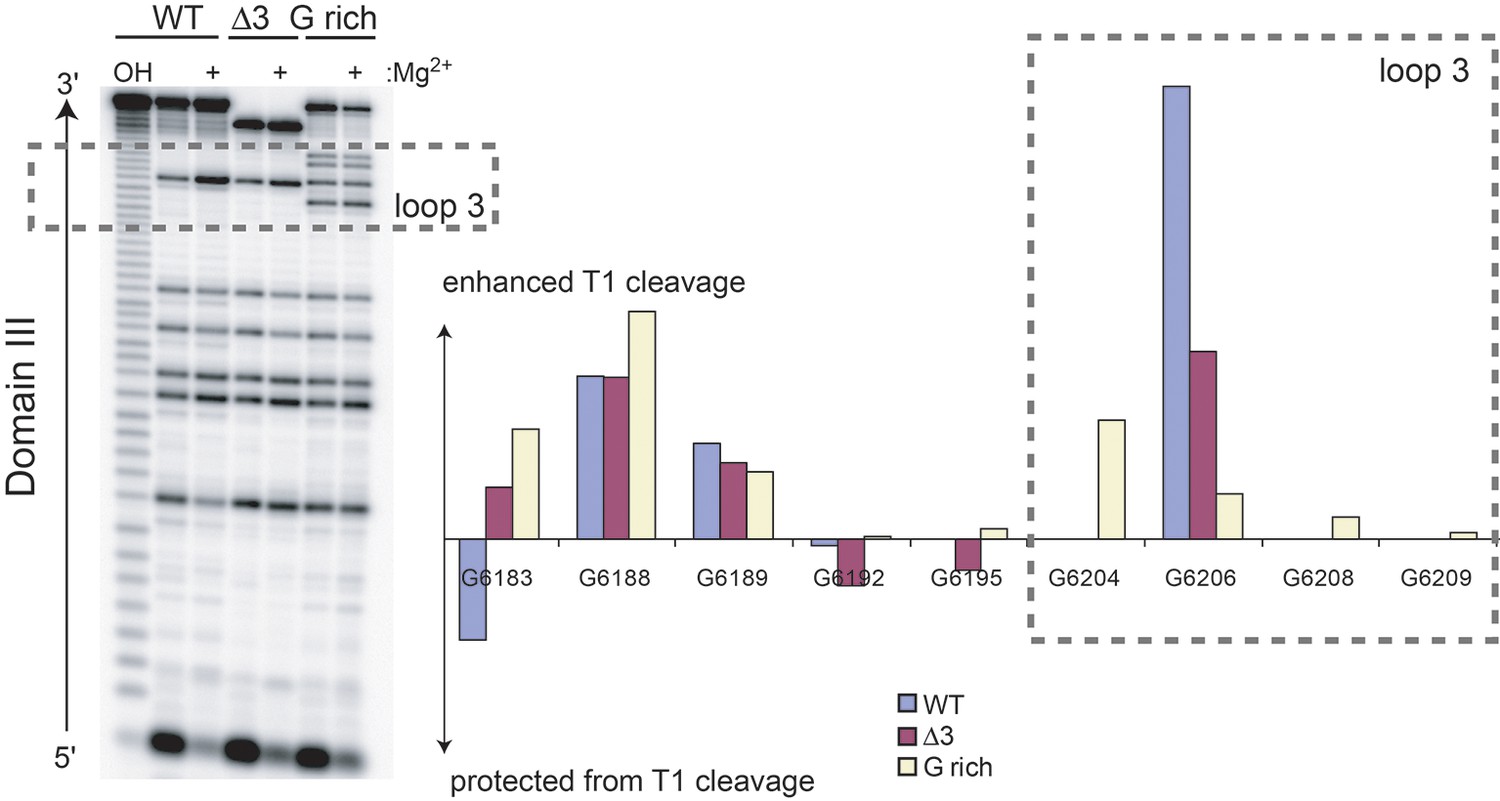
RNase T1 probing (single-stranded G bases) of unbound WT, △3, and G-rich Cricket Paralysis Virus (CrPV) intergenic region (IGR) IRES RNAs containing only domain III.
Cleavage products in the denatured (no Mg2+) and native (+ Mg2+) states were resolved next to a hydrolysis ladder (OH) on a sequencing gel (left). Graph shows the difference in RNase T1 cleavage in the native state minus the denatured state after normalizing the total amount of radiation in each lane to the WT, no Mg2+ levels. The dashed box indicates residues that are in loop 3. G 6204, 6208, and 6209 are specific to the G-rich mutant.
Figure 5 with 4 supplements
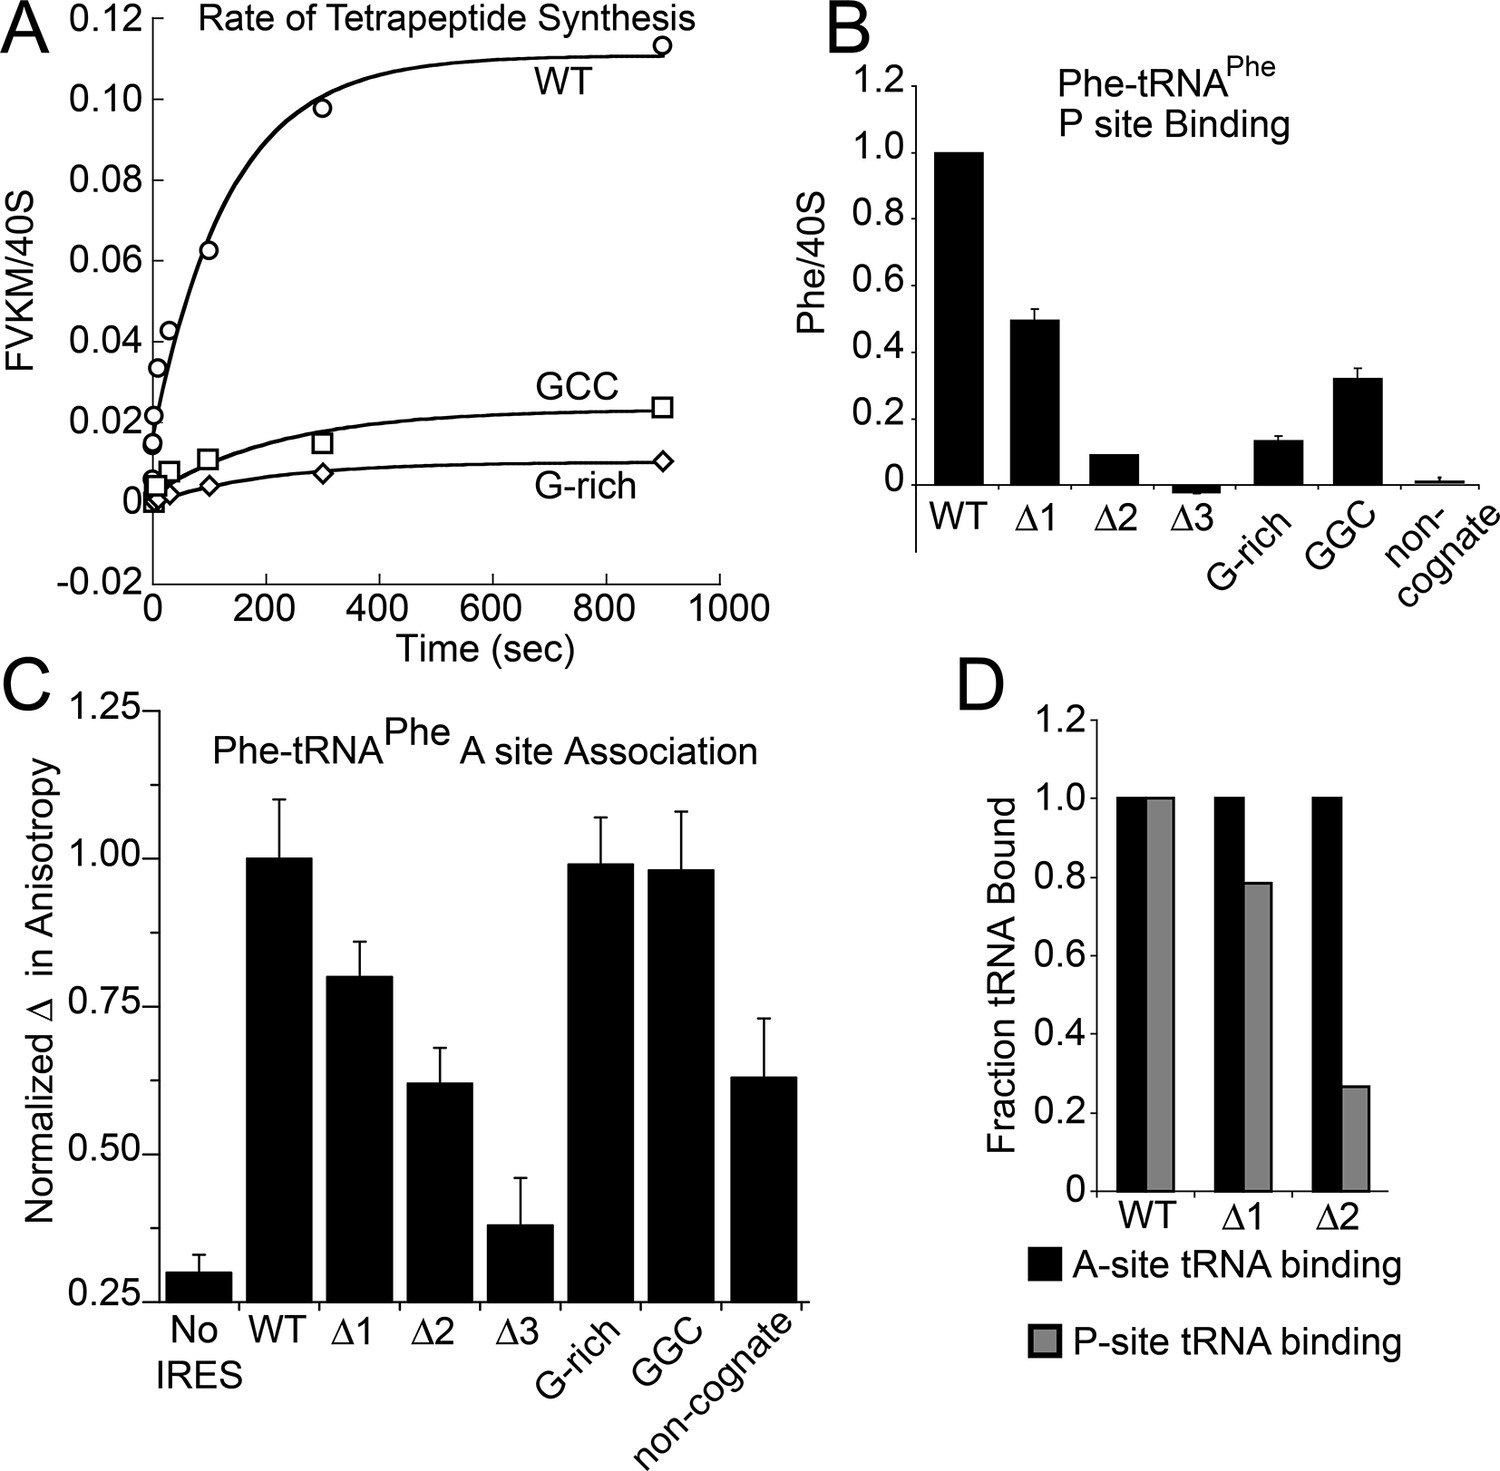
Characterization of early steps in intergenic region (IGR) internal ribosome entry site (IRES) initiation in a reconstituted translation system, using purified shrimp ribosomes and yeast elongation factors.
(A) Time course of tetrapeptide formation from tripeptide. Data are representative of two independent experiments. (B) [3H]Phe-tRNAPhe binding to the P site in the presence of eukaryotic elongation factor 2 (eEF2). Triplicate reads were averaged and normalized to set wild type (WT) equal to 1. (C) Anisotropy measurements of Phe-tRNAPhe(prf) binding to IRES–80S ribosome complexes. For each set of experiments performed, a determination was made of the anisotropy difference (△) between free ternary complex (TC) and TC added to the WT IRES–80S complex, and differences between TC added to other complexes and free TC were normalized to this value. Error bars represent one standard error from the mean of two–four replicates. (D) Translocation efficiency of ac-tRNA from the A to the P site in the △1 and △2 mutants. Data were normalized to set the anisotropy-based A site binding levels (data from C) to 1, and those factors were applied to the cosedimentation-based P site binding levels (data from B).
Figure 5—figure supplement 1
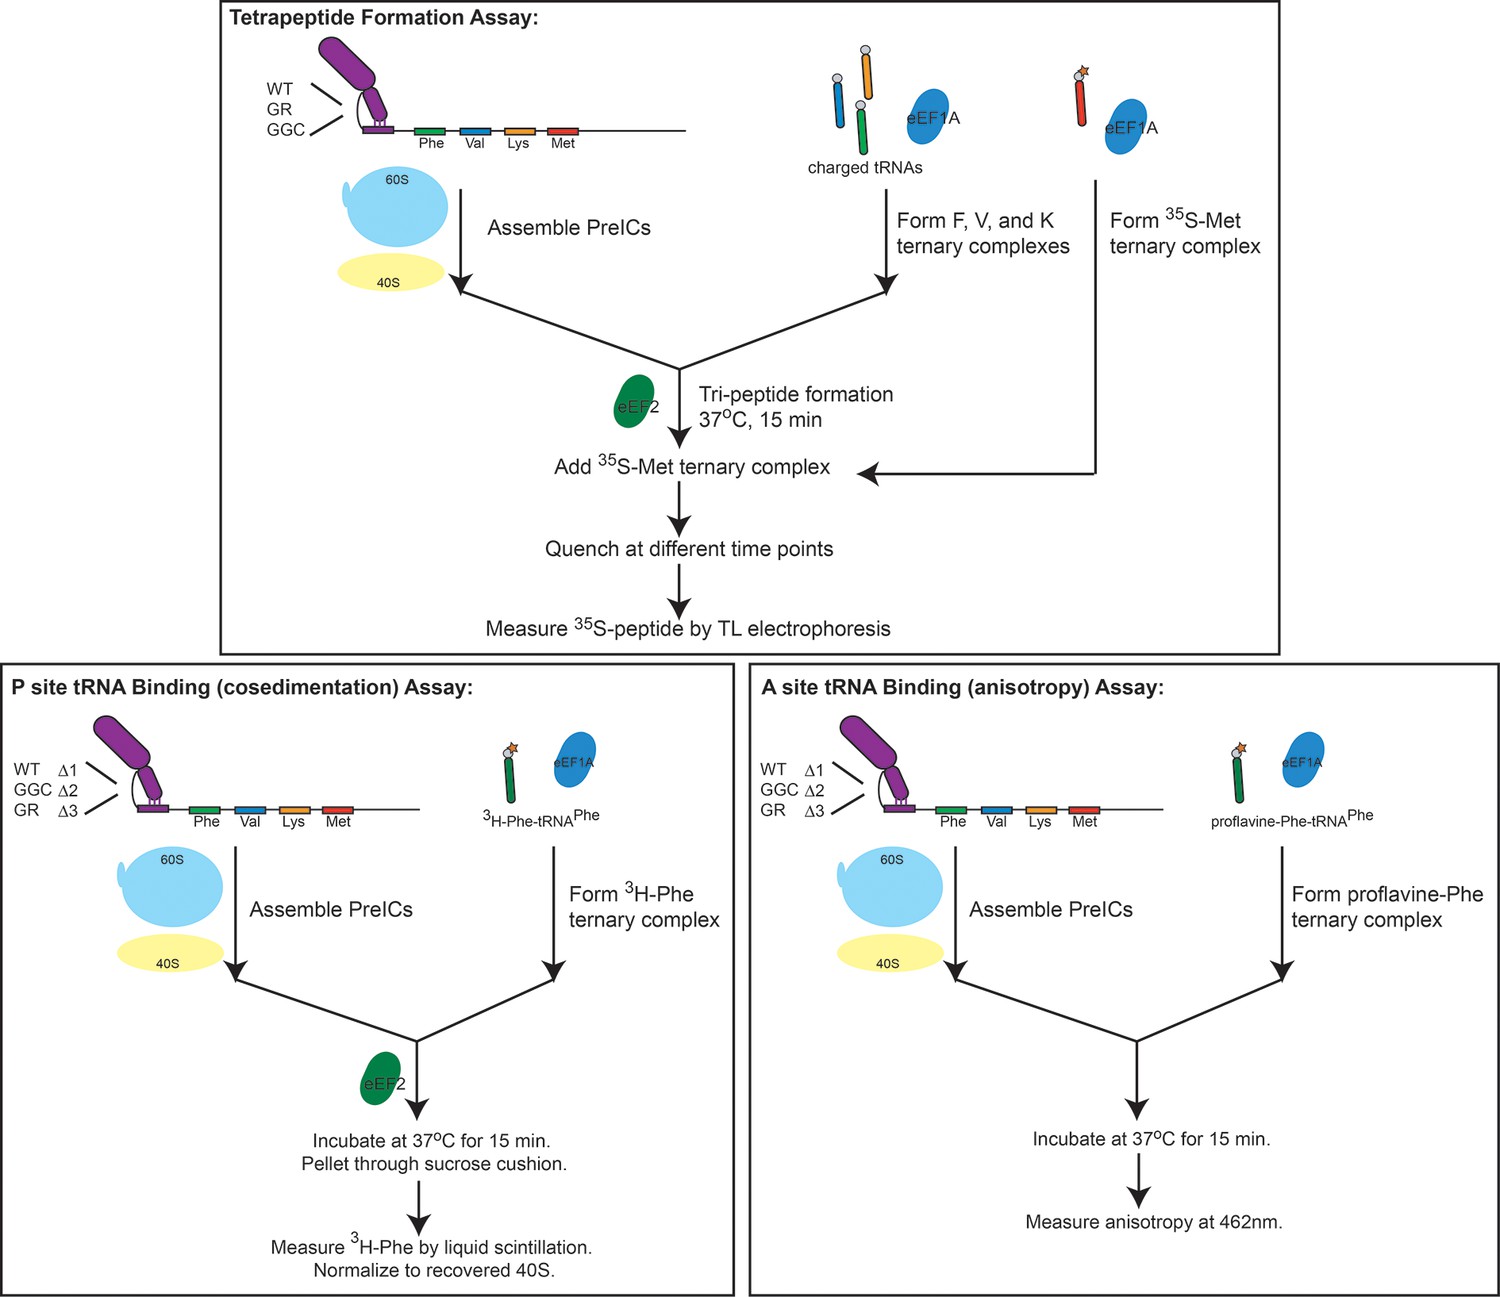
Schematic overviews of experiments performed in the reconstituted system.
Data from these experiments is presented in Figure 5. Top: Tetrapeptide formation assay. Initiation complexes with the IGR IRES and Artemia salina (shrimp) ribosomes were first assembled before adding TCs consisting of F-, V-, and K-charged tRNAs with eIF1A-GTP (the tRNA delivery factor) and eEF2-GTP (the translocase) to form tripeptides. These complexes were then combined with [35S]Met-tRNAMet TC, quenched with strong base, and the resultant peptides were analyzed by thin layer electrophoresis. Bottom left: P site tRNA binding by cosedimentation. Bottom right: A site tRNA binding by anisotropy. Details of the assays can be found in the supporting methods section.
Figure 5—figure supplement 2
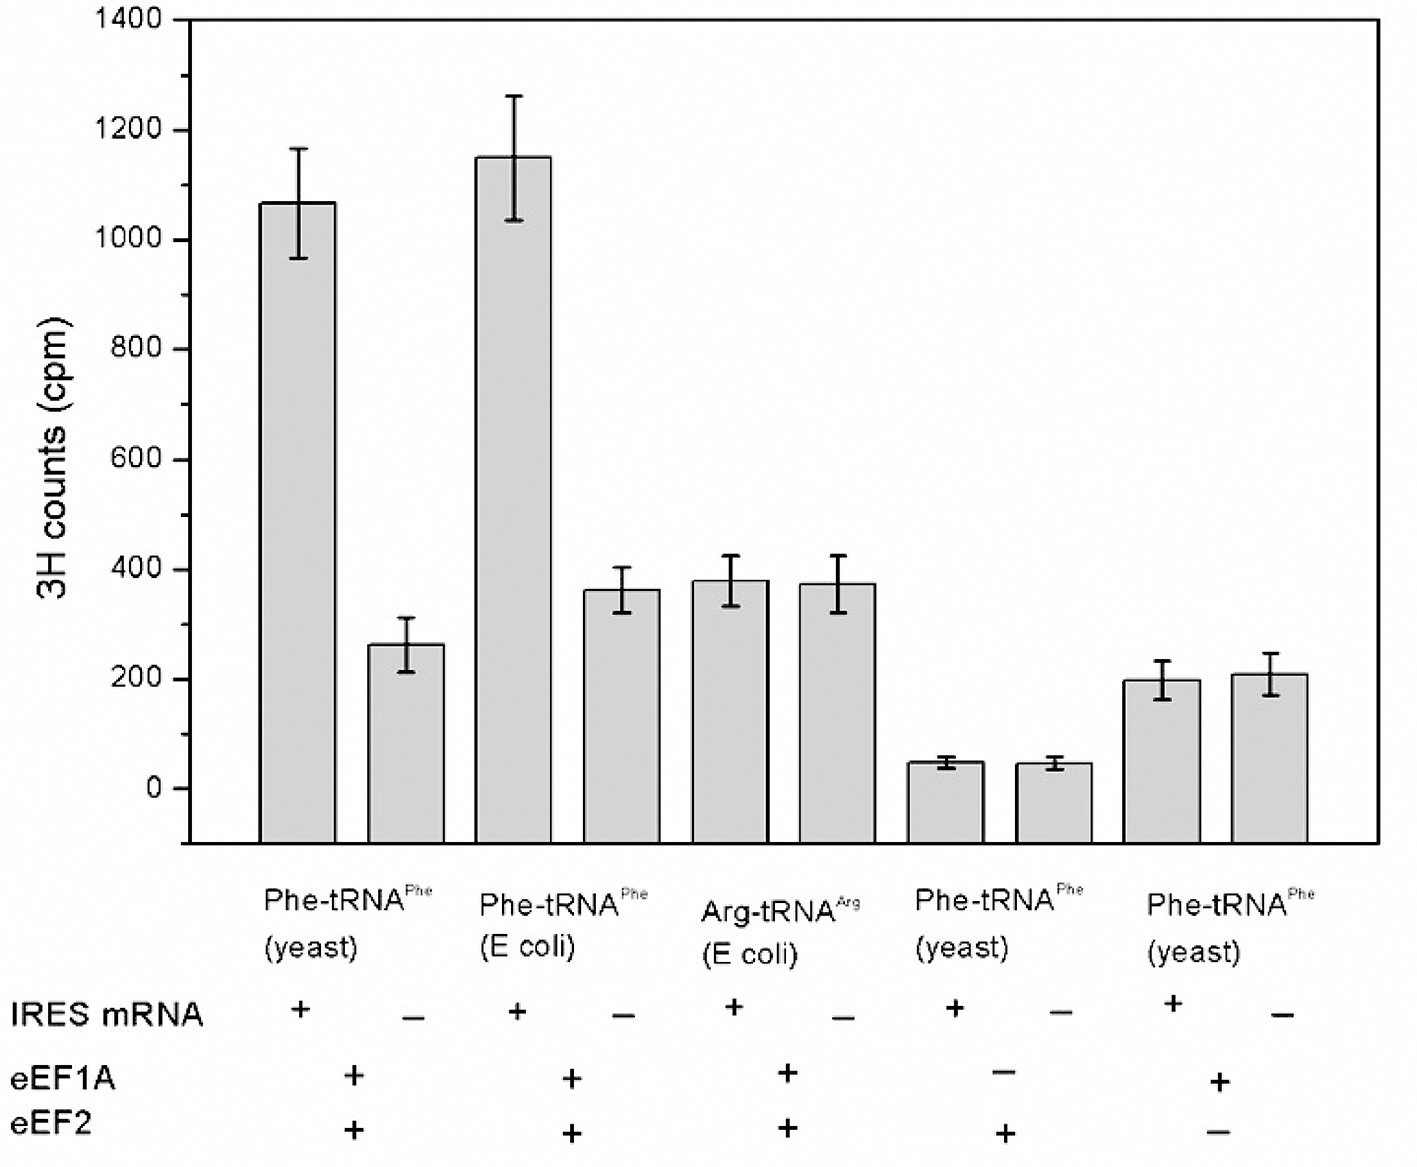
Codon- and factor-dependent tRNA binding to IRES–80S complexes.
The graph depicts the amount of Phe-tRNAPhe[3H] or Arg-tRNAArg[3H] recovered after cosedimentation with shrimp 80S ribosome complexes through a sucrose cushion. The IRES RNA construct is from the WT Cricket Paralysis Virus (CrPV) IGR IRES, but initiates with a UUC (Phe) codon. The identity and source of the isolated tRNA is indicated beneath the bars. The presence or absence of factor(s) and IRES RNA is indicated beneath the graph. Arg-tRNAArg was used as a control for association of non-cognate tRNA. Phe-tRNAPhe from yeast or Escherichia coli stably associates with the ribosomes in an eEF1A- and eEF2-dependent manner, while non-cognate Arg-tRNAArg did not. Omitting either elongation factor greatly decreased stable binding. Error bars represent one standard deviation from the mean.
Figure 5—figure supplement 3
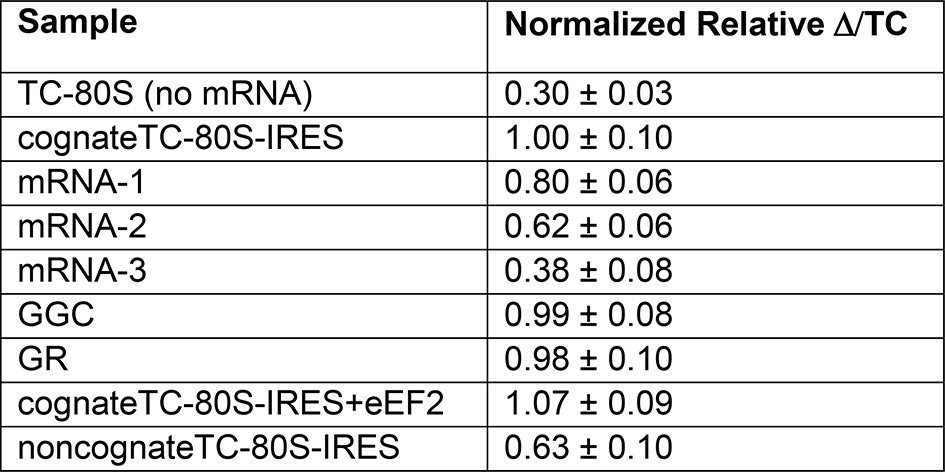
Normalized anisotropy data.
https://doi.org/10.7554/eLife.08146.017
Figure 5—figure supplement 4
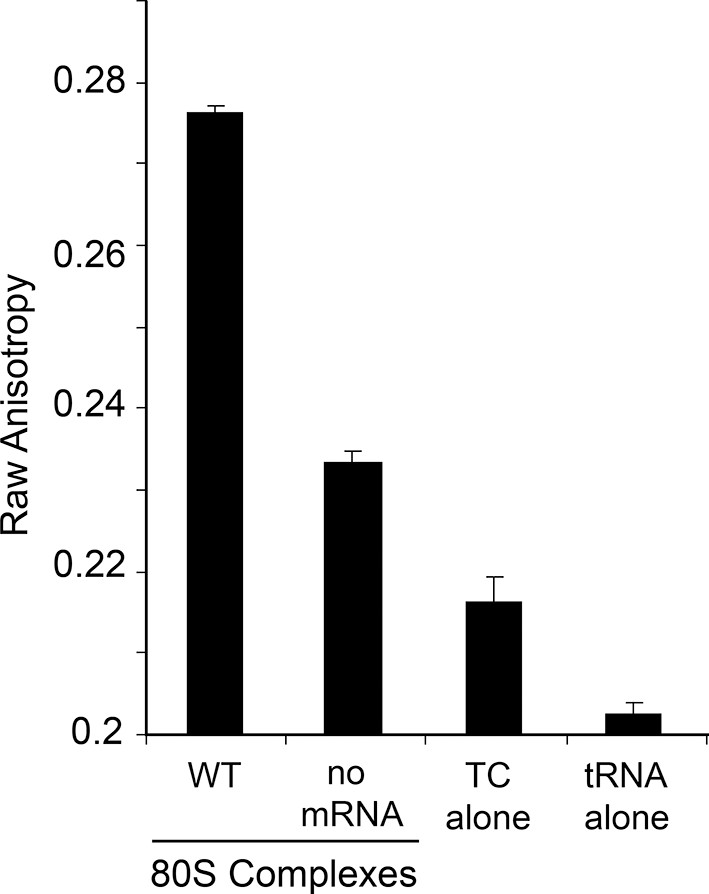
Raw anisotropy data of controls.
The anisotropy from the labeled tRNA shows a progressive increase as the mass of bound factors increases. The ‘no mRNA’ control shows the background level of tRNA+GTP+eEF1A to empty ribosomes. The presence of the IRES within the 80S ribosome causes a substantial increase in anisotropy. Error bars represent one standard error from the mean of 2–4 replicates.
Figure 6 with 1 supplement
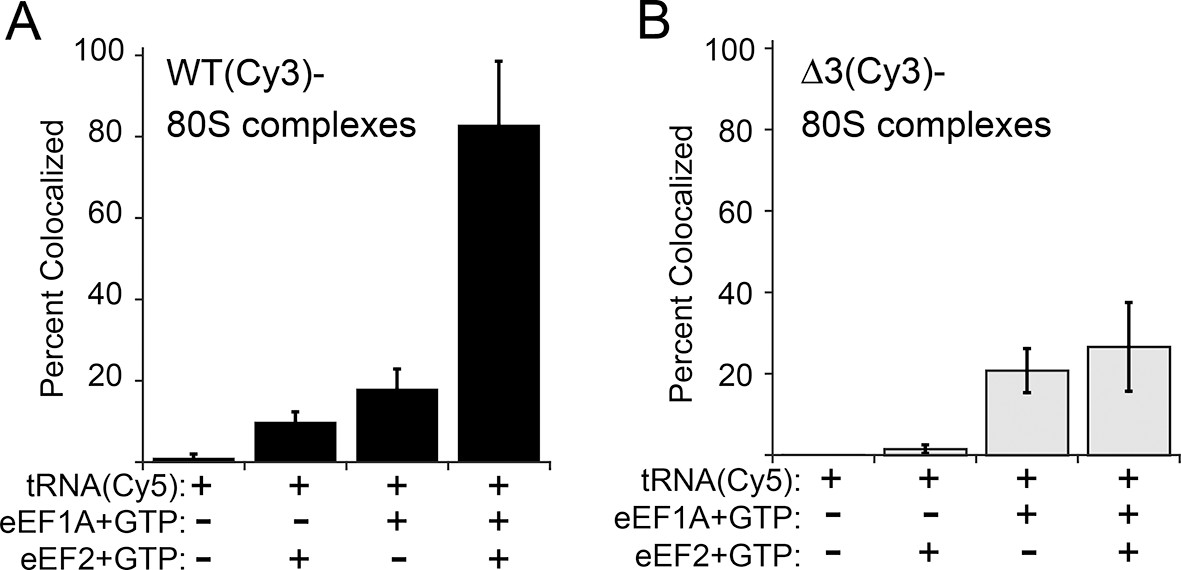
Effect of eukaryotic elongation factor 2 (eEF2) on colocalization of Phe-tRNAPhe(Cy5) with individual 80S ribosome–internal ribosome entry site (IRES) complexes formed with either wild type (WT) (Cy3) IRES or △3(Cy3) IRES.
Addition of elongation factors and Phe-tRNAPhe(Cy5) (tRNA(Cy5)) to 80S ribosome–IRES complexes formed with either (A) WT(Cy3) IRES (black bars) or (B) △3(Cy3) IRES (gray bars) are depicted as percent Cy3-Cy5 colocalized spots. The presence or absence of factor(s) is indicated beneath the graphs and error bars represent one standard deviation from the mean. Elongation factors and ribosomes are from yeast.
Figure 6—figure supplement 1
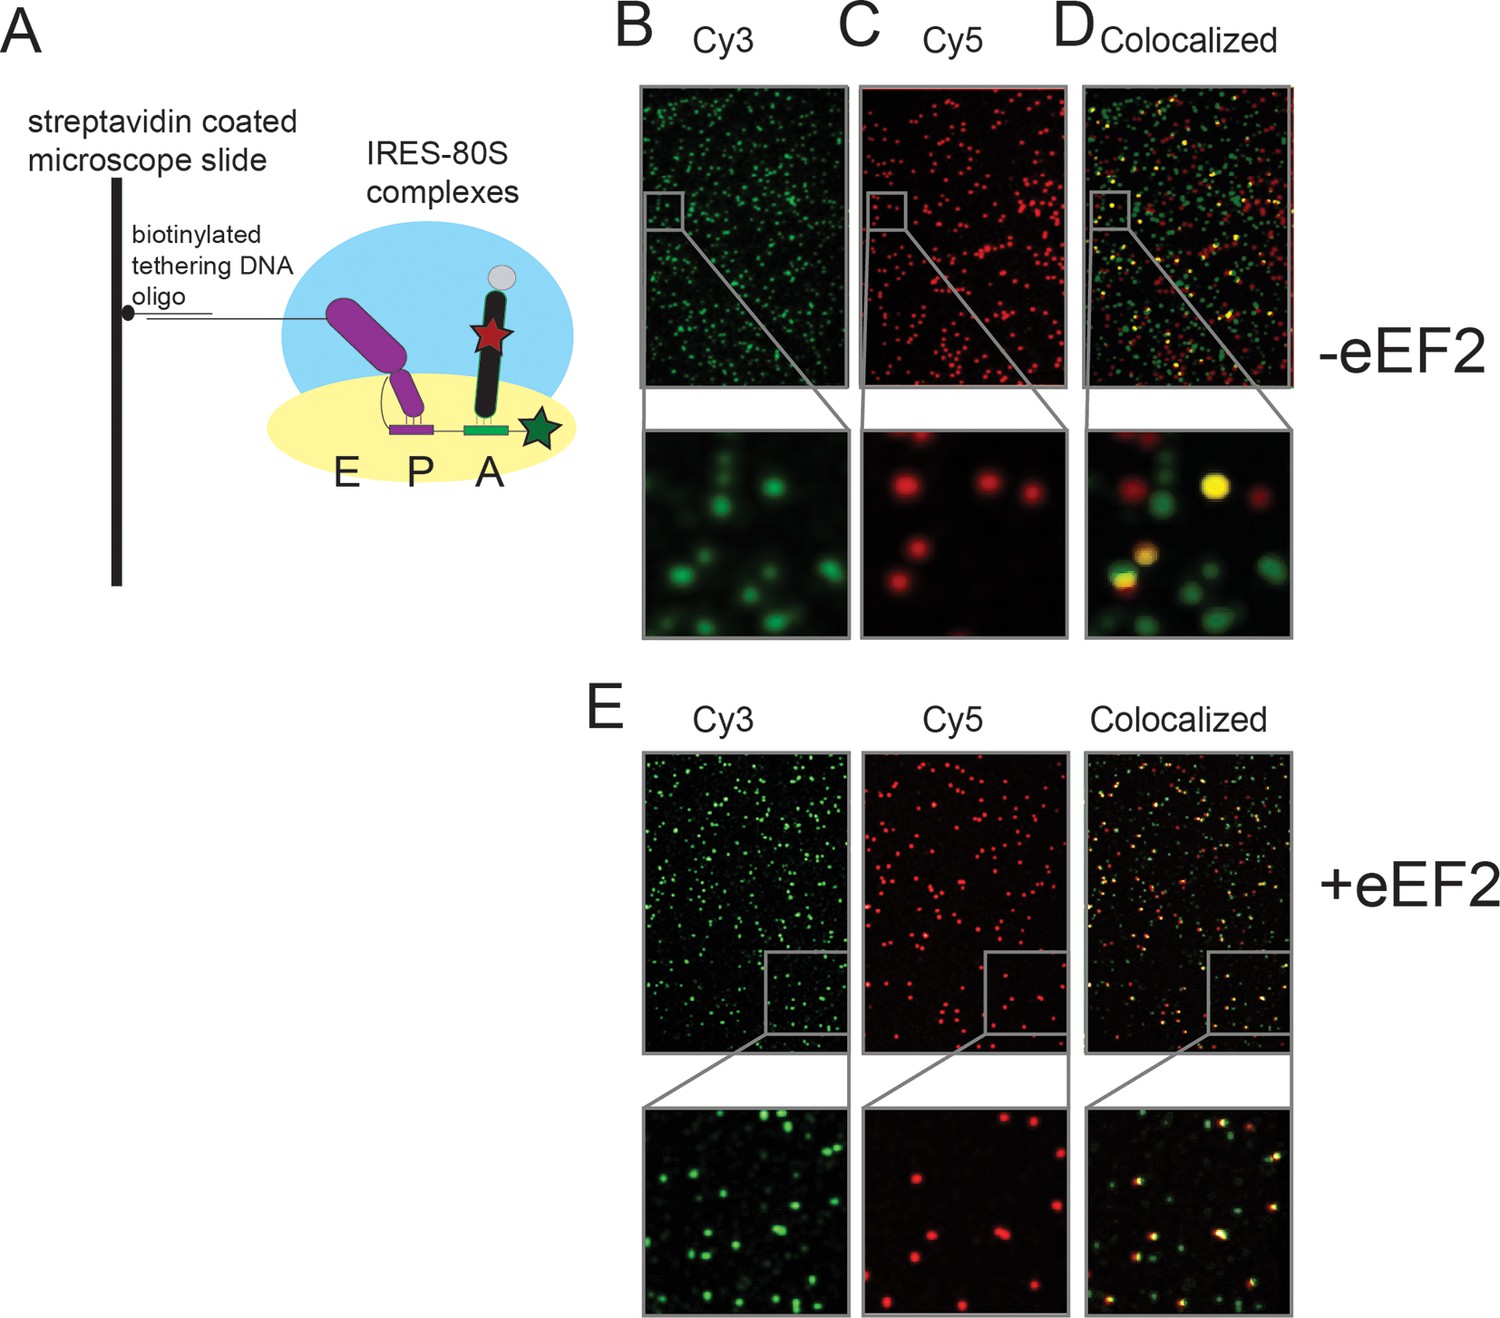
Schematic of the single-molecule colocalization experiments.
(A) 80S complexes (with yeast ribosomes) were assembled on IRES (Cy3) molecules (hybridized to a biotinylated DNA) that were tethered to microscope slide surfaces coated with polyethylene glycol (PEG)-Biotin via a streptavidin bridge. In the cartoon shown here, the wild-type IRES has undergone the first pseudotranslocation event so that domain 3 sits at the P site and the Phe-tRNAPhe (Cy5) is delivered to the A site by eEF1A (tRNA from Escherichia coli), thereby generating a surface-tethered complex with spatially colocalized Cy3 and Cy5 spots. Sample Cy3 and Cy5 frames from an experiment in which Phe-tRNAPhe (Cy5) was delivered as a ternary complex with eEF1A and GTP, to yeast 80S complexes assembled on WT Cricket Paralysis Virus (CrPV) IRES (Cy3), are depicted in (B) and (C), respectively. The imaged Cy3 and Cy5 spots in these frames are false colored as green and red, respectively. (D) Superposition of the two frames in which regions that appear to have colocalized green and red spots, just by manual inspection, are false colored as yellow for visual clarity; the actual analysis of the extent of colocalization involves a much more rigorous mathematical treatment of the raw data using home-built codes. The panels below (B)–(D) show a representative region from the corresponding frames, magnified 6x, to demonstrate the well-resolved distribution of spots and the precision of colocalization. (E) Identical images as (B–D), except in the presence of eEF2, which results in higher levels of colocalization.
Tables
Table 1
Activity of IGR IRESs in RRL and mutations tested.
| Virus | WT activity | Loop 3 mutants tested* | ||
|---|---|---|---|---|
| Class I | G-rich | △3 | Conserved | |
| CrPV | ++++ | |||
| HiPV | + | |||
| HoCV | + | UUAGGGGCCG | UUAGA - - - CA | |
| PSIV | + | |||
| Class II | ||||
| ABPV | ++++ | |||
| IAPV | +++++ | GAGGUGCCA | GGAAUACCA | |
| KBV | ++ | GAAGUGCCG | GAAAUA - - - | |
| SInV | ++++ | |||
| TSV | + | |||
-
*Site of mutation is shown in bold italics. Site of deletion is shown as a dash. ABPV, Acute Bee Paralysis Virus; CrPV, Cricket Paralysis Virus (CrPV); HiPV, Himetobi P Virus; HoCV, Homalodisca coagulata Virus; IAPV, Israeli Acute Paralysis Virus; IGR, intergenic region; IRES, internal ribosome entry site; KBV, Kashmir Bee Virus; PSIV, Plautia stali Intestinal Virus; RRL, rabbit reticulocyte lysate; SInV, Solenopsis invicta Virus-1; TSV, Taura Syndrome Virus.
Download links
A two-part list of links to download the article, or parts of the article, in various formats.
Downloads (link to download the article as PDF)
Open citations (links to open the citations from this article in various online reference manager services)
Cite this article (links to download the citations from this article in formats compatible with various reference manager tools)
A dynamic RNA loop in an IRES affects multiple steps of elongation factor-mediated translation initiation
eLife 4:e08146.
https://doi.org/10.7554/eLife.08146


