Erk regulation of actin capping and bundling by Eps8 promotes cortex tension and leader bleb-based migration
- National Institutes of Health, United States
- Florida State University, United States
Figures
Figure 1 with 2 supplements
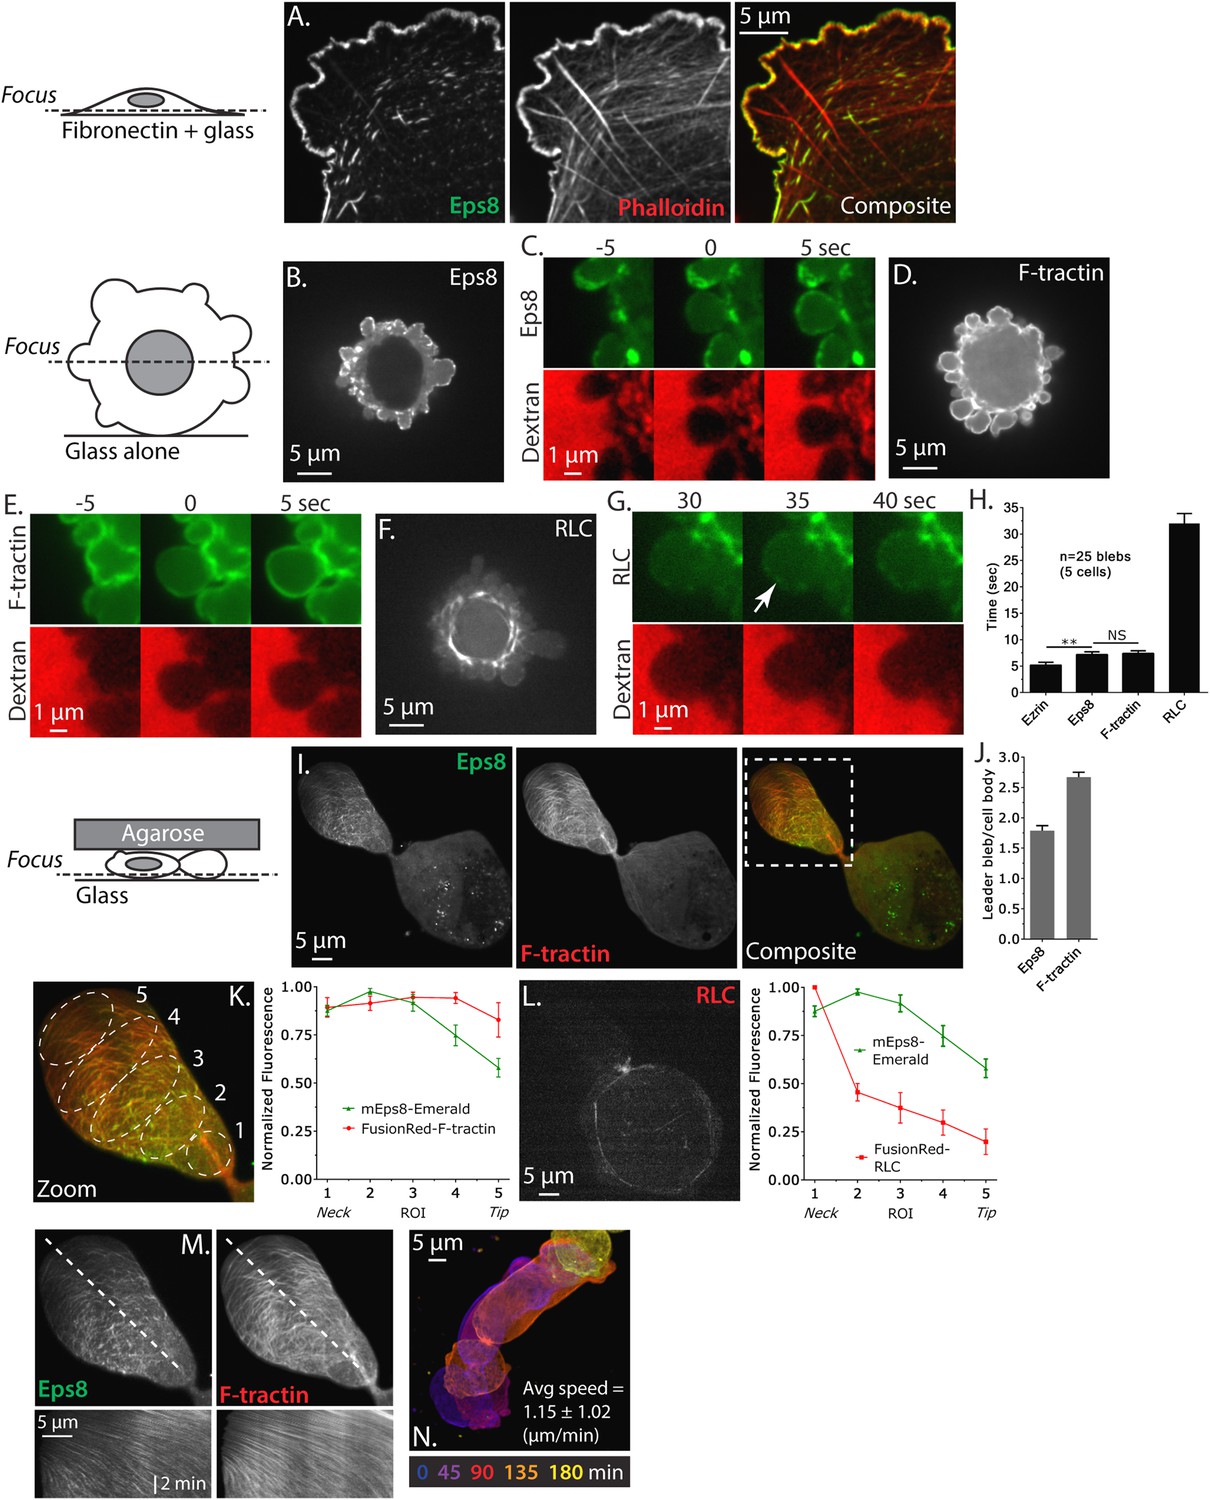
Eps8 is recruited early to bleb membranes and forms a gradient across the length of a ‘leader bleb.’
(A) Confocal image of the ventral Z-plane of human A375 melanoma cells expressing Emerald-tagged mouse Eps8 (green) plated on fibronectin-coated glass and stained with phalloidin (red). (B–G) Confocal images through the central Z-plane of A375 cells plated on uncoated glass. (B) Cell expressing Emerald-mEps8. (C) Time-lapse series of Emerald-mEps8 (green) and rhodamine-dextran (red) used as a negative stain in the culture media to detect the position of the cell boundary. Times in (C, E, G) indicate seconds after the formation of a new bleb. (D) Cell expressing Emerald-tagged F-tractin to label actin filaments. (E) Time-lapse series of Emerald-F-tractin and rhodamine-dextran. (F) Cell expressing EGFP-tagged myosin II regulatory light chain (EGFP-RLC). (G) Time-lapse series of EGFP-RLC and rhodamine-dextran. (H) Quantification of the average time of appearance of EGFP or Emerald-tagged cortical proteins (EGFP-Ezrin, Emerald-mEps8, Emerald-F-tractin, and EGFP-RLC) relative to the time of maximal membrane protrusion determined from time-lapse series similar to those shown in (C, E, G). (I–K–N) Confocal images through the ventral Z-plane of A375 cells plated on uncoated glass and confined under an agar slab. (I) Cell co-expressing Emerald-mEps8 (green) and FusionRed-F-tractin (red). Boxed area is shown zoomed in (K). (J) Average ratio of fluorescence in the leader bleb to that in the cell body for Emerald-mEps8 and FusionRed-F-tractin. (K) (Left) Example of 5 regions of interest (ROIs), each 20% of the length of the leader bleb, used for (Right) regional analysis of the average fluorescence (normalized to maximum) of Emerald-mEps8 (green) and FusionRed-F-tractin (red) along leader blebs. (L) (Left) Image and (right) regional analysis of FusionRed-RLC (red) and Emerald-mEps8 (green, image not shown) fluorescence in leader blebs. (M) (Top) Image showing the position (dotted line) along which kymographs (bottom) of Emerald-mEps8 and FusionRed-F-tractin were made from time-lapse videos of their dynamics in leader blebs. Scale bar: 2 min (N) Color encoded time-overlay of images of Emerald-F-tractin in a migrating cell. Error is SEM, *p ≤ 0.05, **p ≤ 0.01, ***p ≤ 0.001, ****p ≤ 0.0001, NS: p > 0.05. See also Videos 1–3.
Figure 1—figure supplement 1
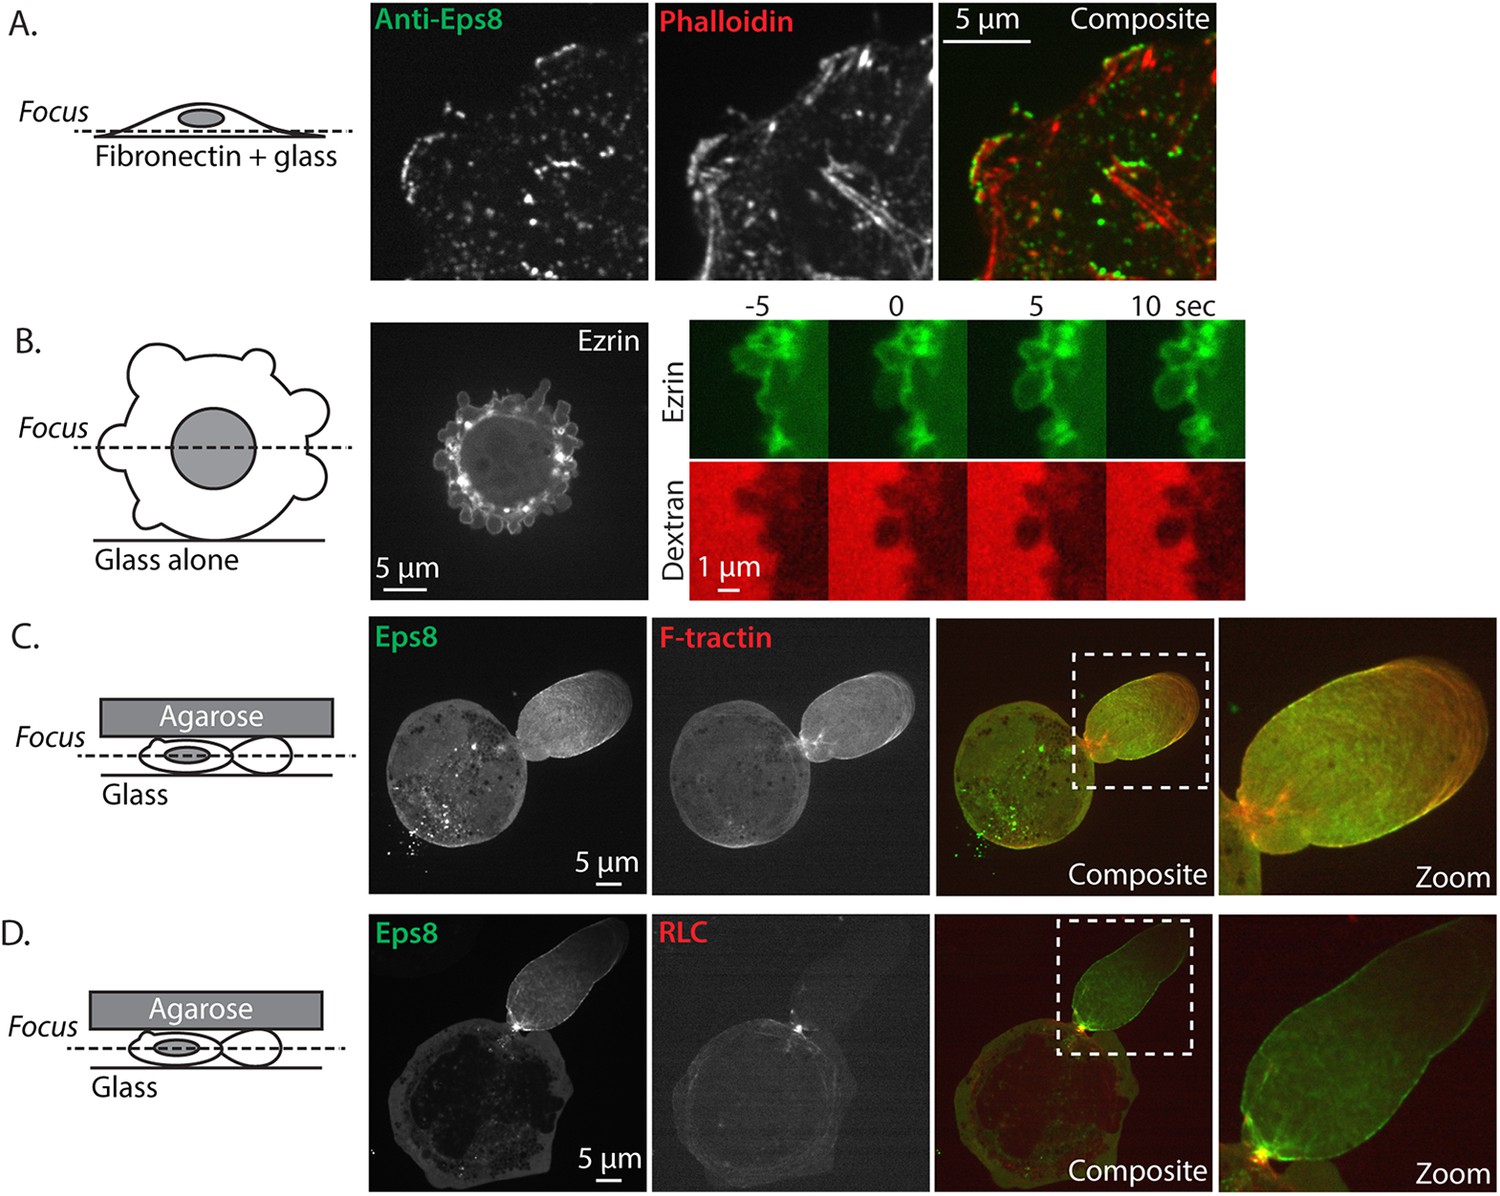
Eps8 and ezrin localization.
(A) Confocal image of the ventral Z-plane of human melanoma A375 cells spread on fibronectin-coated glass and immunostained for endogenous Eps8 (green) and phalloidin to stain actin (red). (B) (Left) Central Z-plane confocal image of EGFP tagged ezrin in cells plated on uncoated glass. (Right) time-lapse series of EGFP-ezrin (green) and rhodamine-dextran (red) used as a negative stain in the culture media to detect the position of the cell membrane. Time (sec) relative to the formation of a bleb. (C, D) Cells confined between uncoated glass and an agar slab, boxed areas shown zoomed to the right. (C) Confocal image of the central Z-plane of Emerald-mEps8 (green) co-expressed with FusionRed-F-tractin (red). (D) Central Z-plane of Emerald-mEps8 (green) and FusionRed-myosin II regulatory light chain (RLC, red) in cells confined between uncoated glass and an agar slab.
Figure 1—figure supplement 2
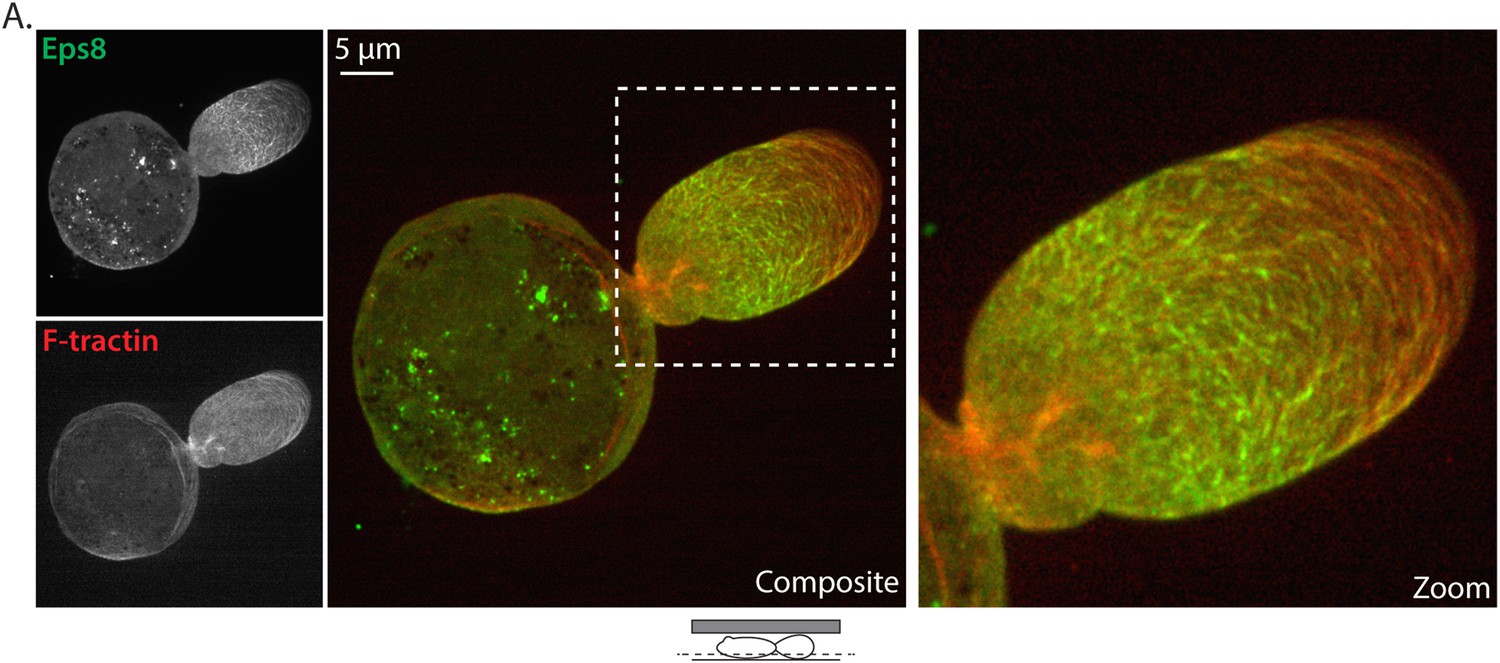
Detailed view of Eps8 and actin localization.
(A) Confocal image of the ventral Z-plane of an A375 cell confined between uncoated glass and an agar slab that was expressing Emerald-mEps8 (green, upper left) and FusionRed-F-tractin to stain actin (red, lower left). Higher magnification views of color-encoded overlay shown at (center) and (right).
Figure 2 with 2 supplements
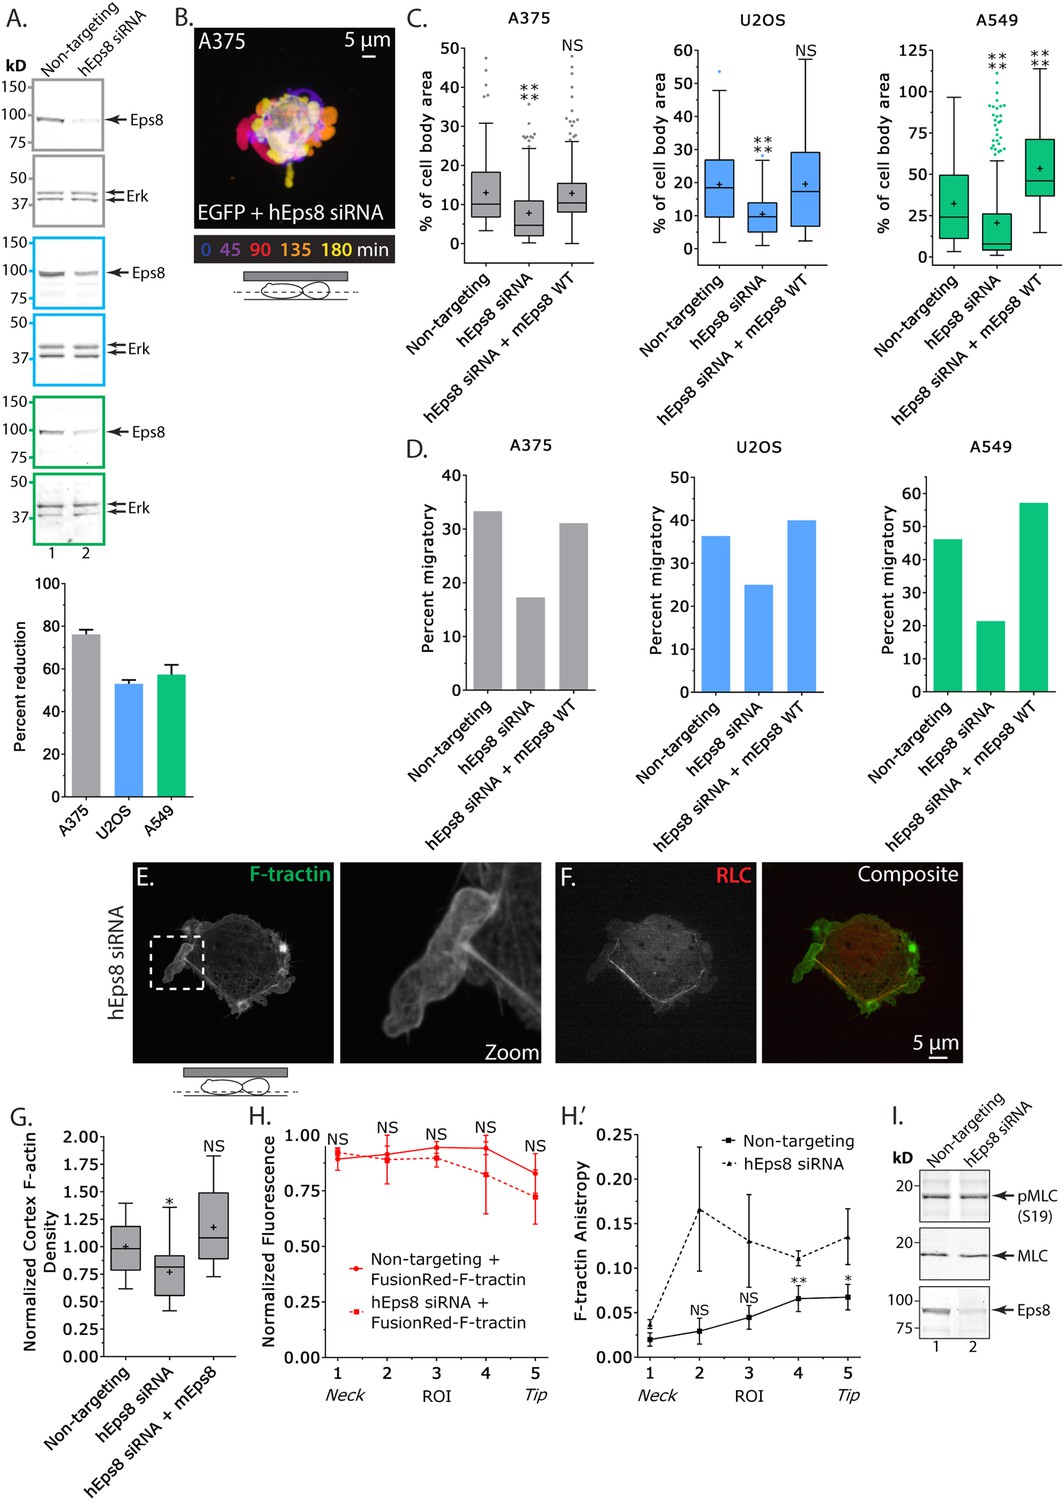
Eps8 promotes leader bleb-based migration by maintaining actin bundles towards the distal bleb tip.
(A) (Left) Representative blot and (right) quantitation of Western blot analyses of Eps8 and Erk in lysates of A375 (gray), U20S (blue) and A549 (green) cells that were treated with non-targeting siRNAs (non-targeting) or siRNAs targeting human Eps8 to deplete Eps8 (hEps8 siRNA). (B–H) Images and analyses of cells plated on glass and confined under an agar slab. (B) Color encoded time-overlay of confocal images through the central Z-plane of an A375 cell depleted of Eps8 and expressing soluble EGFP. (C, G) Tukey box plots showing (C) quantification of leader bleb area expressed as a % of cell body area for cells treated with non-targeting or Eps8 siRNAs, with or without the additional expression of mouse Eps8 (mEps8 WT). ‘+’ and line denote the mean and median, respectively. (D) Quantitation of the percent of cells that migrate from time-lapse phase contrast videos, treatments as in (C). (E, F) Confocal images through the ventral Z-plane of an A375 cell depleted of Eps8 and expressing Emerald-F-tractin (E) and FusionRed-myosin II regulatory light chain ((F), RLC), boxed area in E shown at right, overlay of (E) and (F) shown at left of (F). (G) Analysis of cortical actin density in A375 cells (see Materials and methods) in the cell body from images of phalloidin, treatments as in (C), normalized to the mean value of non-targeting control. (H) Regional analysis of the average fluorescence intensity (H, normalized to maximum) and bundle anisotropy (H′) of FusionRed-F-tractin along leader blebs in A375 cells treated with either non-targeting or human Eps8 siRNAs. Each point represents the average value in a region of interest (ROI) that is 20% of the length of the leader bleb. (I) Western blot analyses of Eps8, myosin II regulatory light chain (MLC), and myosin II regulatory light chain phosphorylated on serine 19 (pMLC (S19)) in lysates of A375 cells that were treated with non-targeting siRNAs (non-targeting) or siRNAs targeting human Eps8 to deplete Eps8 (hEps8 siRNA). Error in (A, H) is SEM, *p ≤ 0.05, **p ≤ 0.01, ***p ≤ 0.001, ****p ≤ 0.0001, NS: p > 0.05.
Figure 2—figure supplement 1
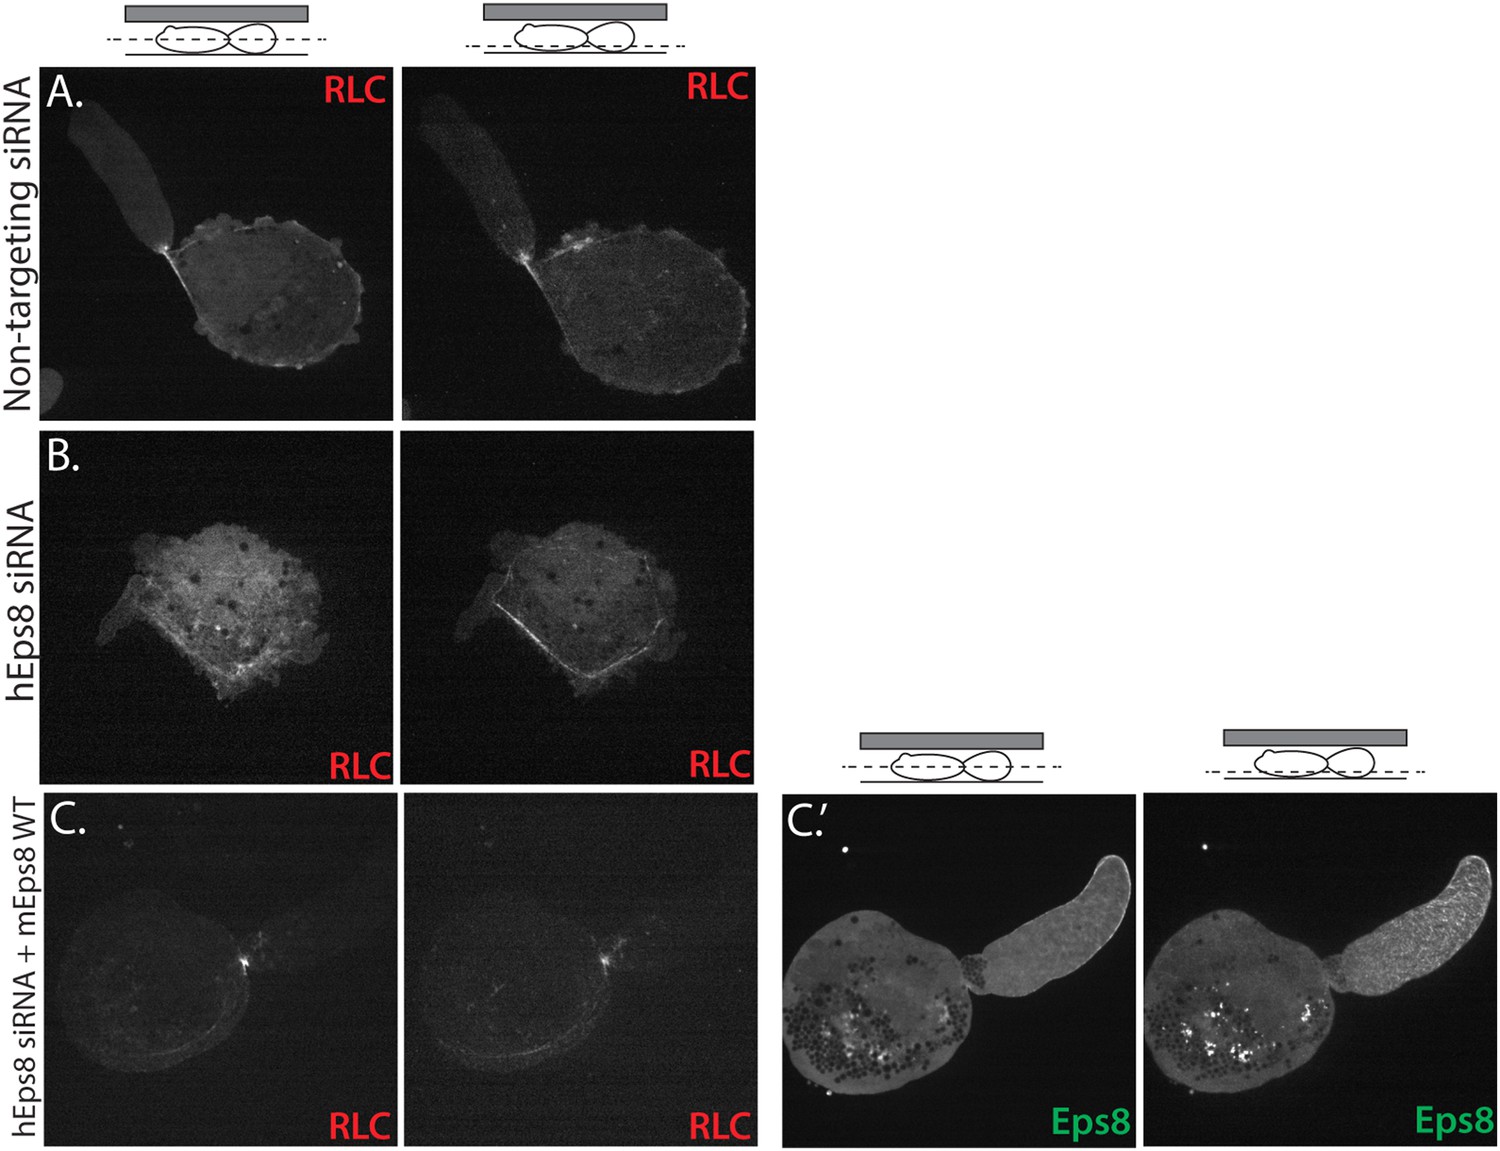
Myosin II localization is unperturbed in human melanoma A375 cells depleted of and rescued with Eps8.
(A–C) Confocal images of A375 cells confined between uncoated glass and an agar slab, magnification is the same in all panels. (Left) Central and (right) ventral Z-plane confocal images of FusionRed-myosin II regulatory light chain (RLC (red)) in cells treated with (A) non-targeting siRNA or (B, C) siRNA directed towards human Eps8 (hEps8 siRNA) with (C) or without (A, B) the additional expression of Emerald-tagged mouse Eps8 (mEps8) and FusionRed-RLC (red).
Figure 2—figure supplement 2
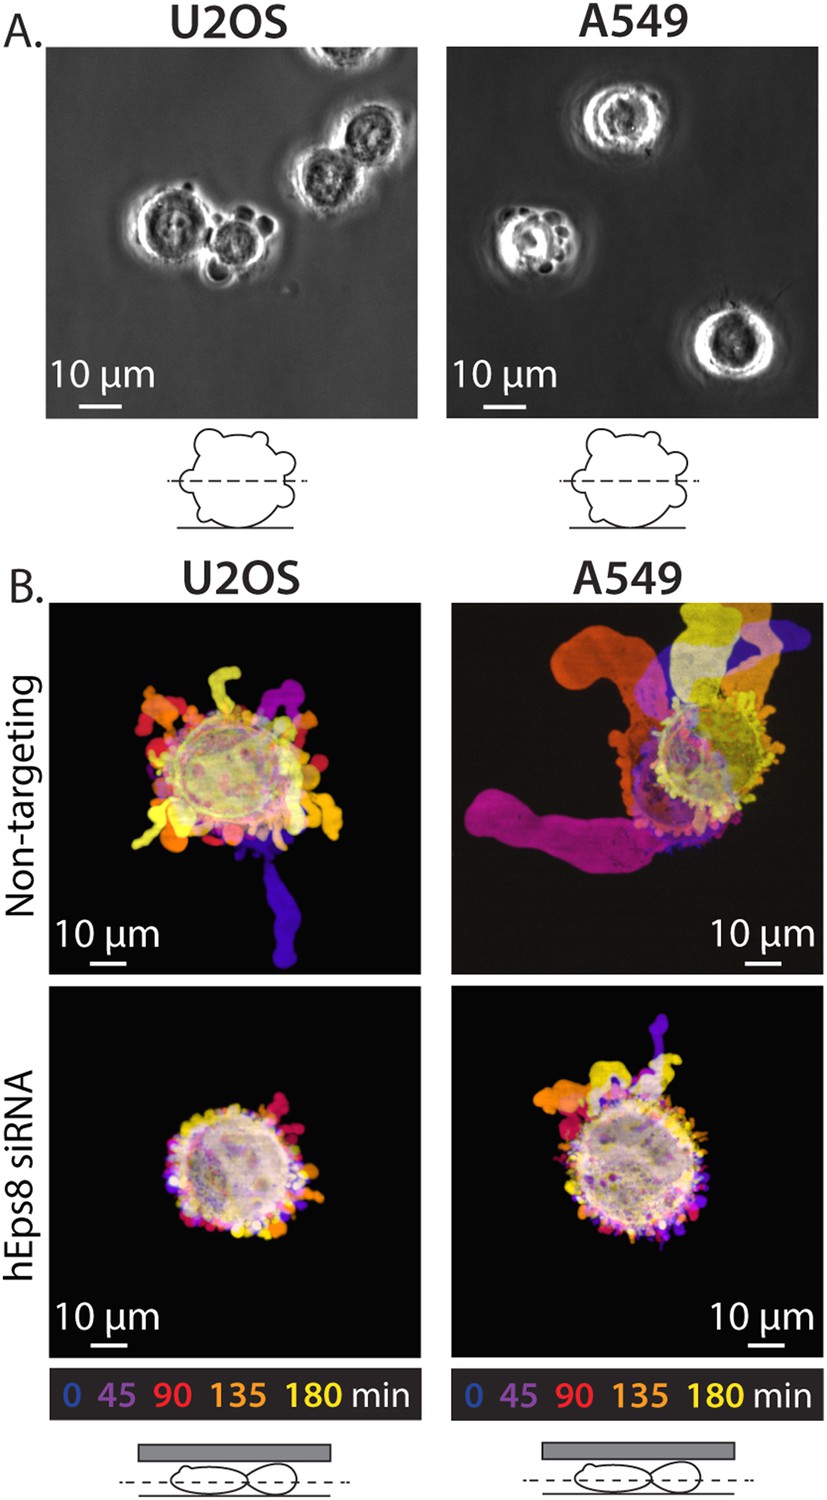
Eps8 is required for leader bleb formation in A549 and U2OS cells.
(A) Phase contrast image of an A549 cells (Left) or a U20S cells (right) plated on uncoated glass coverslip. (B) Color encoded time-overlay of confocal images through the central Z-plane of an A549 cell (left) or a U20S cell (right) depleted of Eps8 and expressing soluble EGFP and confined between uncoated glass and an agar slab.
Figure 3 with 1 supplement
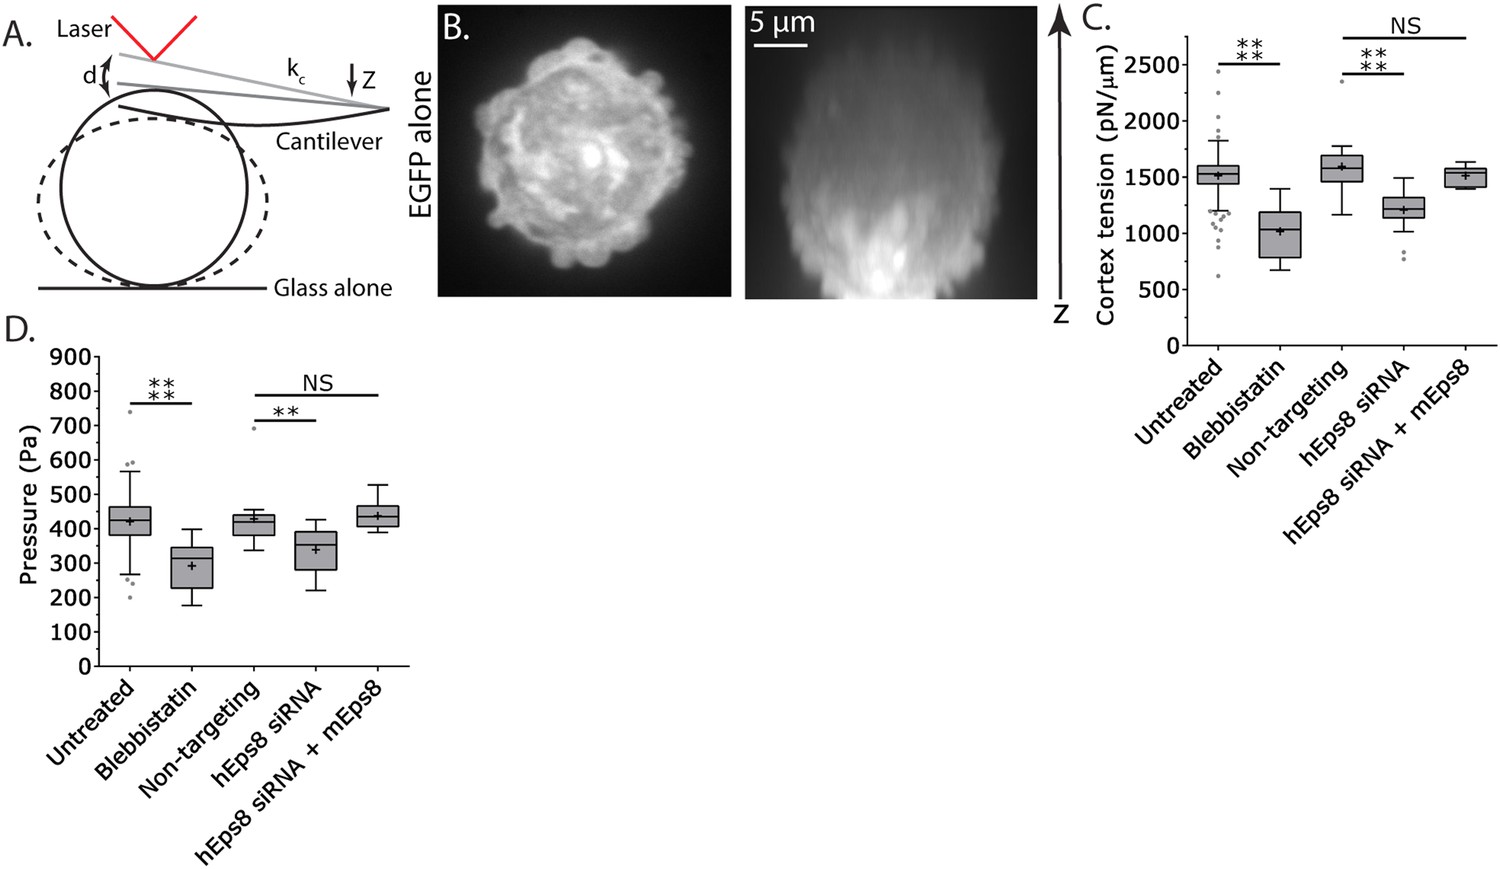
Cortex tension and intracellular pressure are maintained by Eps8.
(A) Schematic representation of the Atomic Force Microscope (AFM) based assay for determining cortex tension and intracellular pressure in A375 cells plated on uncoated glass. ‘kc’ cantilever spring constant, ‘d’ cantilever deflection, ‘z’ piezo Z displacement (B) (Left) confocal image of the central Z plane or (right) x-y projection of a 3D reconstruction of a Z-stack of a cell expressing EGFP as a volume marker. (C, D) Tukey box plots of cortex tension (C) and intracellular pressure (D) determined from AFM analysis. ‘+’ and line denote the mean and median, respectively. Cells were treated with 50 µM blebbistatin, non-targeting siRNAs, siRNAs targeting human Eps8 (hEps8) with or without the additional expression of Emerald-tagged mouse Eps8 (mEps8). *p ≤ 0.05, **p ≤ 0.01, ***p ≤ 0.001, ****p ≤ 0.0001, NS: p > 0.05.
Figure 3—figure supplement 1
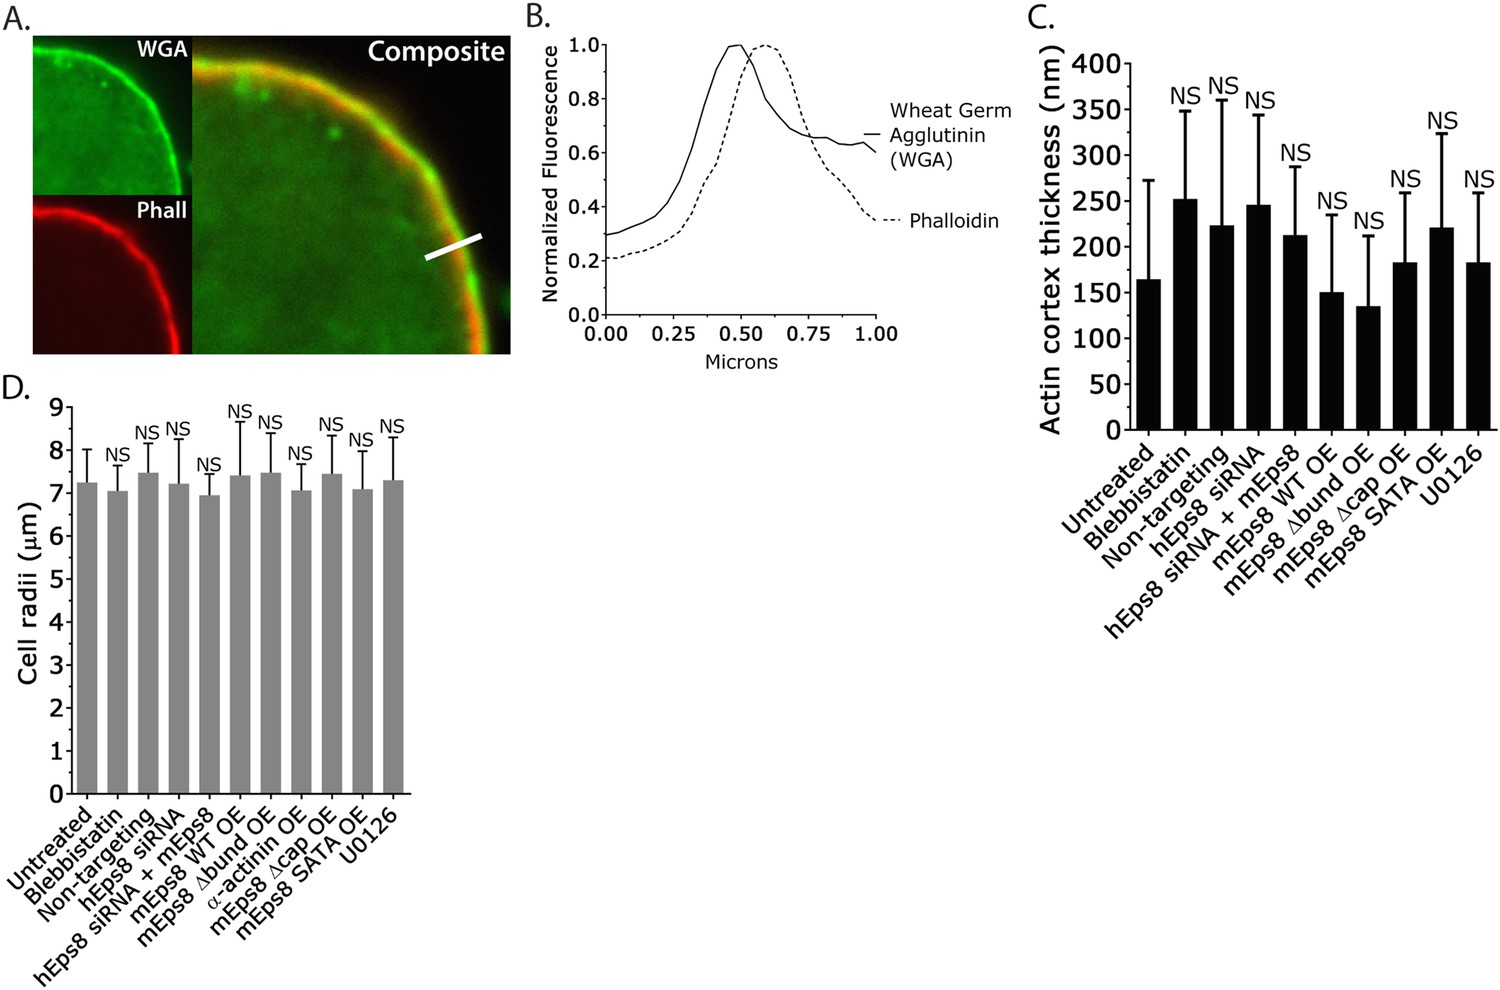
Actin cortex thickness and cell radii are not significantly affected by depletion of and rescue with wild type Eps8 or its mutants.
(A) Example central Z-plane confocal images of a bleb-free region of an A375 cell cortex plated on uncoated glass and stained with Alexa Fluor 568-conjugated Wheat Germ Agglutinin (WGA, green) to mark the position of the cell membrane and Alexa Fluor 647-conjugated phalloidin (Phall, red) to mark the position of the actin cortex for making thickness measurements. (B) Example line-scans of the cell membrane (WGA, green) and actin cortex (phalloidin, red) from (A, white bar) used for determining actin cortex thickness. (C) Average actin cortex thickness determined from confocal images of A375 cells plated on uncoated glass and stained as in (A). (D) Cell radii measurements from phase contrast images of live A375 cells acquired during atomic force microscopy analyses. Error is SD. NS: p > 0.05. Conditions are as follows: 50 µM blebbistatin, non-targeting siRNAs, siRNAs targeting human Eps8 (hEps8) with or without the additional over-expression (OE) of Emerald-tagged mouse Eps8 (mEps8) variants (‘mEps8Δcap,’ ‘mEps8Δbund,’ ‘mEps8-SATA,’ Emerald-tagged versions of the respective constructs (see Figure 4A) or 10 µM U0126.
Figure 4 with 2 supplements
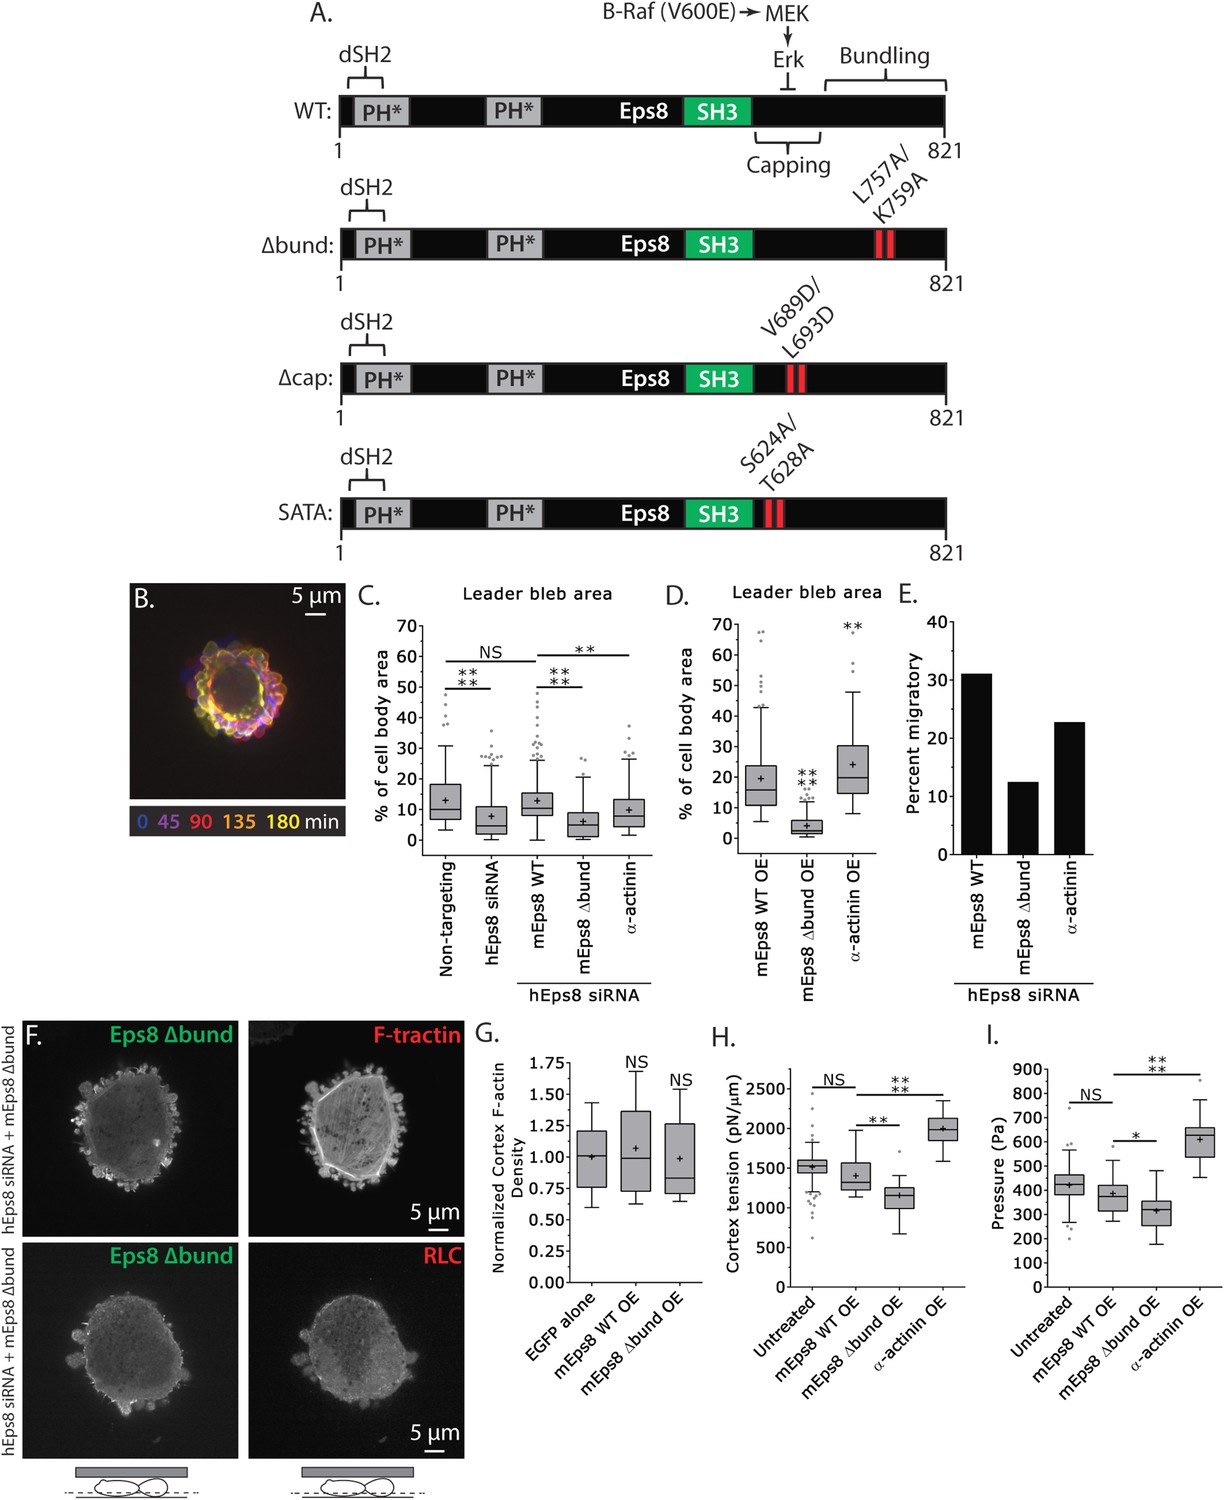
Actin bundling by Eps8 promotes cortex tension and intracellular pressure to drive leader bleb formation.
(A) Schematic representation of wild-type (WT) mouse Eps8 (mEps8) mutant constructs. Top: wild-type Eps8. ‘*’ indicates one part of the split PH domain, ‘dSH2’ indicates degenerate SH2, ‘capping’ indicates domain required for actin capping and which is subject to negative regulation by the Raf/MEK/Erk pathway, ‘bundling’ indicates the domain required for actin bundling. ‘Δbund’ indicates the bundling defective double point mutant L757A/K759A (red bars), ‘Δcap’ indicates the capping defective double point mutant V689D/L693D (red bars), ‘SATA’ indicates double alanine point mutation of Erk phosphorylation sites S624A/T628A (red bars). (B–I) Images and analyses of A375 cells plated on glass and confined under an agar slab. (C, D, G–I) Tukey box plots in which ‘+’ and line denote the mean and median, respectively. (C, D) Quantification of leader bleb area expressed as a % of cell body area for (C) cells treated with non-targeting or Eps8 siRNAs, with or without the additional expression of Emerald-mEps8, Emerald-mEps8Δbund or EGFP human α-actinin or (D) cells over-expressing (OE) Emerald-mEps8, Emerald-mEps8Δbund or EGFP human α-actinin. Data for mEps8 are re-displayed from Figure 2 for comparison. (E) Quantitation of the percent of cells that migrate from time-lapse phase contrast videos, treatments as in (C). (F) Confocal images through the ventral Z-plane of a cell depleted of Eps8 and co-expressing Emerald-mEps8Δbund and either FusionRed-F-tractin (top) or FusionRed-myosin II regulatory light chain (bottom, RLC). (G) Analysis of cortical actin density (see Materials and methods) in the cell body from images of phalloidin, treatments as in (D), normalized to the mean value of over-expression of soluble EGFP (EGFP alone). (H, I) Cortex tension (H) and intracellular pressure (H) determined from AFM analysis of cells under the conditions described in (D). *p ≤ 0.05, **p ≤ 0.01, ***p ≤ 0.001, ****p ≤ 0.0001, NS: p > 0.05. See also Video 4.
Figure 4—figure supplement 1
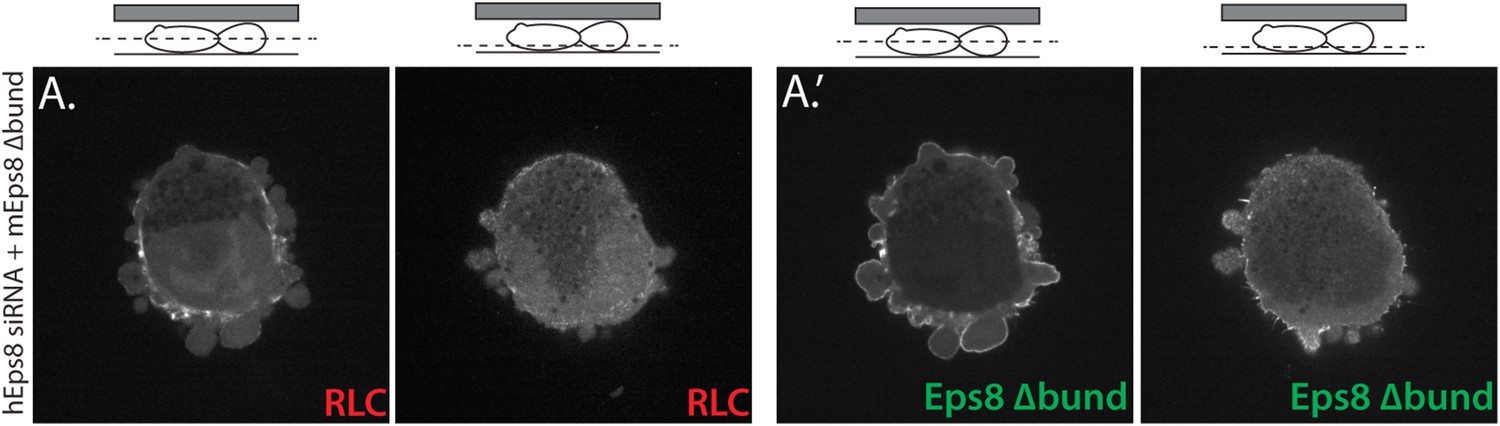
Eps8 bundling activity is not required for myosin II localization to the cortex of A375 cells.
(A) Confocal images of A375 cells confined between uncoated glass and an agar slab. (A) Central and (A′) ventral Z-plane confocal images of FusionRed-myosin II regulatory light chain (RLC, red) in cells treated with siRNA directed towards human Eps8 (hEps8 siRNA) and additionally expressing Emerald-tagged mouse Eps8 bearing double point mutations L757A/K759A that block its actin bundling activity (green, ‘mEps8 Δbund’).
Figure 4—figure supplement 2
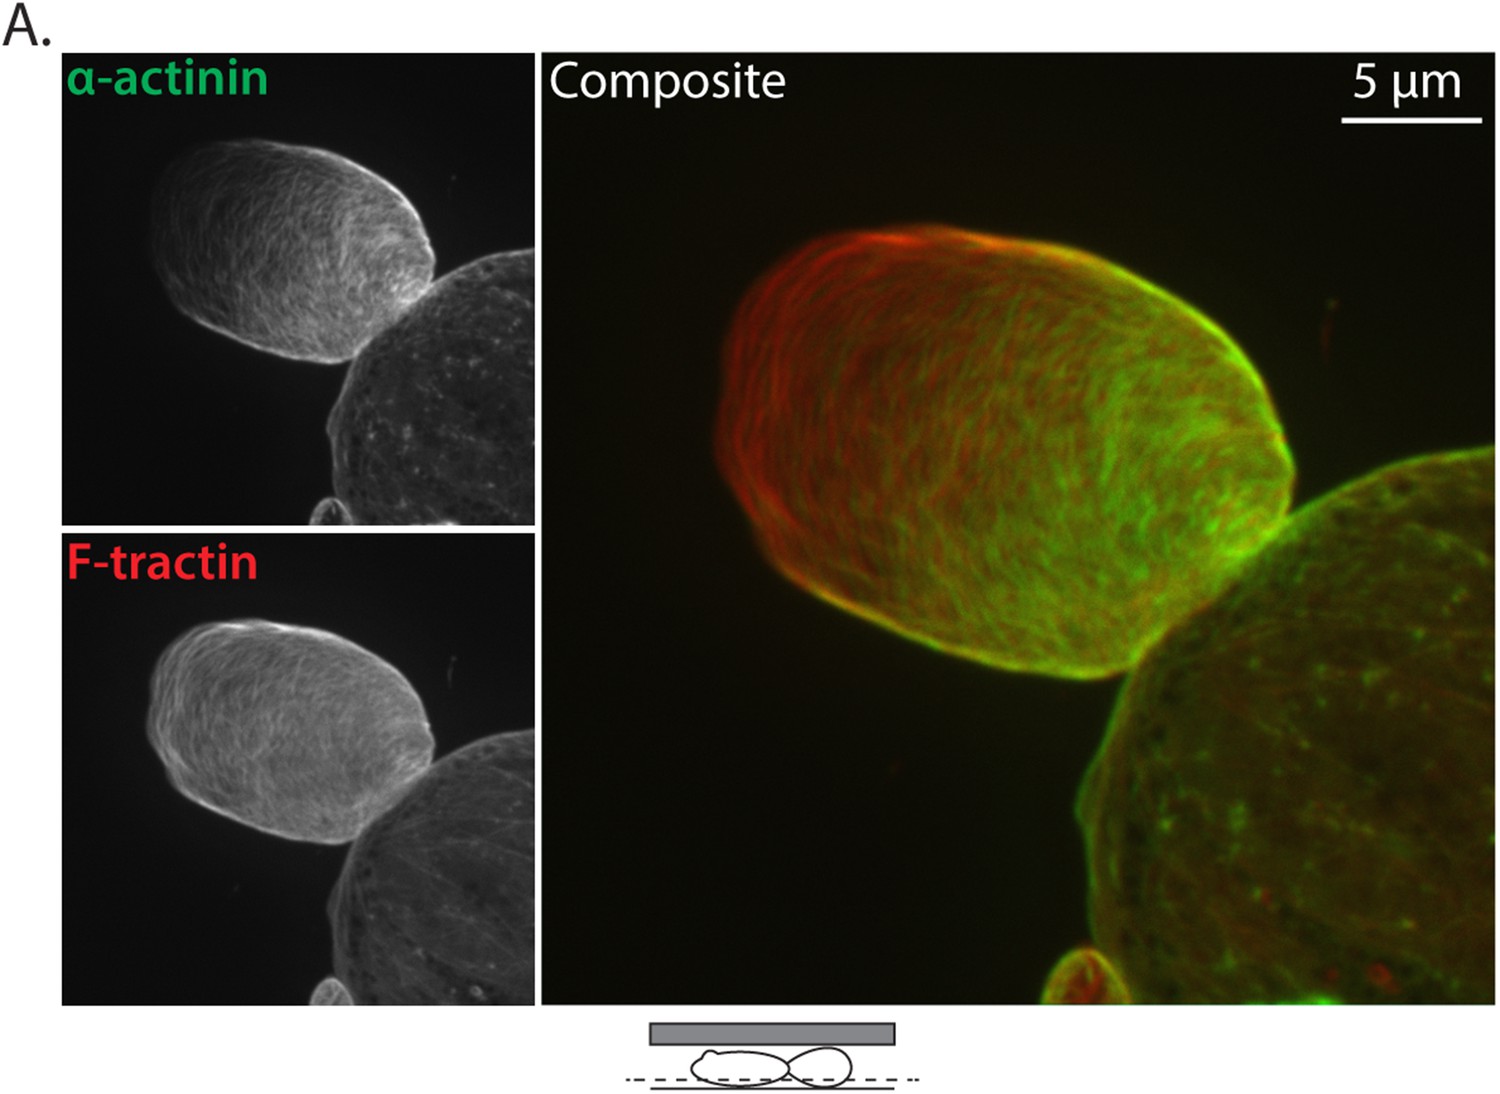
Ectopically expressed α-actinin localizes to the leader bleb cortex.
(A) Confocal images of A375 cells treated confined between uncoated glass and an agar slab that were treated with siRNA directed towards human Eps8 (hEps8 siRNA) and additionally expressing FusionRed-F-tractin (red) to mark actin filaments and GFP-tagged human α−actinin (green).
Figure 5 with 1 supplement
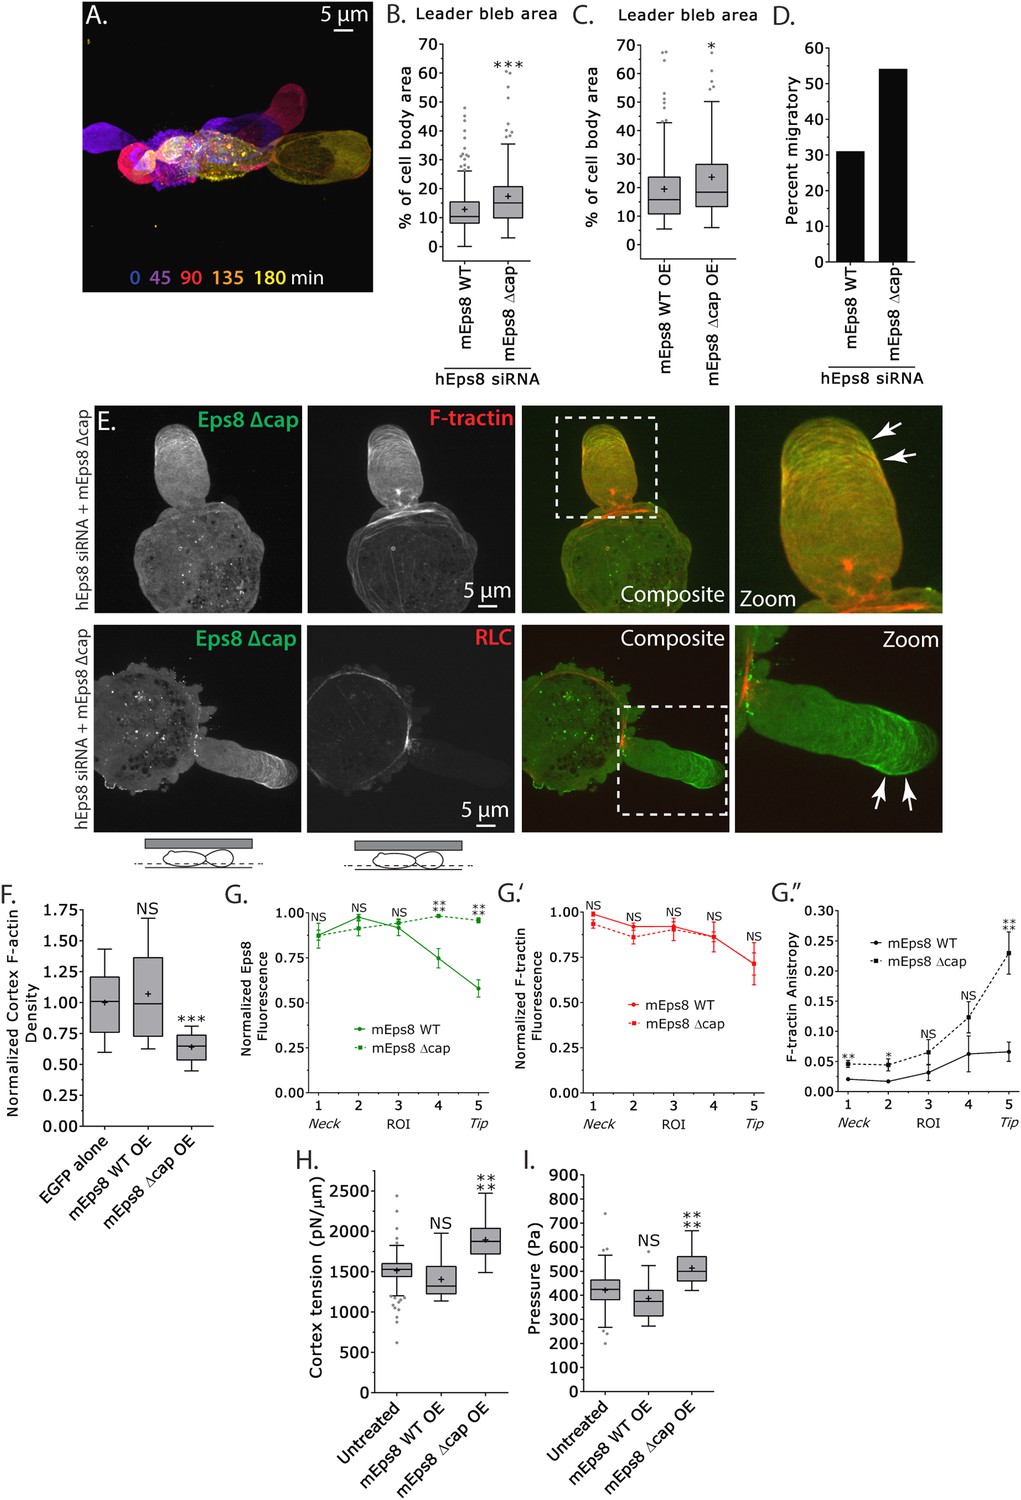
Eps8 actin capping activity limits leader bleb size by decreasing actin density and mechanical properties in the cell body cortex, and antagonizing actin bundling at the leader bleb tip.
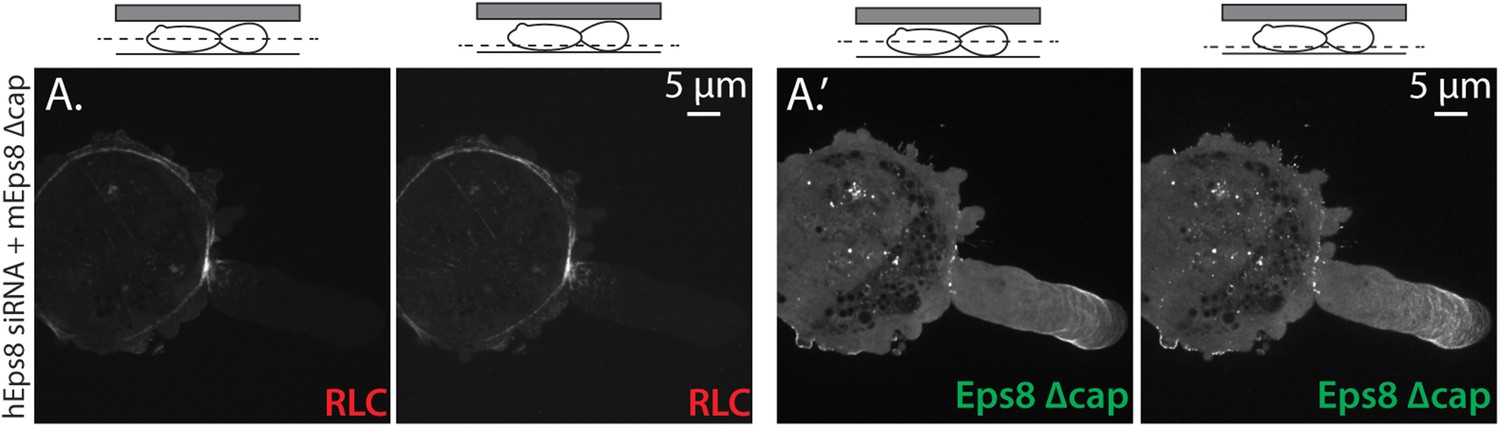
(A–I) Images and analyses of A375 cells plated on glass and confined under an agar slab. (A) Color encoded time-overlay of confocal images through the central Z-plane of a cell depleted of Eps8 by siRNAs targeting human Eps8 (hEps8 siRNA) and expressing Emerald-mEps8Δcap (see Figure 4A). (B, C, F, H, I) Tukey box plots in which ‘+’ and line denote the mean and median, respectively. (B, C) Quantification of leader bleb area expressed as a % of cell body area for (B) cells treated with hEps8 siRNAs and additionally expressing wild type (WT) Emerald-mEps8 or Emerald-mEps8Δcap or (C) cells over-expressing (OE) Emerald-mEps8-WT or Emerald-mEps8Δcap. Data for mEps8 WT are re-displayed from Figure 2 for comparison. (D) Quantitation of the percent of cells that migrate from time-lapse phase contrast videos, treatments as in (B). (E) Confocal images through the ventral Z-plane of cells depleted of Eps8 and co-expressing Emerald-mEps8Δcap and either FusionRed-F-tractin (top) or FusionRed-myosin II regulatory light chain (bottom, RLC). (F) Analysis of cortical actin density (see Materials and methods) in the cell body from images of phalloidin, treatments as in (C), normalized to the mean value of over-expression of soluble EGFP (EGFP alone). (G) Regional analysis of the average fluorescence intensity (G, G′, normalized to maximum) Emerald-mEps8 or Emerald-mEps8Δcap (G) or FusionRed-F-tractin (G′) and bundle anisotropy (G″) of FusionRed-F-tractin along leader blebs in cells treated with hEps8 siRNA. Each point represents the average value in a region of interest (ROI) that is 20% of the length of the leader bleb. (H, I) Cortex tension (H) and intracellular pressure (H) determined from AFM analyses of cells under the conditions described in (D). *p ≤ 0.05, **p ≤ 0.01, ***p ≤ 0.001, ****p ≤ 0.0001, NS: p > 0.05. See also Video 5.
Figure 5—figure supplement 1
Eps8 capping activity is not required for myosin II localization to the cortex or leader bleb in A375 cells.
(A) Confocal images of A375 cells confined between uncoated glass and an agar slab. (A) central and (A′) ventral Z-plane confocal images of FusionRed-myosin II regulatory light chain (RLC, red) in cells treated with siRNA directed towards human Eps8 (hEps8 siRNA) and additionally expressing Emerald-tagged mouse Eps8 bearing double point mutations V689D/L693D that inactivate its actin capping activity (green, ‘mEps8 Δcap’).
Figure 6 with 1 supplement
Inhibition of Erk activity perturbs leader bleb-based migration.
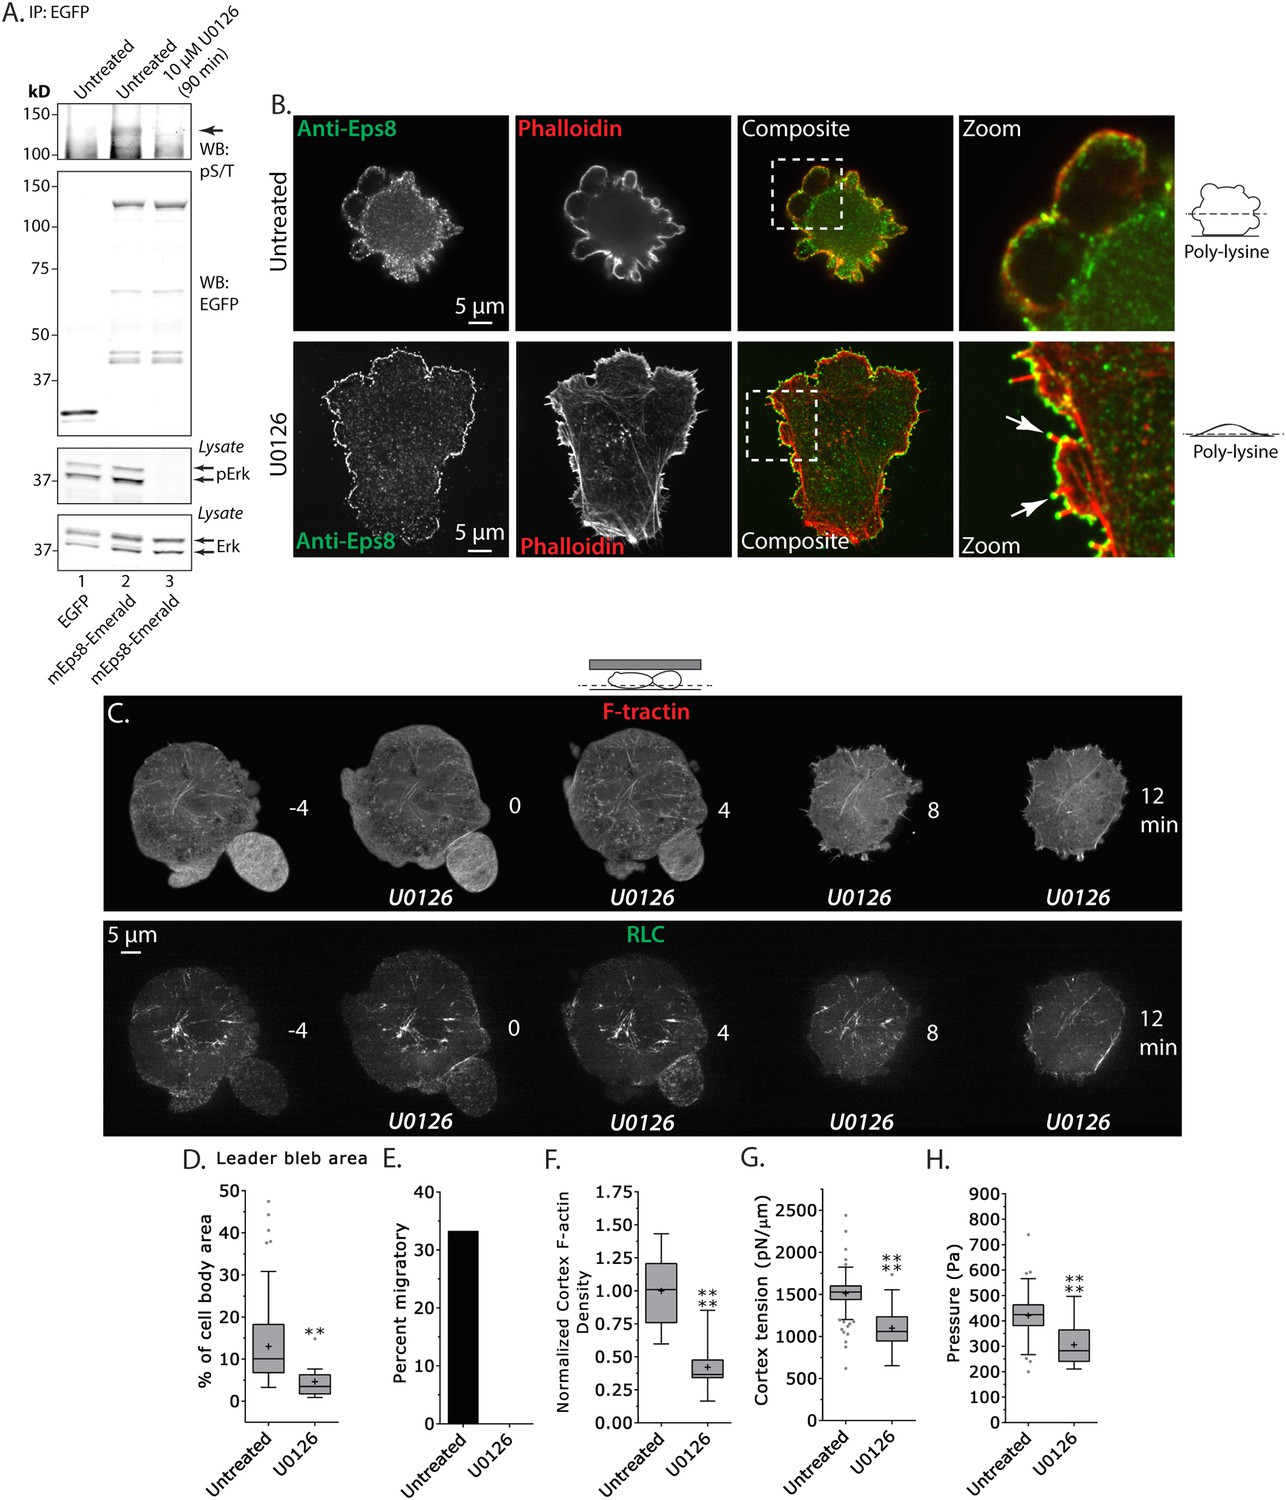
(A) Top two panels: Western blot analysis of anti-GFP immunoprecipitates from lysates of A375 cells that were expressing EGFP or Emerald-mEps8 that were or were not treated with 10 µM U0126 to inhibit Erk. Blot was probed with antibodies specific to phospho-serine and phospho-threonine (pS/T, upper panel) or GFP (upper middle panel). Bottom two panels: Western blot analysis of Erk and Erk phosphorylated on T202/Y204 (pErk) in lysates of untreated A375 cells that were expressing EGFP or Emerald-mEps8 that were or were not treated with 10 µM U0126. (B) Immuno-localization of endogenous Eps8 (green) and phalloidin staining of actin (red) in untreated and U0126 (10 µM)-treated A375 cells that were non-specifically adhered to poly-L-Lysine coated glass. Arrows: Eps8 localizing to the tips of filopodia. (C–H) Images and analysis of A375 cells plated on glass and confined under agarose. (C) Time-lapse confocal image series of a cell that was co-expressing FusionRed-F-tractin (top) and EGFP tagged myosin II regulatory light chain (RLC, bottom). Time indicates minutes relative to perfusion with 10 µM U0126. (D, F, G, H) Tukey box plots in which ‘+’ and line denote the mean and median, respectively, treatments as in (A). (D) Quantification of leader bleb area expressed as a % of cell body area. (E) Quantitation of the percent of cells that migrate from time-lapse phase contrast videos. (F) Analysis of cortical actin density (see Materials and methods) in the cell body from images of phalloidin, normalized to the mean value of untreated cells. (G, H) Cortex tension (G) and intracellular pressure (H) determined from AFM analyses of cells. *p ≤ 0.05, **p ≤ 0.01, ***p ≤ 0.001, ****p ≤ 0.0001, NS: p > 0.05. See also Video 6.
Figure 6—figure supplement 1
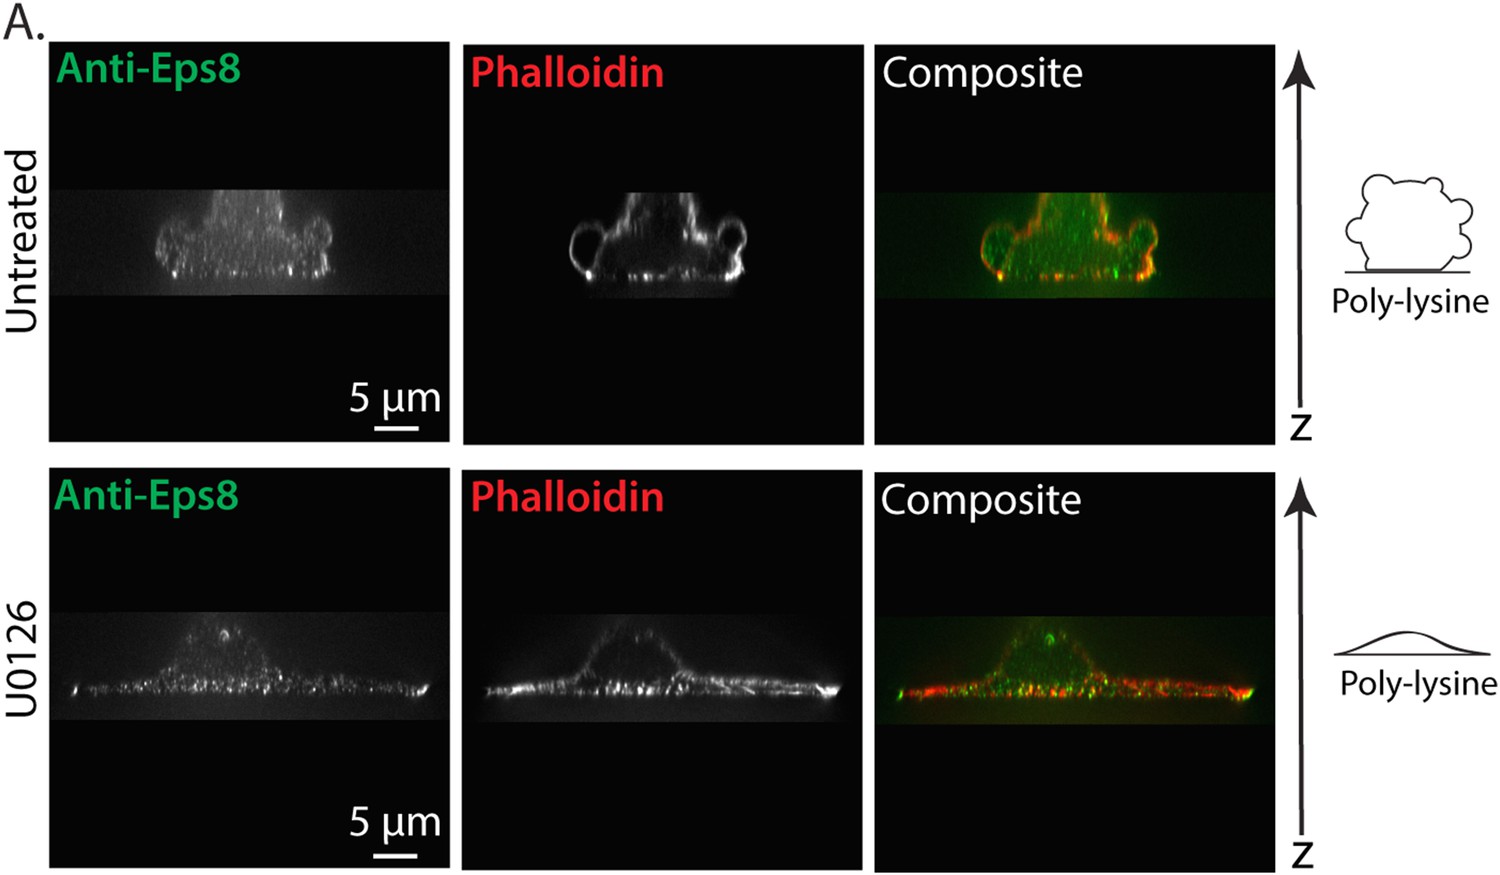
Erk inhibition causes A375 cell flattening.
(A) X-Y projections of 3D reconstructions of Z-stacks of paraformaldehyde fixed A375 cells plated on poly-L-Lysine coated glass to mediate non-specific adhesion to the coverslip during immunostaining for endogenous Eps8 (green) and stained with phalloidin to visualize actin (red). (Top) An untreated cell non-specifically adhered poly-L-Lysine coated glass. (Bottom) A cell treated for 90 min with 10 µM U0126 to inhibit Erk. Z-stacks consisted of 30 confocal slices separated by 0.5 microns. Reconstructions were rendered using ‘Volume Viewer’ in Fiji (http://fiji.sc/Fiji).
Figure 7 with 2 supplements
MEK/Erk-mediated phosphorylation of S624 and T628 coordinates Eps8 capping and bundling activities to mediate leader bleb-based migration.
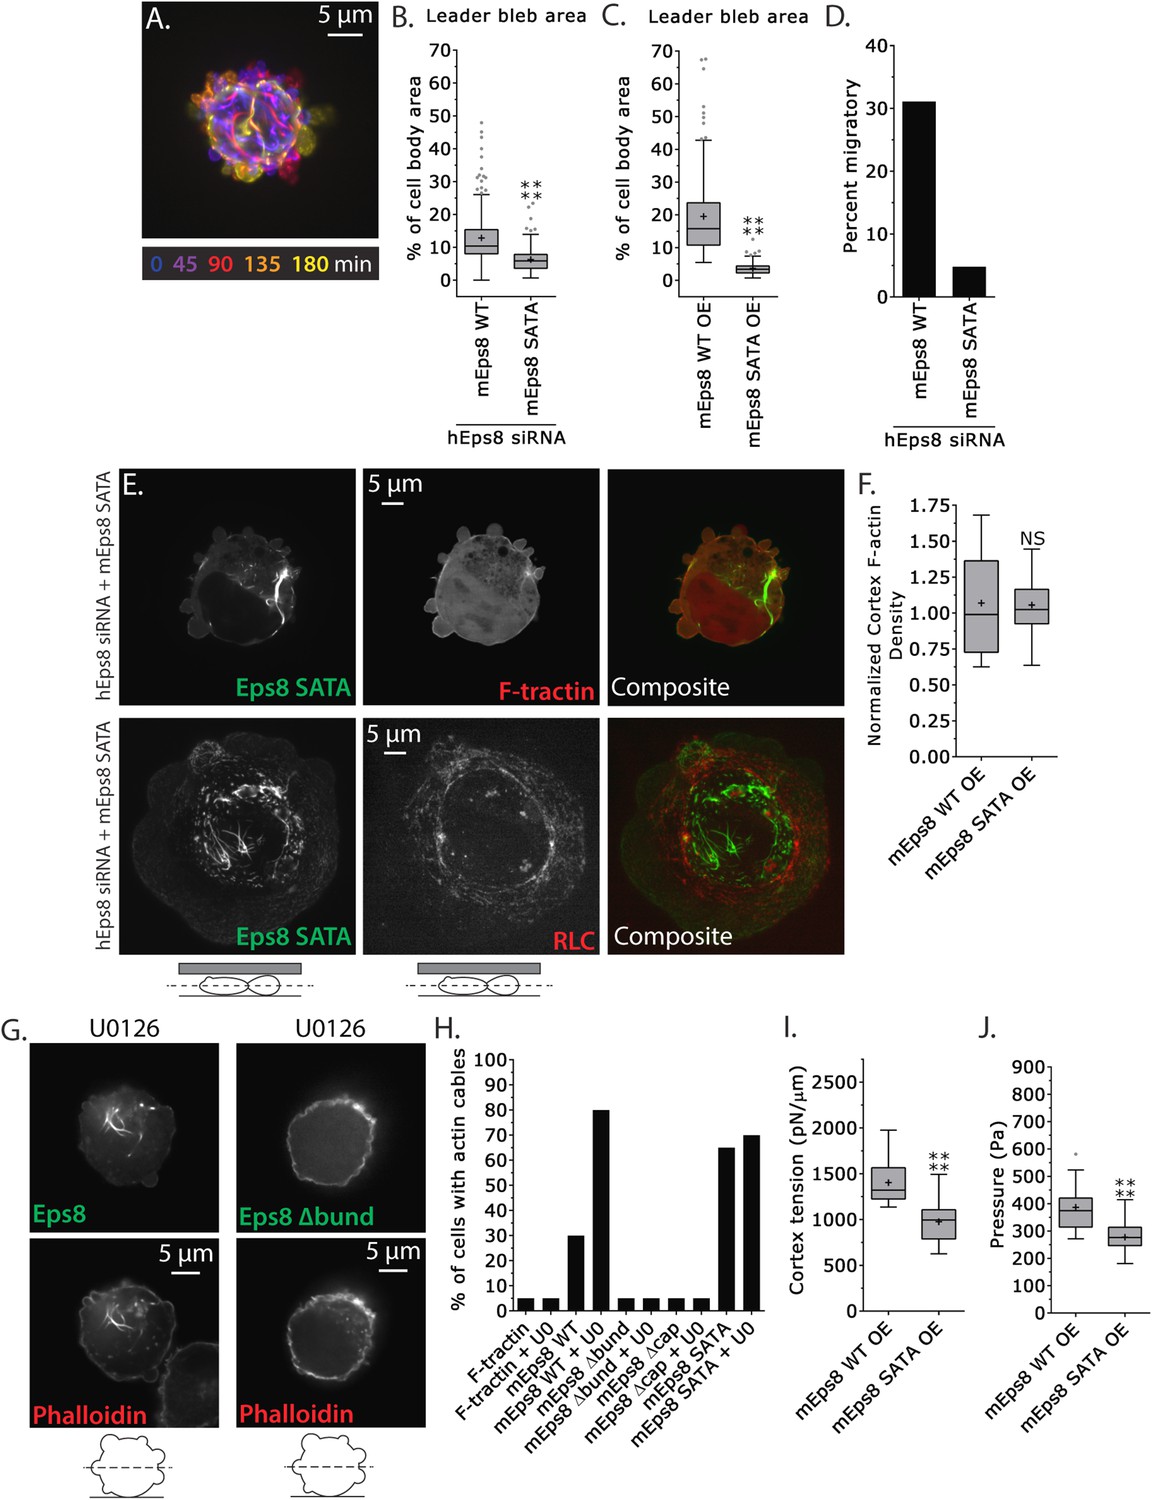
(A–J) Images and analyses of A375 cells plated on glass and confined under an agar slab. (A) Color encoded time-overlay of confocal images through the central Z-plane of a cell depleted of Eps8 by siRNAs targeting human Eps8 (hEps8 siRNA) and expressing Emerald-mEps8 bearing double alanine point mutation of Erk phosphorylation sites S624A/T628A (Emerald-mEps8-SATA). (B, C, F, I, J) Tukey box plots in which ‘+’ and line denote the mean and median, respectively. (B–C) Quantification of leader bleb area expressed as a % of cell body area for (B) cells treated with hEps8 siRNAs and additionally expressing wild type (WT) Emerald-mEps8 or Emerald-mEps8-SATA or (C) cells over-expressing (OE) Emerald-mEps8-WT or Emerald-mEps8-SATA. (D) Quantitation of the percent of cells that migrate from time-lapse phase contrast videos, treatments as in (B). (E) Confocal images through the central Z-plane of cells depleted of Eps8 and co-expressing Emerald-mEps8-SATA and either FusionRed-F-tractin (top) or FusionRed-myosin II regulatory light chain (bottom, RLC). (F) Analysis of cortical actin density (see Materials and methods) in the cell body from images of phalloidin, treatments as in (C), normalized to the mean value from over-expression of Emerald-mEps8 WT. (G) Confocal images through the central Z-plane of cells treated with 10 µM U0126 and over-expressing either Emerald-mEps8 WT or Emerald-mEps8Δbund (see Figure 4A) and actin stained with fluorescent phalloidin. (H) Quantitation of the percent of cells containing central actin bundles from confocal images of fluorescent phalloidin-stained cells. ‘F-tractin’ indicates over-expression of FusionRed-F-tractin, ‘UO’ indicates treatment with 10 µM U0126, ‘mEps8,’ ‘mEps8Δcap,’ ‘mEps8Δbund,’ ‘mEps8-SATA,’ indicate over-expression of EGFP-tagged versions of the respective constructs (see Figure 4A). (I, J) Cortex tension (I) and intracellular pressure (J) determined from AFM analyses of cells under the conditions described in (C). *p ≤ 0.05, **p ≤ 0.01, ***p ≤ 0.001, ****p ≤ 0.0001, NS: p > 0.05. See also Video 7.
Figure 7—figure supplement 1
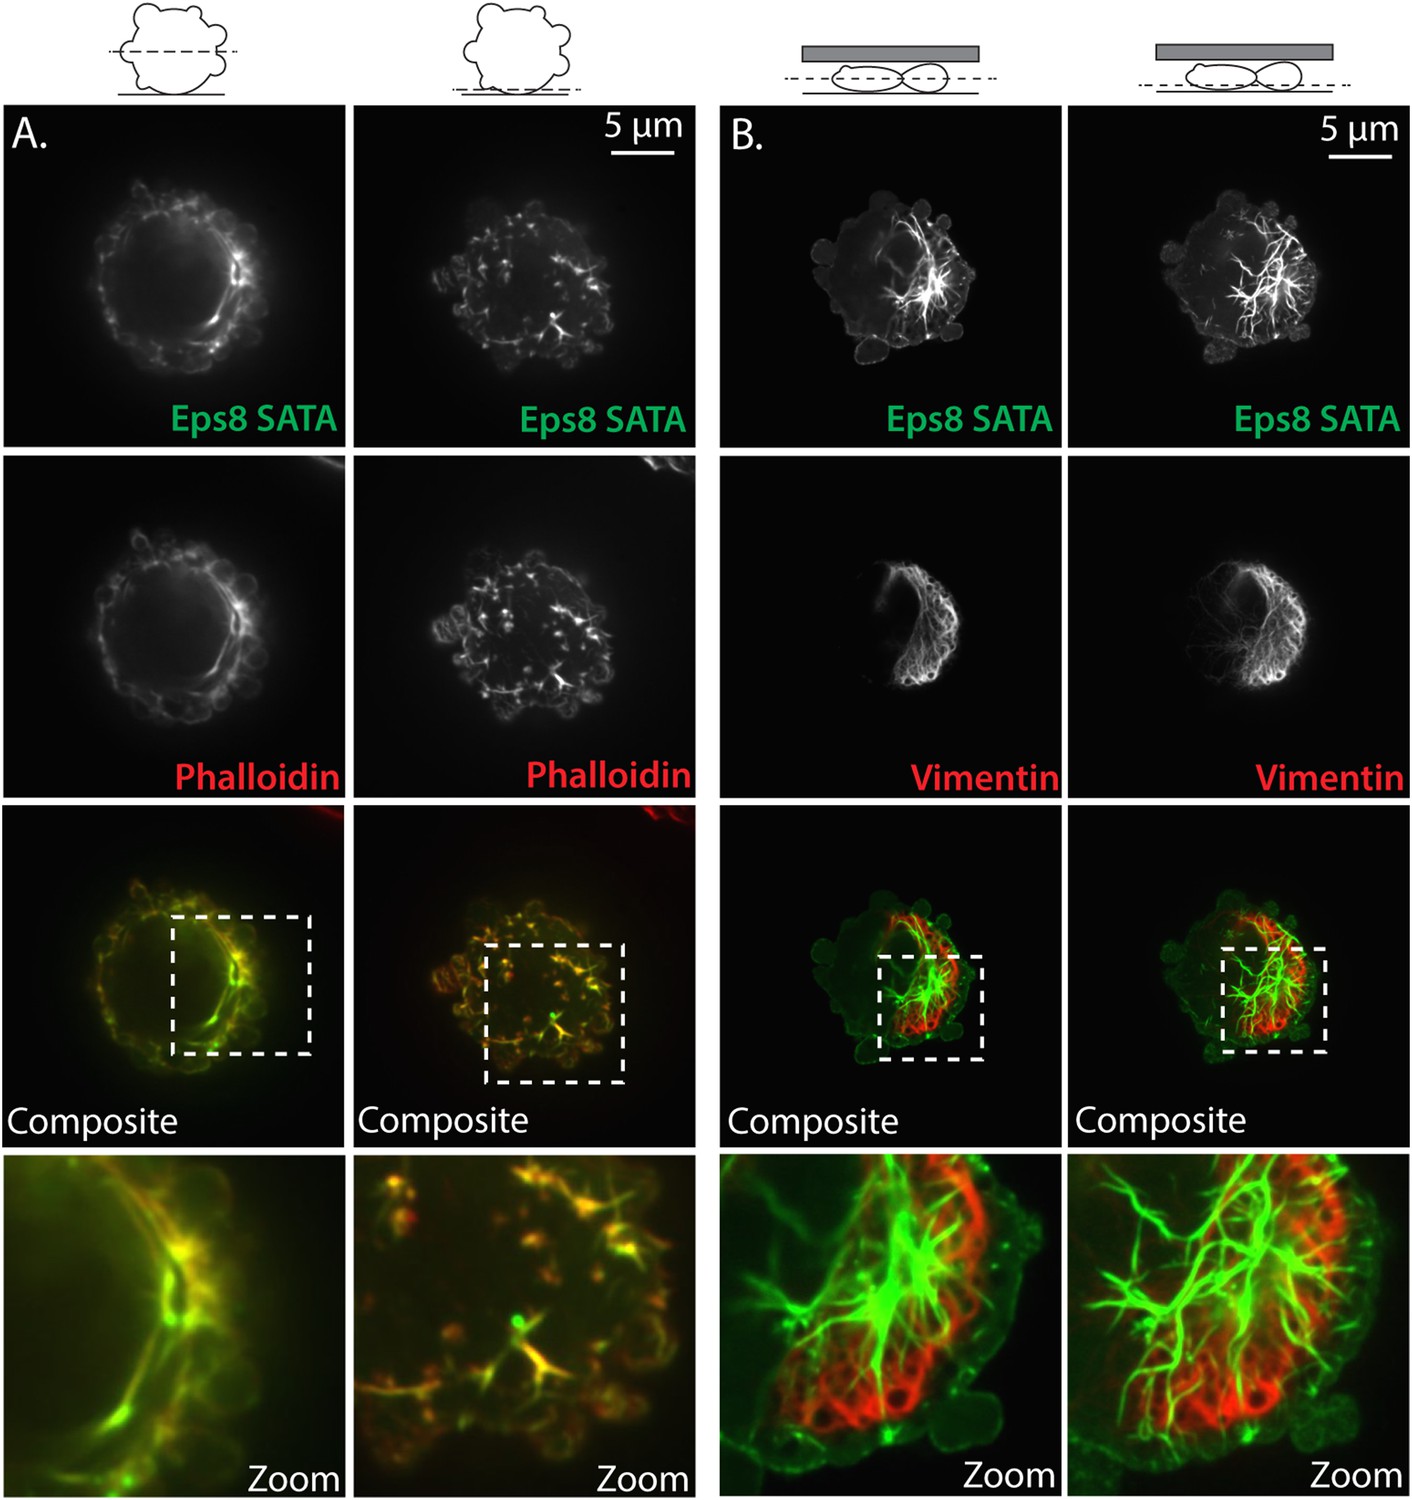
Non-phosphorylatable Eps8 co-localizes with F-actin and not intermediate filaments.
(A) Paraformaldehyde fixed A375 cell plated on uncoated glass over-expressing Emerald-tagged mouse Eps8 with the Erk phosphorylation sites mutated (S624A/T628A, Eps8-SATA, green) and stained with phalloidin to visualize actin (red). (B) Live A375 cell confined between uncoated glass and an agar pad and expressing Emerald-mEps8-SATA (green) and FusionRed tagged human vimentin (FusionRed-vimentin) to mark intermediate filaments (red). (A, B) Confocal images of the central (left) or ventral (right) Z-planes. Boxed area shown zoomed at bottom.
Figure 7—figure supplement 2
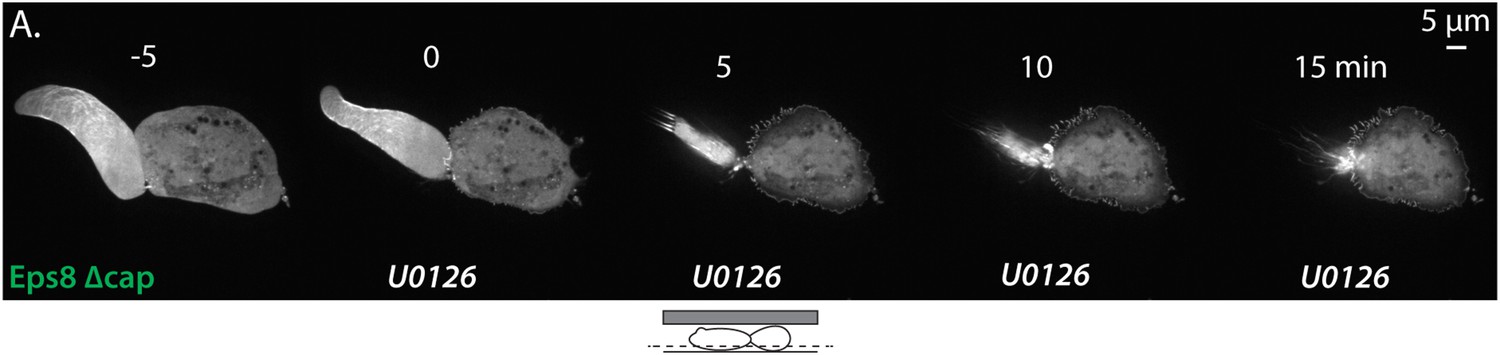
Inhibition of Eps8 capping activity is not sufficient to maintain leader blebs in the presence of Erk inhibitor.
(A) Time-lapse confocal image series of an A375 cells plated on glass and confined under agarose cell that was treated with siRNA directed towards human Eps8 (hEps8 siRNA) and additionally expressing Emerald-tagged mouse Eps8 bearing double point mutations V689D/L693D that inactivate its actin capping activity (green, ‘mEps8 Δcap’). Time indicates minutes relative to perfusion with 10 µM U0126 to inhibit Erk.
Figure 8 with 1 supplement
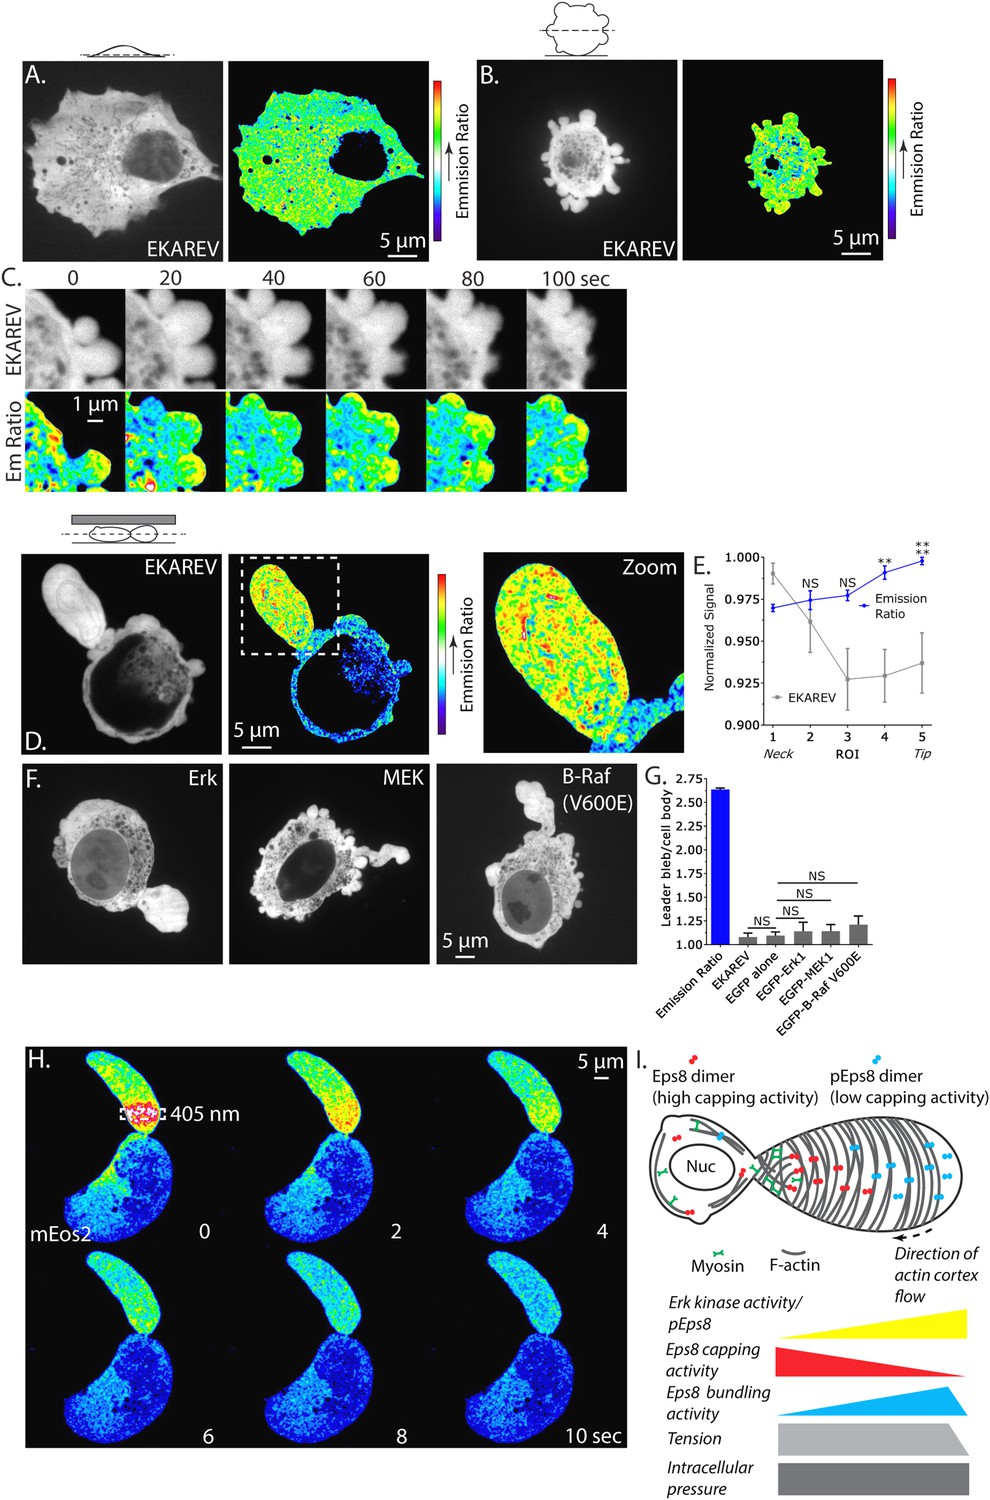
Erk activity is concentrated in a gradient across leader blebs by a diffusion barrier at the bleb neck.
(A–E, G) A375 cells expressing the EKAREV biosensor in which a CFP-tagged phospho-peptide-binding domain is connected by the EV linker to a YFP-tagged Erk substrate peptide and FRET is obtained when the substrate is phosphorylated by Erk. (A) (Left) Confocal image at the ventral Z-plane of the distribution of EKAREV (CFP channel) in a cell plated on fibronectin-coated glass. (Right) Pseudocolored ratio image of EKAREV FRET (YFP over CFP emission). (B) (Left) Confocal image at the central Z-plane of the distribution of EKAREV (CFP channel) in a cell plated on glass. (Right) Pseudocolored ratio image of EKAREV FRET. (C) (Top) Time-lapse confocal image series at the central Z-plane of the distribution of EKAREV (CFP channel) in a cell plated on glass. (Bottom) Pseudocolored ratio image of EKAREV FRET. (D–H) Images and analysis of A375 cells cell plated on glass and overlaid with an agar slab. (D) (Left) Confocal image at the central Z-plane of the distribution of EKAREV (CFP channel). (Center) Pseudocolored ratio image of EKAREV FRET. (Right) Zoom of the boxed area. (E) Regional analysis of the average fluorescence intensity of EKAREV (CFP channel) or the EKAREV FRET (YFP over CFP emission) (normalized to maximum) along leader blebs. Each point represents the average value in a region of interest (ROI) that is 20% of the length of the leader bleb. (F) Confocal image at the central Z-plane of the distribution of EGFP tagged Erk, MEK or B-Raf (V600E) in cells that are confined under agarose. (G) Quantification of the average ratio of signal in the leader bleb to that in the cell body for (D, F). ‘Emission ratio’ indicates EKAREV FRET signal (YFP over CFP emission), ‘EKAREV’ indicates EKAREV CFP channel, ‘EGFP alone’ indicates soluble EGFP. (H) A375 cell expressing soluble mEos2. Time-lapse confocal image series at the central Z-plane. Box indicates the region near the neck of the leader bleb to which a pulse of 405 nm light was applied to locally photo-convert mEos2 from green to red fluorescence. Pseudocolor indicates the magnitude of red fluorescence from mEos2 after photo-conversion. (I) Speculative model for Eps8 function during leader bleb-based migration. *p ≤ 0.05, **p ≤ 0.01, ***p ≤ 0.001, ****p ≤ 0.0001, NS: p > 0.05. See also Videos 8, 9.
Figure 8—figure supplement 1

The Erk inhibitor U0126 reduces EKAREV FRET and A375 cell blebbing.
(A) Central Z-plane confocal image series of a live A375 cell plated on uncoated glass expressing the EKAREV biosensor treated with 10 µM U0126. Pseudocolor reflects the magnitude of YFP/CFP ratio FRET signal induced by Erk-mediated phosphorylation of the biosensor (red = high, blue = low). Time (minutes) relative to perfusion of U0126.
Videos
Video 1
Human melanoma A375 cells form a single prominent bleb when confined under an agar pad.
Comparison of central Z-plane confocal time-lapse videos of Emerald-mEps8 dynamics in A375 cells plated on human plasma fibronectin coated glass (left), uncoated glass (middle) and confined between uncoated glass and an agar pad (right). Scale bar: 5 µm, elapsed time in seconds shown.
Video 2
Human melanoma A375 cells migrate in the direction of a ‘leader bleb.’
Central Z-plane confocal time-lapse video of Emerald-F-tractin showing actin dynamics during ‘leader bleb’ based migration of an A375 cell confined between uncoated glass and an agar pad. Scale bar: 5 µm, elapsed time in minutes shown.
Video 3
Eps8 and actin flow towards the bleb neck in leader blebs.
Ventral Z-plane confocal time-lapse video of Emerald-mEps8 (green) and FusionRed-F-tractin (red) dynamics showing their coordinated flow towards the bleb neck in an A375 cell confined between uncoated glass and an agar pad. Scale bar: 5 µm, elapsed time in seconds shown.
Video 4
Formation of large leader blebs requires actin bundling by Eps8.
Central Z-plane confocal time-lapse video showing Emerald-Eps8 dbund (L757A/K759A mutations in mouse Eps8 that block its bundling activity) dynamics and small blebs in an A375 cell that has been depleted of Eps8 by siRNA and confined between uncoated glass and an agar pad. Scale bar: 5 µm, elapsed time in seconds shown.
Video 5
Actin capping by Eps8 limits leader bleb size.
Ventral Z-plane confocal time-lapse video showing Emerald-Eps8 dcap (V689D/L693D mutations in mouse Eps8 that block its actin capping activity) dynamics and large leader bleb formation in an A375 cell that has been depleted of Eps8 by siRNA and confined between uncoated glass and an agar pad. Scale bar: 5 µm, elapsed time in minutes shown.
Video 6
MEK/Erk activity regulates the organization of the actin cortex and is required to form large leader blebs.
Ventral Z-plane confocal time-lapse video showing actin (FusionRed-F-tractin, red) and myosin II (EGFP-myosin II regulatory light chain, RLC, green) dynamics and leader bleb retraction in an A375 cell confined between uncoated glass and an agar pad. When the word ‘U0126’ appears, 10 µM U0126 was perfused into the media to inhibit MEK/Erk. Scale bar: 5 µm, elapsed time in minutes shown.
Video 7
Erk phosphorylation of Eps8 is necessary for large leader bleb formation.
Ventral Z-plane confocal time-lapse video showing Emerald-Eps8 SATA (S624A/T628A mutations in mouse Eps8 that block its ability to be phosphorylated by Erk) dynamics and small blebs in an A375 cell that has been depleted of Eps8 by siRNA and confined between uncoated glass and an agar pad. Scale bar: 5 µm, elapsed time in seconds shown.
Video 8
The EKAREV biosensor reveals concentrated Erk kinase activity within large leader blebs.
Comparison of central Z-plane confocal time-lapse videos of Erk kinase activity in A375 cells plated on human plasma fibronectin coated glass (left), uncoated glass (middle) and confined between uncoated glass and an agar pad (right). Cells were expressing the EKAREV Erk activity biosensor. Pseudocolor reflects the magnitude of YFP/CFP ratio FRET signal induced by Erk-mediated phosphorylation of the biosensor (red = high, blue = low). Scale bar: 5 µm, elapsed time in seconds shown.
Video 9
The bleb neck restricts the diffusion of photo-converted mEos2 between large leader blebs and the cell body.
Central Z-plane confocal time-lapse video of freely diffusing mEos2 before and after activation with a 0.5 s pulse of 405 nm laser light within a defined region (box) of a leader bleb showing slow diffusion between a large leader bleb and the cell body. Pseudocolor reflects the magnitude of red fluorescence from mEos2 after photo-conversion (red = high, blue = low). Scale bar: 5 µm, elapsed time in seconds shown.
Additional files
-
Supplementary file 1
Quantitative and statistical analyses of leader bleb area, cortex tension and intracellular pressure for each condition in A375 cells. (Sheets 1–6) Quantitative and statistical analyses of leader bleb area (Sheets 1 and 2, expressed in μm2) cortex tension (Sheets 3 and 5, expressed in pN/µm) and intracellular pressure (Sheets 4 and 6, expressed in Pa) for human melanoma A375 cells treated with non-targeting siRNA (non-targeting) or depleted of Eps8 using an siRNA specific for human Eps8 (hEps8 siRNA), rescued with or over-expressing (OE) Emerald-tagged wild type mouse Eps8 (mEps8 WT) or the following mutants: mEps8 Δbund (bundling defective, L757A/K759A), mEps8 Δcap (capping defective, V689D/L693D) and mEps8 SATA (Erk phosphorylation deficient, S624A/T628A), or EGFP-tagged human α-actinin, or treated with 50 µM blebbistatin to inhibit myosin II or 10 µM U0126 to inhibit MEK/Erk. (Sheets 1, 2) Cells were confined between uncoated glass and an agar pad, leader bleb area is expressed as percent of cell body area. In (Sheet 1), cells were depleted of Eps8 and rescued with WT and mutants of Eps8, in (Sheet 2), cells were over-expressing WT or mutant Eps8. (Sheets 3–6) Cells were plated on uncoated glass, and where noted, treated with 50 µM blebbistatin (5 min) to inhibit myosin II or 10 µM U0126 (30 min) prior to atomic force microscopy analysis. (Sheets 3, 5) Cortex tension (expressed in pN/µm) in cells (Sheet 3) depleted of and rescued with WT Eps8, or (Sheet 5) over-expressing WT Eps8 or mutants. (Sheets 4, 6) Intracellular pressure (expressed in Pa) in cells (Sheet 4) depleted of and rescued with WT Eps8, or (Sheet 6) over-expressing WT Eps8 and mutants.
- https://doi.org/10.7554/eLife.08314.032
Download links
A two-part list of links to download the article, or parts of the article, in various formats.
Downloads (link to download the article as PDF)
Open citations (links to open the citations from this article in various online reference manager services)
Cite this article (links to download the citations from this article in formats compatible with various reference manager tools)
Erk regulation of actin capping and bundling by Eps8 promotes cortex tension and leader bleb-based migration
eLife 4:e08314.
https://doi.org/10.7554/eLife.08314


