BAG2 promotes tumorigenesis through enhancing mutant p53 protein levels and function
- Rutgers University, United States
- Harbin Medical University, China
Figures
Figure 1 with 1 supplement
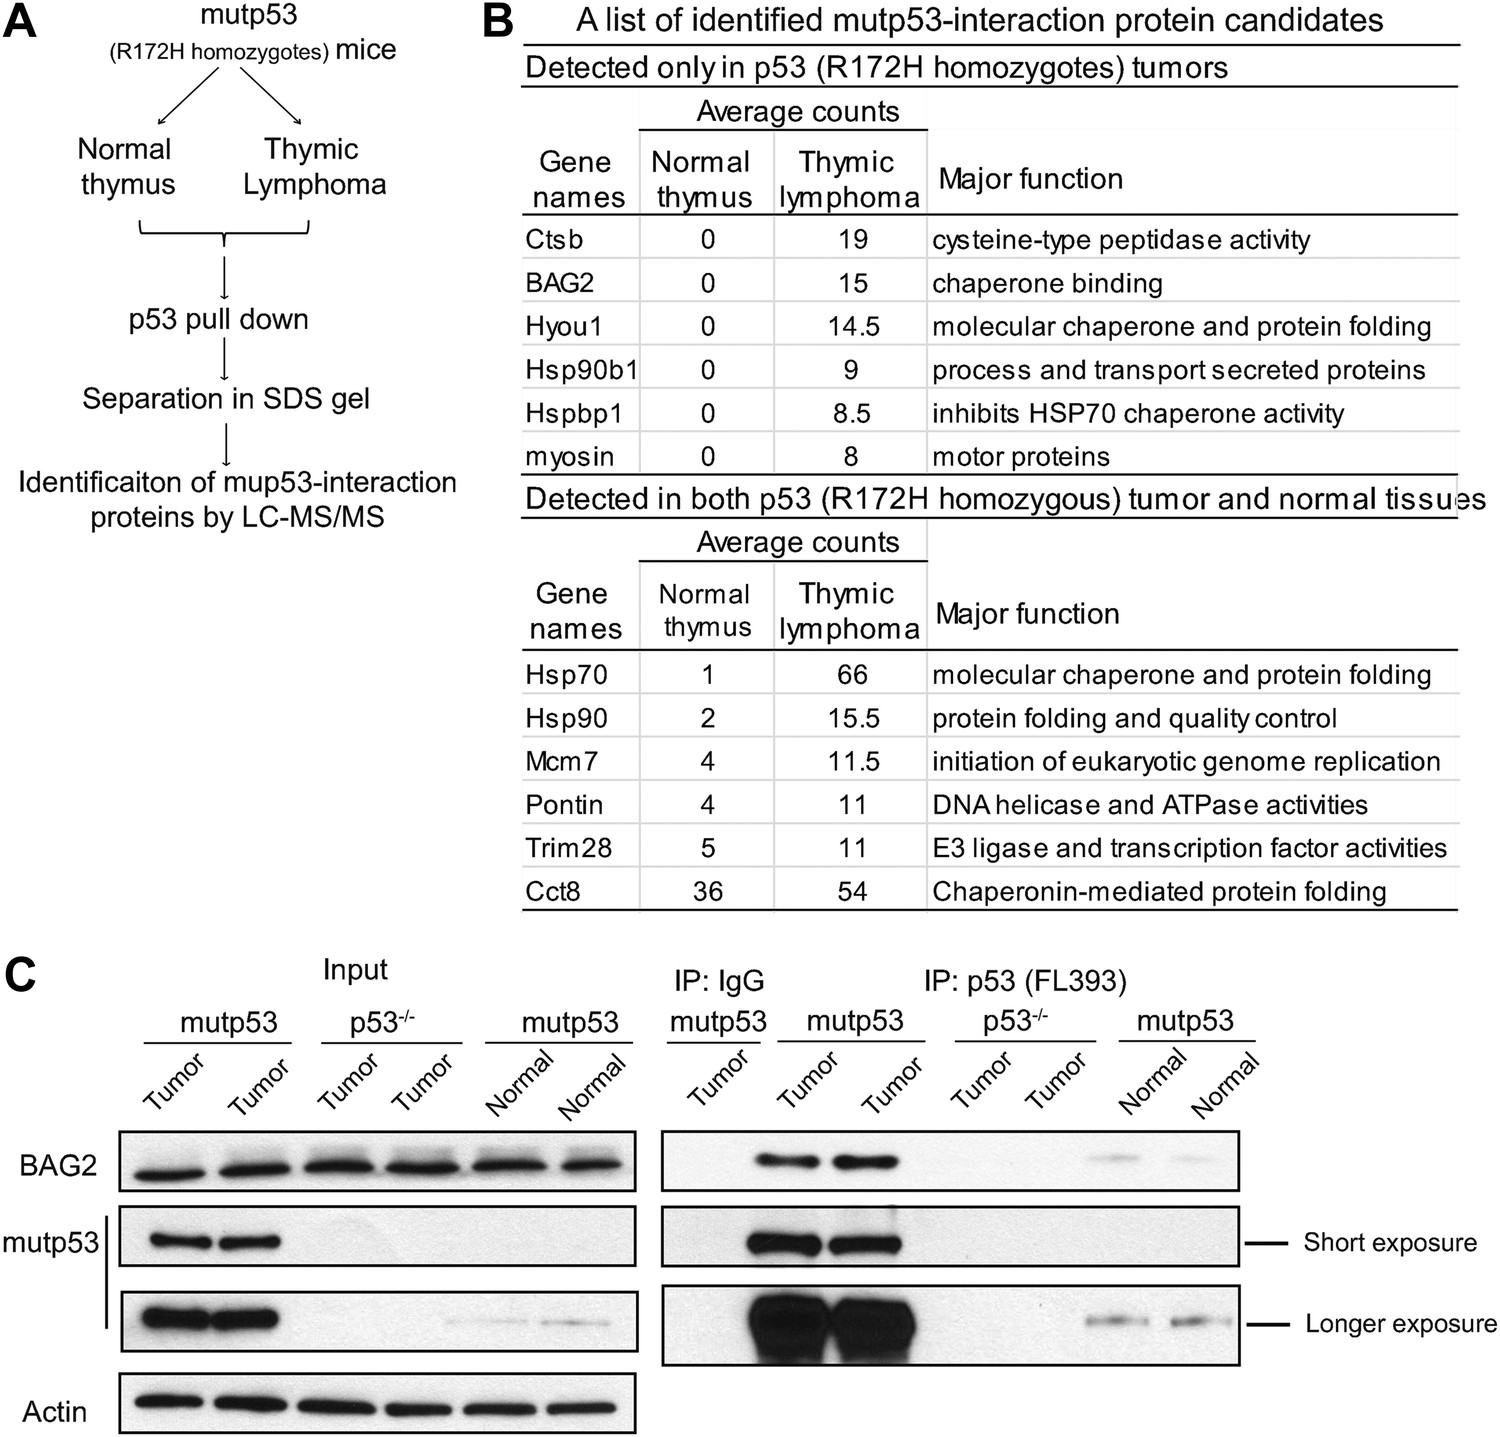
Identification of proteins interacting with mutant p53 (mutp53) protein in tumors from Trp53R172H/R172H mice.
(A) Work flow for identification of proteins interacting with mutp53 protein. Lysate of thymic lymphomas and normal thymus from Trp53R172H/R172H mice were subjected to co-immunoprecipitation (co-IP) using anti-p53 (FL393) beads. Eluted proteins were separated in a 4–15% SDS PAGE gel and analyzed by LC-MS/MS. (B) The table of a list of protein candidates that interacted with mutp53 protein. (C) The interaction of mutp53 with BAG2 in thymic lymphomas of Trp53R172H/R172H mice was confirmed by co-IP assays followed by Western blot assays. Thymic lymphomas from Trp53R172H/R172H mice and p53−/− mice as well as normal thymic tissue from Trp53R172H/R172H mice were subjected to co-IP assays using an anti-p53 antibody.
Figure 1—figure supplement 1
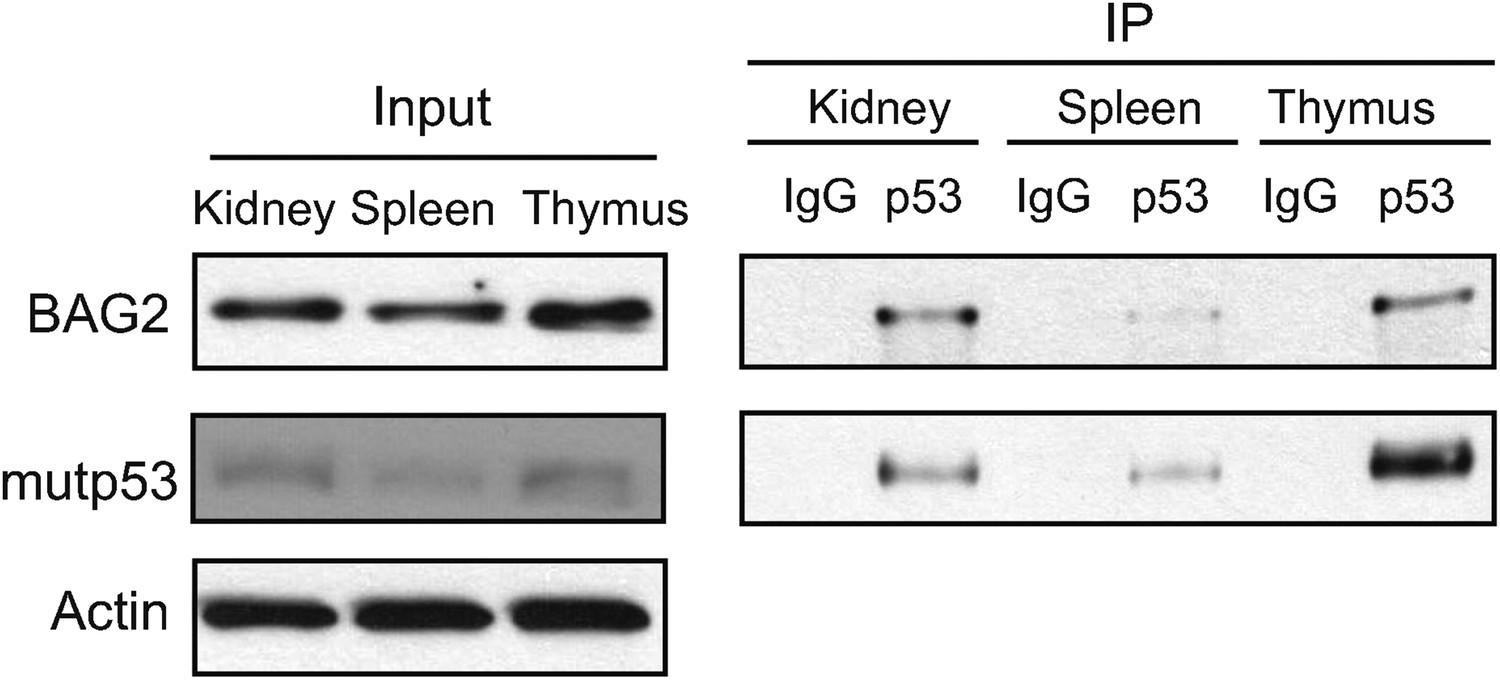
The interaction of mutp53 with BAG2 in normal mouse tissues of Trp53R172H/R172H mice.
Normal thymus, spleen and kidney tissues from Trp53R172H/R172H mice were subjected to co-IP assays using an anti-p53 antibody (FL393).
Figure 2 with 2 supplements
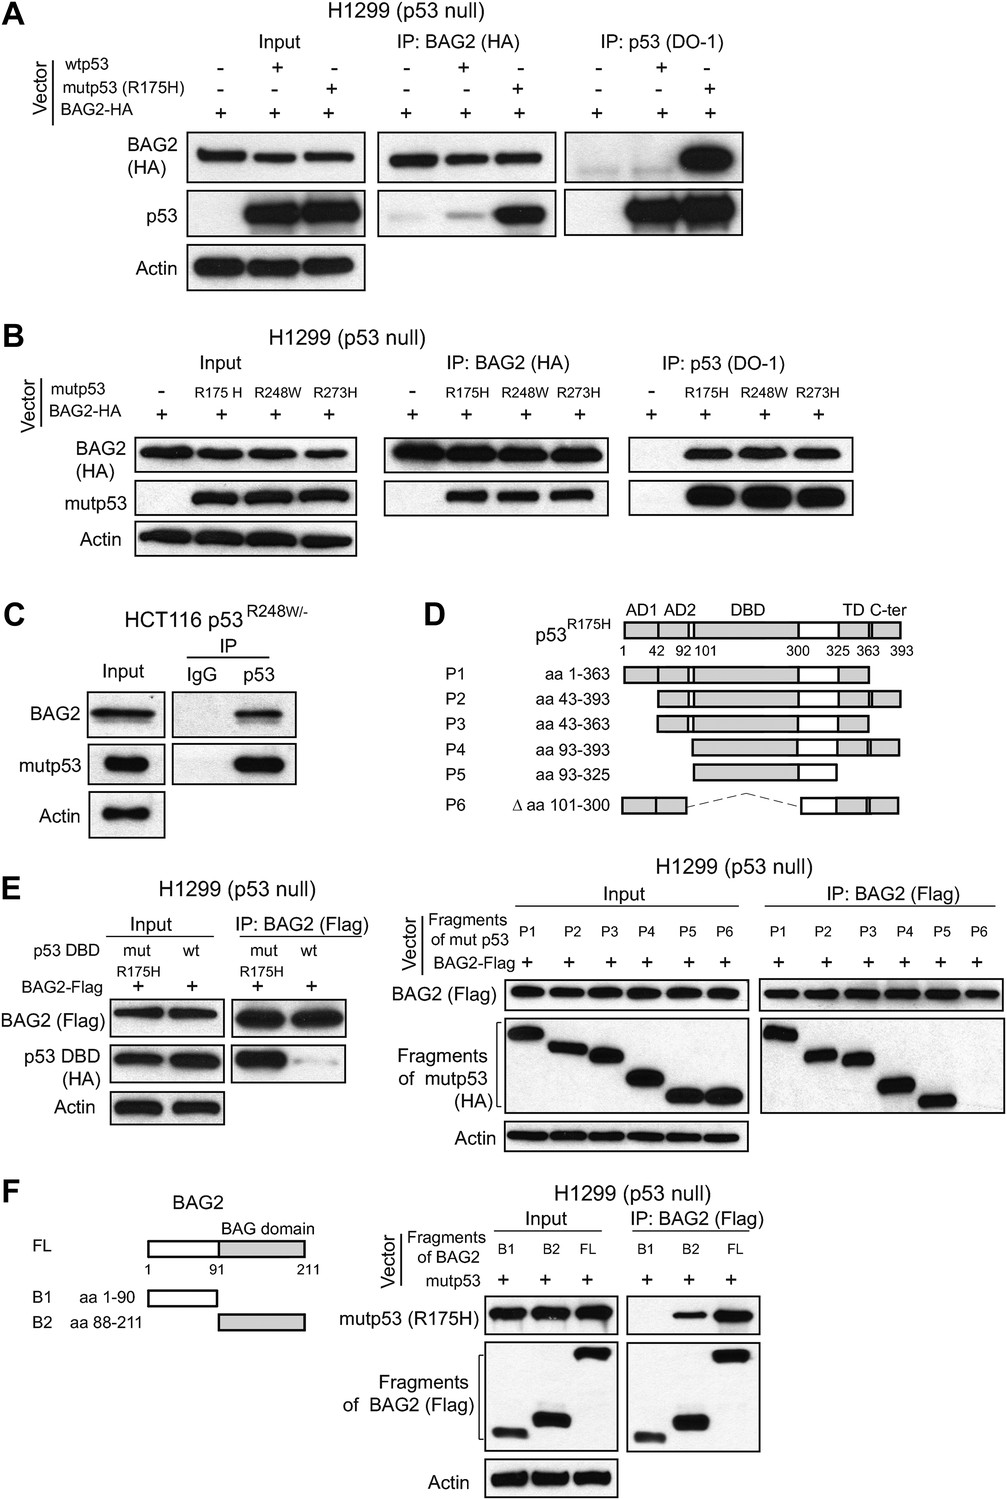
BAG2 is a mutp53-specific binding partner as determined by reciprocal co-IP assays in human cell lines.
(A) Ectopically expressed BAG2 preferentially interacted with mutp53 (R175H) protein compared with wild-type p53 (wtp53) protein in H1299 cells. H1299 cells were transiently transfected with vectors expressing mutp53 (R175H) or wtp53 together with HA-tagged BAG2 (BAG2-HA) expression vectors. Antibodies used for IP assays: HA for BAG2-HA and DO-1 for p53. (B) BAG2 interacted with several hotspot mutp53 proteins (R175H, R248W and R273H) in H1299 cells. H1299 cells were transiently transfected with vectors expressing mutp53 (R175H, R248W or R273H) together with BAG2-HA expression vectors. (C) The interaction of endogenous BAG2 with mutp53 (R248W) was observed in human colorectal cancer HCT116 p53R248W/− cells containing one allele of mutant p53 gene (R248W). (D) BAG2 interacted with mutp53 DNA binding domain (DBD). Upper panel: Schematic diagram showing the domain structure of mutp53 (R175H). Lower Panel: H1299 cells were transiently transfected with expression vectors of HA-tagged mutp53 (R175H) fragments together with BAG2-Flag expression vectors. Antibodies used for IP: Flag for BAG2-Flag proteins. (E) BAG2 preferentially interacted with the DBD of mutp53 (R175H) but not wtp53 DBD. H1299 cells were transiently transfected with expression vectors of HA-tagged mutp53 (R175H) DBD or wtp53 DBD together with BAG2-Flag expression vectors. (F) Mutp53 interacted with the Bcl-2 associated athanogene (BAG) domain of BAG2. Left panel: Schematic diagram showing the domain structure of BAG2. Right panel: H1299 cells were transiently transfected with expression vectors of mutp53 (R175H) together with Flag-tagged BAG2 fragments.
Figure 2—figure supplement 1
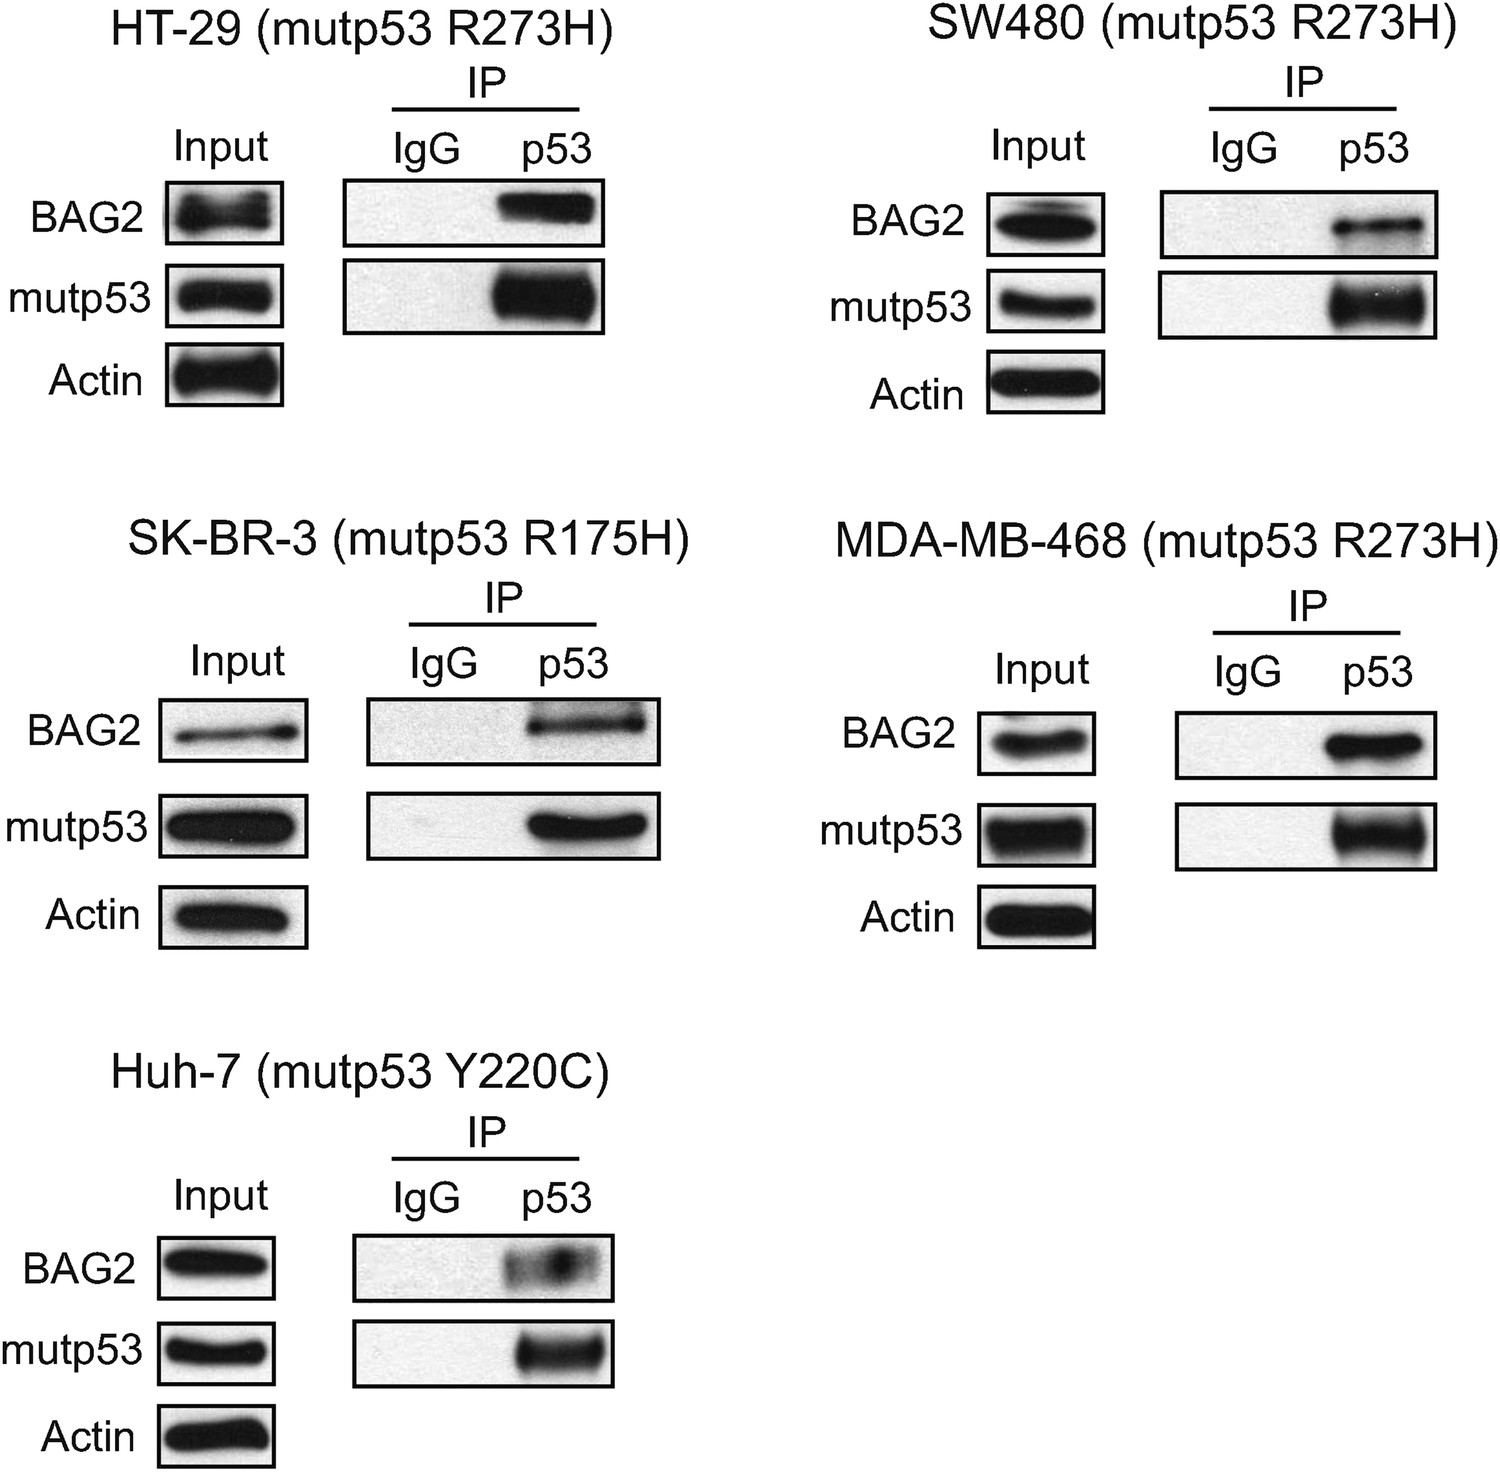
The interaction of endogenous BAG2 with mutp53 in several human tumor cell lines containing endogenous mutp53.
The interaction of endogenous BAG2 with mutp53 was observed in human colorectal cancer HT-29 and SW480 cell lines which contain one allele of mutant Trp53 gene (R273H), human breast cancer SK-BR-3 and MDA-MB-468 cell lines which contain one allele of mutant Trp53 gene (R175H and R273H, respectively), and human hepatocellular carcinoma Huh-7 cells which contain one allele of mutant Trp53 gene (Y220C).
Figure 2—figure supplement 2
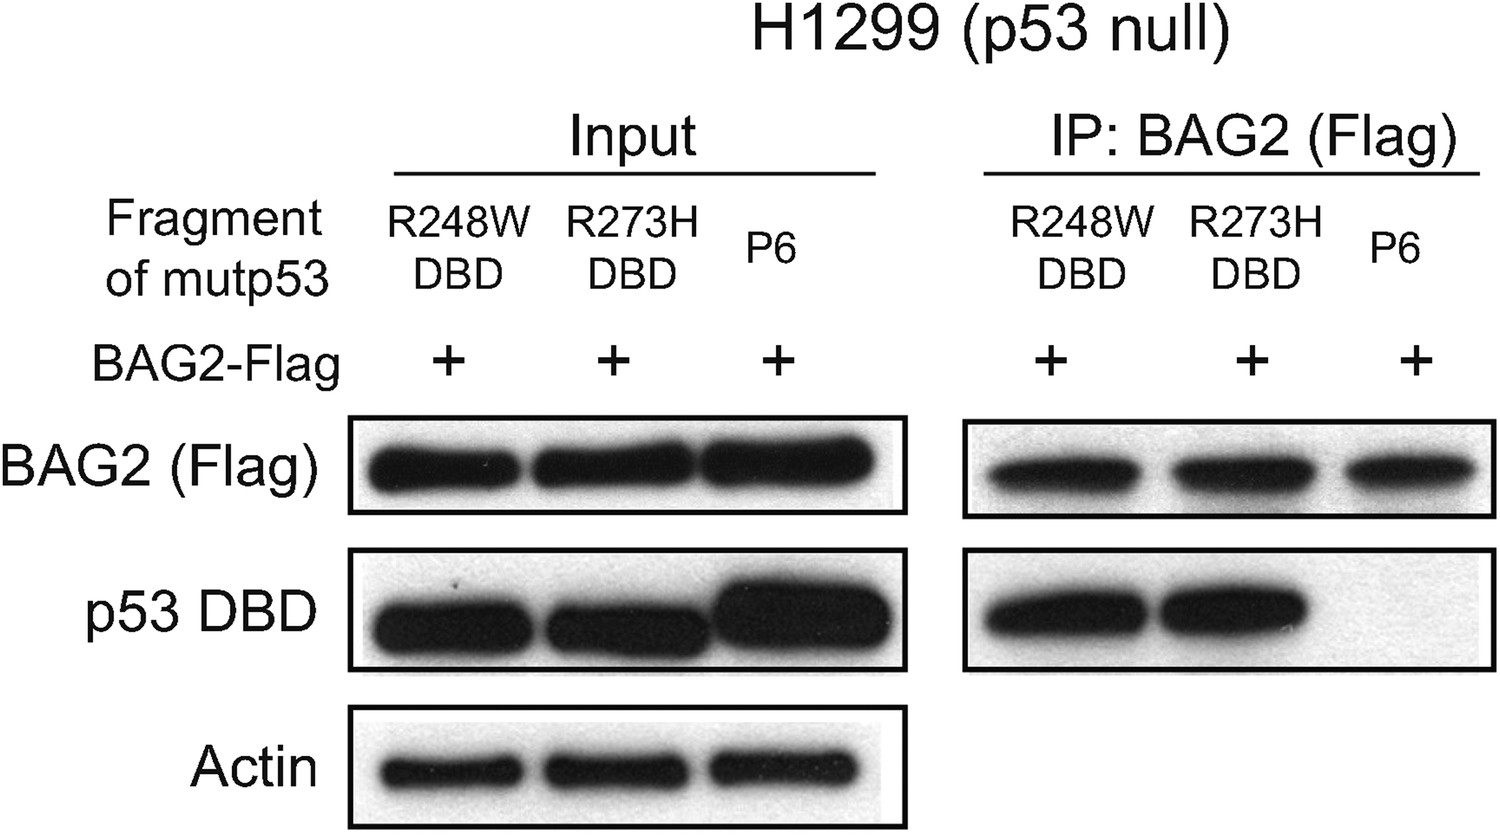
The interaction of BAG2 with mutp53 (R248W and R273H) DBD in H1299 cells.
BAG2 interacted with DBD of mutp53 (R248W and R273H) but not the mutp53 fragments lacking DBD. H1299 cells were transiently transfected with expression vectors of the HA-tagged DBD of mutp53 (R248W and R273H) or mutp53 fragment lacking DBD (P6 as indicated in Figure 2D) together with BAG2-Flag expression vectors.
Figure 3 with 3 supplements

BAG2 promotes mutp53 protein accumulation in human cancer cells through the inhibition of the ubiquitination and degradation of mutp53 mediated by MDM2.
(A) Knockdown of endogenous BAG2 by 2 different siRNA oligos decreased the mutp53 protein levels in HCT116 p53R248W/− and Saos2 cells with stable ectopic expression of mutp53 (Saos2-R175H, Saos2-R248W and Saos2-R273H). The knockdown of BAG2 by siRNA at the protein level was examined by Western blot assays. (B) The efficient knockdown of BAG2 by siRNA was confirmed at the mRNA level by real-time PCR. Data are present as mean ±SD (n = 3). (C) Ectopic expression of BAG2 by transfection of BAG2-HA expression vectors increased the mutp53 protein levels in cells. (D) Knockdown of endogenous BAG2 by siRNA decreased the mutp53 protein levels in HCT116p53R248W/−, Saos2-R175H, Saos2-R248W and Saos2-R273H cells but not in these cells treated with the proteasome inhibitor MG132 (40 µM for 6 hr). (E) BAG2 inhibited the degradation of mutp53 (R175H) mediated by MDM2 in H1299 cells. Indicated combination of expression vectors of BAG2-HA, mutp53 (R175H), MDM2 were transfected into the cells. (F) Knockdown of MDM2 abolished the effect of BAG2 knockdown on mutp53 protein level. Knockdown of endogenous BAG2 decreased mutp53 protein levels in Saos2-R175H cells but not in cells with knockdown of endogenous MDM2. (G) BAG2 reduced the interaction of mutp53 with MDM2 in H1299 cells as determined by IP assays. Indicated combination of expression vectors of BAG2-HA, mutp53 (R175H) and MDM2 were transfected into the cells. Antibodies used for IP: DO-1 for p53. (H) Ectopic BAG2 expression decreased the ubiquitination levels of mutp53 in H1299 cells. Cells were transfected with indicated combination of expression vectors of BAG2-HA, mutp53 (R175H), His-ubiquitin (His-Ub), followed by MG132 treatment. Mutp53 ubiquitination was determined by IP using DO-1 antibody (for mutp53) followed by Western blot assays using an anti-Ub antibody. (I) Knockdown of endogenous BAG2 increased the ubiquitination levels of mutp53 in Saos2-R175H cells. Cells were transfected with indicated combination of BAG2 siRNAs and expression vectors of His-Ub followed by MG132 treatment.
Figure 3—figure supplement 1
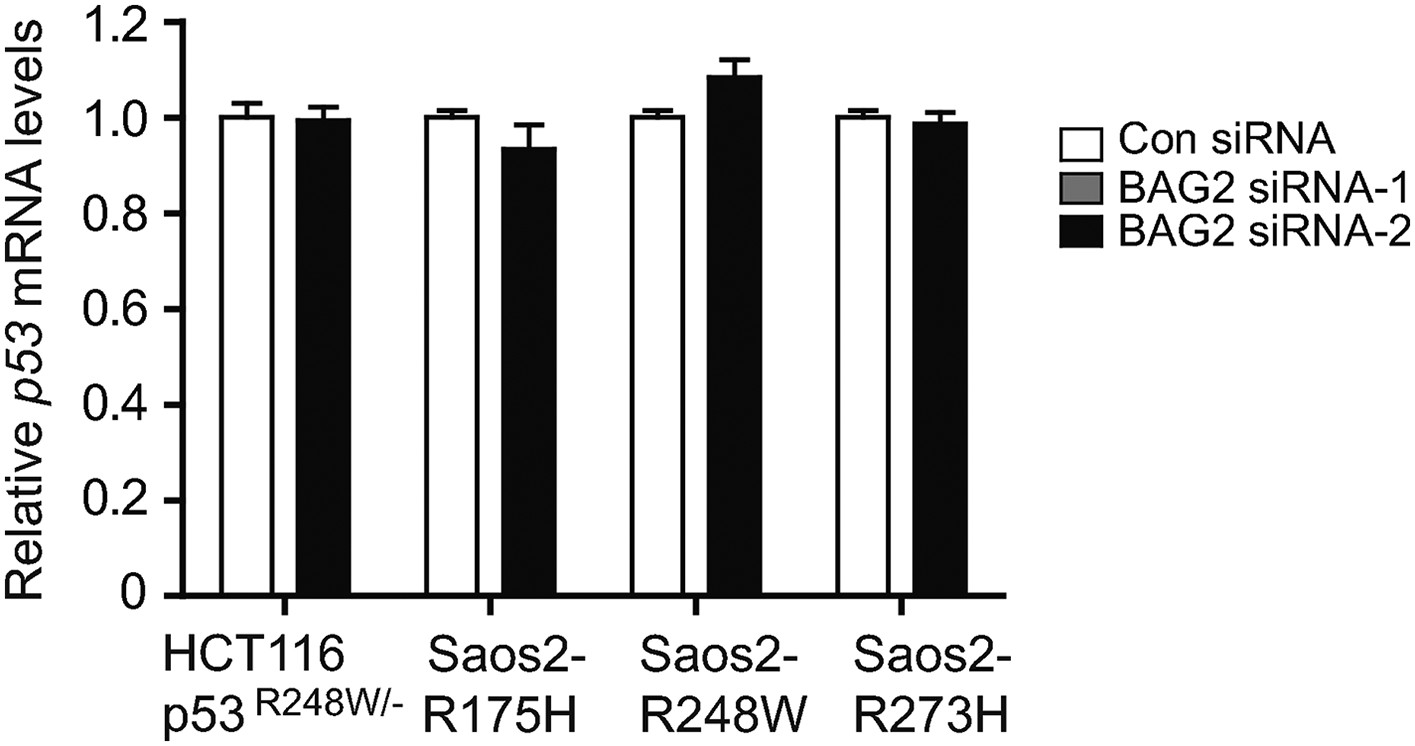
Knockdown of BAG2 has no apparent effect on mutp53 mRNA expression levels in human cancer cells.
Knockdown of endogenous BAG2 had no apparent effect on the mRNA levels of mutp53 in HCT116 p53R248W/− and Saos2 cells with stable ectopic expression of mutp53 (Saos2-R175H, Saos2-R248W and Saos2-R273H). Data are present as mean ±SD (n = 3).
Figure 3—figure supplement 2
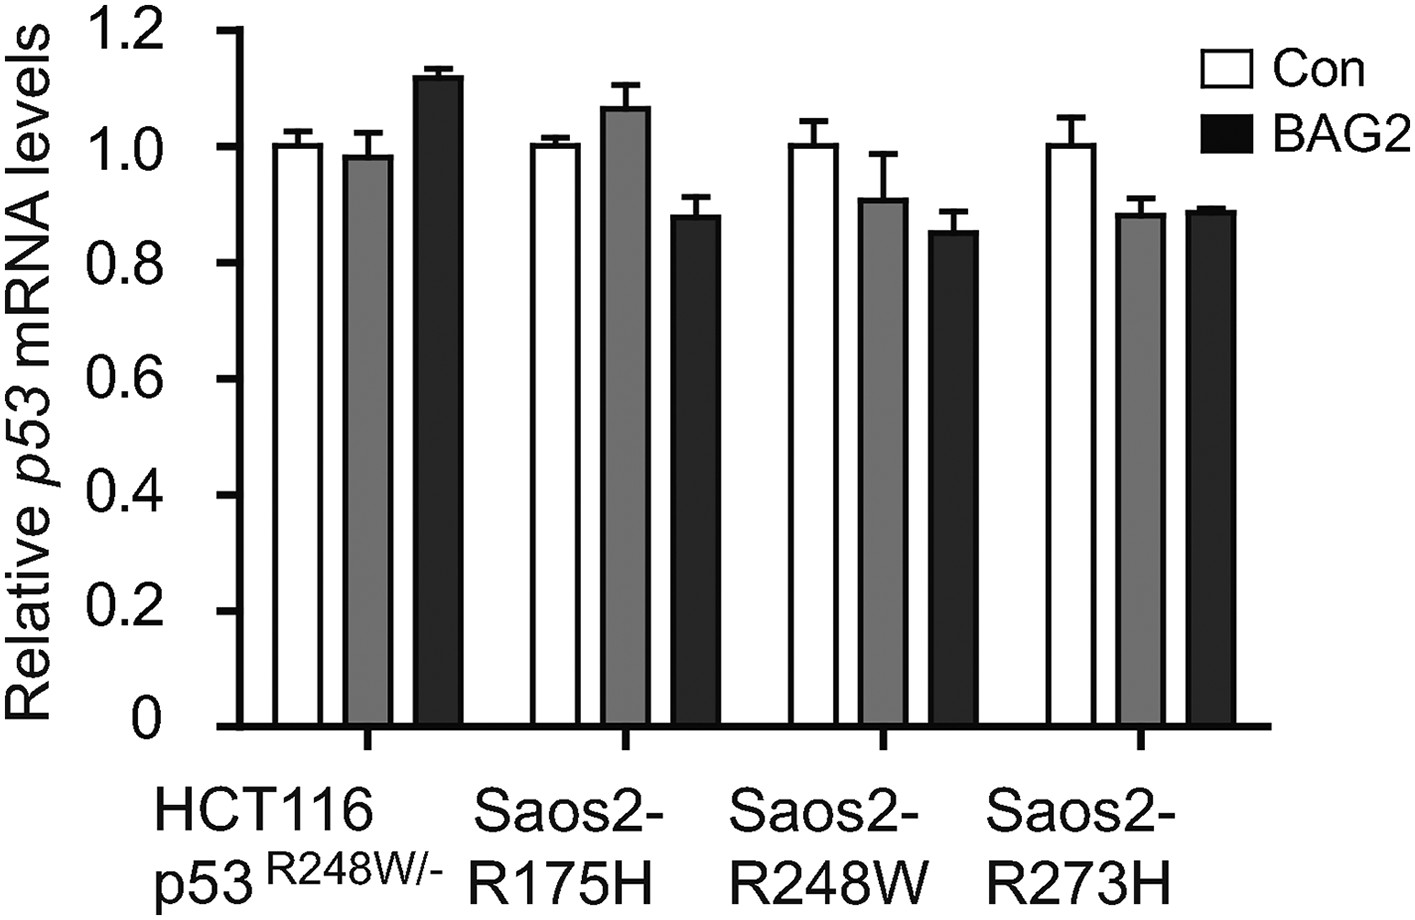
Ectopic expression of BAG2 has no apparent effect on mutp53 mRNA expression levels in human cancer cells.
Ectopic expression of BAG2 had no apparent effect on the mRNA levels of mutp53 in HCT116 p53R248W/− and Saos2 cells with stable ectopic expression of mutp53 (Saos2-R175H, Saos2-R248W and Saos2-R273H). Data are present as mean ±SD (n = 3).
Figure 3—figure supplement 3
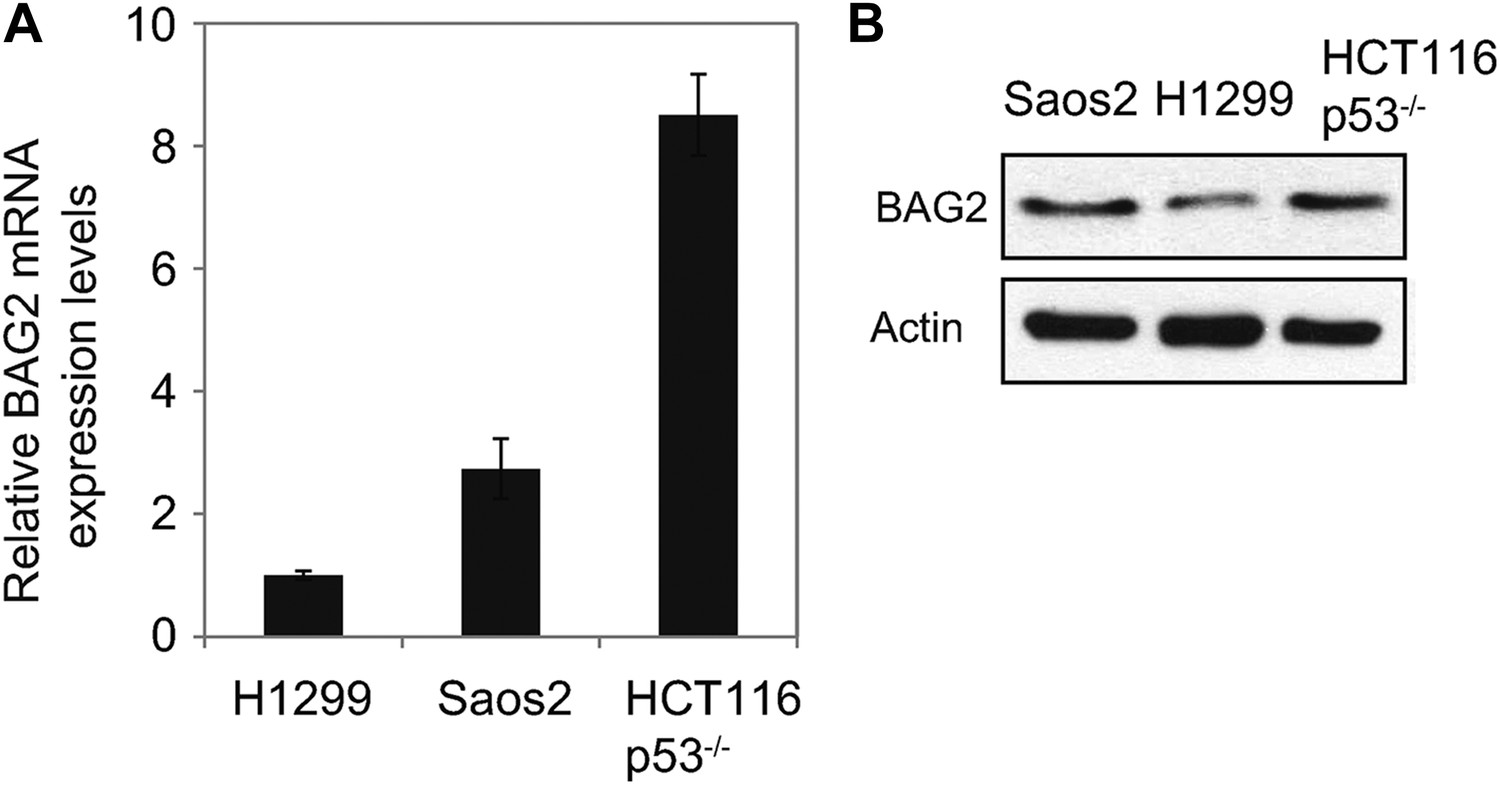
The expression levels of BAG2 in H1299, Saos2 and HCT116 p53−/− cells.
(A) The mRNA expression levels of BAG2 were examined in cells by using Taqman real-time PCR and normalized with actin. Data are presented as mean ±SD (n = 6). (B) The protein levels of BAG2 were examined in cells by Western blot assays.
Figure 4
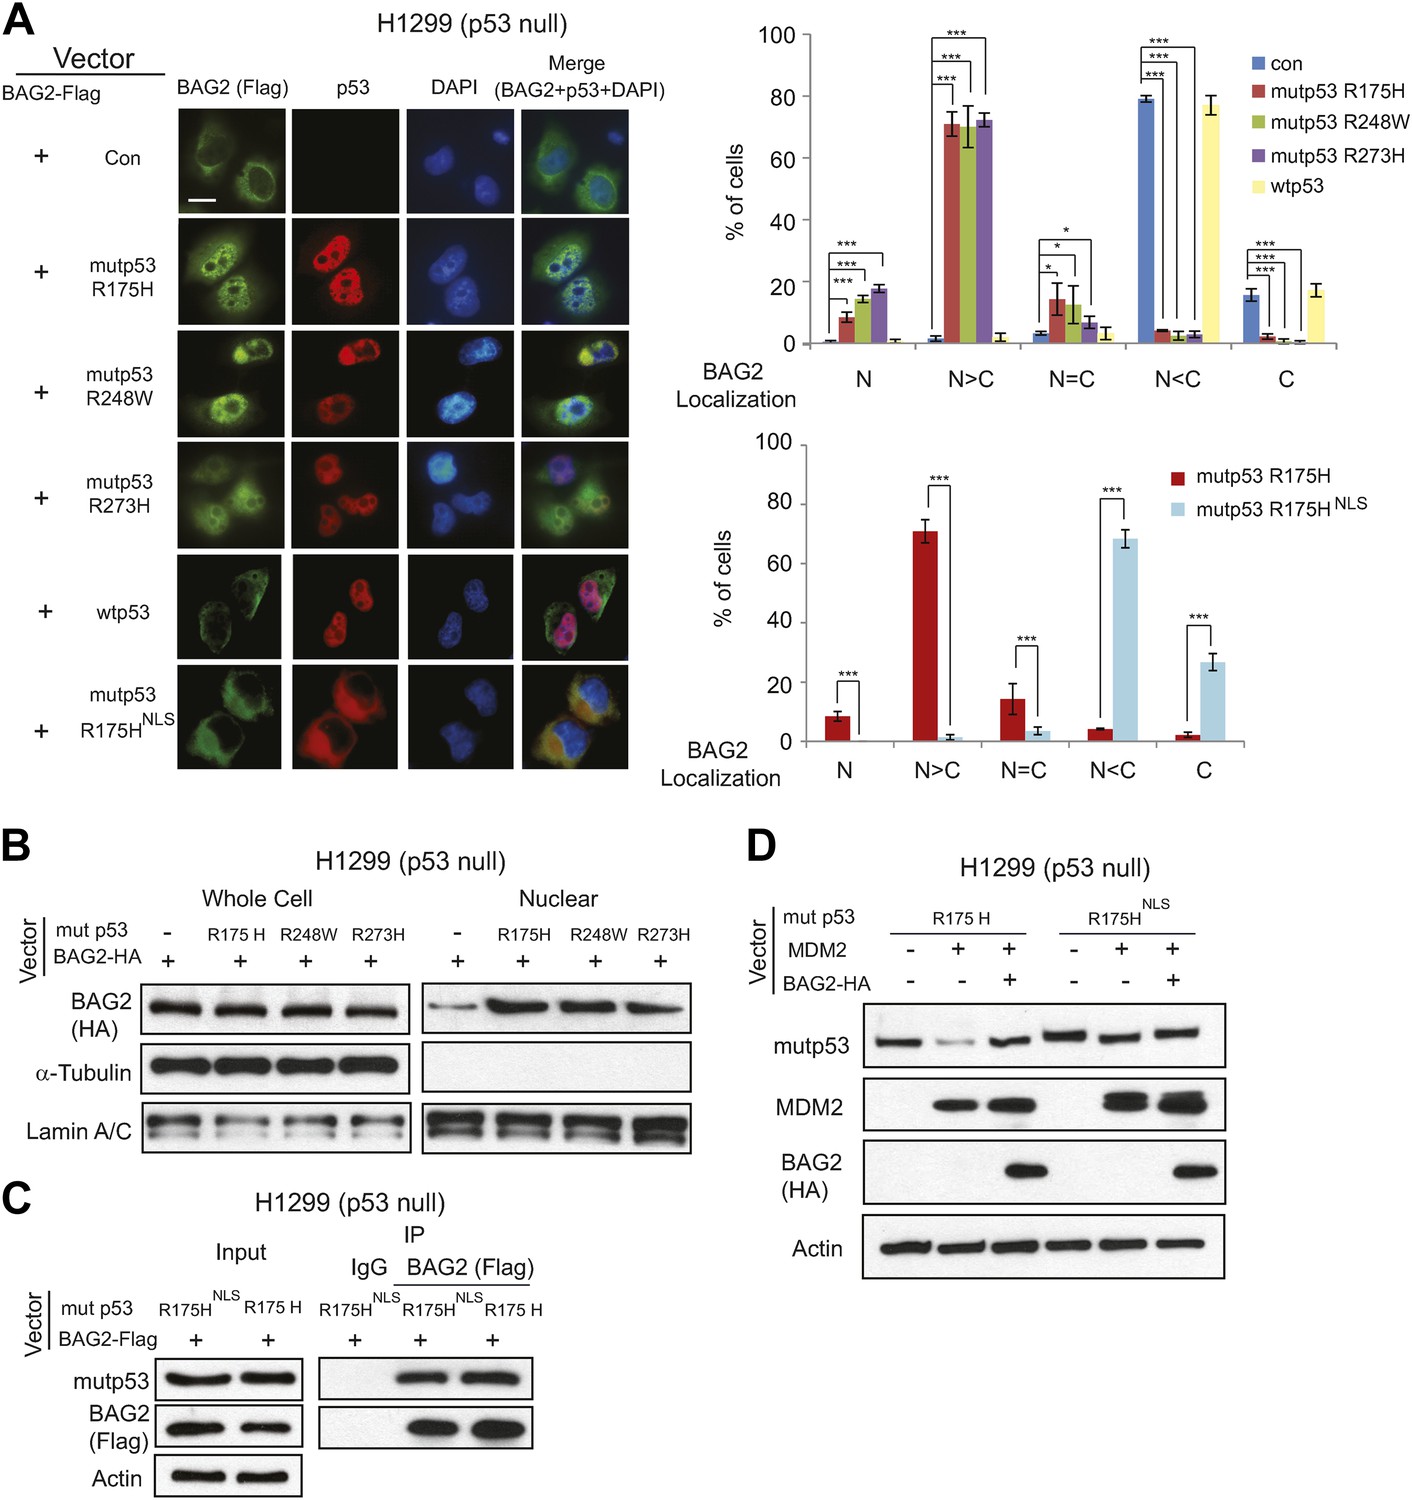
Mutp53 promotes the nuclear translocation of BAG2.
(A) H1299 cells were transiently transfected with vectors expressing BAG2-HA together with or without expression vectors of mutp53 (R175H, R248W, R273H, or R175HNLS) and wtp53. The protein localization of BAG2 and p53 in cells was determined by immunofluorescence (IF) staining. Antibody used for IF: Flag for BAG2-Flag and FL393 for p53. Nuclei were stained with DAPI. Left panels: representative IF images. Scale bar: 10 µm. Right panels: quantification of the subcellular distribution of BAG2 in 200 cells for each independent experiment. Numerical data are presented in Figure 4—source data 1. Data are present as mean ±SD (n = 4). *p < 0.05; ***p < 0.001. (B) Mutp53 promotes the nuclear translocation of BAG2 in H1299 cells as determined by Western blot assays. The protein levels of BAG2 were determined in whole cell lysates and nuclear extracts prepared from H1299 cells transfected with vectors expressing BAG2-HA together with or without mutp53 (R175H, R248W or R273H). (C) BAG2 interacted with mutp53NLS (R175HNLS) as determined by co-IP assays. H1299 cells were transfected with vectors expressing BAG2-Flag and mutp53 R175H or mutp53 R175HNLS. (D) MDM2 had a much reduced effect on degradation of mutp53NLS compared with mutp53 (R175H). While BAG2 inhibited the degradation of mutp53 (R175H) mediated by MDM2, it had no obvious effect on mutp53NLS protein levels in H1299 cells transfected with vectors expressing BAG2-HA, MDM2 and mutp53NLS.
-
Figure 4—source data 1
% of cells with different BAG2 localization in H1299 cells.
- https://doi.org/10.7554/eLife.08401.014
Figure 5
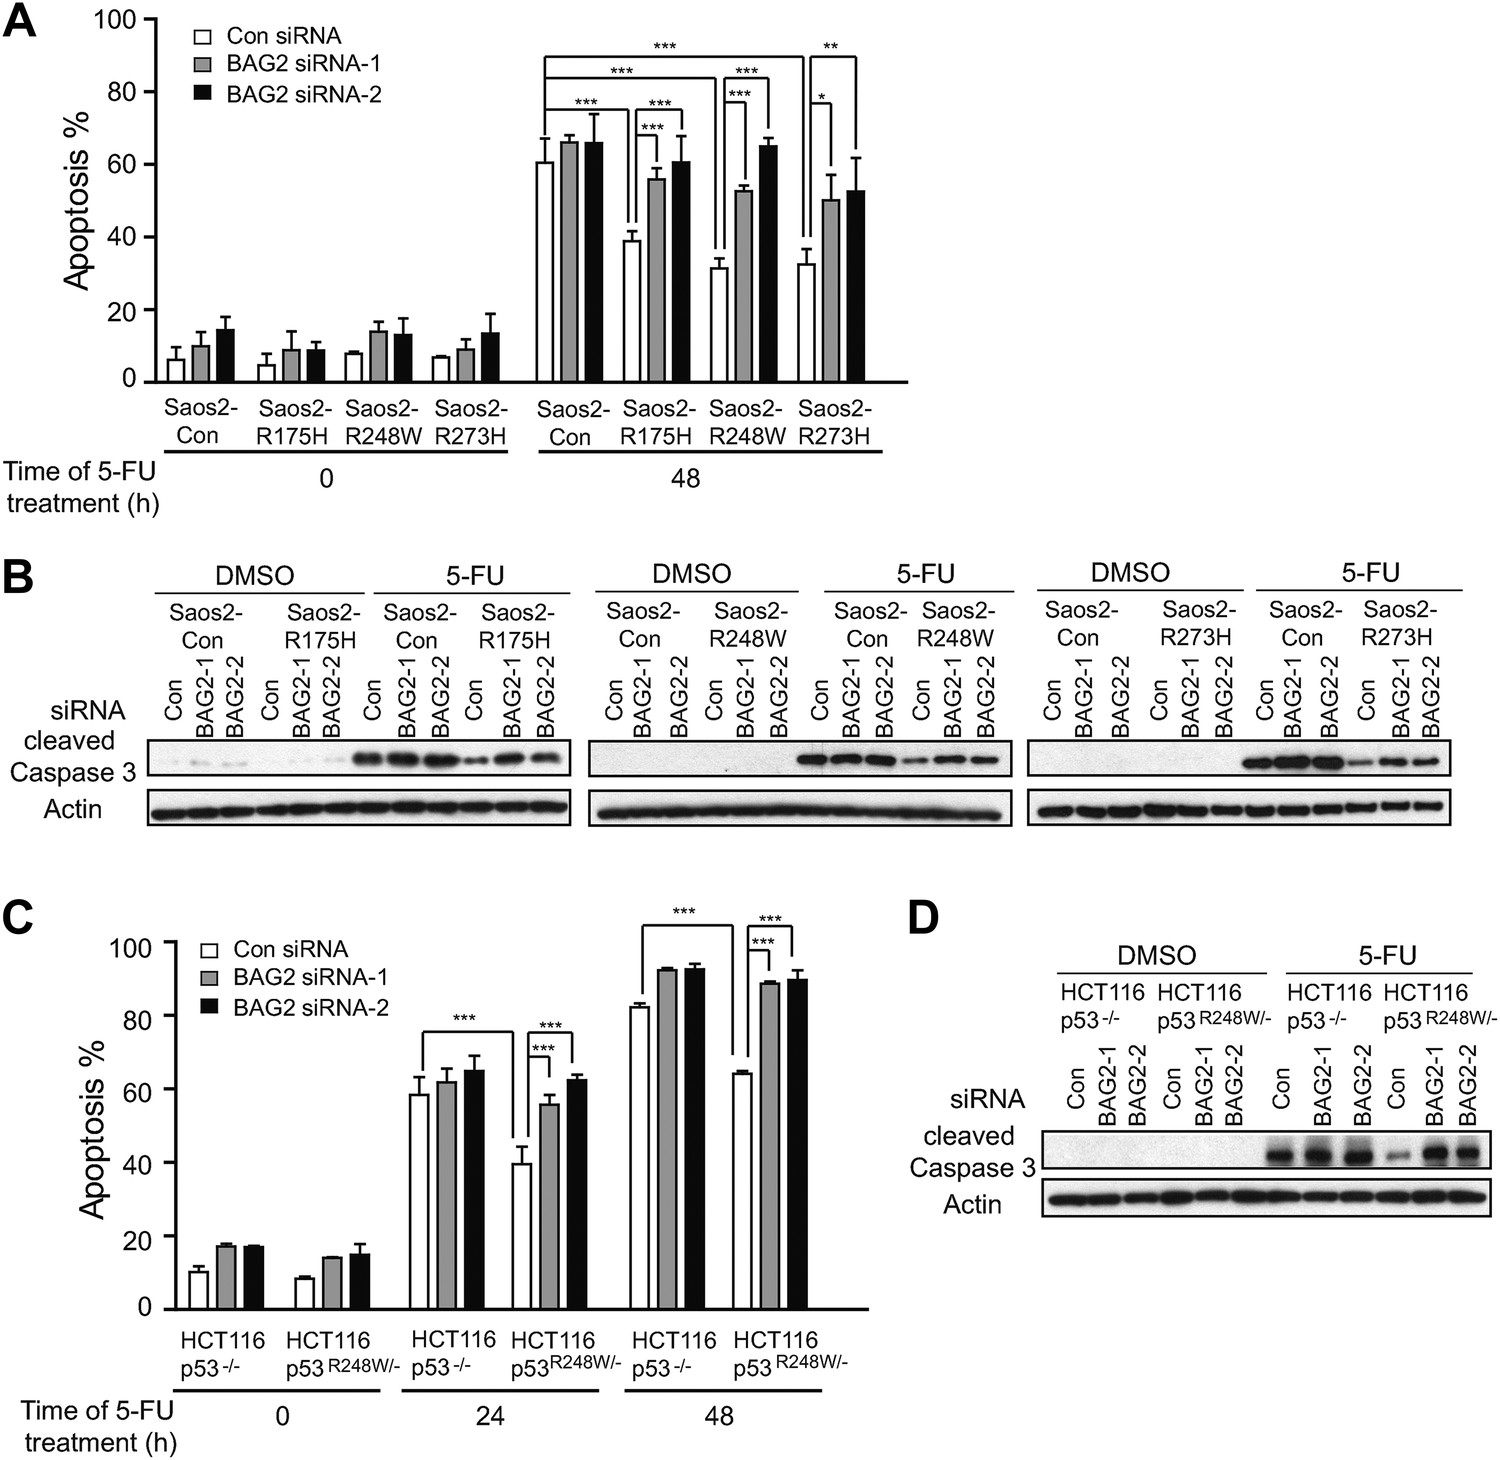
BAG2 promotes mutp53 gain-of-function (GOF) in chemoresistance.
(A, B) BAG2 knockdown increased 5-FU-induced apoptosis in Saos2 cells in a largely mutp53-dependent manner. The endogenous BAG2 was knocked down by siRNA in Saos2-Con, Saos2-R175H, Saos2-R248W and Saos2-R273H cells followed by 5-FU treatment (4 mM) for 48 hr. In A, Annexin V assays were used to determine the percentage of apoptotic cells. Data are present as mean ±SD, n = 4. *p < 0.05; **p < 0.01; ***p < 0.001. In B, the levels of cleaved Caspase 3, which reflect the degree of apoptosis of cells, were determined by Western blot assays. (C, D) BAG2 knockdown increased 5-FU-induced apoptosis in HCT116 p53R248W/− cells but had a limited effect in HCT116 p53−/− cells as determined by Annexin V assays (C) and Western blot assays for the cleaved Caspase 3 protein levels (D). Numerical data for A and C are presented in Figure 5—source data 1, 2, respectively.
-
Figure 5—source data 1
% of apoptosis induced by 5-FU in Saos2 cells with and without ectopic expression of mutp53.
- https://doi.org/10.7554/eLife.08401.016
-
Figure 5—source data 2
% of apoptosis induced by 5-FU in HCT116 cells with and without mutp53.
- https://doi.org/10.7554/eLife.08401.017
Figure 6 with 2 supplements
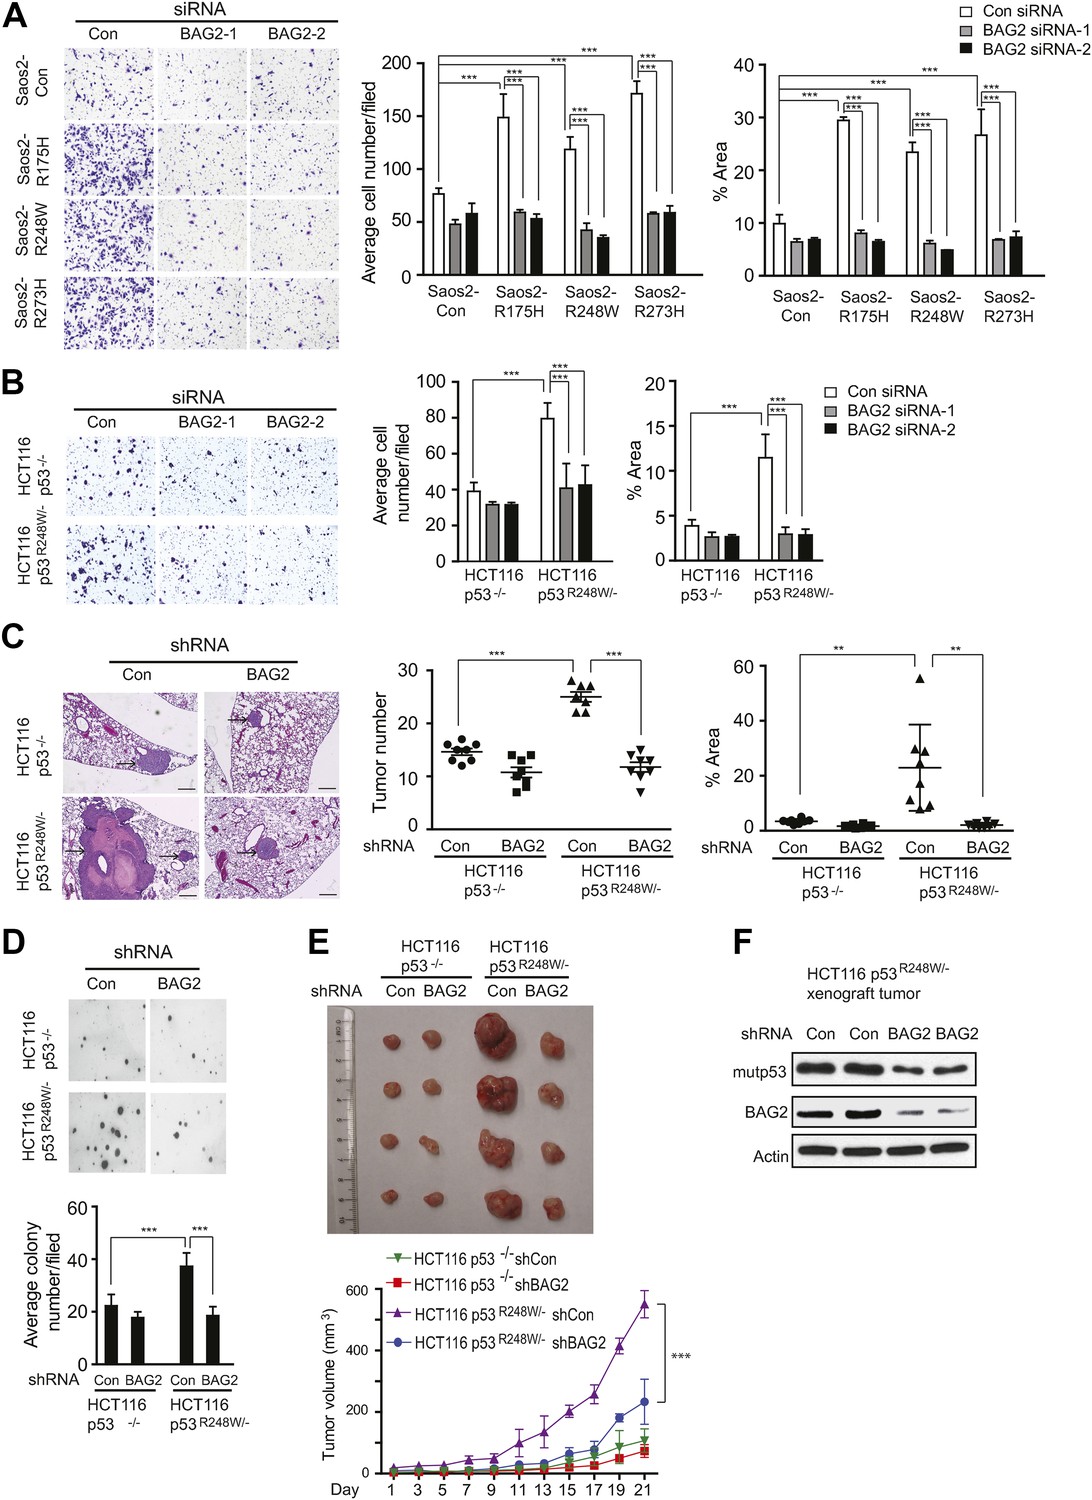
BAG2 promotes mutp53 GOF in promoting metastasis and tumor cell growth.
(A) Knockdown of endogenous BAG2 by 2 siRNA oligos preferentially inhibited the migration ability of Saos2-R175H, Saos2-R248W and Saos2-R273H cells compared with Saos2-Con cells as determined by transwell assays. Left panel: representative images form a portion of the field. Right panel: quantification of average number and area of migrated cells/field. (B) Knockdown of endogenous BAG2 preferentially inhibited the migration ability of HCT116 p53R248W/− cells compared with HCT116 p53−/− cells. For A, B, date are presented as mean ±SD, n = 4. ***p < 0.001. (C) BAG2 knockdown greatly inhibited lung metastasis of HCT116 p53R248W/− cells but had a limited effect on HCT116 p53−/− cells in vivo. HCT116 p53R248W/− and HCT116 p53−/− cells stably infected with shRNA against BAG2 and their control cells were injected into the nude mice via the tail vein. The number and size of lung metastatic tumors were determined at 6 weeks after inoculation. Left panel: representative H&E images of lung sections. Scale bar: 200 µm. Middle and Right panels: quantification of average number (middle panel) and area (right panel) of lung metastatic tumors, respectively. Date are presented as mean ±SD, n = 8/group. **p < 0.01; ***p < 0.001. (D) Knockdown of BAG2 by shRNA preferentially inhibited the anchorage-independent growth in HCT116p53R248W/− cells but not HCT116 p53−/− cells. Upper panel: representative images of cell colonies in soft agar. Lower panel: quantification of average number of colonies/field. Date are presented as mean ±SD, n = 4. ***p < 0.001. (E) BAG2 knockdown inhibited the growth of HCT116 xenograft tumors in a largely mutp53-dependent manner. HCT116 p53R248W/− and HCT116 p53−/− cells stably infected with shRNA against BAG2 and their control cells were employed for xenograft tumor formation in nude mice. Upper panel: A representative image of xenograft tumors. Lower panel: growth curves of xenograft tumors. Tumor volumes are presented as mean ±SD, n = 6/group. ***p < 0.001. (F) BAG2 knockdown decreased mutp53 protein levels in HCT116 p53R248w/− xenograft tumors as determined by Western blot assays.
Figure 6—figure supplement 1
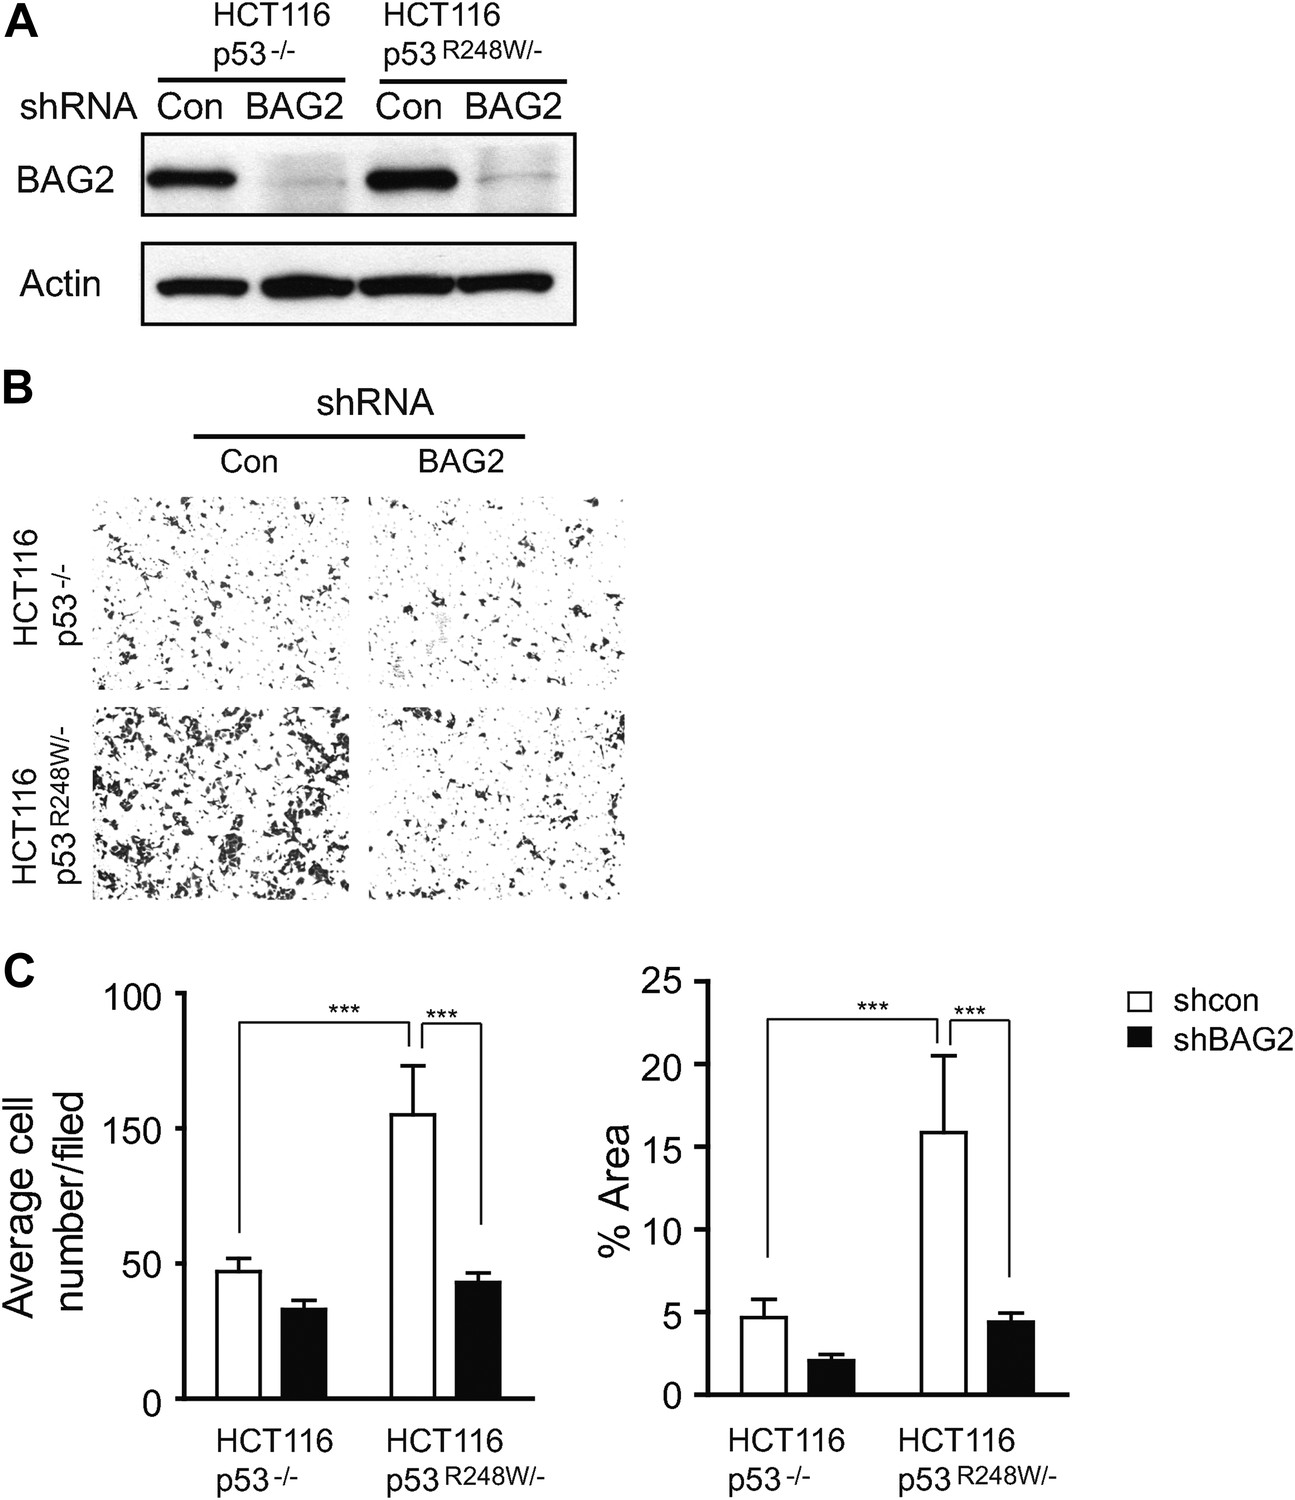
Knockdown of endogenous BAG2 by shRNA vectors inhibited mutp53 GOF in promoting migration in cells.
(A) Knockdown of endogenous BAG2 by shRNA vectors was confirmed at the protein level in HCT116 p53R248W/− and HCT116 p53−/− cells by Western blot assays. (B, C) Knockdown of endogenous BAG2 by shRNA vectors preferentially inhibited the migration ability of HCT116 p53R248W/− cells compared with HCT116 p53−/− cells as determined by the transwell assays. (B) Representative images from a portion of the field. (C) Quantification of average number (left panel) and area (right panel) of migrated cells/field. Date are presented as mean ±SD, n = 6. ***p < 0.001.
Figure 6—figure supplement 2
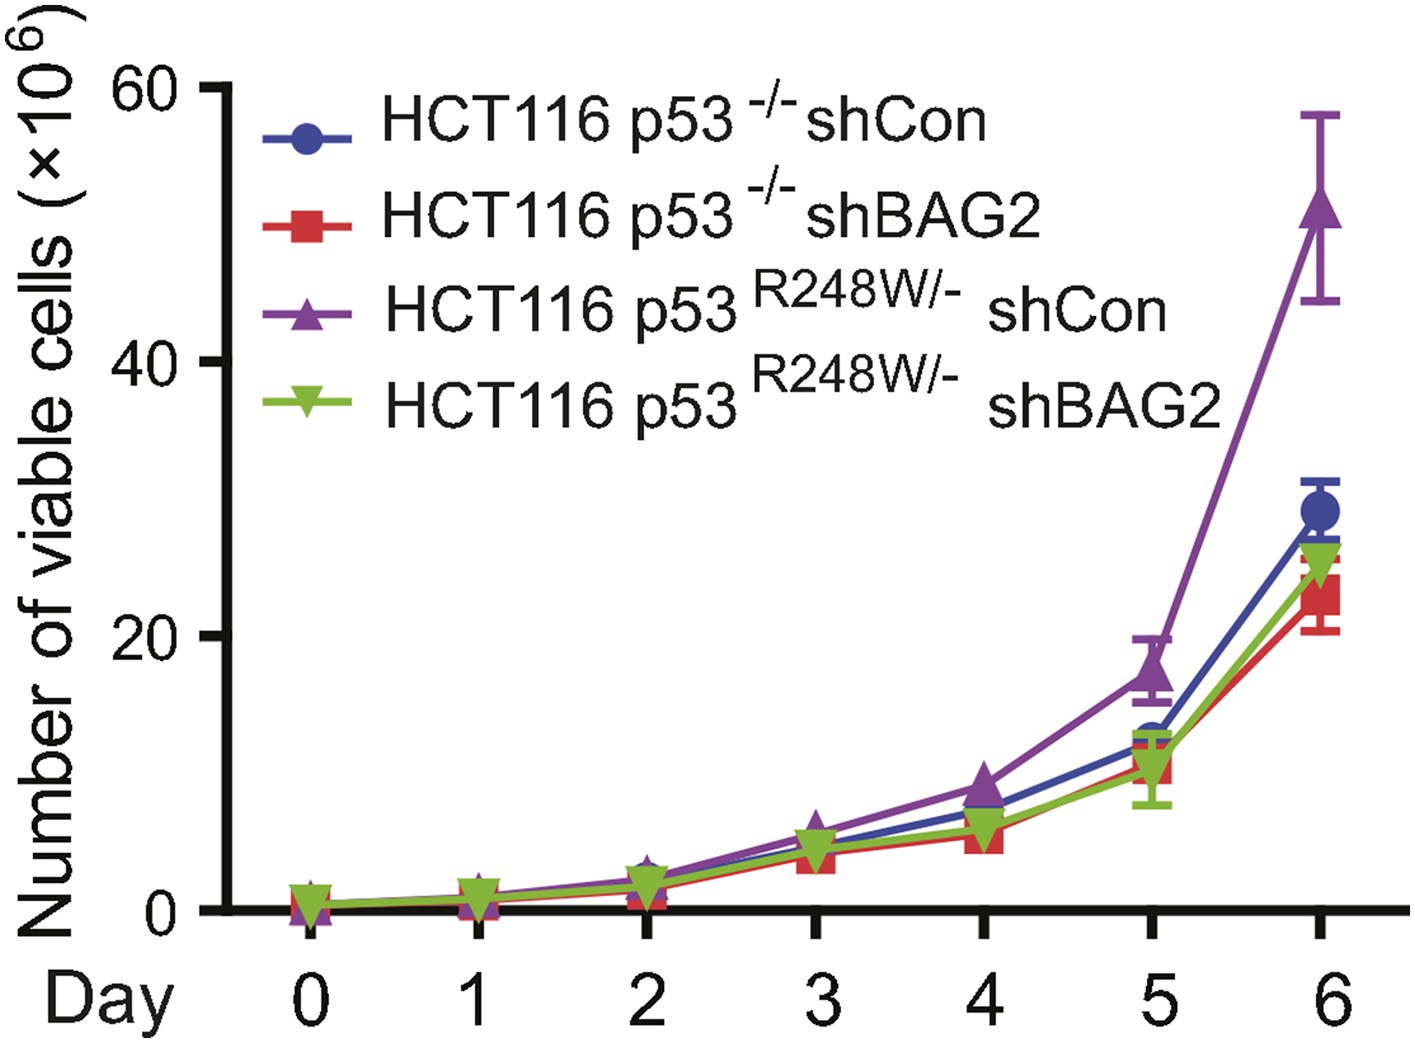
BAG2 knockdown by shRNA inhibited the proliferation rate in HCT116 p53R248W/− cells but not HCT116 p53−/− cells.
Numbers of viable cells of HCT116 p53R248W/− but not HCT116 p53−/− cells with and without knockdown of BAG2 were counted daily by the Vi-CELL cell counter (Beckman Coulter). Date are presented as mean ±SD, n = 4.
Figure 7 with 1 supplement
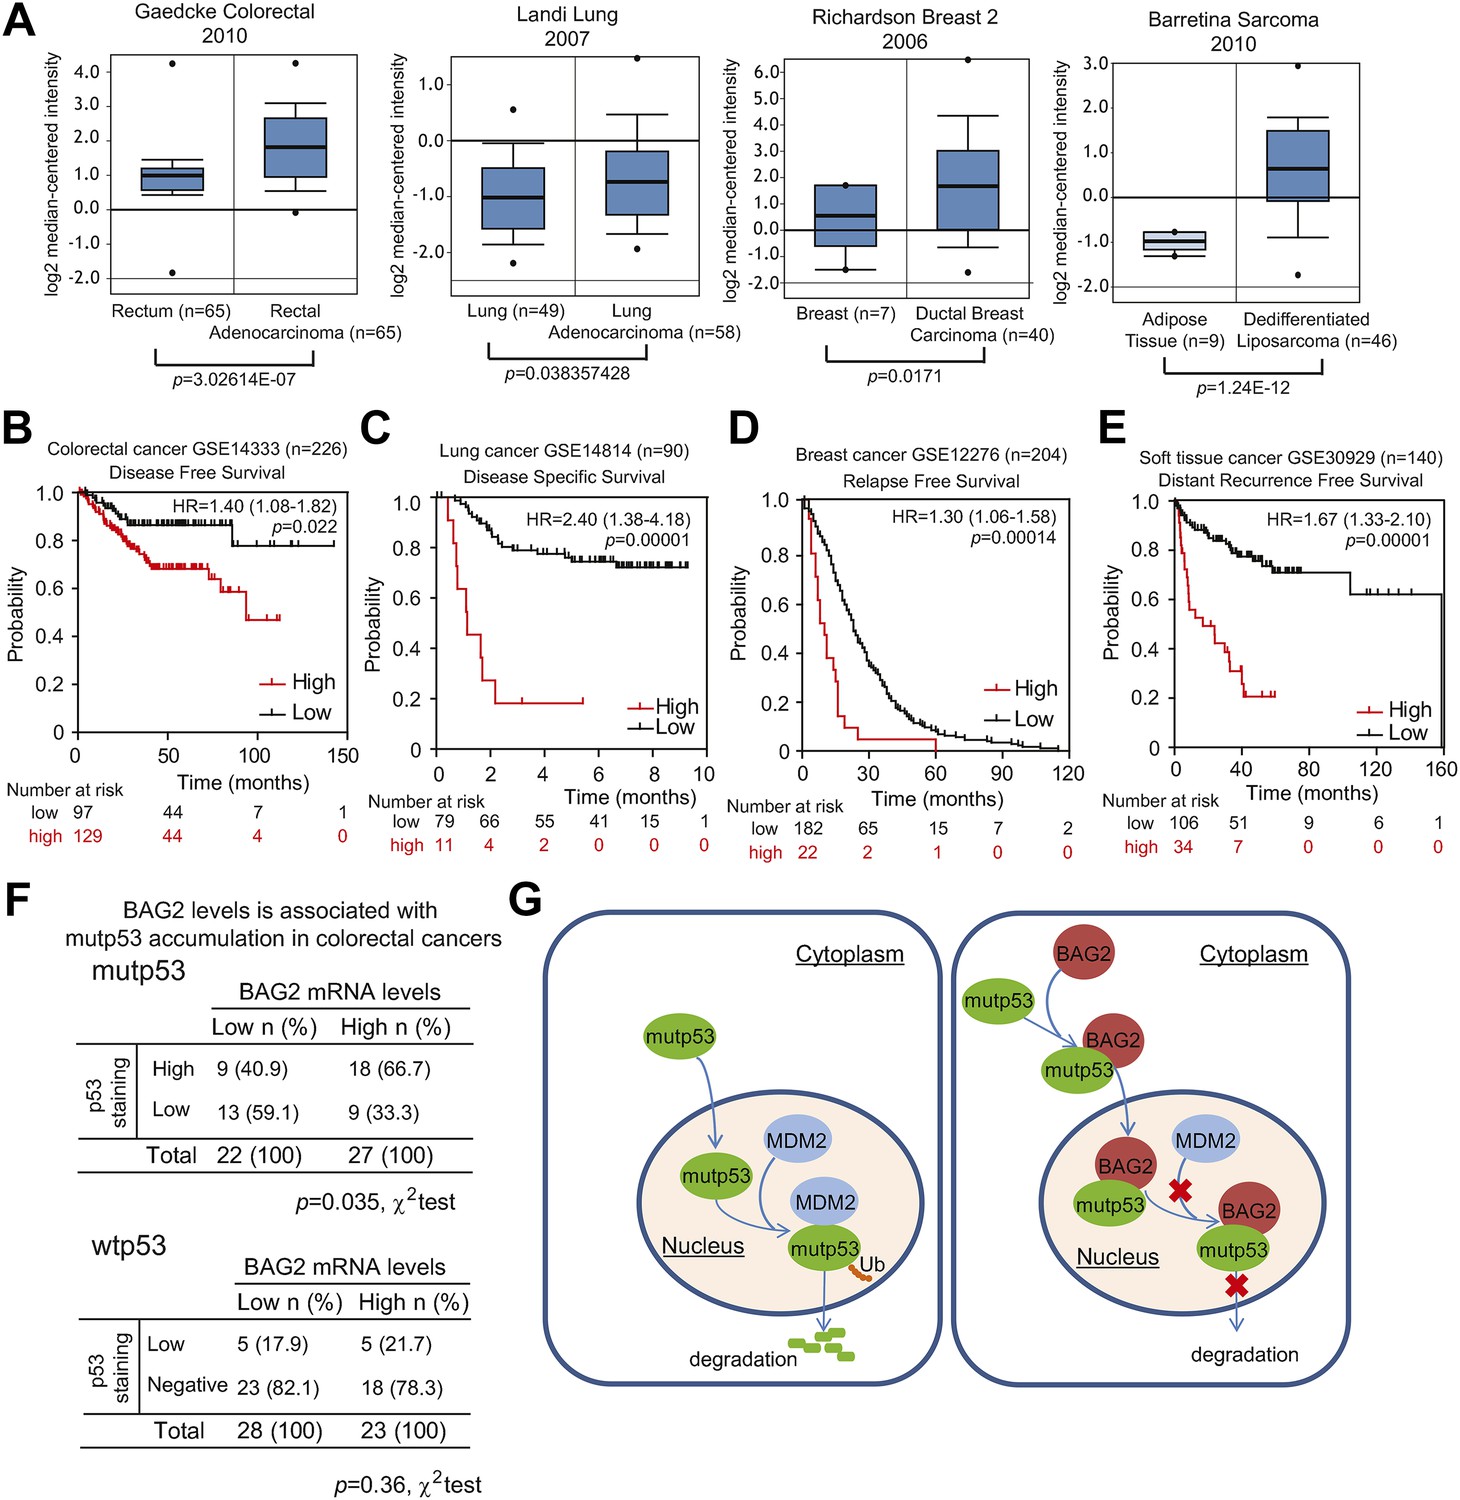
BAG2 is overexpressed in many human tumors and high levels of BAG2 are associated with mutp53 protein accumulation in human tumors.
(A) BAG2 mRNA levels are elevated in human cancers, including colorectal cancers, lung cancers, breast cancers and sarcomas. BAG2 mRNA levels in normal and cancer tissues are presented as box plots based on data in four different datasets obtained from the Oncomine database. The expression levels of BAG2 are expressed in terms of a log2 median-centered intensity which is calculated by normalizing the intensity of BAG2 probe to the median of the probe intensities across the entire array. (B–E) High levels of BAG2 are associated with poor prognosis in cancer patients. Kaplan–Meier curves indicating the disease free survival of 226 colorectal cancer patients (B), the disease specific survival of 90 lung cancer patients (C), the relapse free survival of 204 breast cancer patients (D) and the distant recurrence free survival of 140 soft tissue cancer patients (E). The survival information and expression levels of BAG2 were obtained from the public available databases (GSE14333 for B, GSE14814 for C, GSE12276 for D, and GSE30929 for E) and analyzed by PrognoScan, a web based platform evaluating the prognostic power of gene expression levels. (F) BAG2 overexpression correlates with mutp53 protein accumulation (p = 0.036, χ2 test) but not wtp53 protein accumulation in human colorectal cancers. BAG2 mRNA levels were determined in human colorectal cancers and normalized with β-actin. (G) Schematic model depicting that mutp53 interacts with BAG2 and promotes BAG2 nuclear translocation to inhibit MDM2-mediated mutp53 protein degradation, which in turn promotes mutp53 protein accumulation and GOF in tumorigenesis.
Figure 7—figure supplement 1
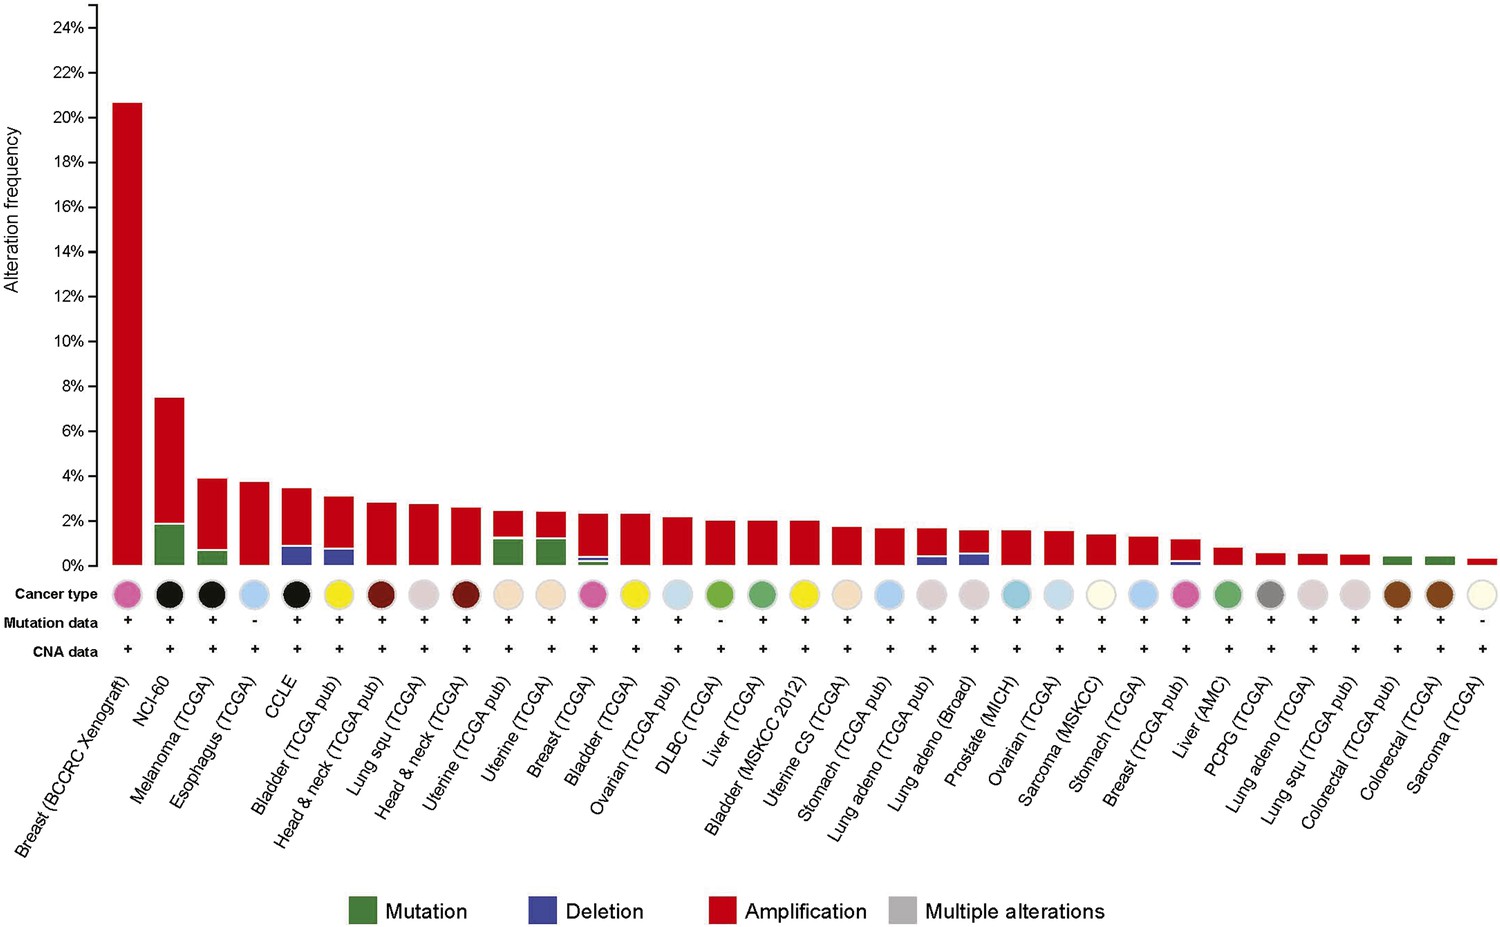
Amplification of the BAG2 gene was observed in many human tumors.
Percentage of tumors showing genetic alterations, including amplification (red), mutation (green) and deletion (blue), in the BAG2 gene in different human tumors. Data were obtained from the cBioportal for Cancer Genomics (http://www.cbioportal.org).
Tables
Table 1
The list of identified mutp53-interaction protein candidates
| Gene names | Average counts | |
|---|---|---|
| Normal thymus | Thymic lymphoma | |
| Ctsb | 0 | 19 |
| Tfrc | 0 | 15.5 |
| Bag2 | 0 | 15 |
| Stip1 | 0 | 14.5 |
| Hyou1 | 0 | 14.5 |
| Cad | 0 | 14.5 |
| Rps19 | 0 | 14.5 |
| Pfn1 | 0 | 14 |
| Cand1 | 0 | 11.5 |
| Hspa2 | 0 | 11 |
| Lcp1 | 0 | 11 |
| Sar1a | 0 | 10.5 |
| Fam49b | 0 | 10.5 |
| Khsrp | 0 | 10 |
| Ifi47 | 0 | 9.5 |
| Cse1l | 0 | 9.5 |
| Ipo5 | 0 | 9.5 |
| Hsp90b1 | 0 | 9 |
| Hspbp1 | 0 | 8.5 |
| Rfc5 | 0 | 8.5 |
| Tkt | 0 | 8.5 |
| myosin | 0 | 8 |
| Hadhb | 0 | 8 |
| Hsp70 | 1 | 66 |
| Phgdh | 1 | 20 |
| Myh9 | 5 | 81.5 |
| Hspd1 | 2 | 32.5 |
| Rpl9-ps4 | 1 | 16 |
| Ubr5 | 1 | 13.5 |
| Dars | 1 | 13.5 |
| Iqgap1 | 1 | 12 |
| Slc25a3 | 1 | 11.5 |
| Rars | 1 | 11.5 |
| Ruvbl2 | 1 | 11 |
| Ddb1 | 1 | 10 |
| Hsph1 | 4 | 38.5 |
| Dnajb4 | 1 | 9 |
| Aldoa | 1 | 8.5 |
| Pcna | 2 | 16.5 |
| Eprs | 1 | 8 |
| Hsp90 | 2 | 15.5 |
| Gm9755 | 2 | 12.5 |
| Dnaja1 | 3 | 18 |
| Atp5b | 3 | 18 |
| Cltc | 7 | 41 |
| Gm5506 | 5 | 26 |
| Dnaja2 | 3 | 15 |
| Bag5 | 7 | 31.5 |
| Rps7 | 5 | 22.5 |
| Ywhae | 2 | 9 |
| Eef2 | 10 | 38.5 |
| Adsl | 2 | 7.5 |
| Hsp90ab1 | 20 | 74.5 |
| Gnb2l1 | 6 | 22 |
| Copg | 2 | 7 |
| Rpl23 | 2 | 7 |
| Psmc6 | 2 | 7 |
| Pcbp2 | 2 | 7 |
| Pcbp1 | 3 | 10 |
| Pabpc4 | 5 | 15.5 |
| Hspa8 | 77 | 237.5 |
| Fcgr4 | 13 | 38.5 |
| Mcm7 | 4 | 11.5 |
| Hadha | 3 | 8.5 |
| Kpnb1 | 5 | 14 |
| Atp5a1 | 9 | 25 |
| Pontin | 4 | 11 |
| Bat3 | 3 | 8 |
| Pdia6 | 3 | 7.5 |
| Dnajc7 | 38 | 86 |
| Rps15a | 6 | 13.5 |
| Aldh2 | 4 | 9 |
| Trim28 | 5 | 11 |
| Eef1a1 | 16 | 35 |
| St13 | 6 | 13 |
| Cct8 | 36 | 54 |
| Psmd11 | 6 | 9 |
Table 2
Sequences of the primer sets used for site-directed mutagenesis and amplifying p53 and BAG2 fragments
| Name of fragments | Primer sequences | |
|---|---|---|
| For site-directed mutagenesis | ||
| Mutp53 R175H-HA P1 (aa 1–363), P2 (aa 43–393), P3 (aa 43–363) | Forward | 5′-GAG GTT GTG AGG CAC TGC CCC CAC CAT-3′ |
| Reverse | 5′-ATG GTG GGG GCA GTG CCT CAC AAC CTC-3′ | |
| R175H mutp53NLS | Forward 1 | 5′-GTT GGG CAG TGC TGC CGC AGT GCT CCC TGG GGG CAG-3′ |
| Reverse 1 | 5′-CTG CCC CCA GGG AGC ACT GCG GCA GCA CTG CCC AAC-3′ | |
| Forward 2 | 5′-TGA AAT ATT CTC CAT CCA GTG GTG CCG CCG CTG GCT GGG GAG AGG AGC TGG TGT TGT TG-3′ | |
| Reverse2 | 5′-CAA CAA CAC CAG CTC CTC TCC CCA GCC AGC GGC GGC ACC ACT GGA TGG AGA ATA TTT CA-3′ | |
| For amplifying p53 and BAG2 fragments | ||
|---|---|---|
| Mutp53 R175H-HA, P4 (aa 93–393) | Forward | 5′-GCG AAT TCA CCA TGG GCT ACC CAT ACG ATG TTC CAG ATT ACG CTC TGT CAT CTT CTG TCC CTT-3′ |
| Reverse | 5′-GAT CGA ATT CTC AGT CTG AGT CAG GCC CTT-3′ | |
| Mutp53 R175H-HA, P5 (aa 93–325), wtp53-DBD, Mutp53 R248W-DBD Mutp53 R273H-DBD | Forward | 5′-GCG AAT TCA CCA TGG GCT ACC CAT ACG ATG TTC CAG ATT ACG CTC TGT CAT CTT CTG TCC CTT-3′ |
| Reverse | 5′-GCG AAT TCT CAT CCA TCC AGT GGT TTC TT-3′ | |
| Mutp53 R175H-HA, P6 (Δaa 101–300) | Forward 1 | 5′-GCG AAT TCA CCA TGG GCT ACC CAT ACG ATG TTC CAG ATT ACG CTG AGG AGC CGC AGT CAG ATC C-3′ |
| Reverse 1 | 5′-CTT AGT GCT CCC TGG CTG GGA AGG GAC AGA-3′ | |
| Forward 2 | 5′-TCT GTC CCT TCC CAG CCA GGG AGC ACT AAG-3′ | |
| Reverse 2 | 5′-GAT CGA ATT CTC AGT CTG AGT CAG GCC CTT-3′ | |
| BAG2-Flag | Forward | 5′-CGG AAT TCA TGG CTC AGG CGA AGA-3′ |
| Reverse | 5′-CGG GAT CCA TTG AAT CTG CTT TCA GCA T-3′ | |
| BAG2 B1-Flag | Forward | 5′-CGG AAT TCA TGG CTC AGG CGA AGA-3′ |
| Reverse | 5′-CGG GAT CCT CTT CCC ATC AAA CGG TT-3′ | |
| BAG2 B2-Flag | Forward | 5′-CGG AAT TCA CCA TGG GAA GAA CTC TCA CCG TT-3′ |
| Reverse | 5′-CGG GAT CCA TTG AAT CTG CTT TCA GCA T-3′ | |
Download links
A two-part list of links to download the article, or parts of the article, in various formats.
Downloads (link to download the article as PDF)
Open citations (links to open the citations from this article in various online reference manager services)
Cite this article (links to download the citations from this article in formats compatible with various reference manager tools)
BAG2 promotes tumorigenesis through enhancing mutant p53 protein levels and function
eLife 4:e08401.
https://doi.org/10.7554/eLife.08401


