A forward genetic screen reveals novel independent regulators of ULBP1, an activating ligand for natural killer cells
- University of California, Berkeley, United States
- National Institute of Allergy and Infectious Diseases, United States
- Stanford University School of Medicine, United States
- Dartmouth Geisel School of Medicine, United States
Figures
Figure 1 with 1 supplement
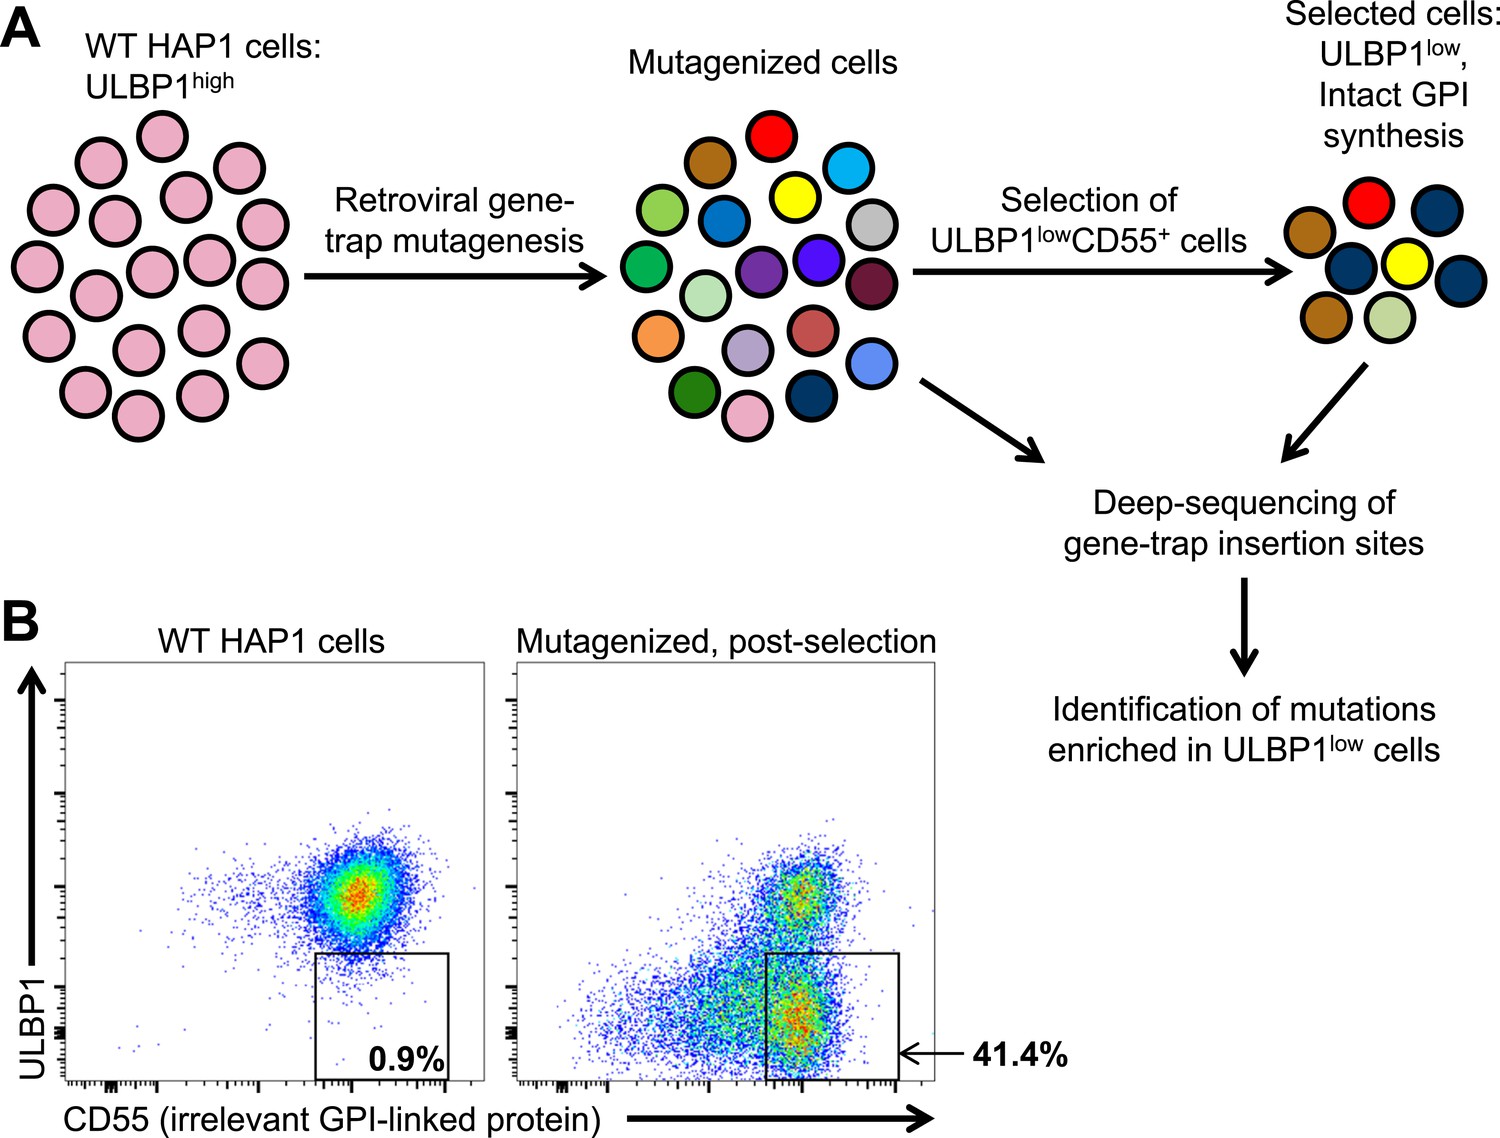
A genetic screen of a haploid human cell line to identify regulators of ULBP1 expression.
(A) HAP1 cells (∼108 cells) were transduced with a retroviral gene-trap vector. To enrich for mutant cells with decreased ULBP1 expression, we initially depleted ULBP1high cells by labeling cells with an anti-ULBP1 antibody followed by magnetic bead-based cell depletion. Following a brief recovery and expansion of the cells, we used FACS to further enrich ULBP1lowCD55+ cells. Deep-sequencing of genomic DNA from pre- and post-selection cells was used to map sites of gene-trap insertions, and mutations enriched in ULBP1low cells were identified. (B) Flow cytometric analysis of WT and post-selection HAP1 cells. Cells were stained for ULBP1 and CD55, an irrelevant GPI-linked protein.
Figure 1—figure supplement 1
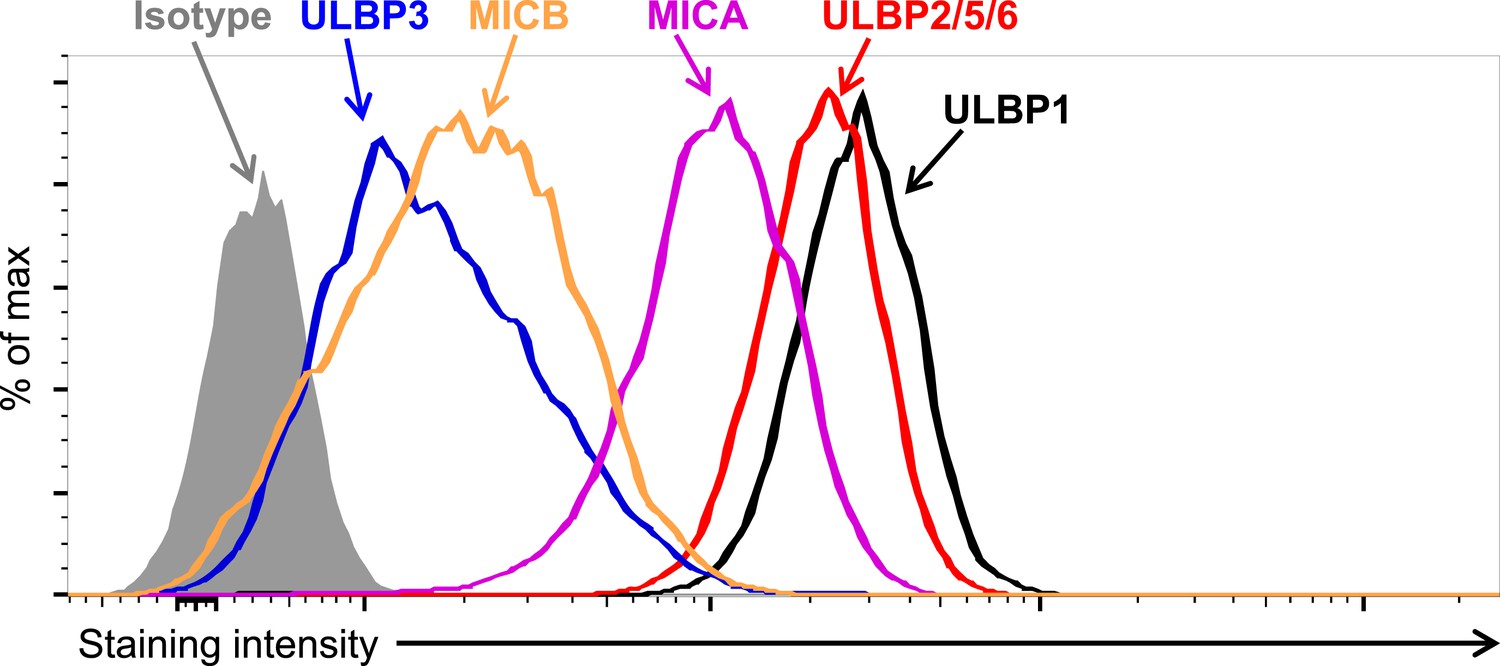
Expression of NKG2D ligands on HAP1 cells.
HAP1 cells were stained with antibodies against NKG2D ligands and analyzed by flow cytometry. Isotype control staining is shown by the shaded gray histogram. The ULBP2/5/6 antibody cross-reacts with three NKG2D ligands, but only ULBP2 is substantially expressed by HAP1 cells. The data shown are representative of at least three independent experiments.
Figure 2 with 3 supplements
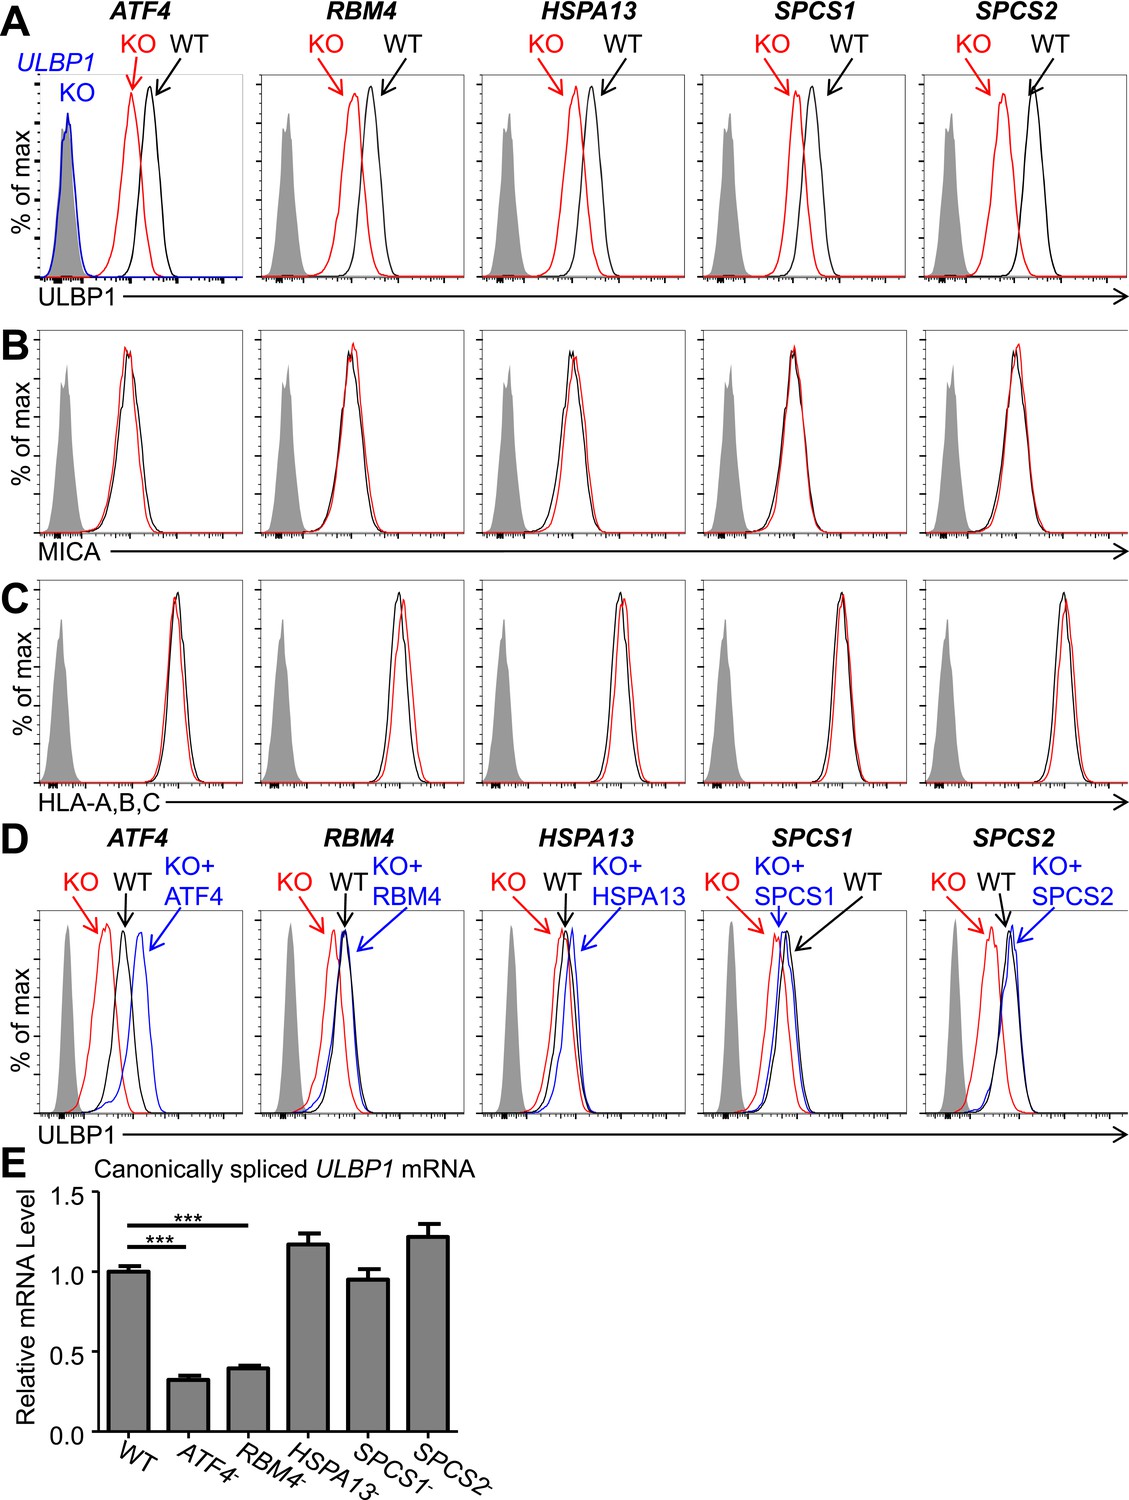
Decreased ULBP1 expression upon targeted mutation of screen hits.
(A–C) Flow cytometric analysis of cell surface expression of ULBP1 (A), the NKG2D ligand MICA (B), or pan-HLA Class I (C) on WT and mutant HAP1 cells. WT and mutant (KO) cells are represented as black and red histograms, respectively. The shaded gray histogram represents isotype control staining. The blue trace in panel A shows staining of ULBP1 KO HAP1 cells and matches isotype control staining. Data are representative of at least three independent experiments. (D) To restore expression of ULBP1 drivers, mutant cell lines were transduced with a doxycycline-inducible lentiviral vector containing the gene of interest. Cells were treated for 24 hr with doxycycline (Dox) at a final concentration of 100 ng/ml for ATF4 and 1000 ng/ml for all other genes. After treatment, cells were analyzed by flow cytometry. Black histograms: WT cells transduced with control vector, +Dox. Red histograms: mutant cells transduced with Dox-inducible gene of interest, −Dox. Blue histograms: mutant cells transduced with Dox-inducible gene of interest, +Dox. The shaded gray histogram represents isotype control staining. Data are representative of three independent experiments. (E) RT-qPCR analysis of canonically spliced ULBP1 mRNA expression levels in WT and mutant HAP1 cells. Expression levels were normalized to ACTB, GAPDH, and HPRT1 and are shown as mean ±SE. The data were analyzed by 1-way ANOVA with Dunnet's multiple comparisons test comparing all samples to WT. ***p < 0.001. Data are representative of three independent experiments. In one out of three total experiments performed, the level of ULBP1 mRNA was significantly increased in the SPCS2 mutant compared to WT.
Figure 2—figure supplement 1

Mutagenesis of screen 'hits' with the CRISPR/Cas9 system.
HAP1 cells were co-transfected with plasmids encoding Cas9, a target gene-specific sgRNA, and GFP. Successfully transfected (GFP+) cells were sorted 24–72 hr post-transfection and re-plated. 5–7 days post-transfection, cells were stained for ULBP1 expression and analyzed by flow cytometry. Examples are shown for ULBP1 (A), RBM4 and ATF4 (B), and SPCS1 (C).
Figure 2—figure supplement 2
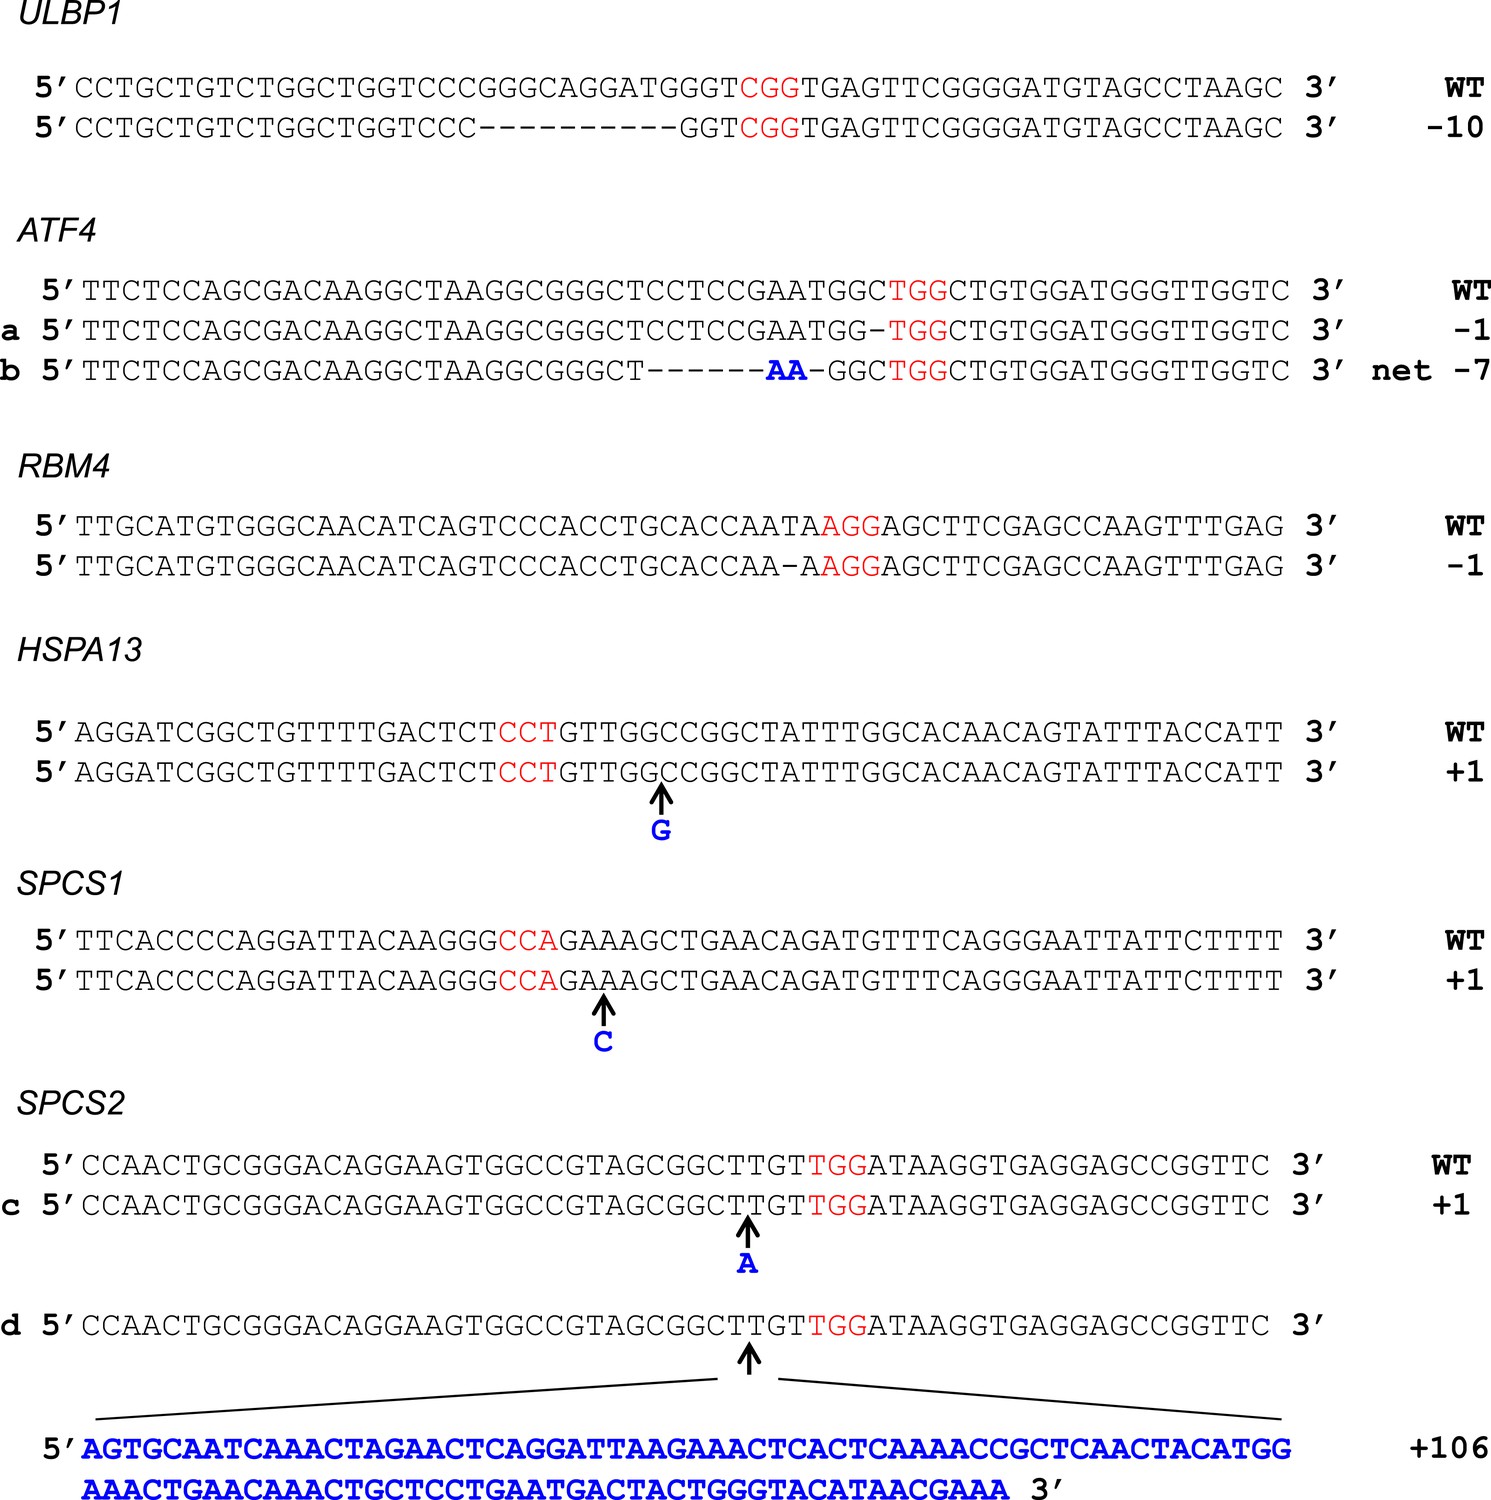
Sequences of CRISPR/Cas9 target sites in HAP1 cells.
Genomic DNA sequence surrounding Cas9:gRNA target loci as shown with protospacer adjacent motif (PAM) in red. Inserted bases are in bold blue text. For HSPA13 and SPCS1, the PAM was on the non-coding strand. For ATF4, mutation (a) was present in the ATF4 single-KO line. Mutation (b) was present in all double- and triple-KO lines. For SPCS2, mutation (c) was present in the ATF4/RBM4/SPCS2 triple-KO line. Mutation (d) was present in the SPCS2 single-KO line.
Figure 2—figure supplement 3

Expression of additional NK cell ligands is unchanged on mutant HAP1 cells.
Flow cytometric analysis of cell surface expression of ULBP2/5/6 (A), ULBP3 (B), MICB (C), CD112 (D), or CD155 (E) on WT and mutant HAP1 cells. WT and mutant cells are represented as black and red histograms, respectively. The shaded gray histogram represents isotype control staining. In HAP1 cells, staining with the ULBP2/5/6 antibody is due almost exclusively to expression of ULBP2. Data are representative of three independent experiments for panels A–C. Data are representative of two independent experiments for panels D, E.
Figure 3

Double and triple-mutant cell lines show stepwise decreases in ULBP1 expression.
(A) Flow cytometric analysis of ULBP1 expression on single, double, and triple-mutant HAP1 cells. ATF4−/RBM4− double-mutant cells were generated by mutagenesis of ATF4 in RBM4− cells. Triple-mutant cells were generated by mutagenesis of HSPA13 or SPCS2 in ATF4−/RBM4− double-mutant cells. Shaded gray histograms represent isotype control staining. Data are representative of three independent experiments. (B) RT-qPCR analysis of canonically spliced ULBP1 mRNA expression levels in the cells described in (A). Expression levels were normalized to ACTB, GAPDH, and HPRT1 and are shown as mean ±SE. The data were analyzed by 1-way ANOVA with Bonferroni's multiple comparisons test and substantive significant differences are shown. Data are representative of three independent experiments. *p < 0.05, **p < 0.01, ***p < 0.001, n.s.: not significant.
Figure 4
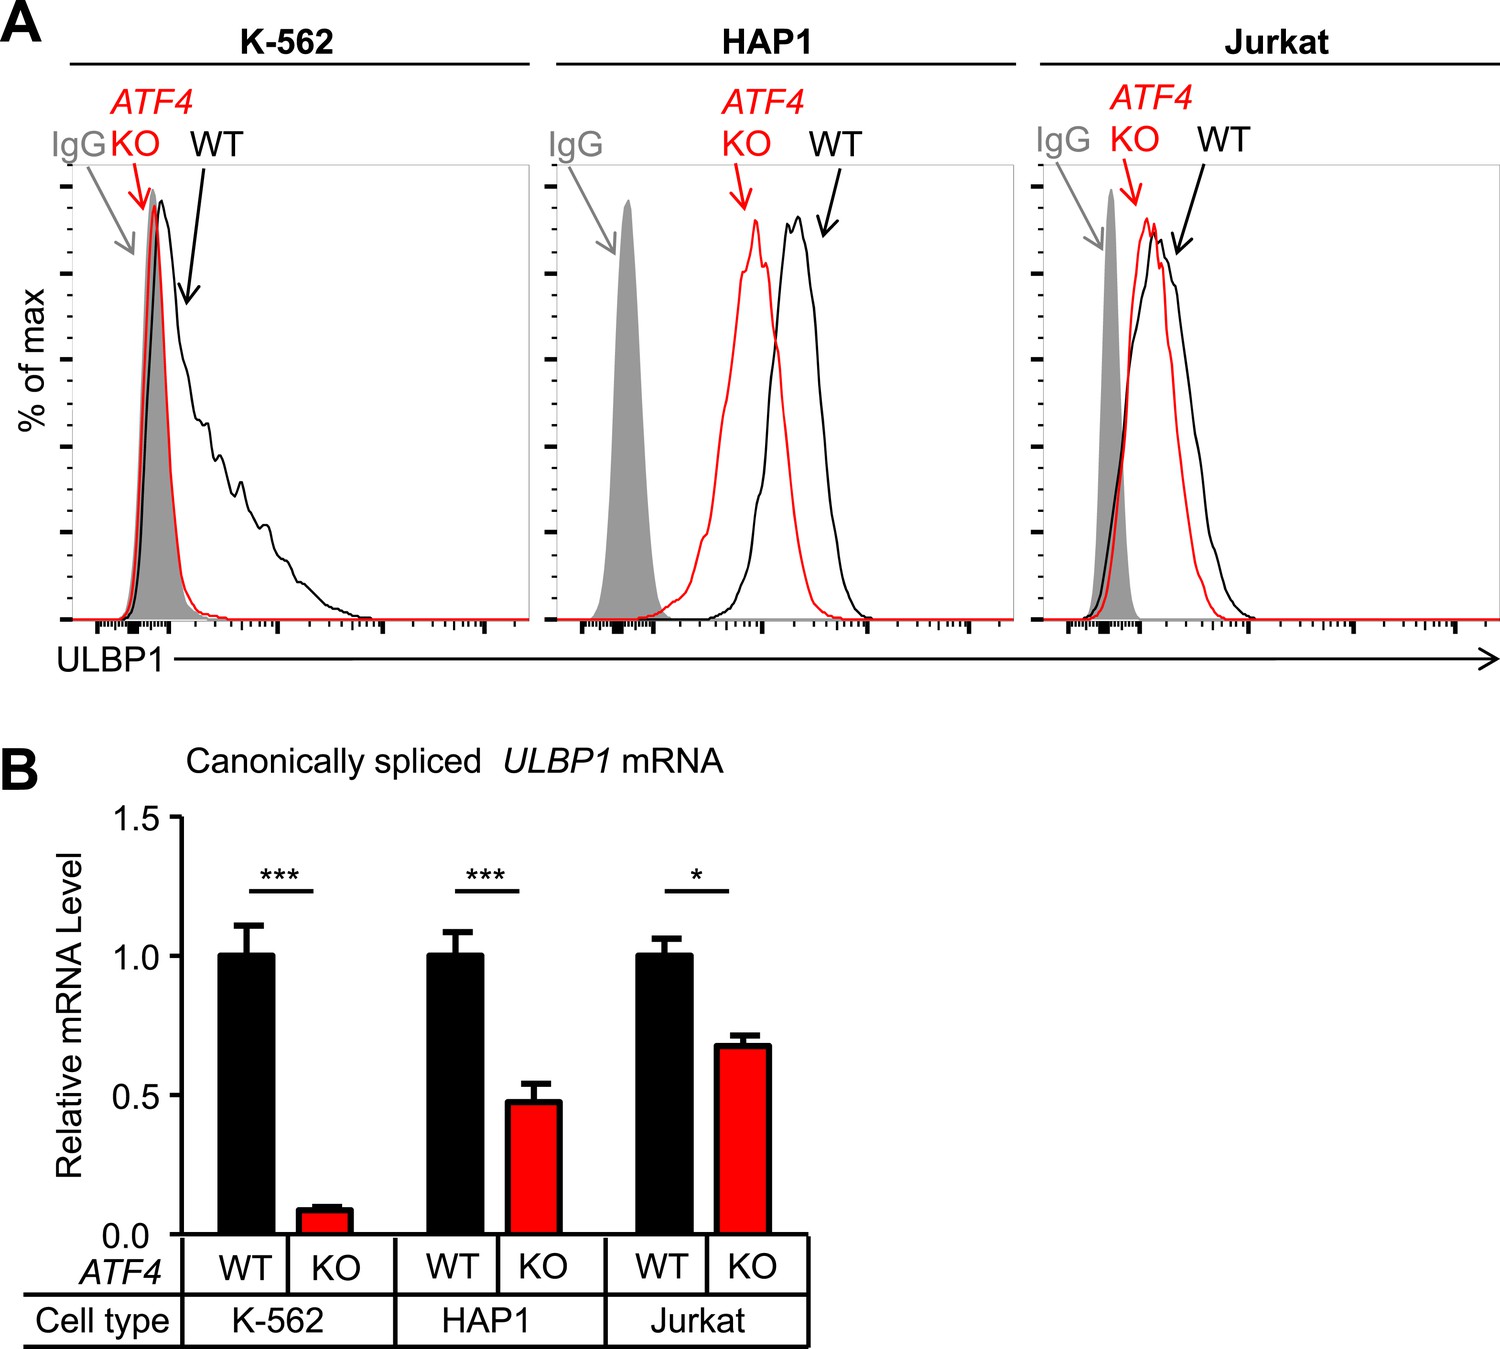
ATF4 drives basal ULBP1 expression in multiple cell lines.
(A) Flow cytometric analysis of ULBP1 expression on WT versus ATF4 KO variants of K-562, HAP1, and Jurkat cells. Data are representative of three independent experiments. (B) RT-qPCR analysis of canonically spliced ULBP1 mRNA expression levels in the cells described in (A). Expression levels were normalized to ACTB, GAPDH, and HPRT1 and are shown as mean ±SE. Expression in WT cells was set to ‘1.0’ for each cell type; the different cell types are not comparable in this experiment. The data were analyzed by 2-way ANOVA with Bonferroni's multiple comparisons test. Data are representative of three independent experiments, though one of the three Jurkat analyses did not show a significant difference. *p < 0.05, ***p < 0.001.
Figure 5 with 2 supplements
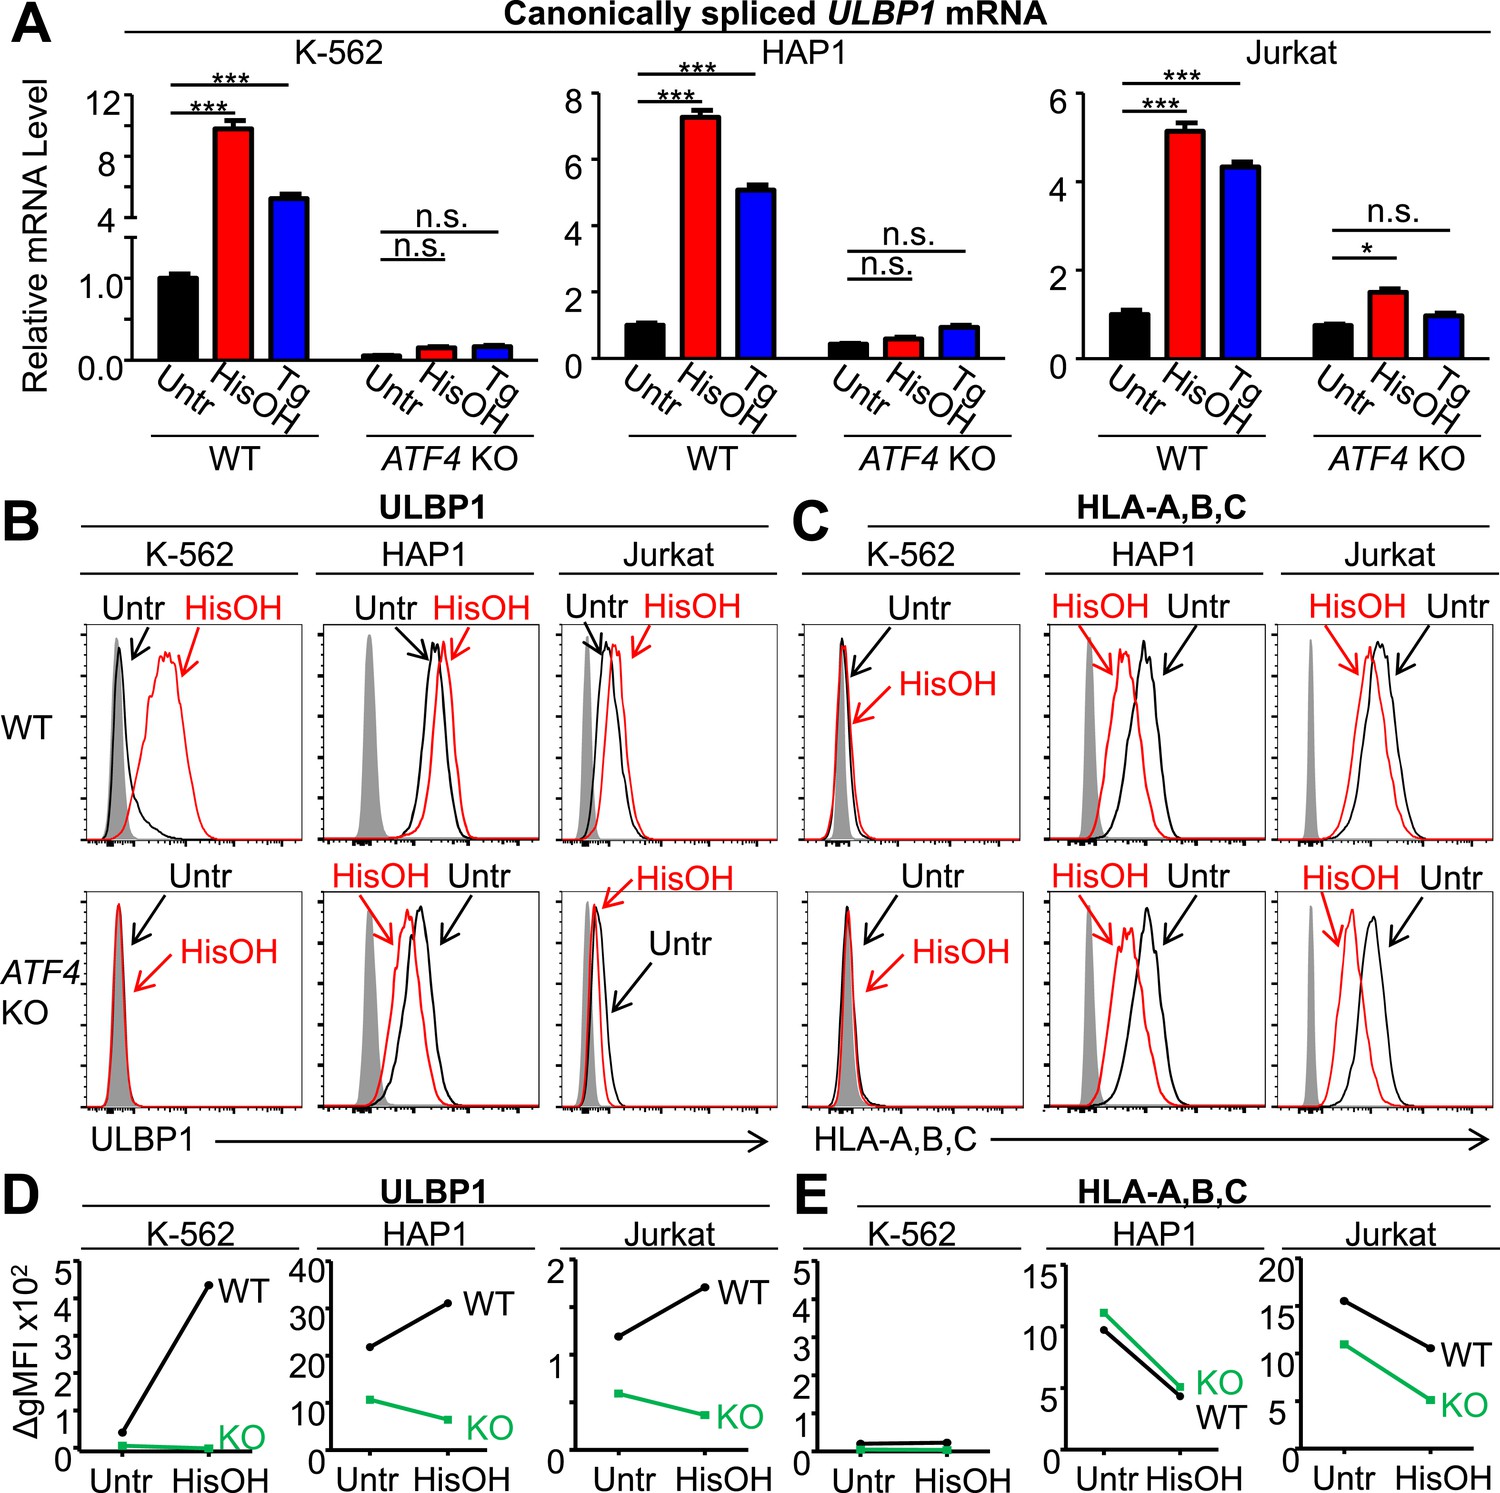
ATF4 drives increased expression of ULBP1 mRNA and surface protein in response to cell stress.
(A) Cells were treated for 24 hr with 2 mM histidinol (HisOH) to mimic amino acid starvation or 300 nM thapsigargin (Tg) to induce the unfolded protein response. RNA was isolated from treated and control cells, and canonically spliced ULBP1 mRNA levels were determined by RT-qPCR. Expression levels were normalized to ACTB, GAPDH, and HPRT1 and are shown as mean ±SE. Expression in untreated WT cells was set to ‘1.0’ for each cell type; the different cell types are not comparable in this experiment. For reference, the Cq values for ULBP1 in untreated WT cells were 32.2 for K-562 cells, 27.9 for HAP1 cells, and 30.5 for Jurkat cells. The data were analyzed by 2-way ANOVA with Bonferroni's multiple comparisons test and are representative of three independent experiments, though in one of the three analyses of ATF4 KO Jurkat cells, histidinol-treated cells trended higher than untreated cells but did not reach significance. *p < 0.05, ***p < 0.001, n.s.: not significant. (B, C) Flow cytometric analysis of ULBP1 (B) and HLA Class I expression (C) on cells treated with histidinol as in (A). (D, E) Quantification of surface staining shown in (B) and (C). Data are plotted as the geometric mean fluorescence intensity of the specific stain minus the intensity of the isotype control (ΔgMFI). Data are representative of three independent experiments.
Figure 5—figure supplement 1
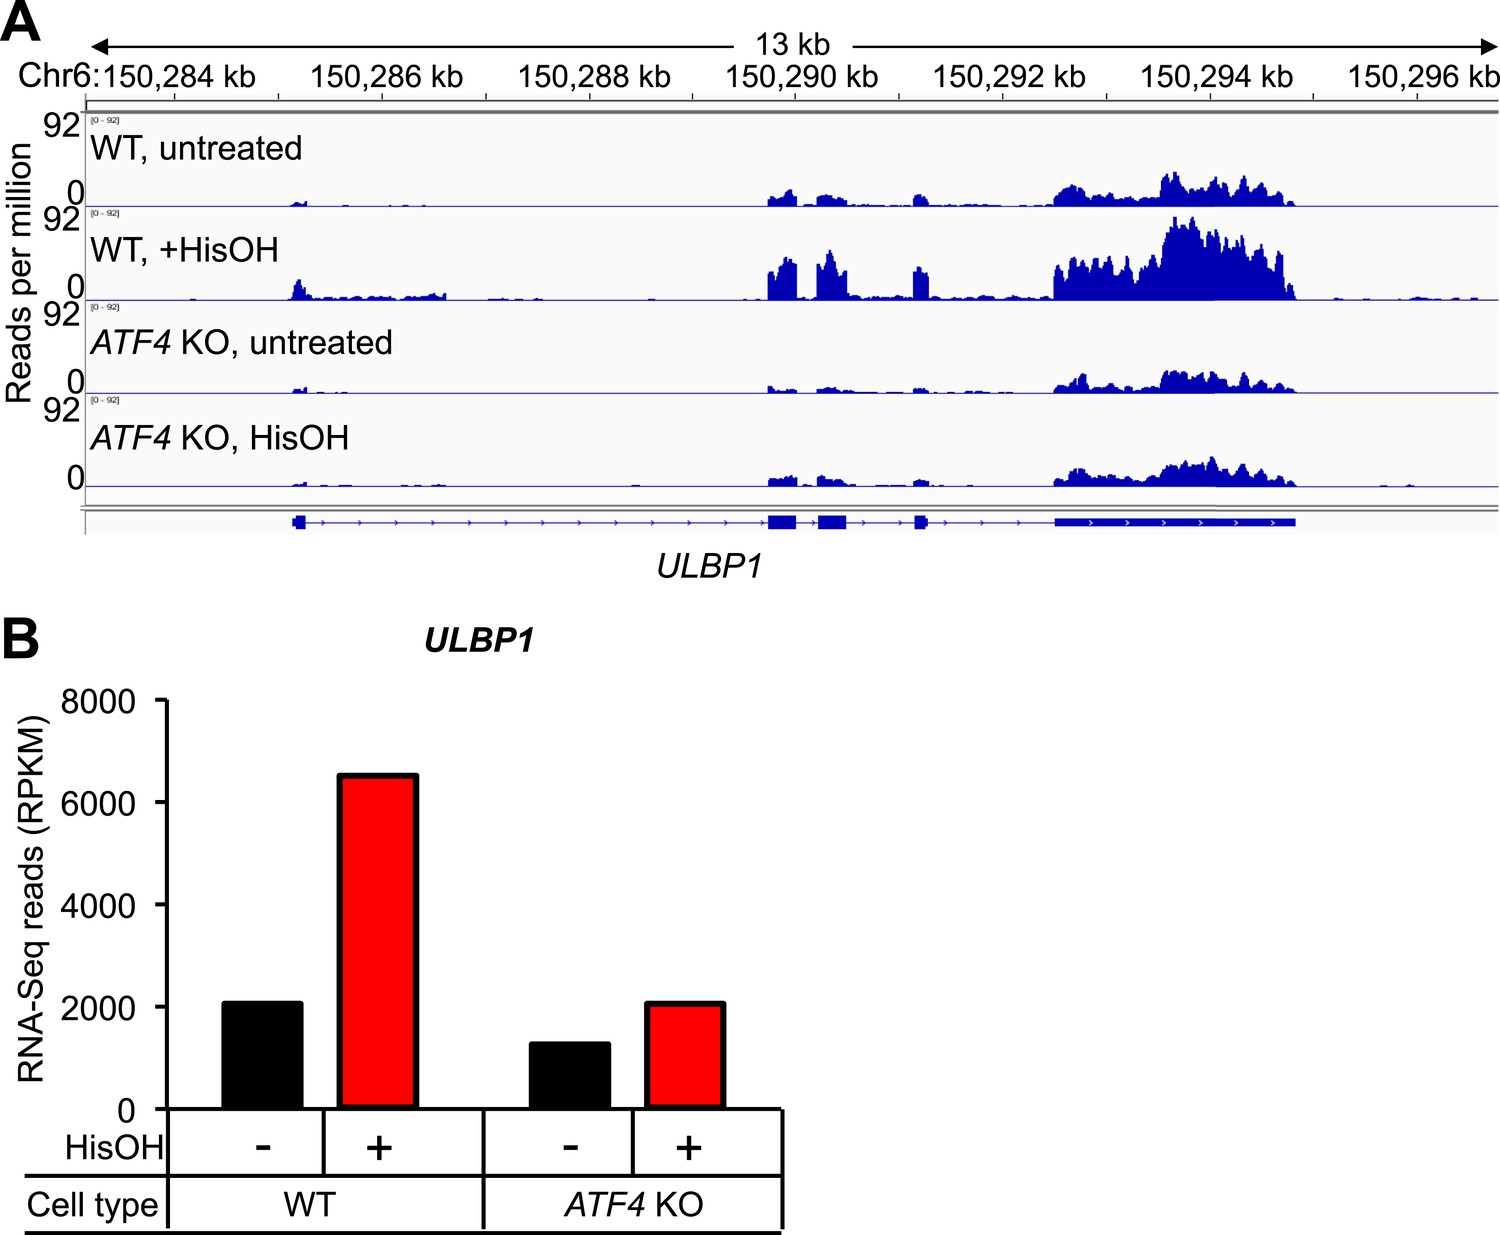
Analysis of ULBP1 expression by RNA-Seq.
(A) WT and ATF4 KO HAP1 cells were treated for 24 hours with 2 mM histidinol (HisOH). Total RNA was isolated from histidinol treated and control cells and analyzed by RNA-Seq. RNA-Seq read densities were normalized to the total number of aligned read in each sample (reads per million) and plotted with IGV. (B) Quantification of reads aligning to ULBP1, presented as reads per kb per million (RPKM). Raw sequencing data corresponding to this figure have been deposited to GEO. Accession: GSE69308.
Figure 5—figure supplement 2
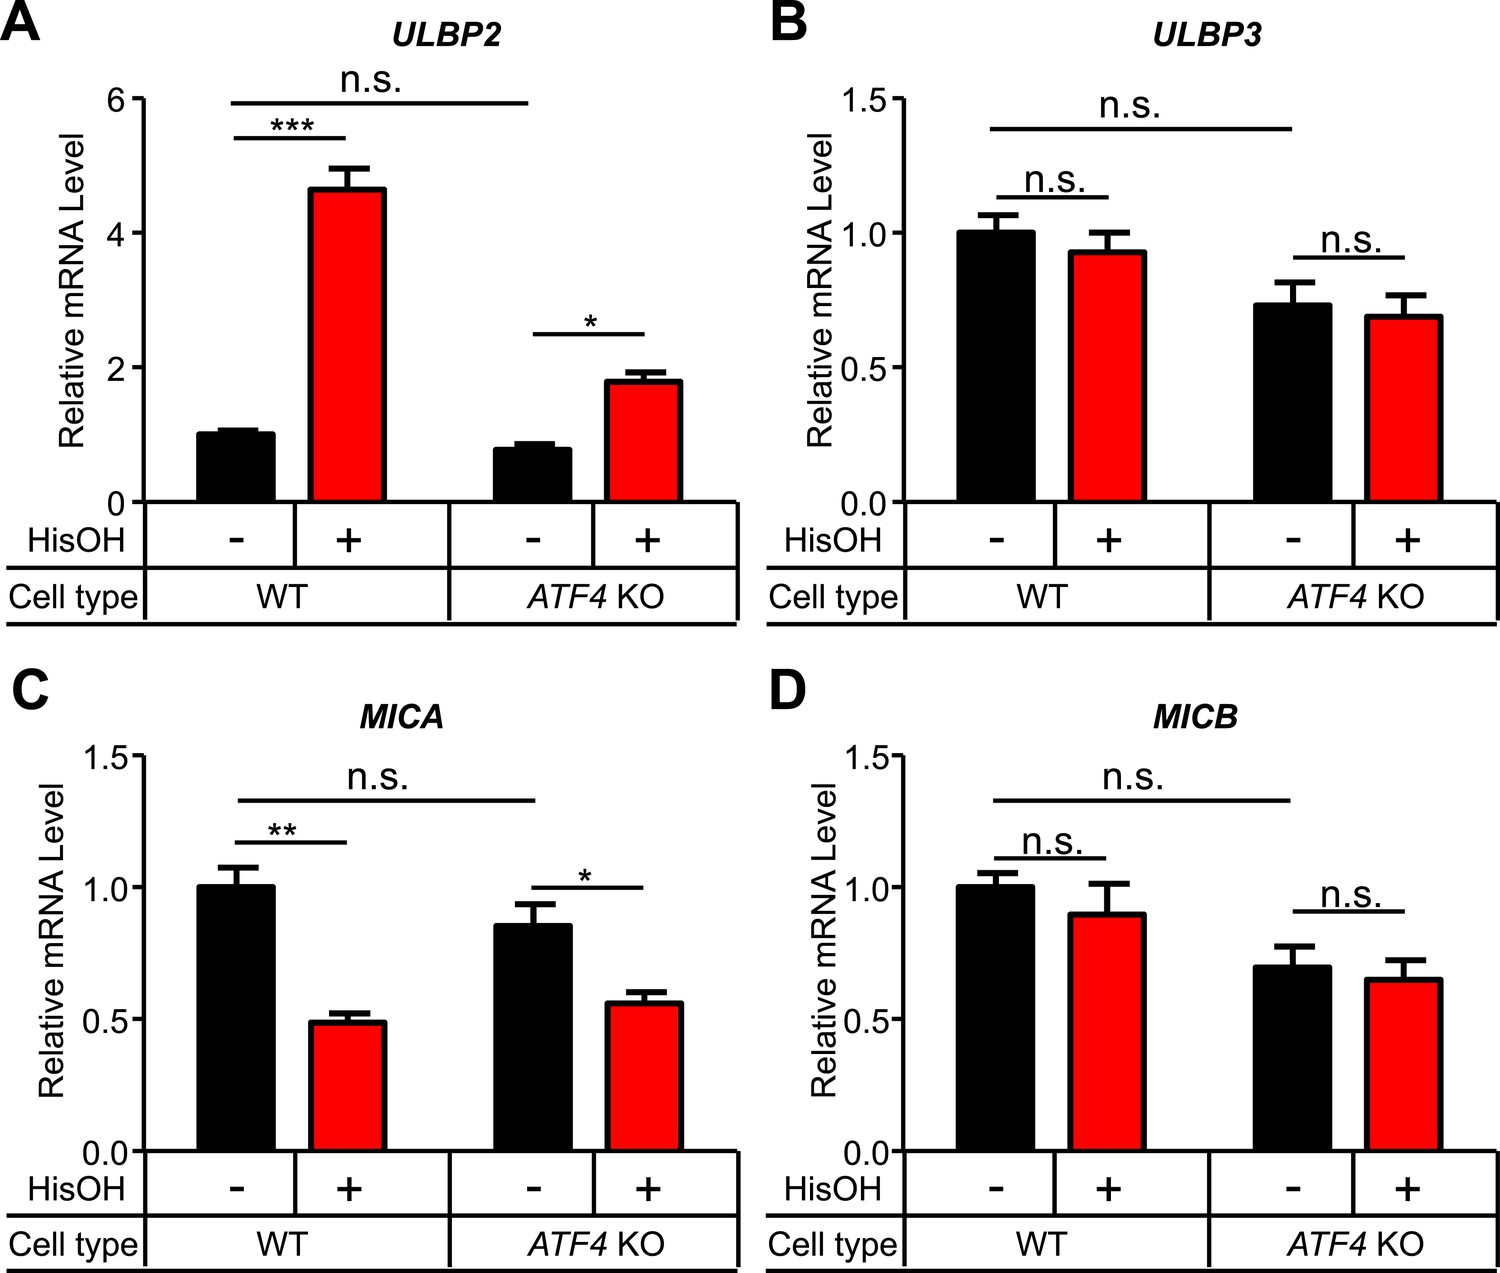
Analysis of other NKG2D ligands in response to cell stress.
(A–D) WT and ATF4 KO cells were treated for 24 hr with 2 mM histidinol (HisOH). RNA was isolated from treated and control cells, and expression of ULBP2 (A), ULBP3 (B), MICA (C), and MICB (D) mRNAs was determined by RT-qPCR. Expression levels were normalized to ACTB, GAPDH, and HPRT1 and are shown as mean ±SE. The data were analyzed by 1-way ANOVA with Bonferroni's multiple comparisons test and are representative of three independent experiments, although MICA expression did not change in response to histidinol treatment in one of the three experiments performed. *p < 0.05, **p < 0.01, ***p < 0.001, n.s.: not significant.
Figure 6 with 2 supplements
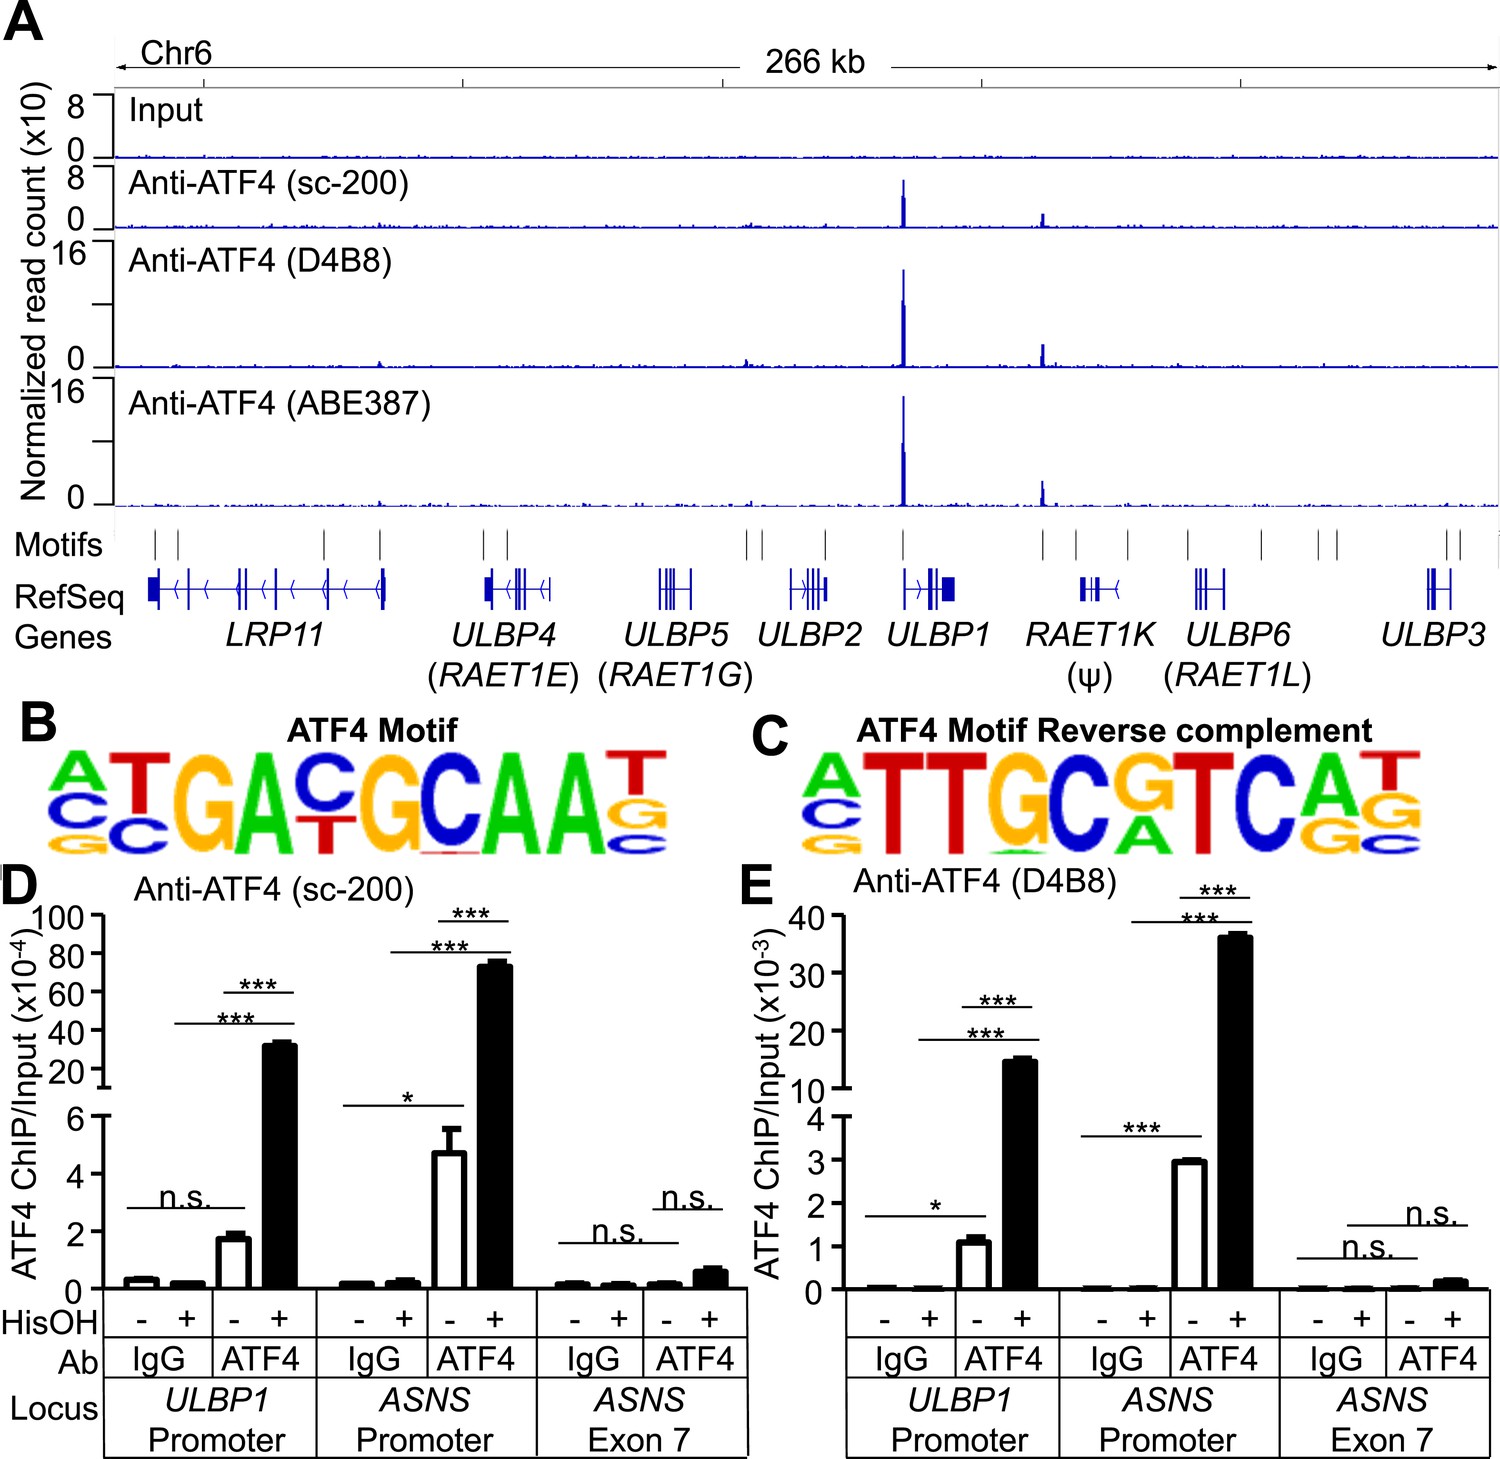
ATF4 is bound to the ULBP1 promoter and a potential downstream regulatory element.
(A) ATF4 ChIP-Seq: HAP1 cells were treated with 2 mM histidinol (HisOH) for 24 hr, followed by formaldehyde cross-linking. ATF4-bound chromatin was immunoprecipitated using three independent anti-ATF4 antibodies, and the isolated DNA was sequenced and aligned to the human genome (hg19). Locations of consensus ATF4-binding motifs are indicated. RAET1K is a pseudogene (ψ). (B, C) HOMER Motif Analysis software identified the ATF4 binding motif (B) and its reverse-complement (C). (D, E) Conventional ChIP-qPCR of ATF4 using the antibody sc-200 (D) or D4B8 (E). Samples were treated as in (A), followed by qPCR. ChIP signal was normalized to the amount of Input DNA for each sample. Data are plotted as mean ±SE and were analyzed by 2-way ANOVA with Bonferroni's multiple comparisons test. Representative data are shown. The ChIP-qPCR experiment was performed twice using both untreated and HisOH-treated cells, and a third time using only HisOH-treated cells. *p < 0.05, ***p < 0.001, n.s.: not significant. Raw sequencing data corresponding to ATF4 ChIP-Seq have been deposited to GEO. Accession: GSE69304.
Figure 6—figure supplement 1

ATF4 ChIP-Seq signal at the ASNS promoter, a known ATF4-binding site.
ATF4 ChIP-Seq: Hap-1 cells were treated with 2 mM histidinol (HisOH) for 24 hr, followed by formaldehyde cross-linking. ATF4-bound chromatin was immunoprecipitated using three independent anti-ATF4 antibodies, and the isolated DNA was sequenced and aligned to the human genome (hg19).
Figure 6—figure supplement 2
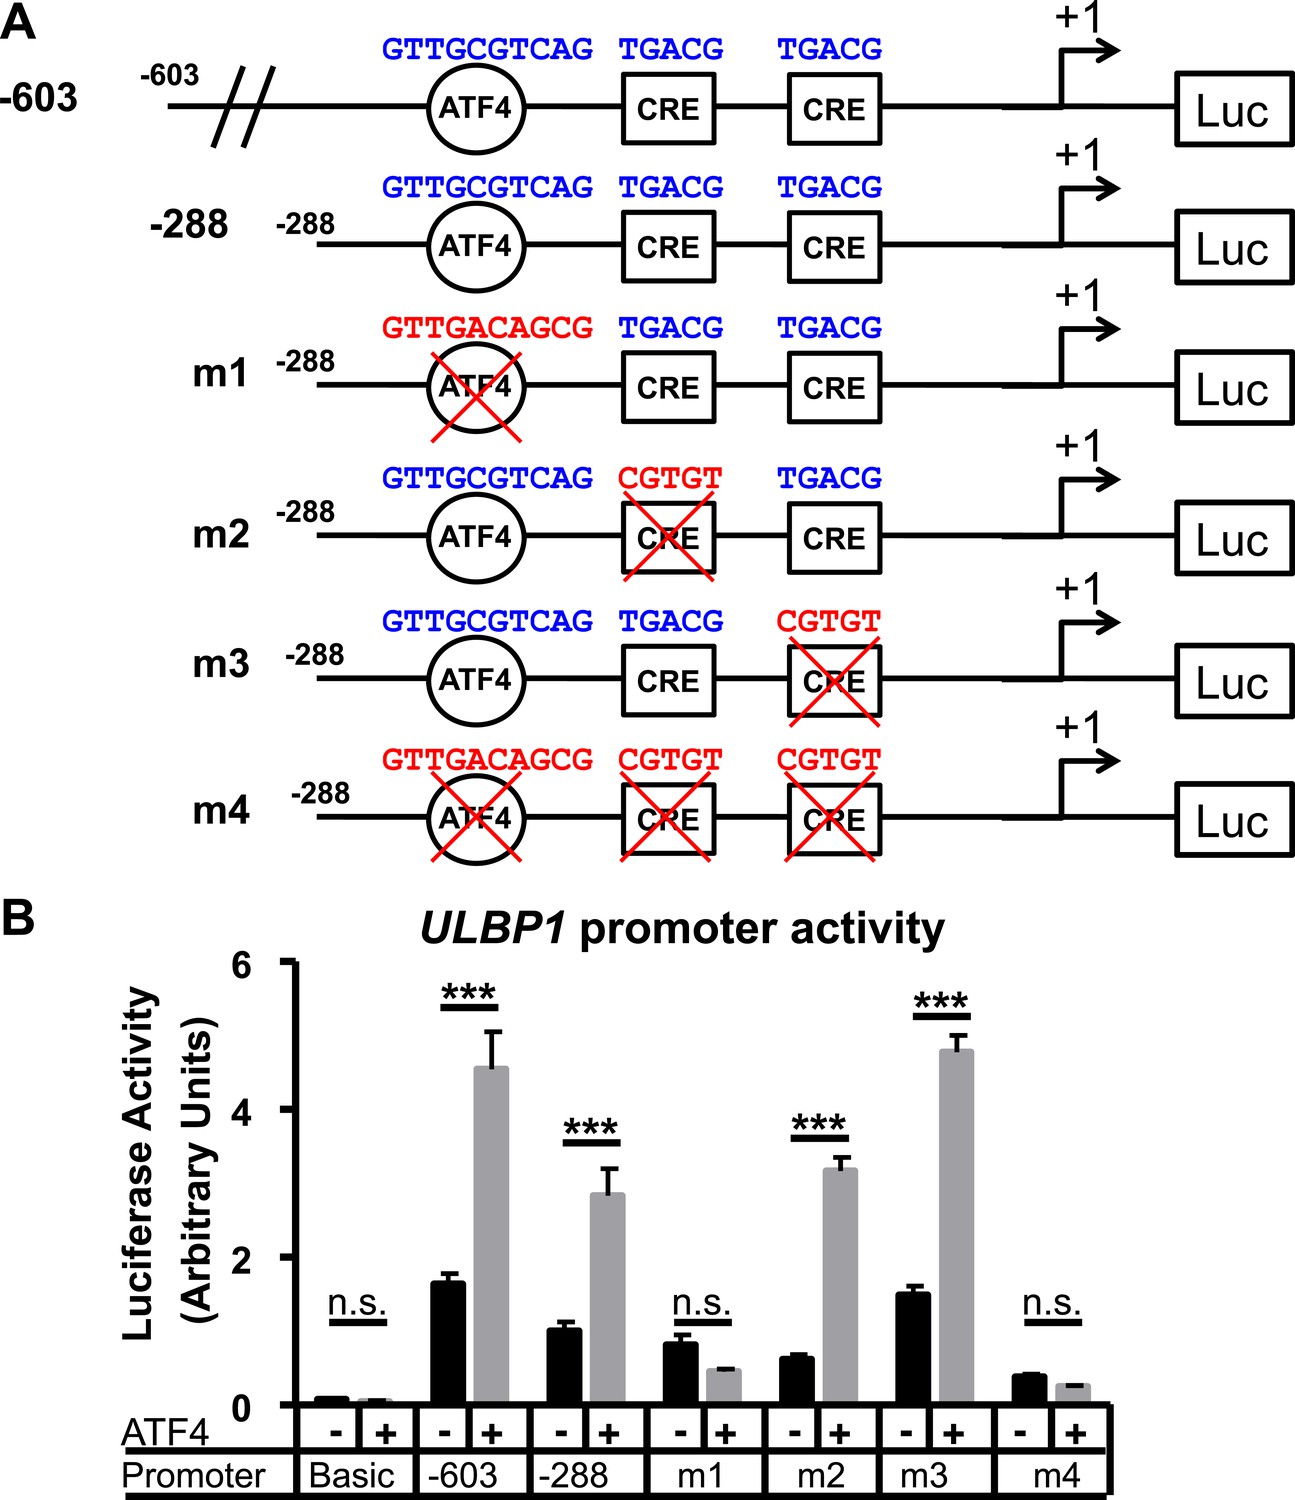
ATF4 directly activates the ULBP1 promoter.
(A) Schematic of ULBP1 promoter constructs. WT promoter sequences are listed in blue, while mutant DNA sequences are listed in red. (B) ATF4-mutant HAP-1 cells were co-transfected with ULBP1 promoter constructs and ATF4 or control vectors. Mutant constructs were created in the - 288 promoter fragment. Luciferase activity was measured 24 hours post-transfection. Data were analyzed by 2-way ANOVA with Bonferroni's Multiple Comparisons Test and are representative of 3 independent experiments. ***P<0.001, n.s.: not significant.
Figure 7 with 2 supplements
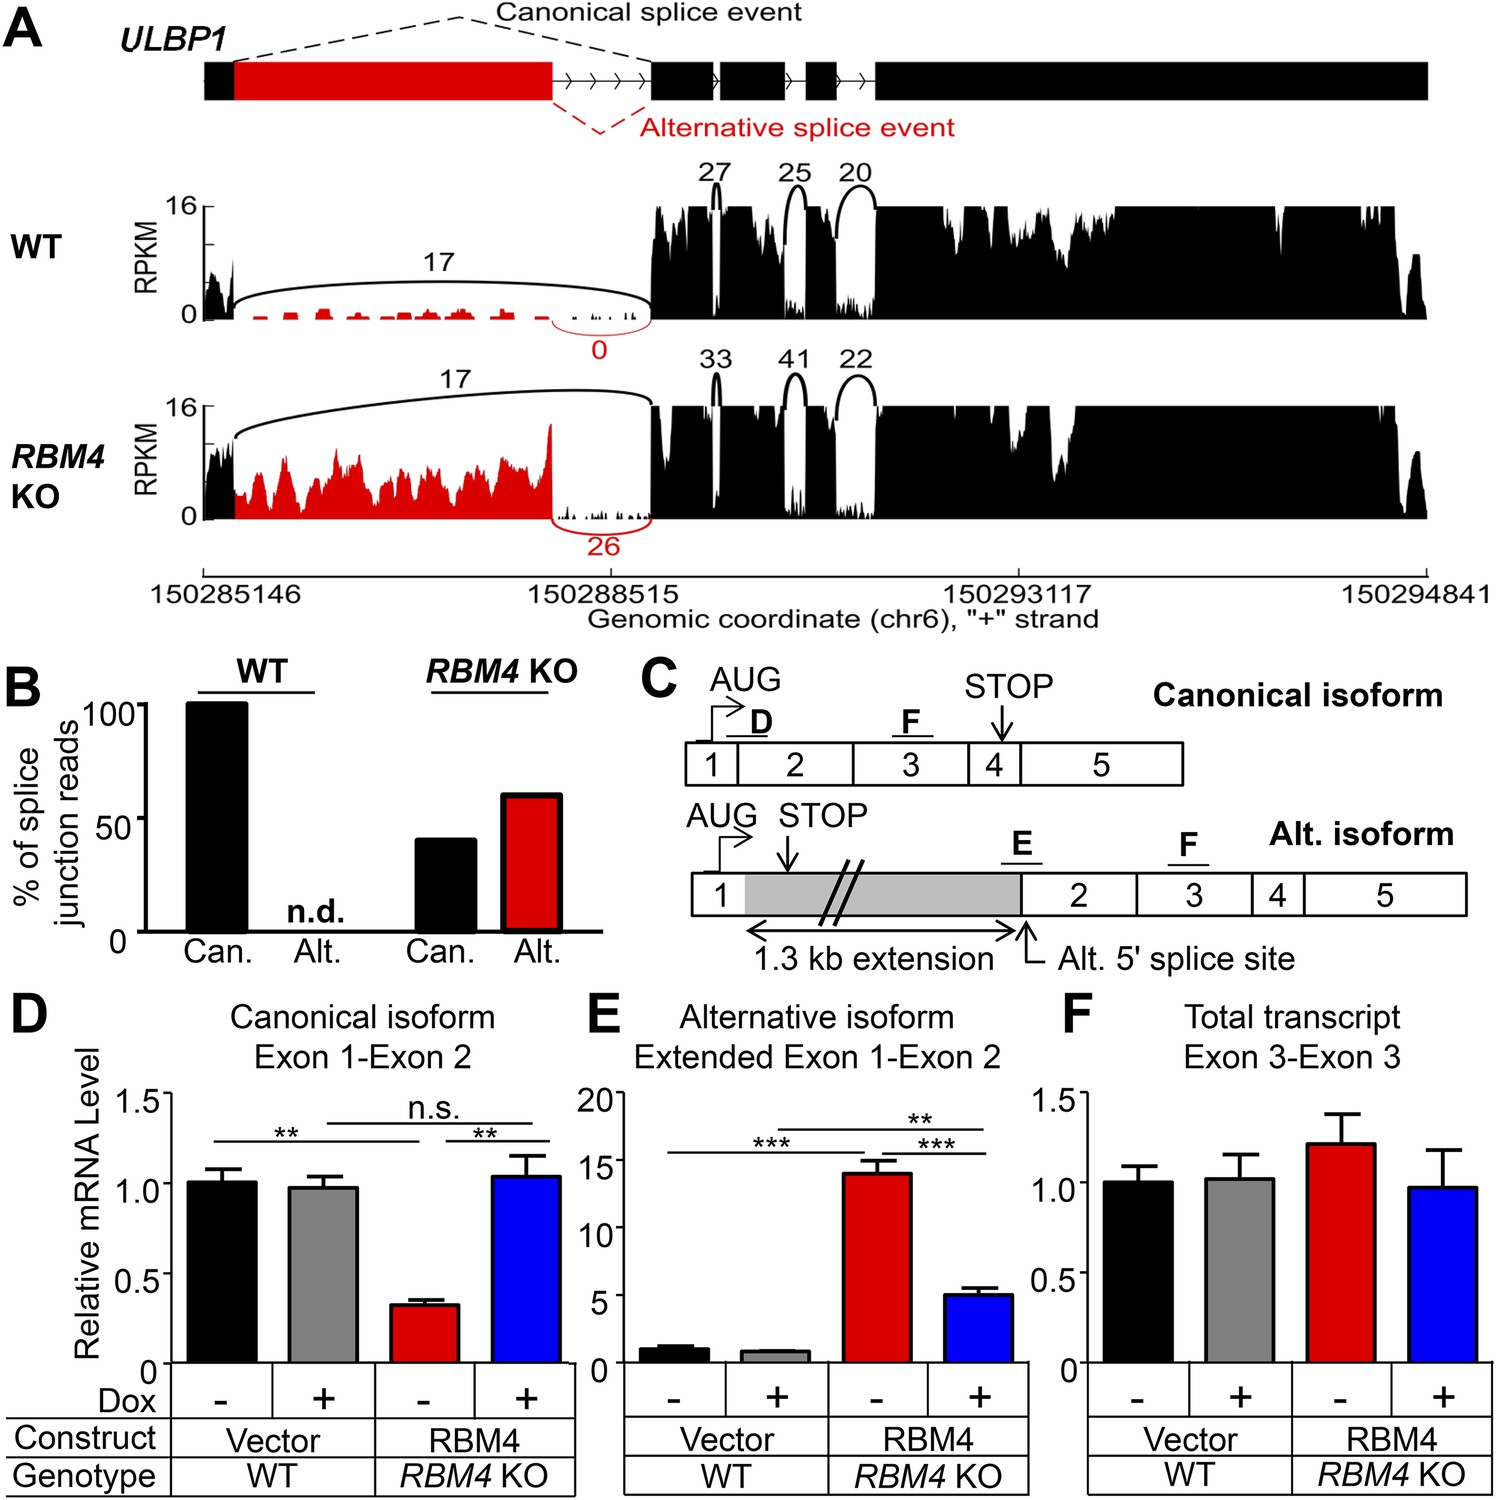
RBM4 suppresses the alternative splicing of ULBP1 mRNA.
(A) ‘Sashimi plots’ of RNA-Seq reads aligning to ULBP1 mRNA from WT and RBM4 KO HAP1 cells. Peak height represents the number of reads aligning to a given segment (RPKM). Arcs connect splice junctions identified by reads spanning the splice junction; the number of reads aligning to each splice junction is indicated. (B) Quantification of splice junction-spanning reads mapping to canonical or alternatively spliced ULBP1 mRNA. Reads spanning the canonical or alternative splice junction are expressed as a percent of the total junction-spanning reads (canonical + alternative). n.d.: not detected. (C) Diagram of the canonical and alternatively spliced isoforms of the ULBP1 mRNA. The alternative isoform contains a premature stop codon and is unlikely to produce a functional protein product. The PCR amplicons used in (D–F) are indicated. (D–F) RT-qPCR analysis of ULBP1 transcript levels in WT and RBM4 KO HAP1 cells. Cells were transduced with a doxycycline-inducible RBM4 vector or control vector and treated with 100 ng/ml Dox for 24 hr. The data were analyzed by 1-way ANOVA with Bonferroni's multiple comparisons test and are representative of three independent experiments. **p < 0.01, ***p < 0.001, n.s.: not significant.
Figure 7—figure supplement 1
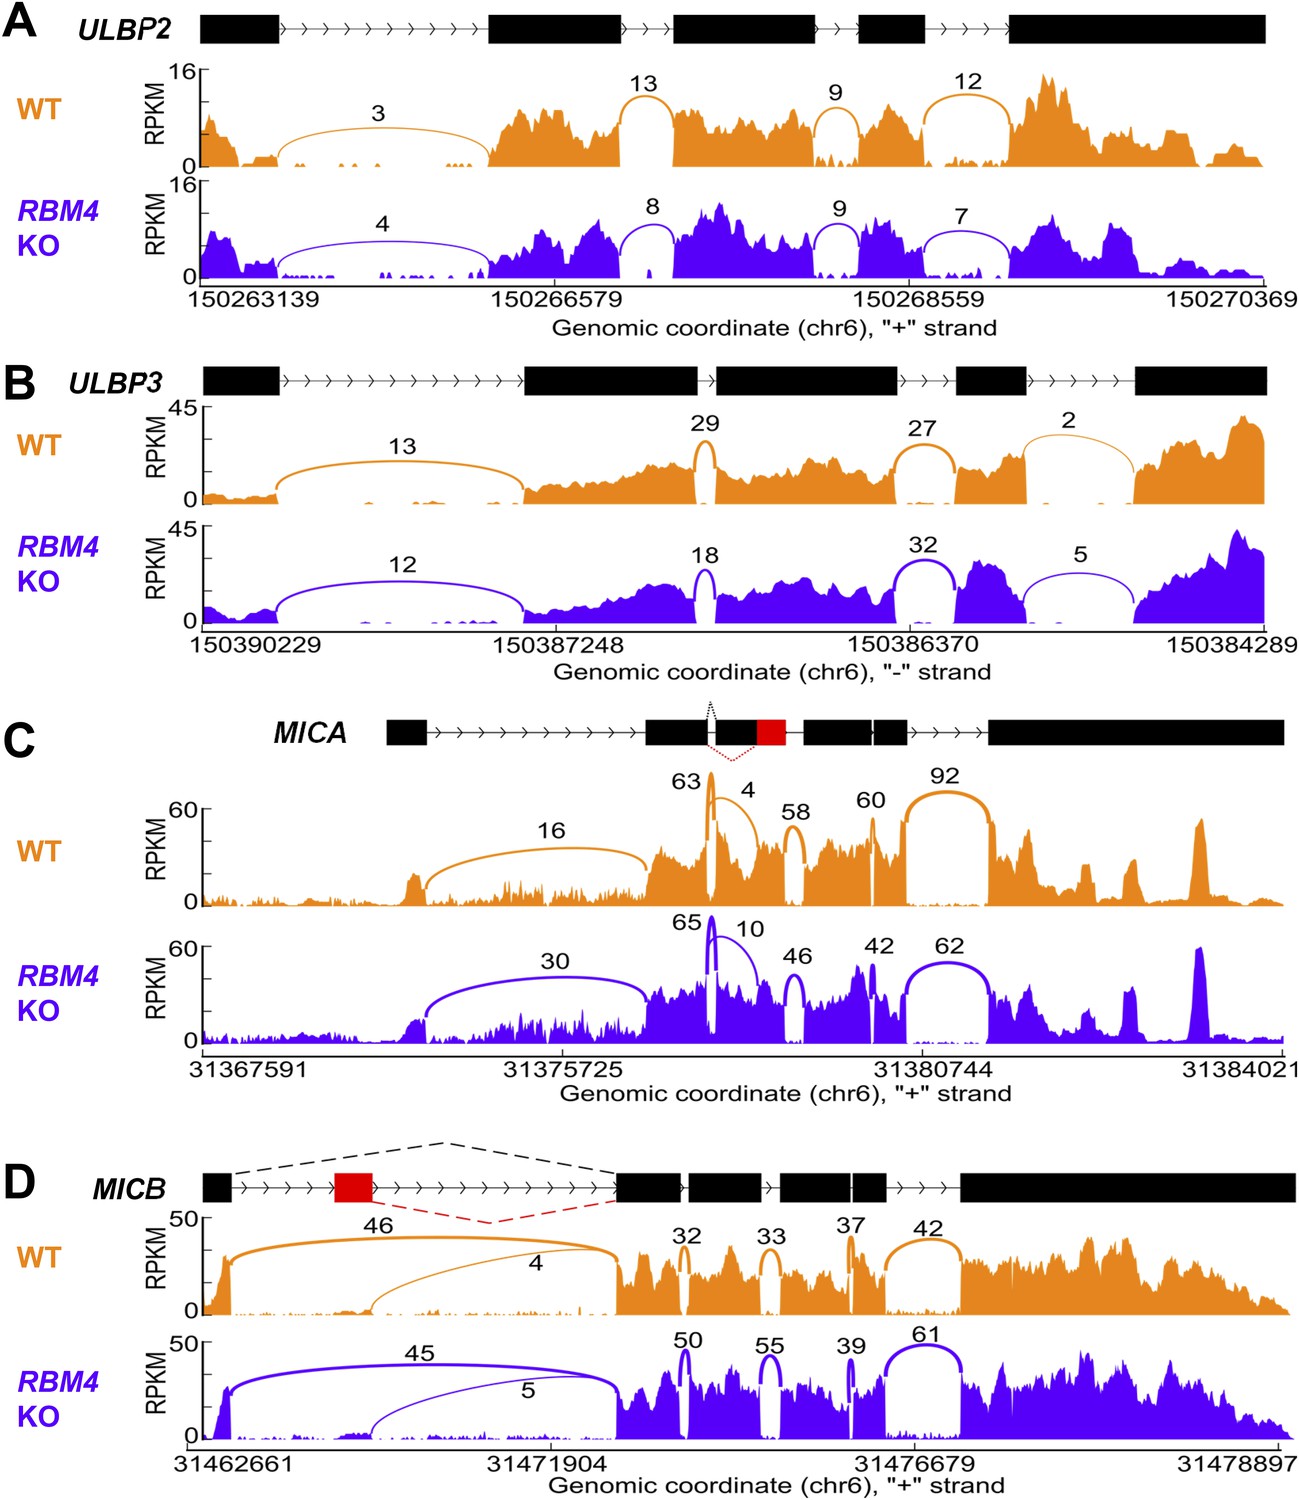
Splicing of other NKG2D ligands is unchanged in RBM4 KO HAP1 cells.
‘Sashimi’ plots of RNA-Seq reads aligning to ULBP2 (A), ULBP3 (B), MICA (C), and MICB (D) in WT and RBM4 KO HAP1 cells. Peak height represents the number of reads aligning to a given segment RPKM. Arcs connect splice junctions identified by reads spanning the splice junction, with numerals indicating the number of reads aligning to the junction. The data for MICA in panel C showed more reads spanning the exon 1-exon 2 splice junction in the RBM4 KO sample than in WT cells, but as this did not affect cell surface expression, the significance of this observation is not clear.
Figure 7—figure supplement 2
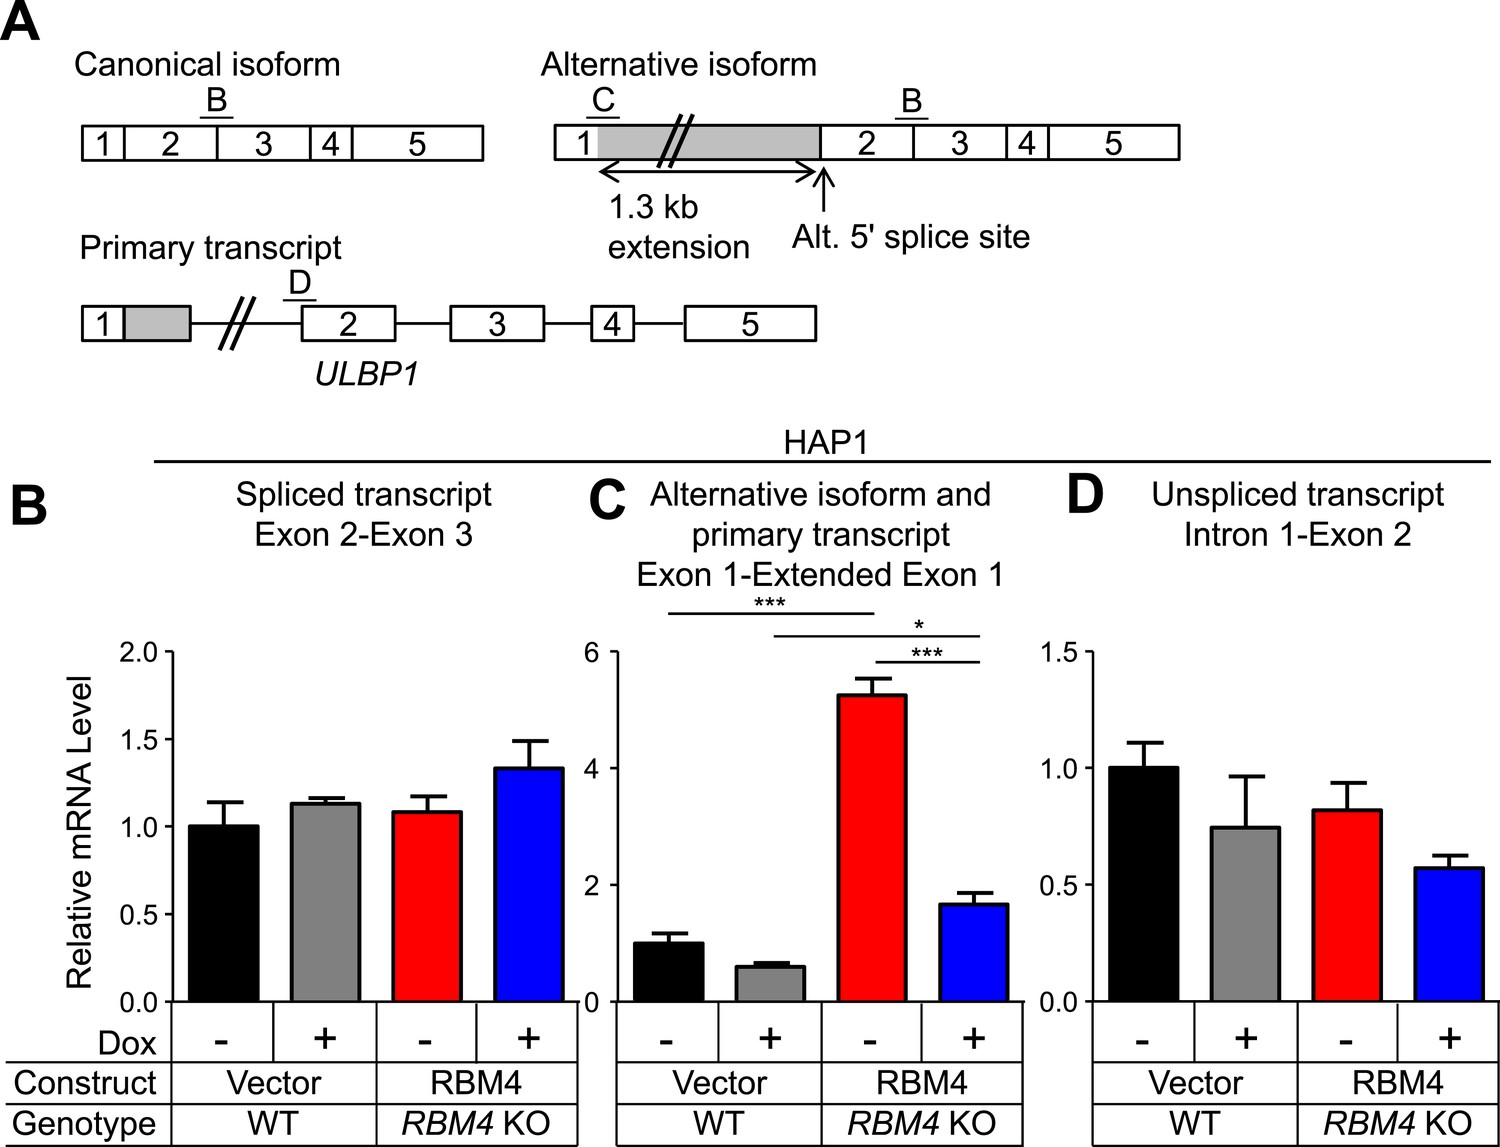
Additional analysis of ULBP1 transcript in WT and RBM4 KO HAP1 cells.
(A) Diagram of the ULBP1 primary transcripts and canonical and alternatively spliced mRNA isoforms. The PCR amplicons used in (B–D) are noted. (B–D) RT-qPCR analysis of ULBP1 transcript levels in WT and RBM4− HAP1 cells. Cells were transduced with a doxycycline-inducible RBM4 vector or control vector and treated with 100 ng/ml Dox for 24 hr. The data were analyzed by 1-way ANOVA with Bonferroni's multiple comparisons test and are representative of three independent experiments. *p < 0.05, ***p < 0.001.
Tables
Table 1
Selected list of genes enriched for gene-trap insertions after selection of ULBP1lowCD55+ cells
| Gene symbol | Function/Process | p-value |
|---|---|---|
| ULBP1 | NKG2D ligand | 2.65E-76 |
| RBM4 | RNA-binding protein | 1.29E-24 |
| SPCS1 | Non-catalytic subunit of signal peptidase complex | 1.25E-15 |
| SPCS2 | Non-catalytic subunit of signal peptidase complex | 6.20E-09 |
| HSPA13 | Microsome-associated protein with ATPase activity | 1.24E-05 |
| FLJ37453 | Non-coding RNA | 0.00115 |
| SLC17A9* | Vesicular nucleotide transporter | 0.00715 |
| RPS25 | Ribosomal protein | 0.00715 |
| ATF4 | Stress-induced transcription factor | 0.0206 |
| NCRNA00167 | Non-coding RNA | 0.0363 |
| CRNKL1* | Pre-mRNA splicing | 0.0363 |
| ICK | Intestinal cell kinase, MAPK-related | 0.0363 |
| TBC1D19 | TBC domain-containing protein | 0.0416 |
| ZNF236 | Zinc-finger protein | 0.0496 |
-
The gene symbols of hits (p < 0.05) are shown with a brief description of known or predicted gene functions. A p-value of enrichment was determined using Fisher's exact test, followed by correction for the false discovery rate. The list was manually curated to remove known genes that have occurred in several unrelated screens using the same cells, perhaps indicating pleiotropic effects. For simplicity, a number of genes related to GPI biosynthesis and anchoring were removed. Bold text indicates genes confirmed in this study to impact ULBP1 expression. Blue text indicates genes involved in GPI biosynthesis and anchoring. Red text indicates genes involved in protein glycosylation. Asterisks indicate two genes (SLC17A9 and CRNKL1) that, when targeted with CRISPR/Cas9, failed to result in decreased ULBP1 expression.
Table 2
sgRNA sequences
| Name | sgRNA Sequence + PAM | Used in |
|---|---|---|
| ULBP1 sgRNA | GGTCCCGGGCAGGATGGGT | HAP1 |
| ATF4 sgRNA 1 | GGCGGGCTCCTCCGAATGGC | HAP1 |
| ATF4 sgRNA 2 | CTCGTCACAGCTACGCCCT | HAP1, K-562, Jurkat |
| ATF4 sgRNA 3 | TGGCCAACTATACGGCTCCA | HAP1, K-562, Jurkat |
| RBM4 sgRNA | AGTCCCACCTGCACCAATA | HAP1 |
| RBM4/RBM4b sgRNA | CCCCGGGAGGCTACAGAGCAGG | HAP1 |
| HSPA13 sgRNA | GTGCCAAATAGCCGGCCAACAGG | HAP1 |
| SPCS1 sgRNA | CATCTGTTCAGCTAGCTTCTGG | HAP1 |
| SPCS2 sgRNA | AGTGGCCGTAGCGGCTTGTTGG | HAP1 |
-
PAM, protospacer adjacent motif.
-
For each sgRNA, the protospacer adjacent motif (PAM) is indicated in bold blue text. Red text indicates that the 5ʹ G is not present in the genomic target sequence and was added to the sgRNA to allow transcription from the U6 promoter.
Table 3
PCR primers used to detect mutations
| Target | Primer direction | Primer sequence | Amplicon size (bp) |
|---|---|---|---|
| ULBP1 sgRNA target locus | Forward | ATAAACAGCCGTGGTGTGAG | 401 |
| Reverse | TGTCTGGGGAGATCACGATG | ||
| ATF4 sgRNA 1 target locus | Forward | CATTCCTCGATTCCAGCAAAGC | 345 |
| Reverse | TGAGTGATGGGGCCAAGTGAG | ||
| Deletion of ATF4 with sgRNAs 2 and 3 | Forward | CGTCCTCGGCCTTCACAATA | 442 |
| Reverse | TCTTCAGGATGAGGCTTCTGC | ||
| RBM4 sgRNA target locus | Forward | TGCACATAGAAGACAAGACGGC | 332 |
| Reverse | CCTTGTGTTCAGCCCTCTACCC | ||
| HSPA13 sgRNA target locus | Forward | TGCTGTCTGAGAGGAGTGCT | 476 |
| Reverse | CCTCCAACTCTTCTGCGGTA | ||
| SPCS1 sgRNA target locus | Forward | ATTTAATATCTTGCCCAGGCCC | 394 |
| Reverse | ACCCACAAATTTCTTACCAAACAT | ||
| SPCS2 sgRNA target locus | Forward | AACCTCAAGTCCCAGCAAGC | 466 |
| Reverse | CGGGTCCAGGTTTGAAGTGT |
Table 4
Primers used for qPCR
| Target | Primer direction | Primer sequence (5ʹ-3ʹ) | Amplicon size (bp) |
|---|---|---|---|
| ACTB | Forward | TTGGCAATGAGCGGTTCC | 92 |
| Reverse | GTTGAAGGTAGTTTCGTGGATG | ||
| GAPDH | Forward | CAACAGCGACACCCACTCCT | 115 |
| Reverse | CACCCTGTTGCTGTAGCCAAA | ||
| HPRT1 | Forward | AGGATTTGGAAAGGGTGTTTATTC | 109 |
| Reverse | CAGAGGGCTACAATGTGATGG | ||
| Total ULBP1 (exon 3-exon 3) | Forward | GCCAGGATGTCTTGTGAGCATGAA | 134 |
| Reverse | TTCTTGGCTCCAGGATGAAGTGCT | ||
| ULBP1 canonical isoform (exon 1-exon 2) | Forward | ATCAGCGCCTCCTGTCCAC | 136 |
| Reverse | AAAGACAGTGTGTGTCGACCCAT | ||
| ULBP1 alternative isoform (extended exon 1-exon 2) | Forward | GGAATTGCAGGAGGGTGGAG | 183 |
| Reverse | CAAAGGCTTTGGCCTTGTGGTTAA | ||
| ULBP1 spliced transcript (exon 2-exon 3) | Forward | TAAGTCCAGACCTGAACCACA | 477 |
| Reverse | CCATTGAAGAGGAACTGCCAAG | ||
| ULBP1 alternative isoform and primary transcript (exon 1-extended exon 1) | Forward | CCGGGCAGGATGGGTCG | 263 |
| Reverse | TGTCTGGGGAGATCACGATG | ||
| ULBP1 unspliced transcript (Intron 1-exon 2) | Forward | CCCTCAGAGGCCTTCACTTG | 195 |
| Reverse | AAGGCCTTTCATCCACCAGG | ||
| ULBP2 | Forward | GCCGCTACCAAGATCCTTCT | 161 |
| Reverse | TCATCCACCTGGCCTTGAAC | ||
| ULBP3 | Forward | CTCGCGATTCTTCCGTACCT | 127 |
| Reverse | TCTGGACCTCACACCACTGT | ||
| MICA | Forward | ATGTCCTGCCTGATGGGAATGGAA | 189 |
| Reverse | CAGCAGCAACAGCAGAAACATGGA | ||
| MICB | Forward | TGGATCTGTGCAGTCAGGGTTTCT | 176 |
| Reverse | TGAGGTCTTGCCCATTCTCTGTCA | ||
| ULBP1 promoter ChIP | Forward | GCTGTCAGATGACGAGCCC | 80 |
| Reverse | ATACACTGGGCGGGATCCTA | ||
| ASNS promoter ChIP | Forward | TGGTTGGTCCTCGCAGGCAT | 66 |
| Reverse | CGCTTATACCGACCTGGCTCCT | ||
| ASNS exon 7 ChIP | Forward | GCAGCTGAAAGAAGCCCAAGT | 62 |
| Reverse | TGTCTTCCATGCCAATTGCA |
Additional files
-
Supplementary file 1
Complete list of hits and statistical analysis of all independent insertions mapped in the ULBP1 screen data set. (A) Annotated list of hits: The gene symbols of hits (p < 0.05) with a brief description of known or predicted gene functions. A p-value of enrichment was determined using Fisher's exact test, followed by correction for the false discovery rate. Yellow shading indicates genes confirmed in this study to impact ULBP1 expression. Light blue shading indicates genes involved in GPI biosynthesis and anchoring. Light orange shading genes involved in protein glycosylation. Gray shading indicates genes that have occurred in several unrelated screens using the same cells, perhaps indicating pleiotropic effects. Asterisks indicate two genes (SLC17A9 and CRNKL1) that, when targeted with CRISPR/Cas9, failed to result in decreased ULBP1 expression. (B) Statistical analysis: Statistical analysis of all independent insertions mapped in the ULBP1 screen data set.
- https://doi.org/10.7554/eLife.08474.025
-
Supplementary file 2
Sequence of ULBP1 promoter –603 construct. Annotated plasmid sequences of the ULBP1 promoter reporter constructs used in Figure 6—figure supplement 2.
- https://doi.org/10.7554/eLife.08474.026
-
Supplementary file 3
Sequence of ULBP1 promoter –288 construct. Annotated plasmid sequences of the ULBP1 promoter reporter constructs used in Figure 6—figure supplement 2.
- https://doi.org/10.7554/eLife.08474.027
-
Supplementary file 4
Sequence of ULBP1 promoter m1 construct. Annotated plasmid sequences of the ULBP1 promoter reporter constructs used in Figure 6—figure supplement 2.
- https://doi.org/10.7554/eLife.08474.028
-
Supplementary file 5
Sequence of ULBP1 promoter m2 construct. Annotated plasmid sequences of the ULBP1 promoter reporter constructs used in Figure 6—figure supplement 2.
- https://doi.org/10.7554/eLife.08474.029
-
Supplementary file 6
Sequence of ULBP1 promoter m3 construct. Annotated plasmid sequences of the ULBP1 promoter reporter constructs used in Figure 6—figure supplement 2.
- https://doi.org/10.7554/eLife.08474.030
-
Supplementary file 7
Sequence of ULBP1 promoter m4 construct. Annotated plasmid sequences of the ULBP1 promoter reporter constructs used in Figure 6—figure supplement 2.
- https://doi.org/10.7554/eLife.08474.031
Download links
A two-part list of links to download the article, or parts of the article, in various formats.
Downloads (link to download the article as PDF)
Open citations (links to open the citations from this article in various online reference manager services)
Cite this article (links to download the citations from this article in formats compatible with various reference manager tools)
A forward genetic screen reveals novel independent regulators of ULBP1, an activating ligand for natural killer cells
eLife 4:e08474.
https://doi.org/10.7554/eLife.08474


