Reconstructing the in vivo dynamics of hematopoietic stem cells from telomere length distributions
- Max Planck Institute for Evolutionary Biology, Germany
- Rheinisch-Westfälische Technische Hochschule Aachen University Hospital, Germany
- University Hospital of Zürich, Switzerland
- Mayo Clinic, United States
Figures
Figure 1 with 1 supplement
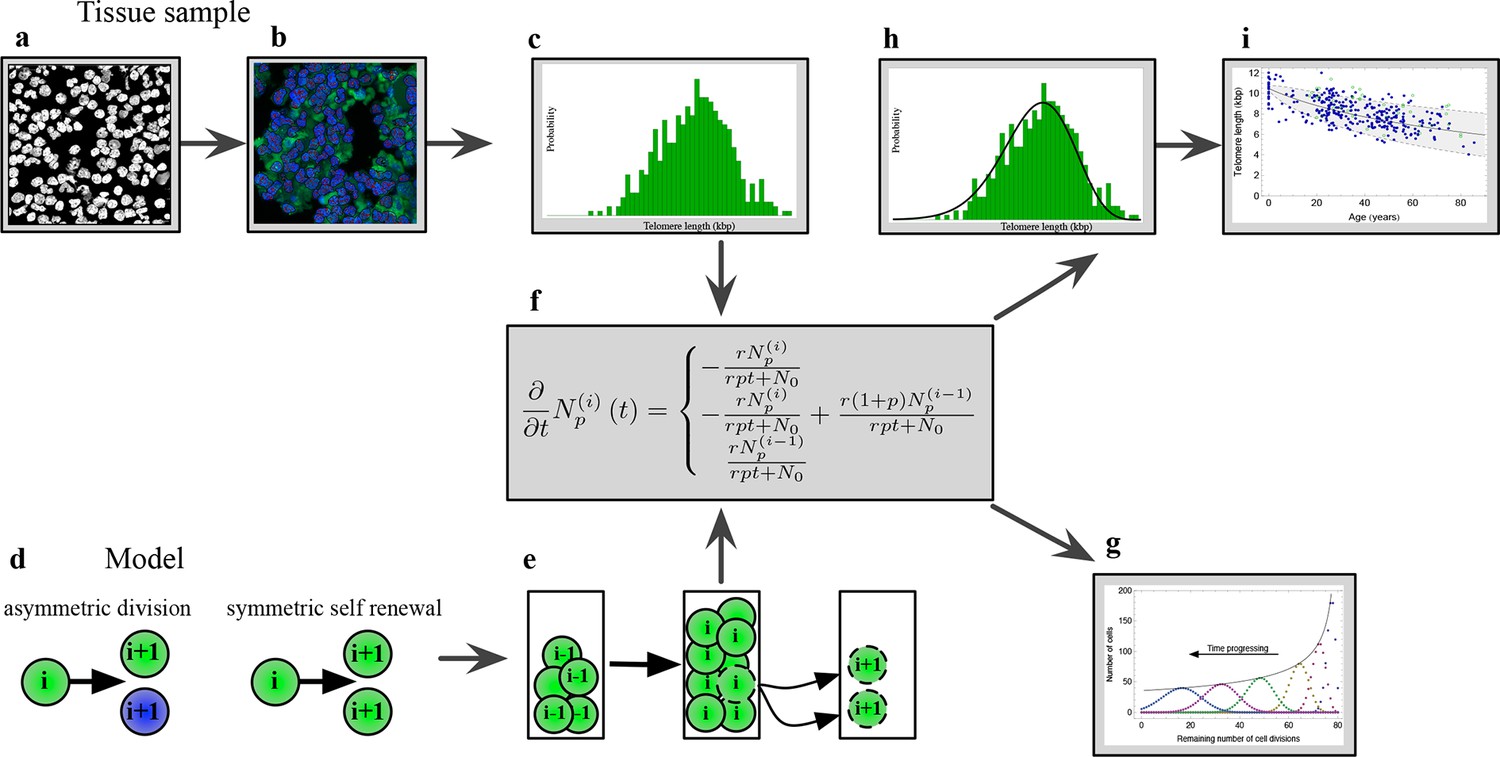
The combination of telomere length data and mathematical modeling allows to infer individualized stem cell proliferation patterns.
(a–c) Blood or bone marrow samples were taken from healthy persons with ages between 0 and 85. Telomere length was measured with Flow-FISH and Q-FISH techniques, resulting in individualized telomere length distributions. (d–g) Mathematical framework: Stem cells divide either symmetrically or asymmetrically. Each cell is characterized by an average telomere length. Cells with the same state are collected in compartments. The average of the underlying stochastic process is captured by a system of differential equations. The solution of this equation is a generalised truncated Poisson distribution that gives rise to a traveling wave, see Equation S15. (h, i) The combination of modeling and telomere length distribution measurements allows dynamic predictions for individuals, see Figure 6. These predictions can be tested on population wide data of telomere length, for example see Figure 3.
Figure 1—figure supplement 1
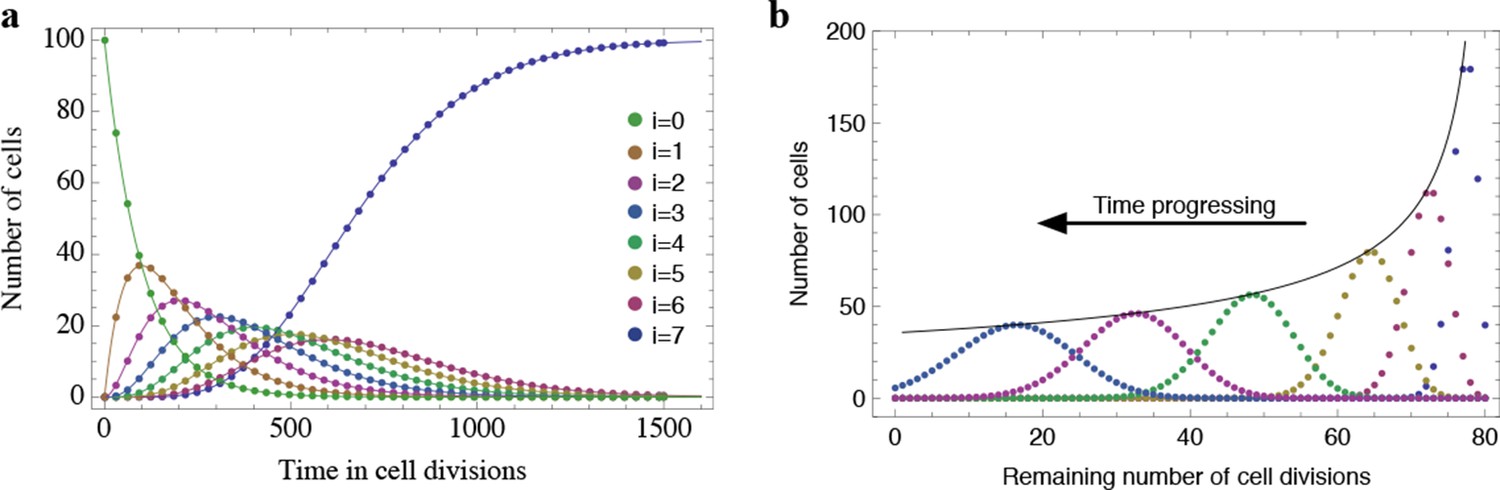
Results of the mathematical model on the temporal change of individual telomere length distributions.
Compared are analytical results (lines) and averages of stochastic computer simulations (dots) of our mathematical model, see Materials and methods. (a) An example of a population of 100 cells, where each cell has 7 proliferation cycles before it enters cell cycle arrest (cells accumulating in state ). (b) Expected telomere length distributions at 6 distinct time points (time increases with decreasing remaining number of cell divisions). The telomere length distribution gives rise to a traveling wave that progressively widens and shifts towards shorter telomere length. The maximum of this distribution declines proportional to (black line).
Figure 2 with 2 supplements
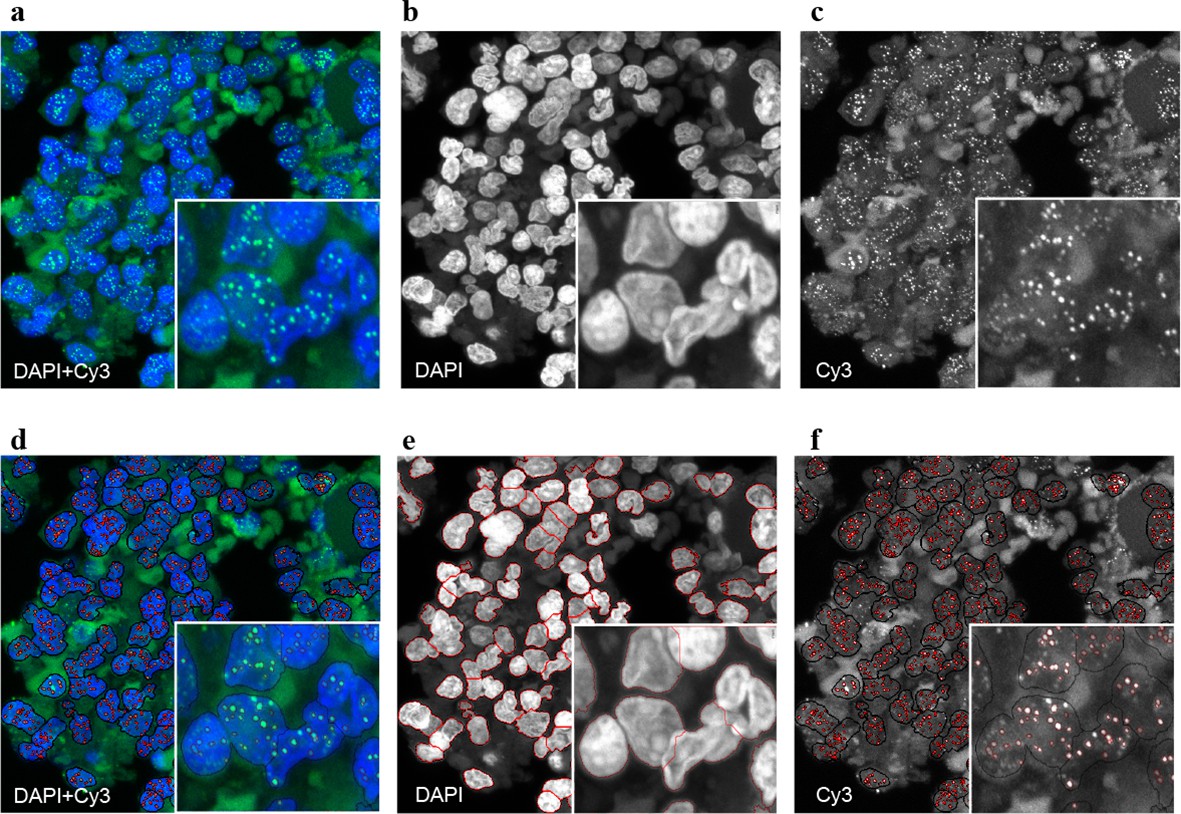
Representative image of the Q-FISH analysis of a bone marrow section.
(a) Maximum projection image of a paraffin-embedded bone marrow section of confocal Q-FISH with DAPI and Cy3. (b, c) Single DAPI and Cy3 staining respectively. (d) Overlay of image analysis of nucleus and telomere detection. (e) Image analysis of the DAPI staining is shown. Detected nuclei are shown in red. (f) Image analysis of the Cy3 staining. Detected telomeres marked in red. For details on the Q-FISH analysis please see Materials and methods.
Figure 2—figure supplement 1
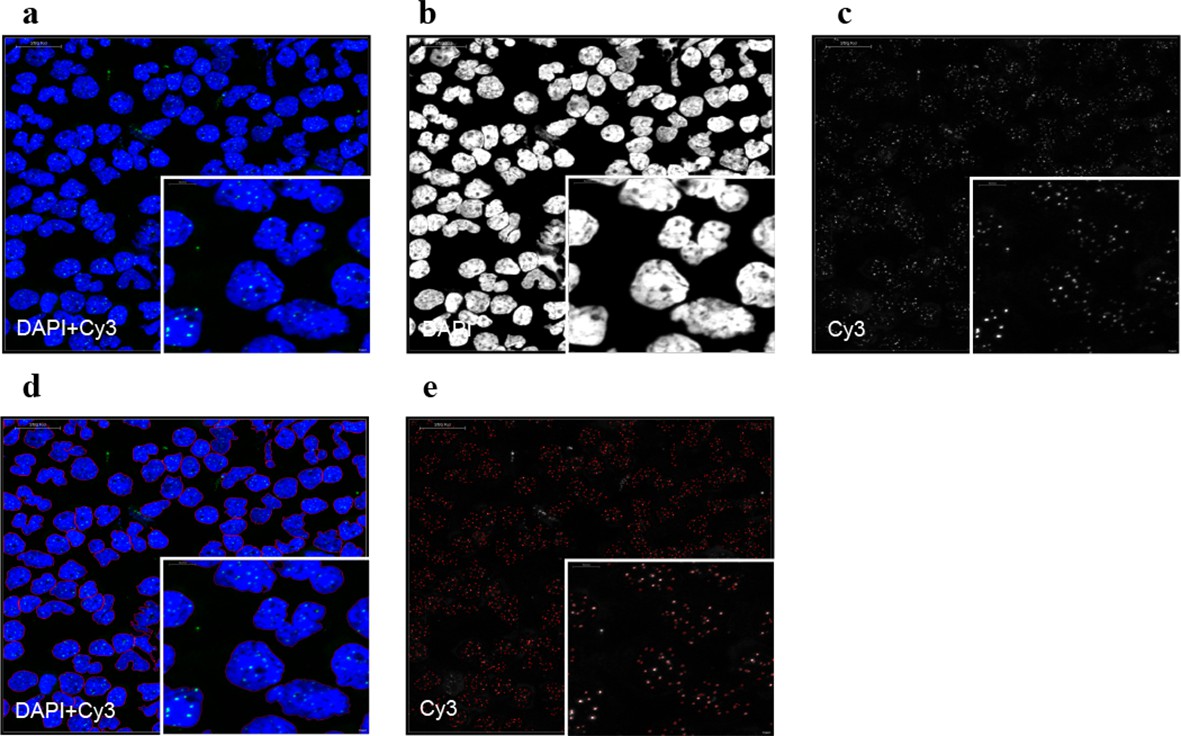
Representative image of the Q-FISH analysis of a peripheral blood cytospin.
(a) Maximum projection image of confocal Q-FISH with staining of DAPI and Cy3. (b, c) Single DAPI and Cy3 staining is shown. (d) Image analysis with nucleus detection marked with red lines. (e) Image analysis of detected single telomeres marked in red.
Figure 2—figure supplement 2
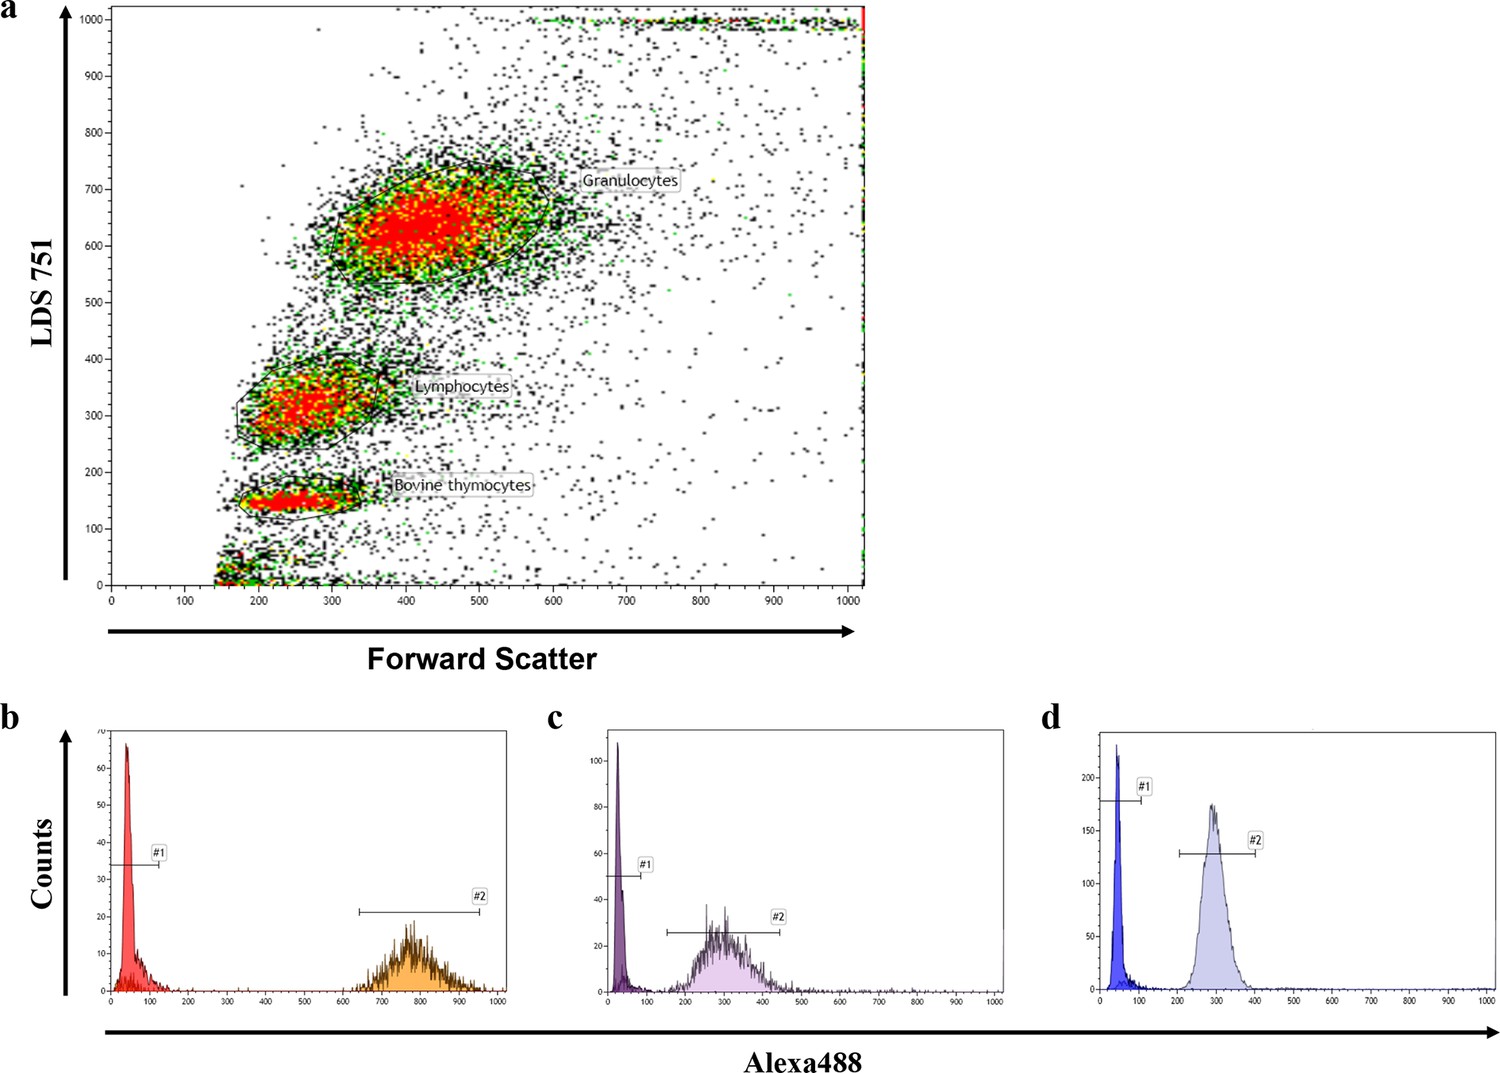
Representative FACS blot of a flow-FISH analysis.
(a) Representative flow-FISH blot of healthy individual. Based on LDS 751 staining and forward scatter properties, cow thymocytes, lymphocytes and granulocytes can be identified. (b) Telomere intensity of Alexa488 of unstained and stained thymocytes is given. (c) Telomere intensity of Alexa488 of unstained and stained lymphocytes. (d) Telomere intensity of Alexa488 of unstained and stained granulocytes.
Figure 3 with 1 supplement
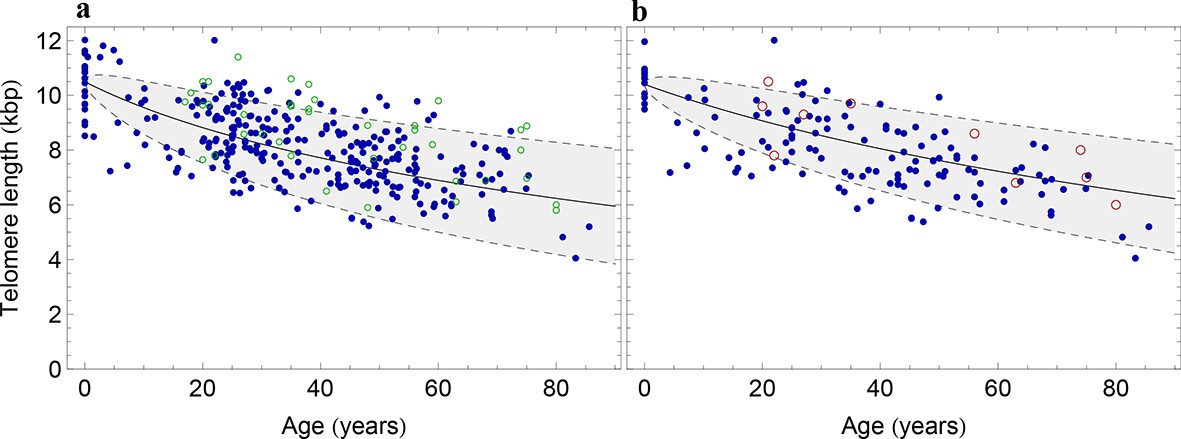
The population wide average telomere length of (a) lymphocytes and (b) granulocytes.
The data from a cohort of 356 individuals (symbols) is captured by a logarithmic decrease of the average telomere length (solid line), which is predicted by our model 2 that allows for symmetric stem cell divisions and thus leads to a slowly increasing stem cell pool. Based on the fit of the average, the mathematical model predicts a standard deviation that increases with the square root of the age (dashed lines). This approach does not take the genetic variability of telomere length in newborns into account. The decrease of the average telomere length slows down in children and becomes almost linear in adults, see also Figure 4. For individuals represented by filled symbols, only information on the average telomere length is available. For individuals represented by open symbols, we additionally analysed the distribution of individually detected telomeres, see Figure 6. An additional parameter estimation on an independent data set is shown in Figure 3—figure supplement 1.
Figure 3—figure supplement 1
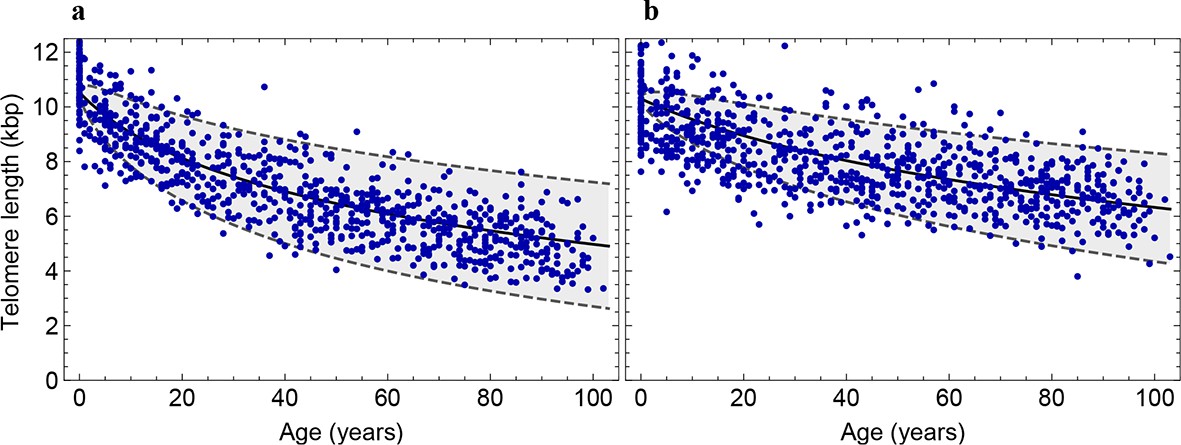
Decrease of the average telomere length of (a) lymphocytes and (b) granulocytes in a population of 835 healthy humans.
The data was taken from (Aubert et al., 2012) and confirms the inferred parameter range in Figure 2 independently.
Figure 4
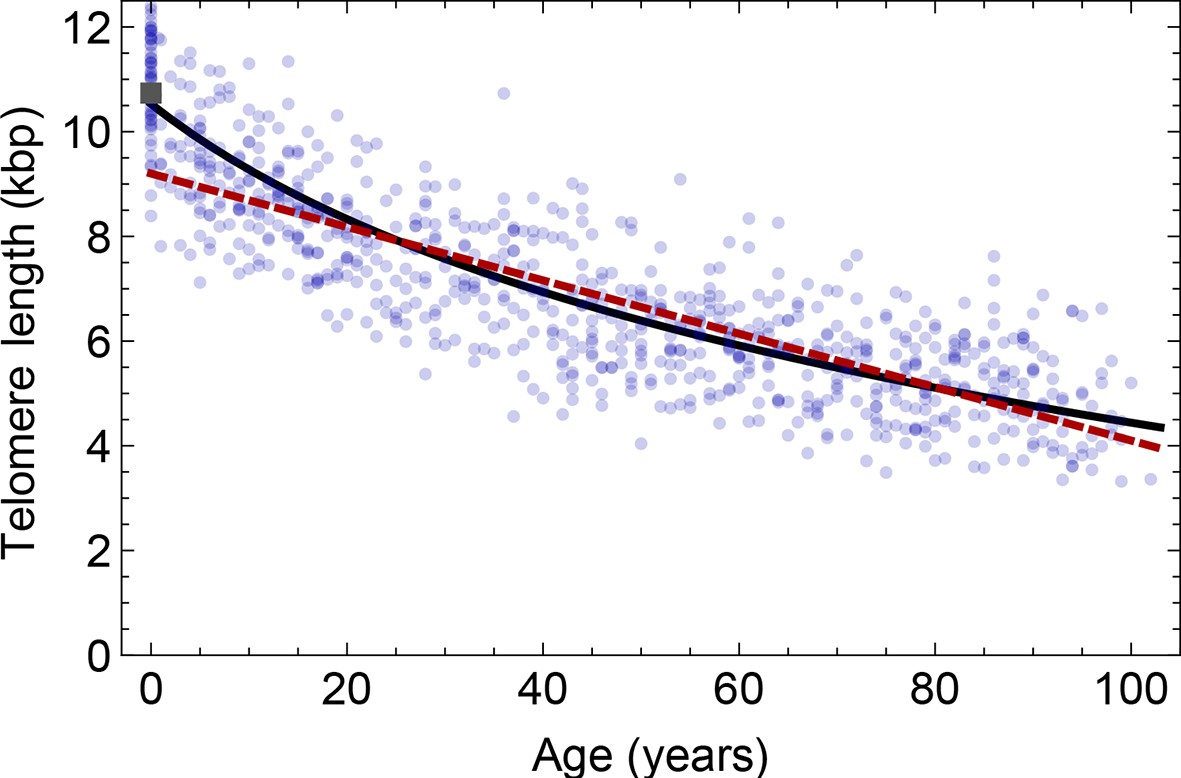
Comparison of the average telomere length decrease of lymphocytes predicted by Model 1 and Model 2.
Model 1 (red dashed line, best fit to the data) predicts a linear decrease of the average telomere length with age. The linear decrease underestimates the initial accelerated telomere loss during adolescence (the average initial telomere length in newborns is shown by the dark grey rectangle). In contrast, model 2 (black line) predicts a logarithmic decay of the average telomere length with age and is able to capture the increased loss of telomere length during adolescence, as well as the approximately linear decrease in adults.
Figure 5
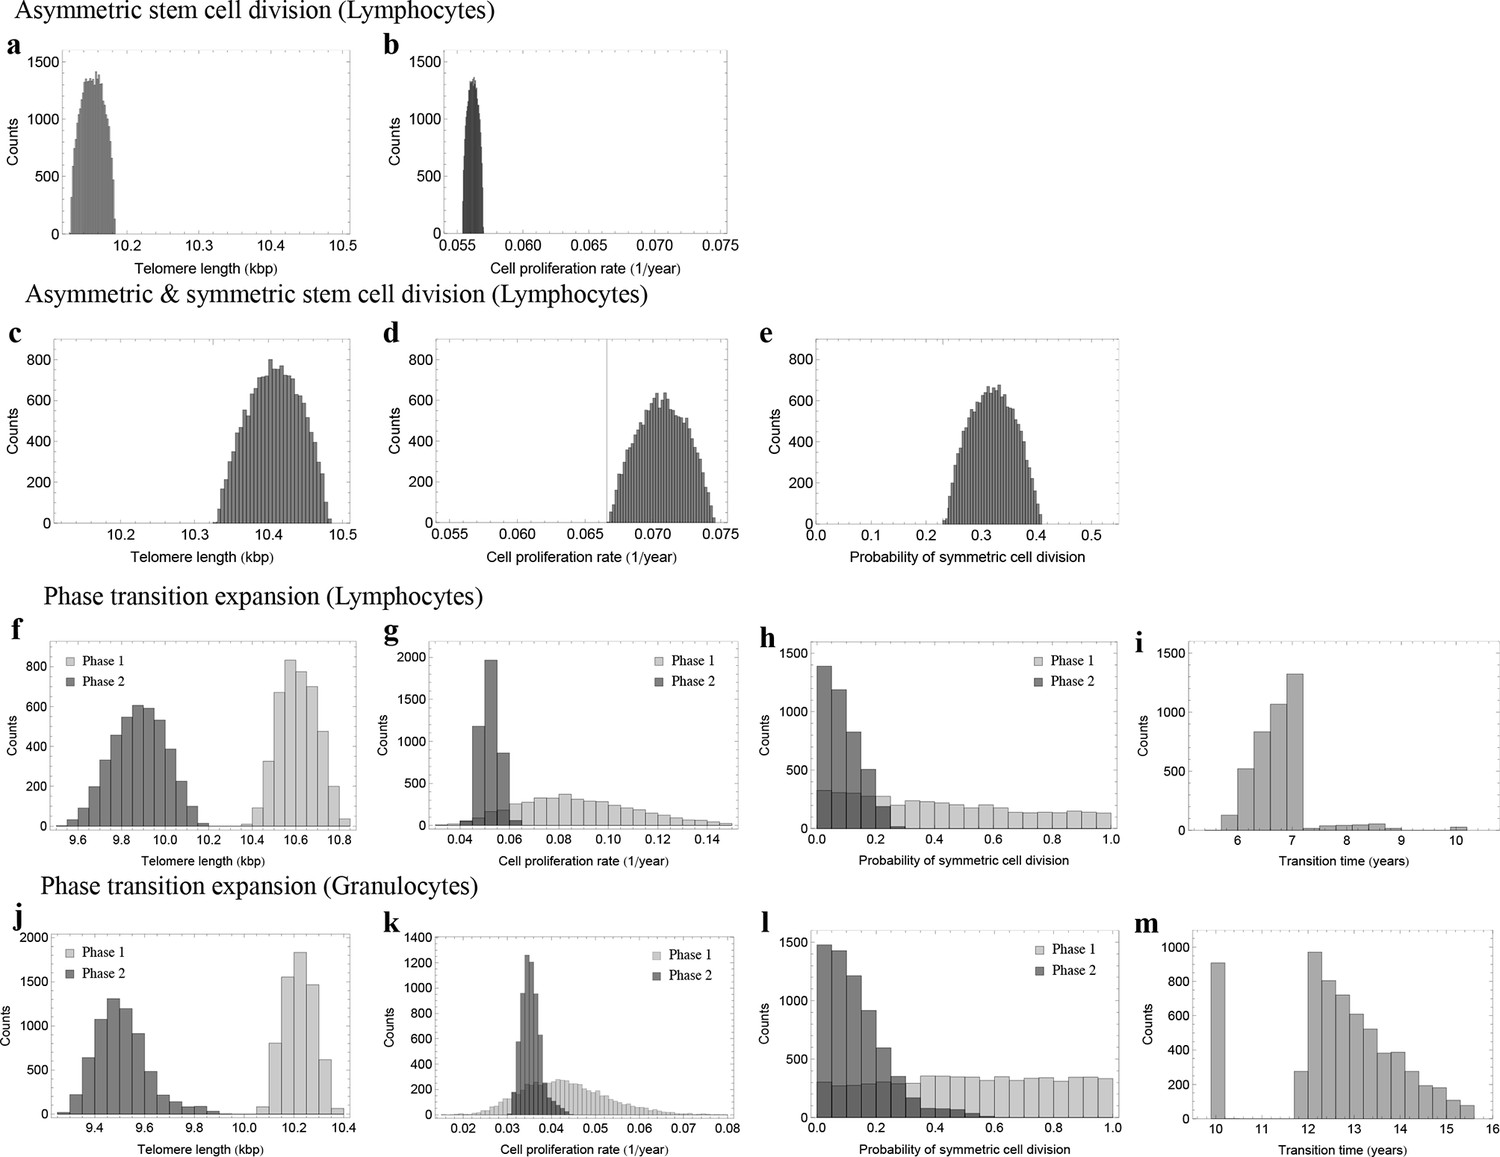
Posterior distributions of model parameters from Approximate Bayesian Computation (ABC).
(a, b) Model fit for only asymmetric stem cell divisions (model 1) to the data of average telomere length on the population level. The expected telomere length decreases linearly and two free model parameters, i.e. initial telomere length and stem cell turn over rate are estimated. (c–e) ABC with symmetric and asymmetric stem cell divisions (model 2). In this case one additional free parameter (probability of symmetric stem cell divisions) can be estimated. (f–i) ABC for a two phase extension of the model inferred from population wide data of lymphocytes, panels (j–m) show the same analysis for granulocytes. A likelihood based model selection favours model 2 and rejects model 1 as well as the multiphase model as more likely explanations for the observed data.
Figure 6 with 3 supplements
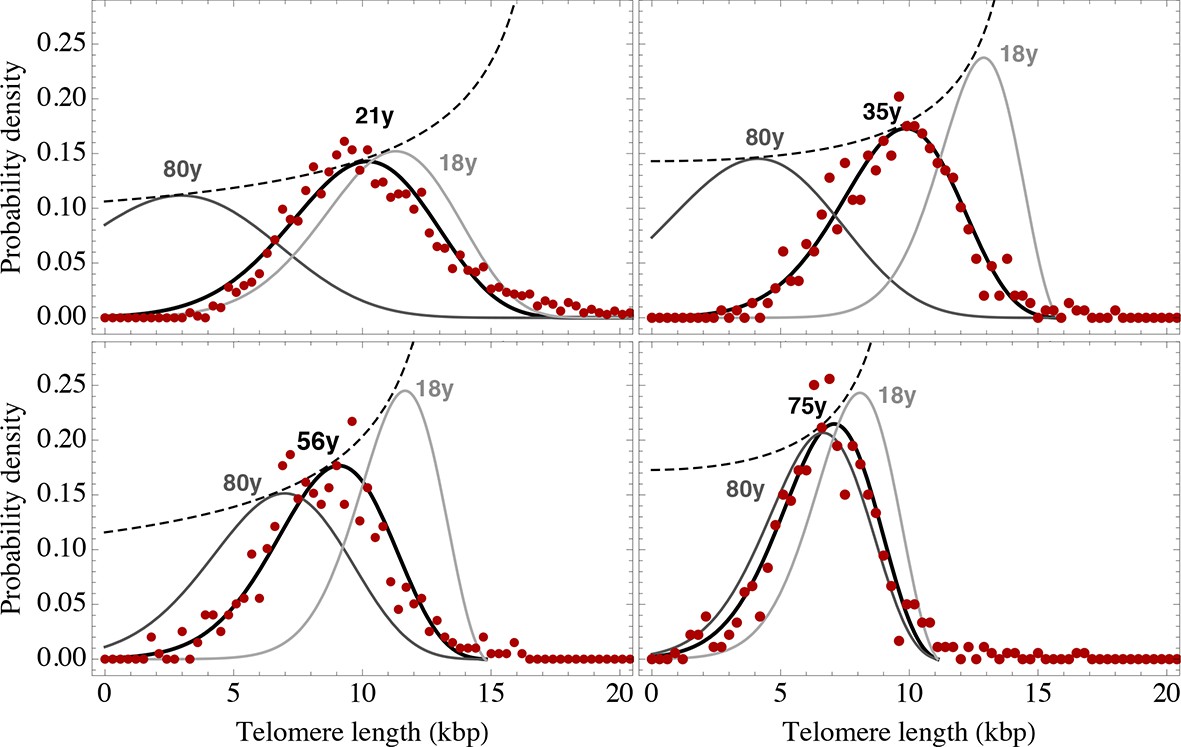
Telomere length distributions of granulocytes for four representative individuals.
Telomere length distributions within the nucleus of individual cells are measured once in single individuals (symbols). This data is fitted with our model 2 (black line, see Equation S29 for details), leading to estimates for the parameters of the theoretical distribution. These parameters can be used to extrapolate the distribution to any other age (gray lines). The dashed line shows the prediction for the maximum of the distribution (Equation S18). Telomere length distributions differ between individuals and change in different patterns, depending on the exact proliferation parameters in individuals. Additional cases are shown the Figure 6—figure supplements 1–3. A summary of all fitting parameters can be found in Supplementary file 1.
Figure 6—figure supplement 1
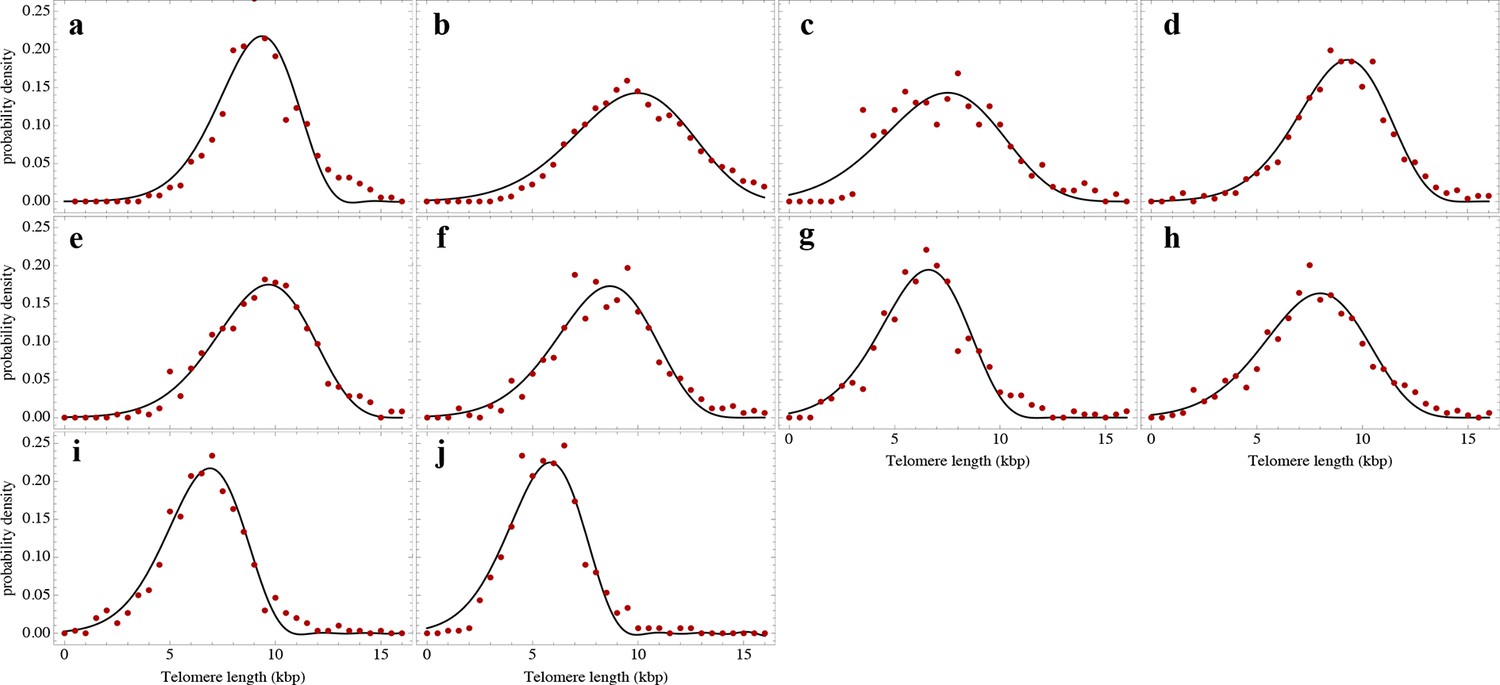
Nonlinear fits of the expected telomere length distribution to telomere length distributions of granulocytes in peripheral blood of 10 healthy donors.
For experimental details see Materials and methods, for details on the nonlinear fitting and individual parameters estimates as well as quality of fits, see Materials and methods and Supplementary file 1A.
Figure 6—figure supplement 2
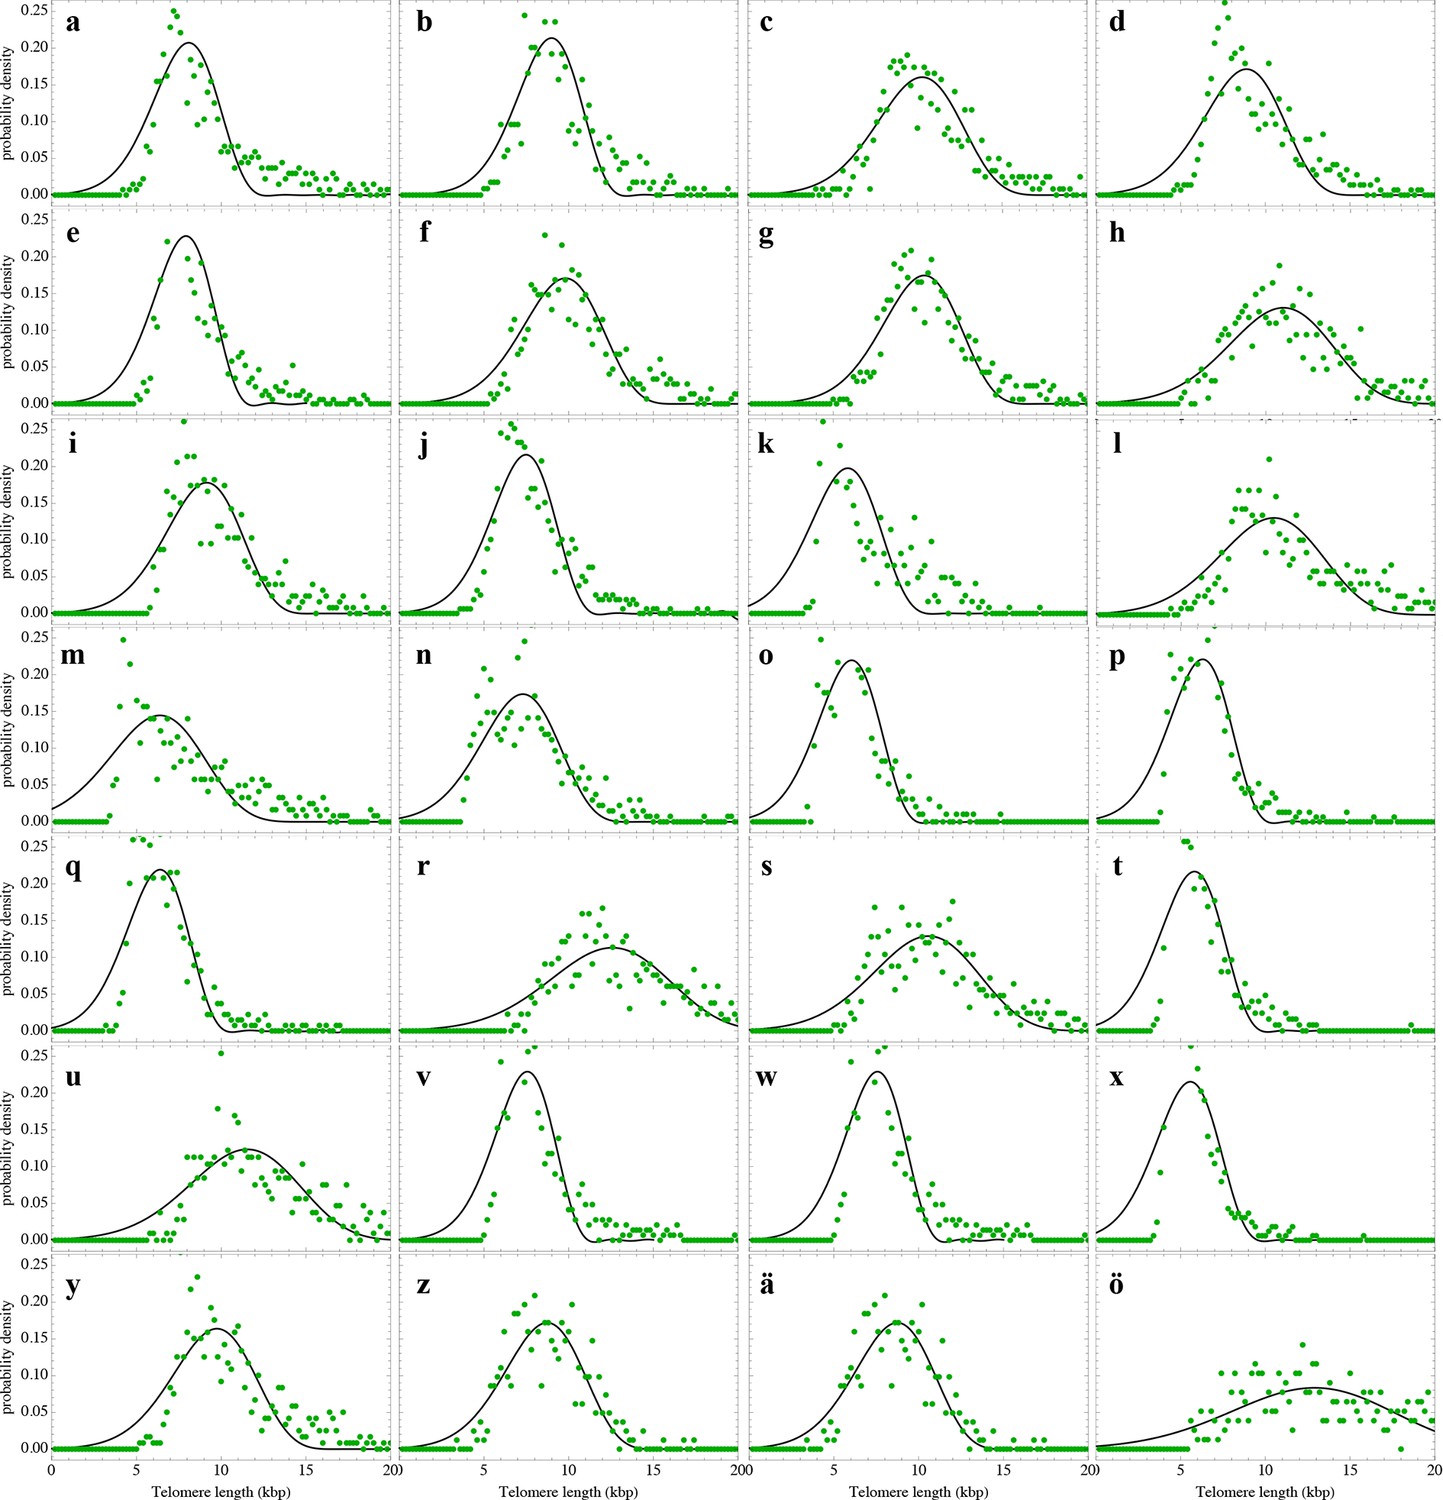
Nonlinear fits of the expected telomere length distribution to telomere length distributions of lymphocytes in peripheral blood of 28 healthy donors.
For experimental details see Materials and methods, for details on the nonlinear fitting and individual parameters estimates as well as quality of fits, see Materials and methods and Supplementary file 1B.
Figure 6—figure supplement 3

Nonlinear fits of the expected telomere length distribution to telomere length distributions in bone marrow biopsies of 28 patients with diagnosed M. Hodgkin without bone marrow affection.
For experimental details see Materials and methods, for details on the nonlinear fitting and individual parameters estimates as well as quality of fits, see Materials and methods and Supplementary file 1C.
Figure 7
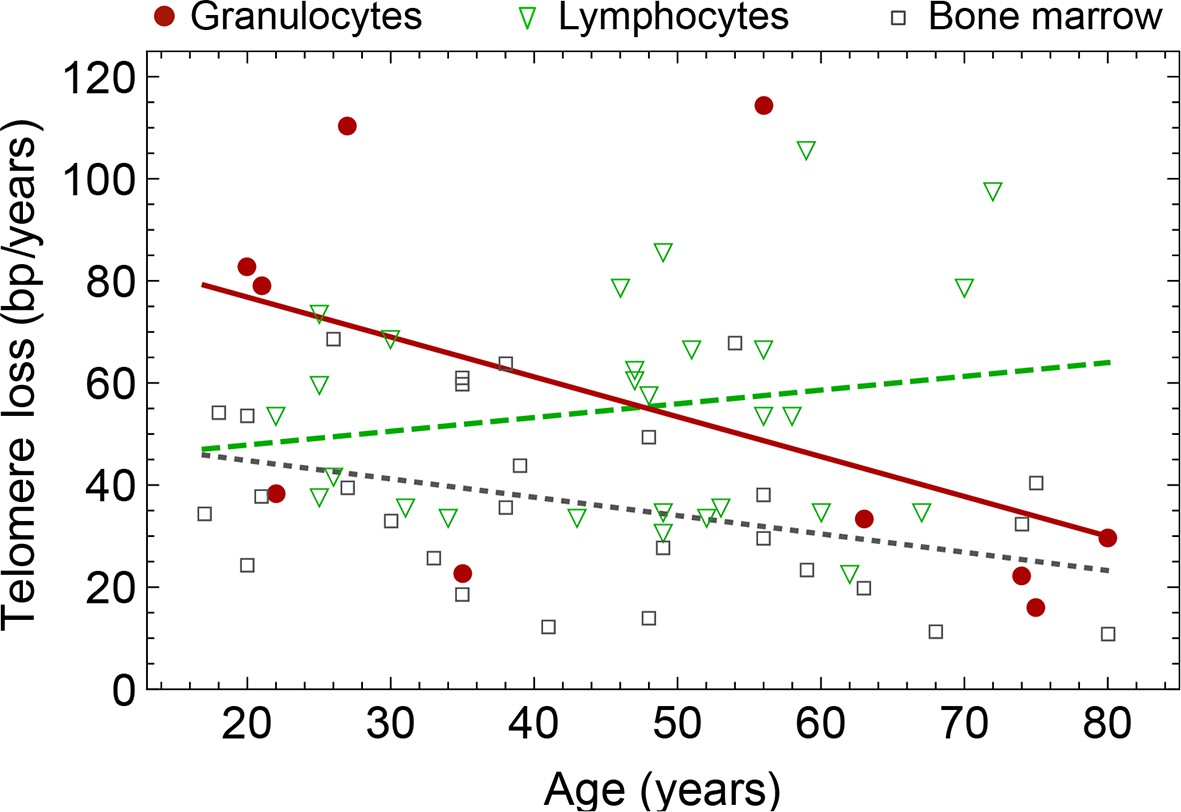
Rate of telomere loss in 66 individuals.
Shown is the rate of telomeric shortening (bp/year) of granulocytes (circles), lymphocytes (triangle) and bone marrow sections (rectangle), inferred from telomere length distributions of 66 different individuals (see Figure 5 and supplemental figures and Supplementary file 1 for a summary of all parameters). Differences between individuals are large, but the average telomere shortening rate conforms to parameter estimates of population wide data of telomere length, see for example Figure 5. Cells in the bone marrow show a lower proliferation rate and consequently the rate of telomere loss is reduced (gray dotted line). The rate of telomere loss decreases with age in granulocytes (−0.78 bp/year, dark red line) and in bone marrow sections (−0.36 bp/year, grey dotted line), but increases in lymphocytes (+0.27 bp/year, dark green dashed line). This observation agrees with a skewed differentiation potential towards the myeloid lineage of aged hematopoietic stem cells (Geiger et al., 2013). The lines are only meant to represent a trend of increase or decrease with age. The change with age is most probably not linear.
Additional files
-
Supplementary file 1
(A) Best parameters from fitting the calculated distribution S19 to telomere length distributions of granulocytes from 10 adult persons (see Figure 6—figure supplement 1). Here p denotes the probability that a stem cell proliferation results in two additional stem cells, c is the initial telomere length in kbp and −Δcr/N0 corresponds to the loss of telomere repeats in bp/year. (B) Best parameters from fitting the calculated distribution S19 to telomere length distributions of lymphocytes from 28 adult persons (see Figure 6—figure supplement 2). (C) Best parameters from fitting the calculated distribution S19 to telomere length distributions of bone marrow samples from 28 adult persons (see Figure 6—figure supplement 3).
- https://doi.org/10.7554/eLife.08687.017
Download links
A two-part list of links to download the article, or parts of the article, in various formats.
Downloads (link to download the article as PDF)
Open citations (links to open the citations from this article in various online reference manager services)
Cite this article (links to download the citations from this article in formats compatible with various reference manager tools)
Reconstructing the in vivo dynamics of hematopoietic stem cells from telomere length distributions
eLife 4:e08687.
https://doi.org/10.7554/eLife.08687


