The GARP complex is required for cellular sphingolipid homeostasis
- Harvard T.H. Chan School of Public Health, United States
- Harvard Medical School, United States
- University of Southern Denmark, Denmark
- Yale School of Medicine, United States
- Broad Institute, United States
- Howard Hughes Medical Institute, Harvard T.H. Chan School of Public Health, United States
Figures
Figure 1 with 1 supplement
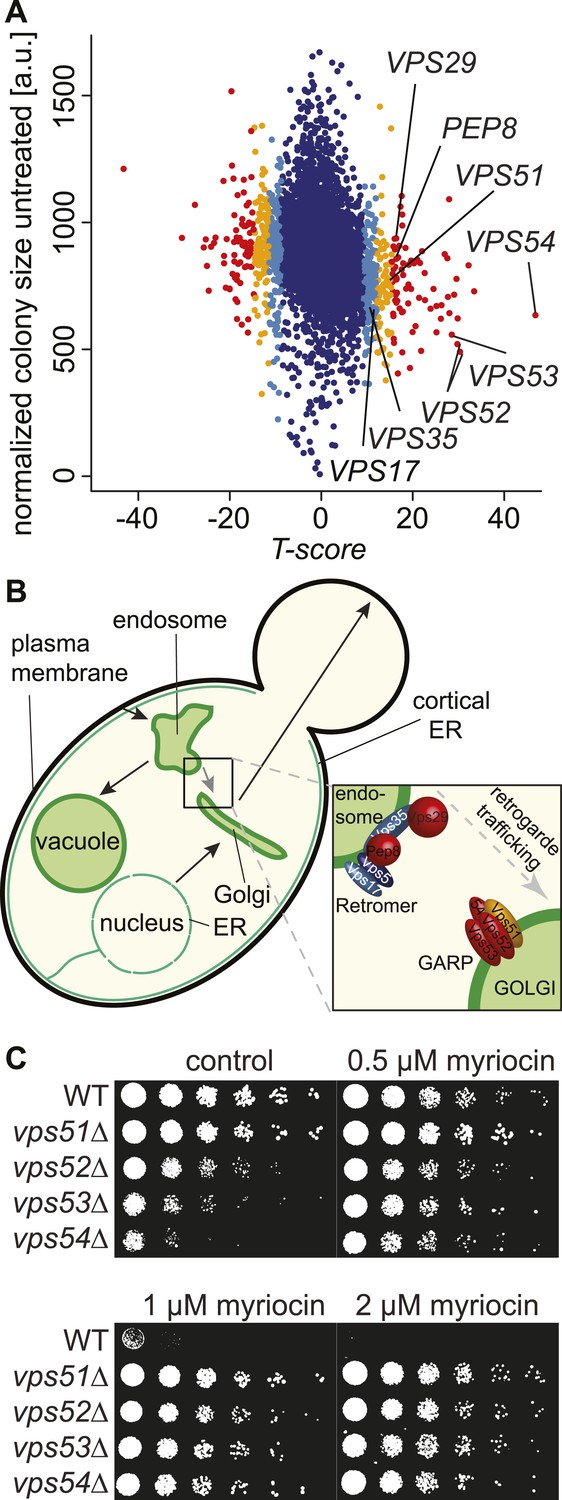
A chemical biology screen reveals the retrograde endosome to Golgi trafficking machinery as a key regulator of sphingolipid homeostasis.
(A) A chemical genetic screen for interactions with myriocin. Calculated T-scores are plotted against colony size on control plates. Genes are color-coded according to their significance score. Red p < 0.001, orange p < 0.01, light blue p < 0.05, blue p > 0.05. (B) A model for retromer- and Golgi-associated retrograde protein (GARP)-mediated retrograde endosome-to-Golgi trafficking. Subunits of the GARP complex and retromer identified in our screen are denoted. Genes are color coded according to their T-score. (C) Depletion of sphingolipids suppresses the growth defect of yeast strains harboring GARP mutations. Wild-type cells and vps51Δ, vps52Δ, vps53Δ, and vps54Δ mutant cells were spotted on control plates and plates containing increasing concentrations of myriocin, as indicated.
Figure 1—figure supplement 1
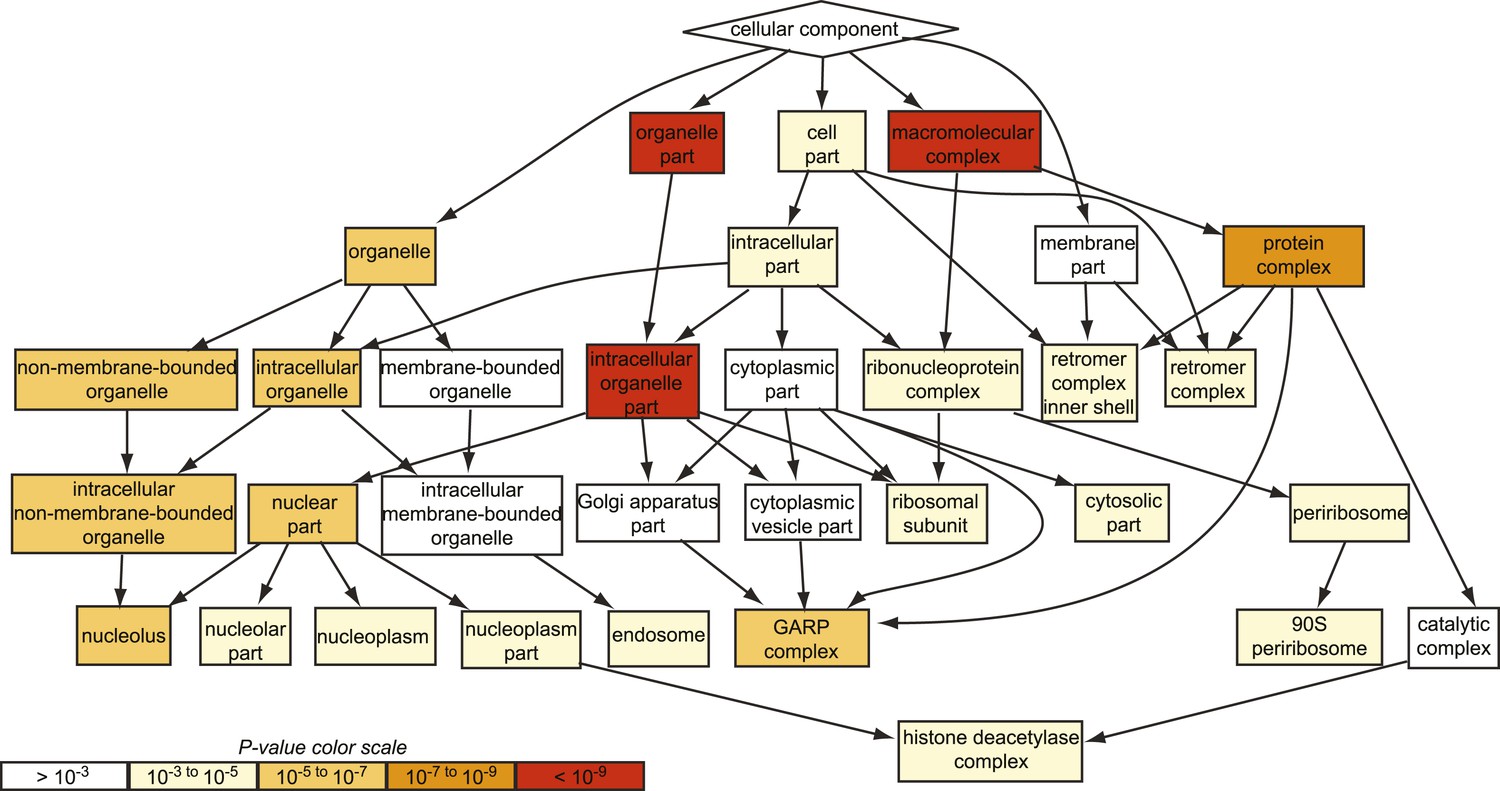
GO analysis of all suppressing mutants from the chemical genomic myriocin screen.
Gene ontology (GO) analysis of the hits obtained in our genome-wide chemical genetic screen is shown. Note, the GARP complex is strongly enriched among the suppressor mutants identified (p < 10−5), whereas the Golgi complex is not (p > 10−3).
Figure 2 with 2 supplements
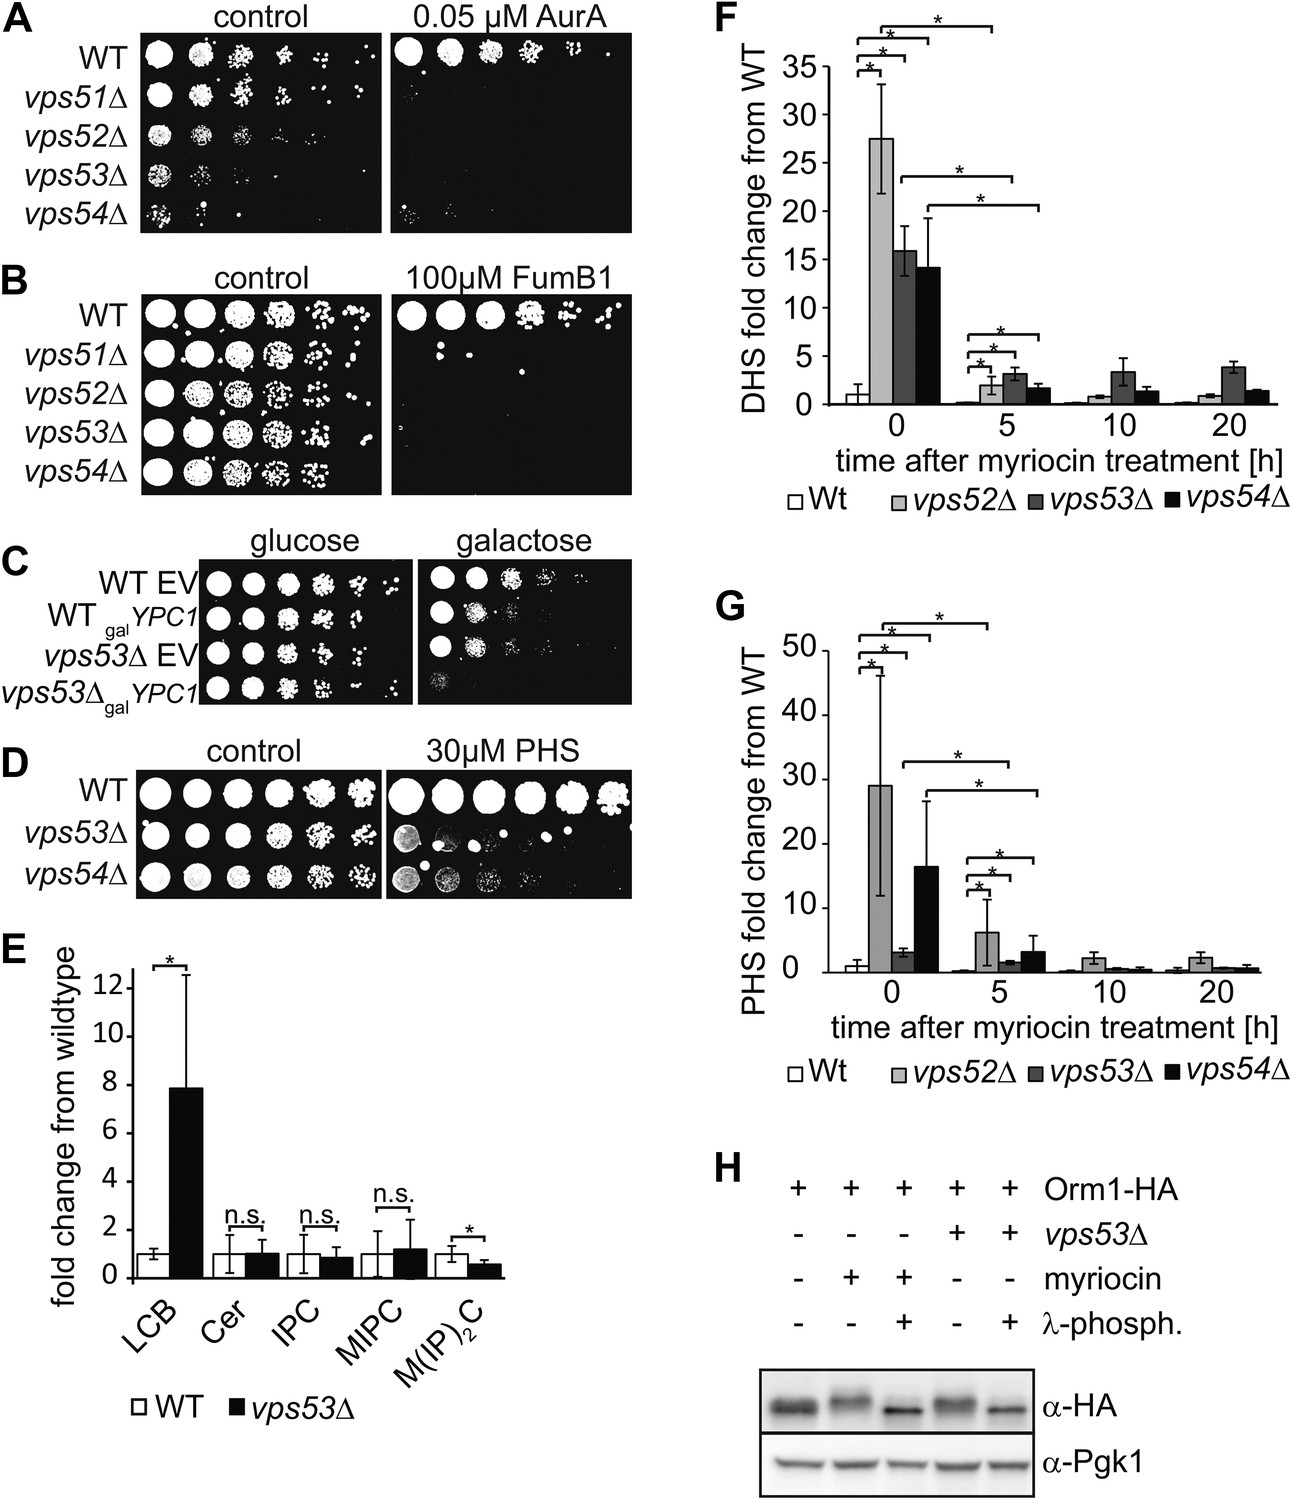
The disruption of the GARP complex leads to the accumulation of early sphingolipid synthesis intermediates.
(A, B, C) Blocking early steps of sphingolipid synthesis exacerbates GARP-associated growth defects. (A) GARP mutants are sensitive to IPC synthase inhibition. Wild-type, vps51Δ, vps52Δ, vps53Δ, and vps54Δ cells were spotted on control plates and plates containing 0.05 μM aureobasidin A. (B) GARP mutants are sensitive to ceramide synthase inhibition. Wild-type, vps51Δ, vps52Δ, vps53Δ, and vps54Δ cells were spotted on control plates and plates containing 100 μM fumonisin B1. (C) VPS53 mutants are sensitive to overexpression of the alkaline ceramidase Ypc1. Wild-type or vps53Δ cells harboring an empty plasmid or a plasmid encoding YPC1 under control of the GAL10 promoter were spotted on glucose- or galactose-containing plates. (D) GARP mutants are sensitive to high levels of long-chain bases, early sphingolipid intermediates. Wild-type, vps53Δ, and vps54Δ cells were spotted on control plates or plates containing 30 μM phytosphingosine (PHS). (E) GARP complex deficiency results in an accumulation of long-chain bases. The lipidomic analysis of sphingolipids from vps53Δ (black) compared with wild-type strains (white) is shown. LCB = long chain base; CER = ceramide; IPC = inositolphosphorylceramide; MIPC = mannosylinositolphosphorylceramide; M(IP)2C = mannose-(inositol-P)2-ceramide. *p < 0.05; n.s. not significant (F, G) Long-chain bases in GARP mutants are reduced upon myriocin treatment but remain elevated. The levels of (F) dihydrosphingosine (DHS) and (G) PHS from wild-type (white bars), vps52Δ (light gray bars), vps53Δ (dark gray bars), and vps54Δ cells (black bars) to myriocin treatment is plotted as fold change from wild-type. *p < 0.05; n.s. not significant (H) Orm1/2 proteins are hyperphosphorylated in vps53Δ mutants. Orm1-HA expressing wild-type or vps53Δ cells were analyzed by Western blotting against the HA tag or PGK1 as control. Wild-type cells were treated with 5 μM myriocin as indicated. Treatment of the cell lysates with λ-phosphatase as indicated.
Figure 2—figure supplement 1

Model of Sphingolipid metabolism.
(A) Schematic of sphingolipid synthesis is shown. ER resident enzymes are indicated in blue. Golgi resident enzymes are indicated in yellow. Enzymes with multiple localizations are indicated in gray. The steps of sphingolipid biosynthesis inhibited by myriocin, fumonisin B1, and aureobasidin A are indicated in red.
Figure 2—figure supplement 2
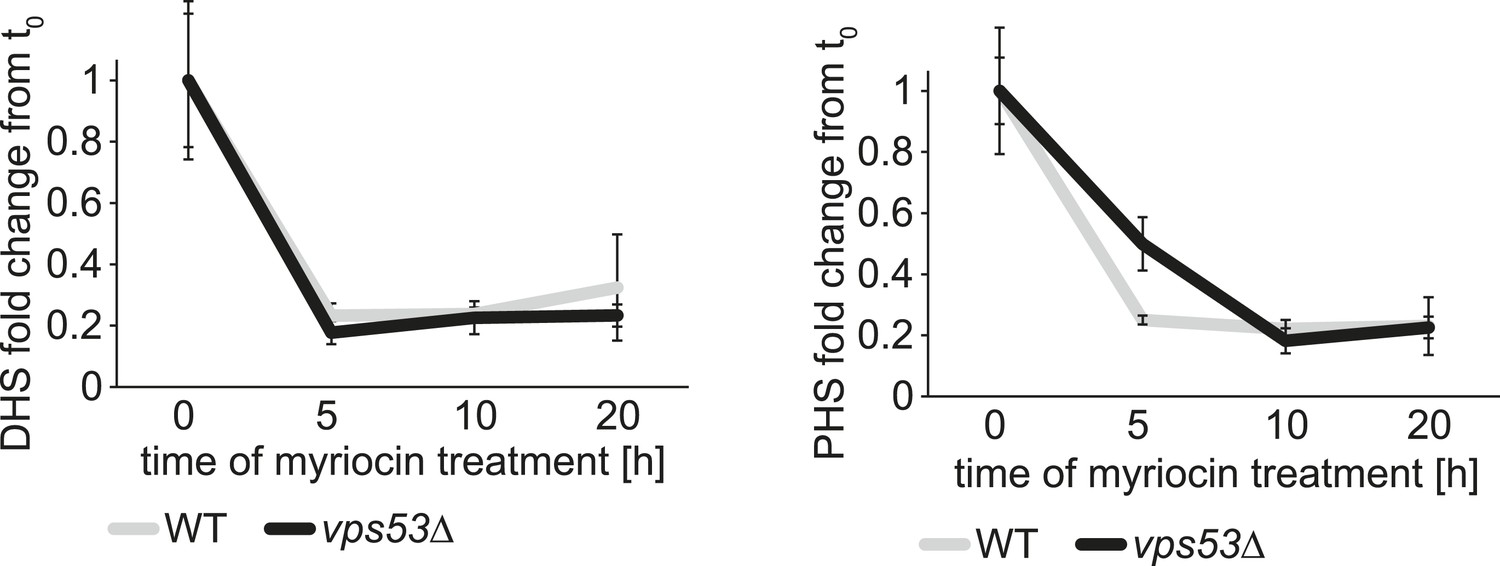
The rate of serine palimtoyl-transferase inhibition is similar in WT and vps53∆ cells.
Time-dependent response of DHS and PHS from wild-type (white lines) and vps53Δ cells (black lines) to myriocin treatment is plotted as fold change from time point 0.
Figure 3 with 1 supplement
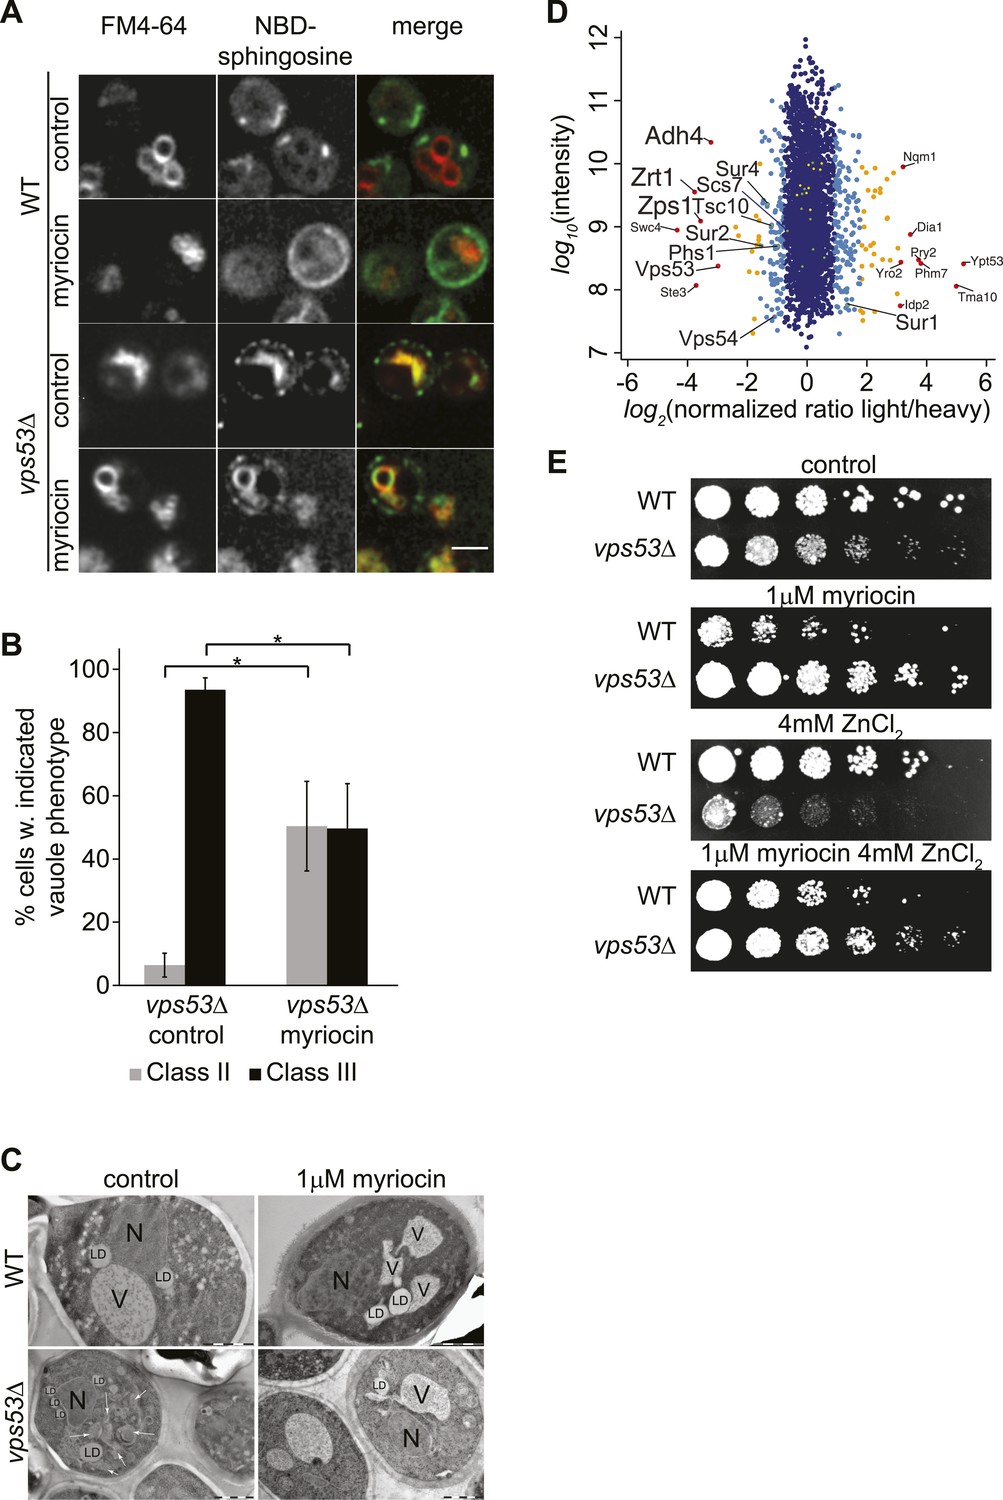
GARP mutants show altered vacuolar morphology and function.
(A) Sphingolipid recycling remains blocked upon myriocin treatment and sphingolipids accumulate in vacuoles. Wild-type cells (top panels), wild-type cells treated with myriocin (1 μM, 12hr), vps53Δ cells, or vps53Δ cells treated with myriocin (1 μM, 12hr). NBD-sphingosine, green. Vacuoles (FM4-64), red. Representative images are shown. Scale bar = 2.5 μm. (B, C) Inhibition of sphingolipid biosynthesis partially restores vacuolar morphology in GARP mutants. (B) Quantification of the vacuolar phenotypes in vps53Δ mutants, mock treated or treated with myriocin is shown (Classification, see Supplementary figure 2). (C) Thin-section EM analysis of high-pressure frozen wild-type or vps53Δ cells mock-treated (left panels) or treated with myriocin (12hr, 1 μM; right panels). Representative images are shown. N = nucleus; V = vacuole; LD = lipid droplet. White arrows indicate fragmented vacuoles. Scale bars = 1 μM (D). Three targets of zinc transcription factor Zap1 are down regulated in the GARP mutant vps53Δ. A proteomic analysis of vps53Δ and wild-type cells is shown. Protein intensities are plotted against light/heavy SILAC ratios. Significant outliers are colored in red (P < 1−11), orange (P < 1−4), or light blue (p < 0.05); other proteins are shown in dark blue. E) GARP mutant zinc sensitivity is rescued by myriocin treatment. Wild-type and vps53Δ cells were spotted on control plates or plates containing 1 μM myriocin, 4 mM zinc or 1 μM myriocin and 4 mM zinc.
Figure 3—figure supplement 1
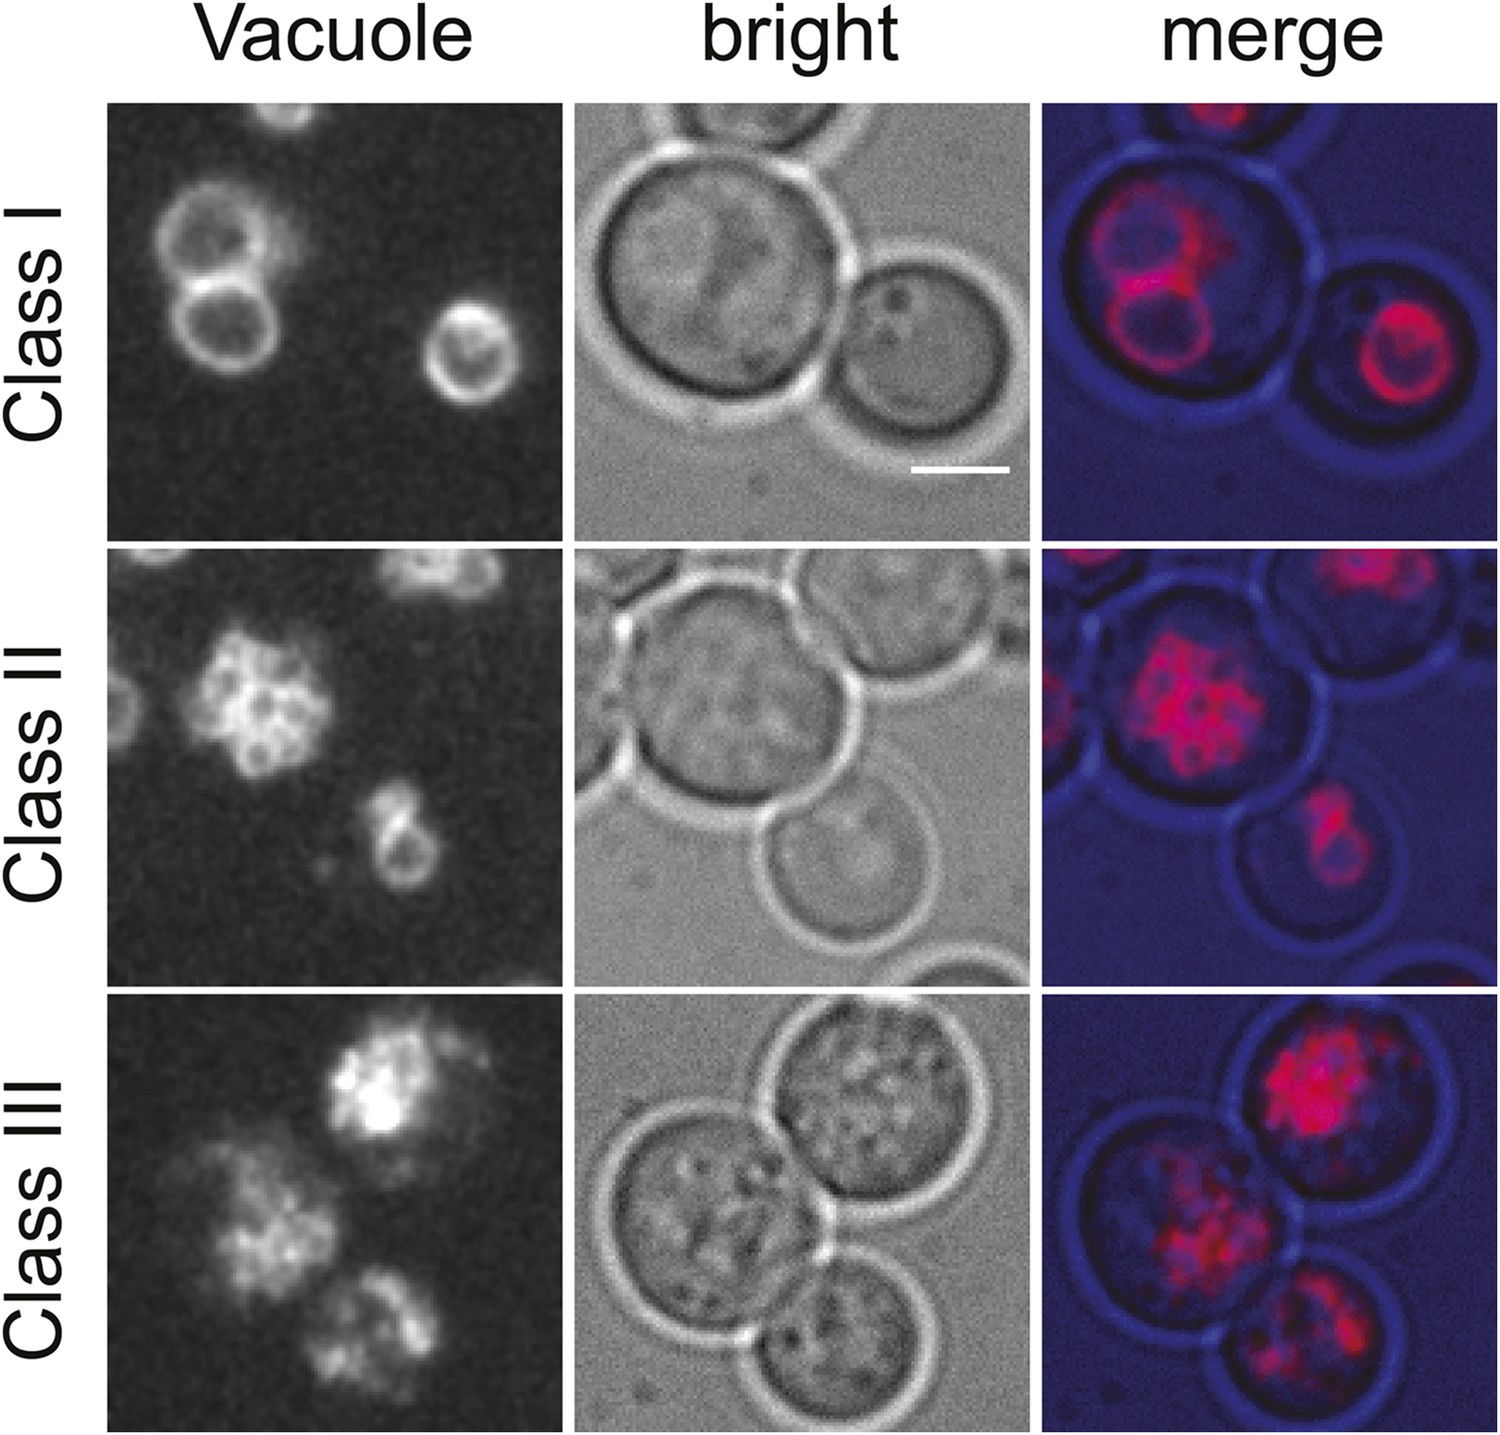
Classification of vacuolar phenotypes used for quantification.
Vacuoles labeled with Vma1-mars (left panels), bright field images (middle panels), and merged images (right panels) are shown. Phenotypes were classified based on severity. Cells with 1–3 round vacuoles were assigned as class I (top panels), cells with multiple small round vacuoles were assigned as class II (middle panels), and cells with a high degree of vacuolar fragmentation and no round vacuolar structures visible were assigned as class 3 (lower panels). Scale bar = 2.5 μM.
Figure 4 with 1 supplement

The disruption of the GARP complex alters sterol distribution in yeast.
(A) Intracellular sterols accumulate in the GARP mutants vps53Δ and vps54Δ. Wild-type (left panels), vps53Δ cells (middle panels), and vps54Δ cell (right panels) treated with methanol (top panels) or myriocin (lower panels) were stained with filipin and analyzed by epifluorescence microscopy. Representative images are shown. Scale bar = 2.5 μm. (B) Neutral lipids accumulate in the GARP mutant vps53Δ. Lipidomic analysis of neutral lipids isolated from vps53Δ (black) expressed in fold change from the wild-type (white). ERG = ergosterol; EE = ergosterol ester; DAG = diacylglycerol, TAG = triacylglycerol. *p < 0.005; n.s. not significant. (C, D) Lipid droplets accumulate in the GARP mutant vps53Δ. Lipid droplets marked by Faa4-GFP. (C) Representative confocal midsections of wild-type (left) or vps53Δ cells are shown. Scale bar = 2.5 μm. (D) Quantification of (C). The number of lipid droplets per cell compared to wild-type cells (white bar) is shown. n = 100 cells. *p < 0.001; n.s. not significant (E) Components of the GARP complex genetically interact with sterol synthesis genes. Histogram of S-scores for VPS52 extracted from an EMAP (Hoppins et al., 2011) is shown. (F) Model of ergosterol metabolism. Genes are color-coded according to correlation coefficient with the GARP subunit VPS52. Positive-correlated genes are indicated in yellow; anti-correlated genes are indicated in blue.
Figure 4—figure supplement 1

Components of the GARP complex genetically interact with ergosterol metabolism genes in yeast.
Tetrad analysis of vps52Δ mutants crossed with erg3Δ mutants is shown.
Figure 5 with 1 supplement
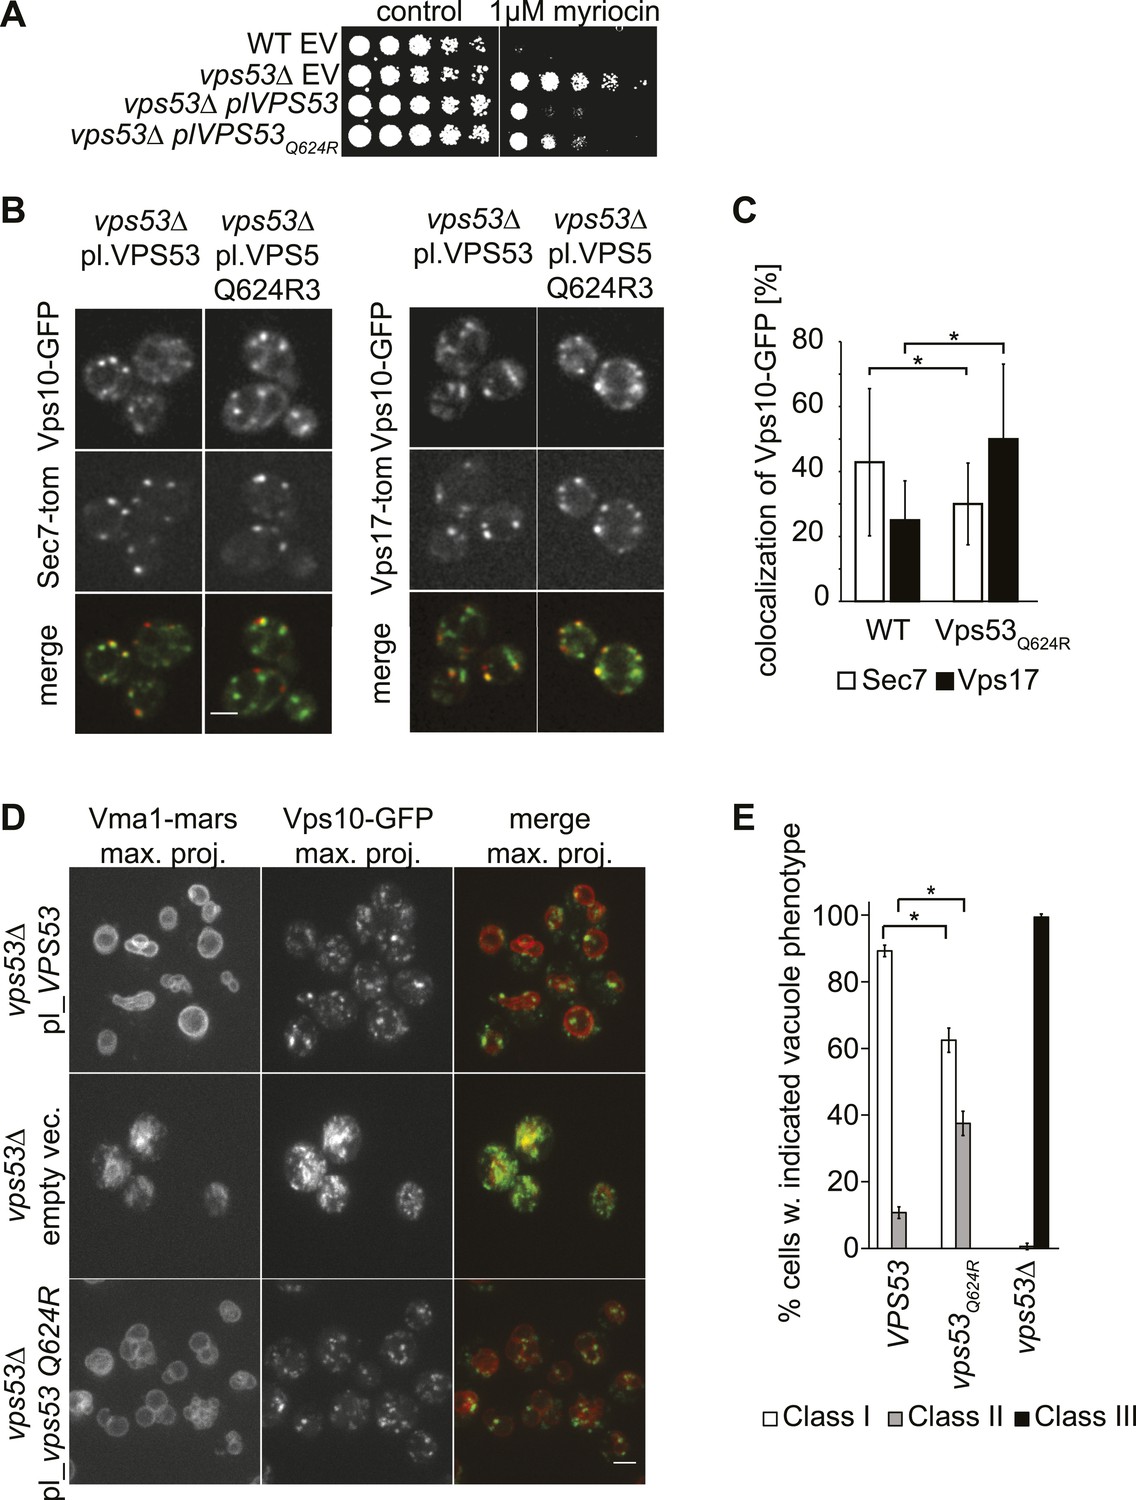
A PCCA2-causing GARP complex mutation is a partial loss of function allele.
(A) A mutation analogous to the VPS53 allele causing progressive cerebello-cerebral atrophy type 2 (PCCA2) in humans is partially resistant to sphingolipid biosynthesis inhibition induced by myriocin. Wild-type cells harboring an empty plasmid and vps53Δ cells harboring an empty plasmid, a plasmid expressing Vps53, or a plasmid expressing the mutant vps53 Q624R were spotted on myriocin-containing (right) plates or control plates containing methanol (left) (B) Endosome-Golgi trafficking is partially impaired in yeast cells expressing the analogous PCCA2-causing mutation vps53 Q624R. The GFP-tagged CPY receptor Vps10-GFP (top panels left and right) was co-expressed with either Sec7-tomato (Sec7-tom; middle left panels) or Vps17-tomato (Vps17-tom; middle right panels) in wild-type and vps53 Q624R mutant cells. Representative confocal midsections are shown; scale bar, 2.5 µm. (C) The CPY receptor Vps10 accumulates in vps53 Q624R endosomes. Quantification of the distribution of Vps10-GFP between the Sec7-decorated Golgi (white bars) and retromer-decorated endosomes (black bars) in wild-type and vps53 Q624R cells. *p < 0.005; n.s. not significant. (D) Mutations in the GARP complex cause vacuolar fragmentation. Maximum projections of vacuoles marked with RFPmars-tagged V-ATPase subunit Vma1 (left panels) and the GFP-tagged CPY sorting receptor Vps10 (middle panels) in vps53Δ cells harboring a plasmid expressing Vps53 (top panels), an empty plasmid (middle panels) or a plasmid expressing a vps53 Q624R mutant (lower panels) are shown; scale bar = 2.5 µm. (E) Quantification of (D). Cells with class I (white bars), class II (gray bars), and class III (black bars) vacuoles were counted and plotted as percentage of the total number. n = 50. *p < 0.005; n.s. not significant. For phenotypic classification, see Figure 3—figure supplement 1.
Figure 5—figure supplement 1
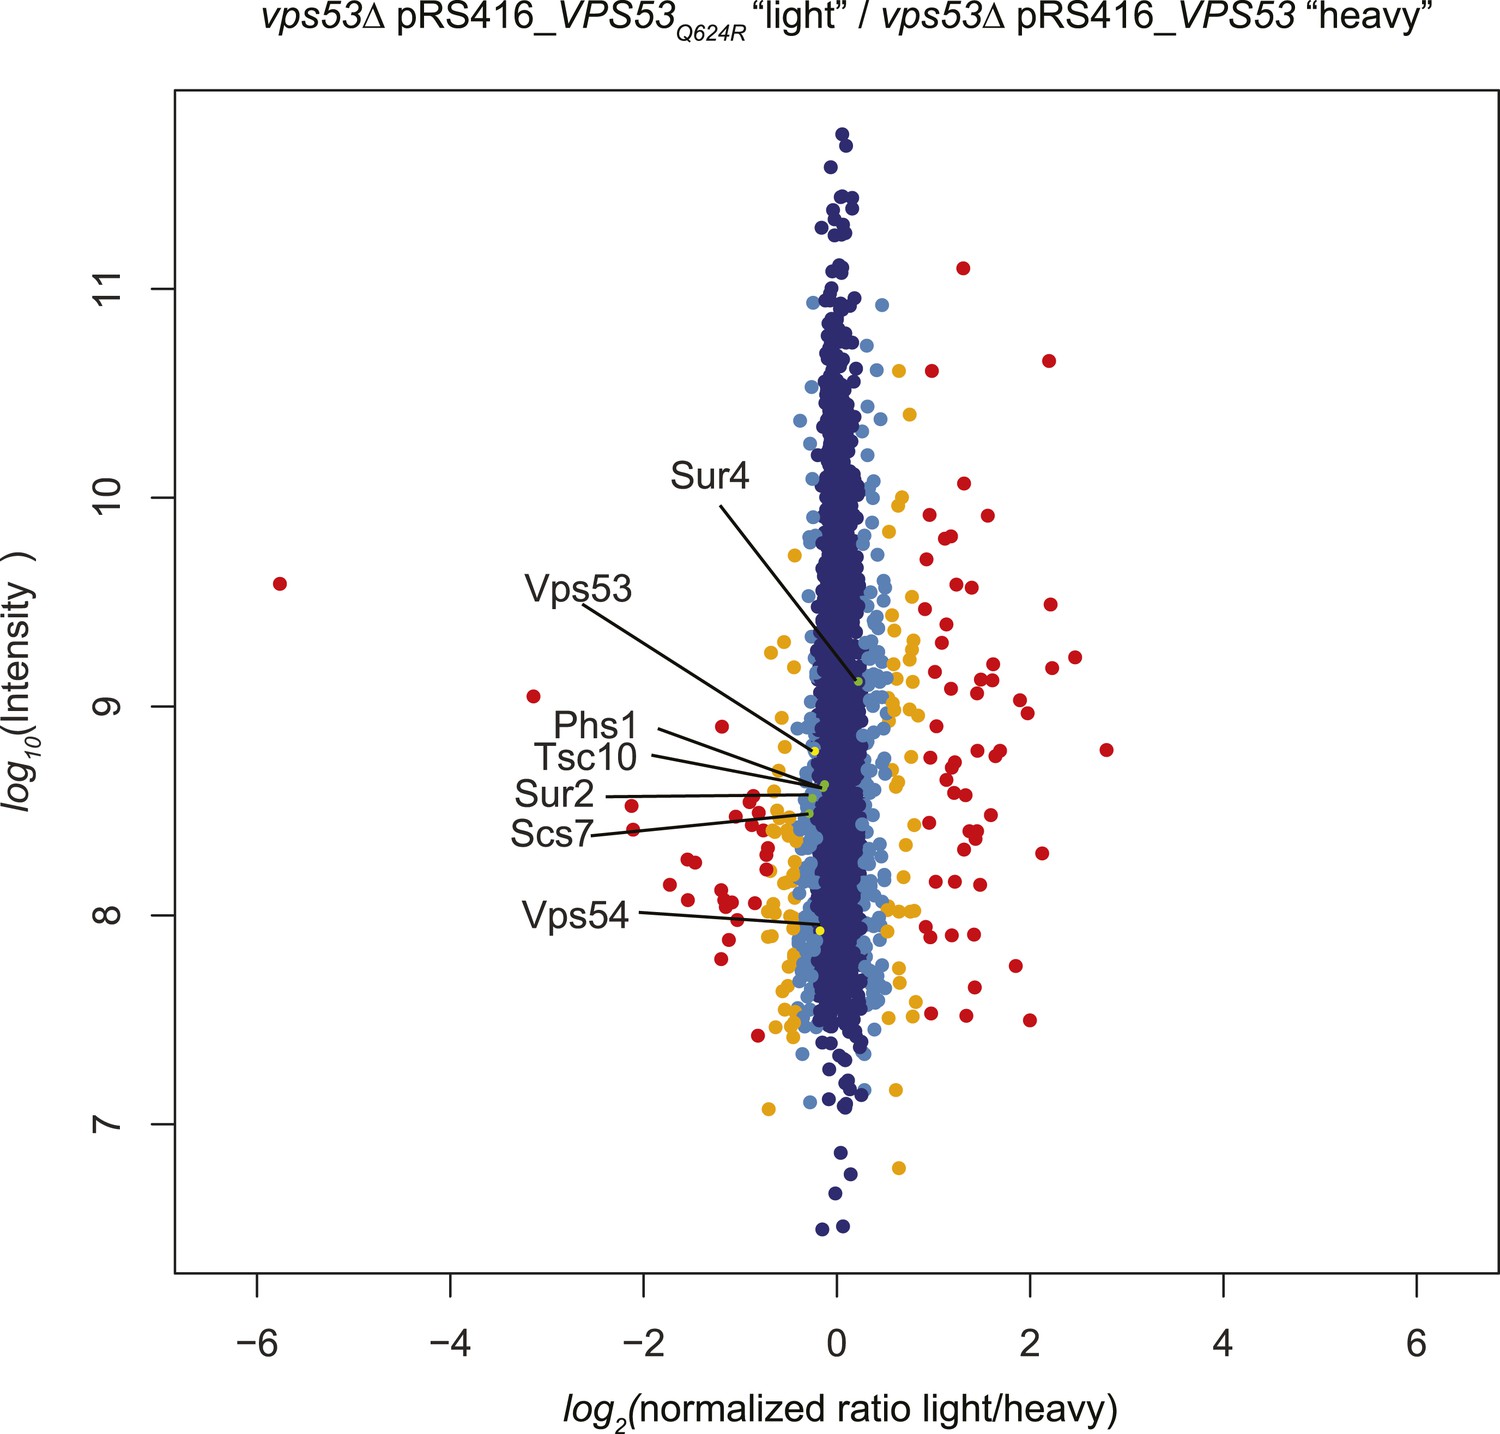
A GARP complex mutation analogous to the VPS53 allele causing PCCA2 vps53 Q624R does not impact protein stability.
vps53Δ cells harboring a plasmid encoding vps53 Q624R or wild-type Vps53 were labeled with either light or heavy L-lysine. Protein intensities are plotted against light/heavy SILAC ratios. Significant outliers are colored in red (P < 1−11), orange (P < 1−4), or light blue (p < 0.05); other proteins are shown in dark blue. Note, peptides from wild-type Vps53 or vps53 Q624R were present in similar abundance.
Figure 6 with 2 supplements
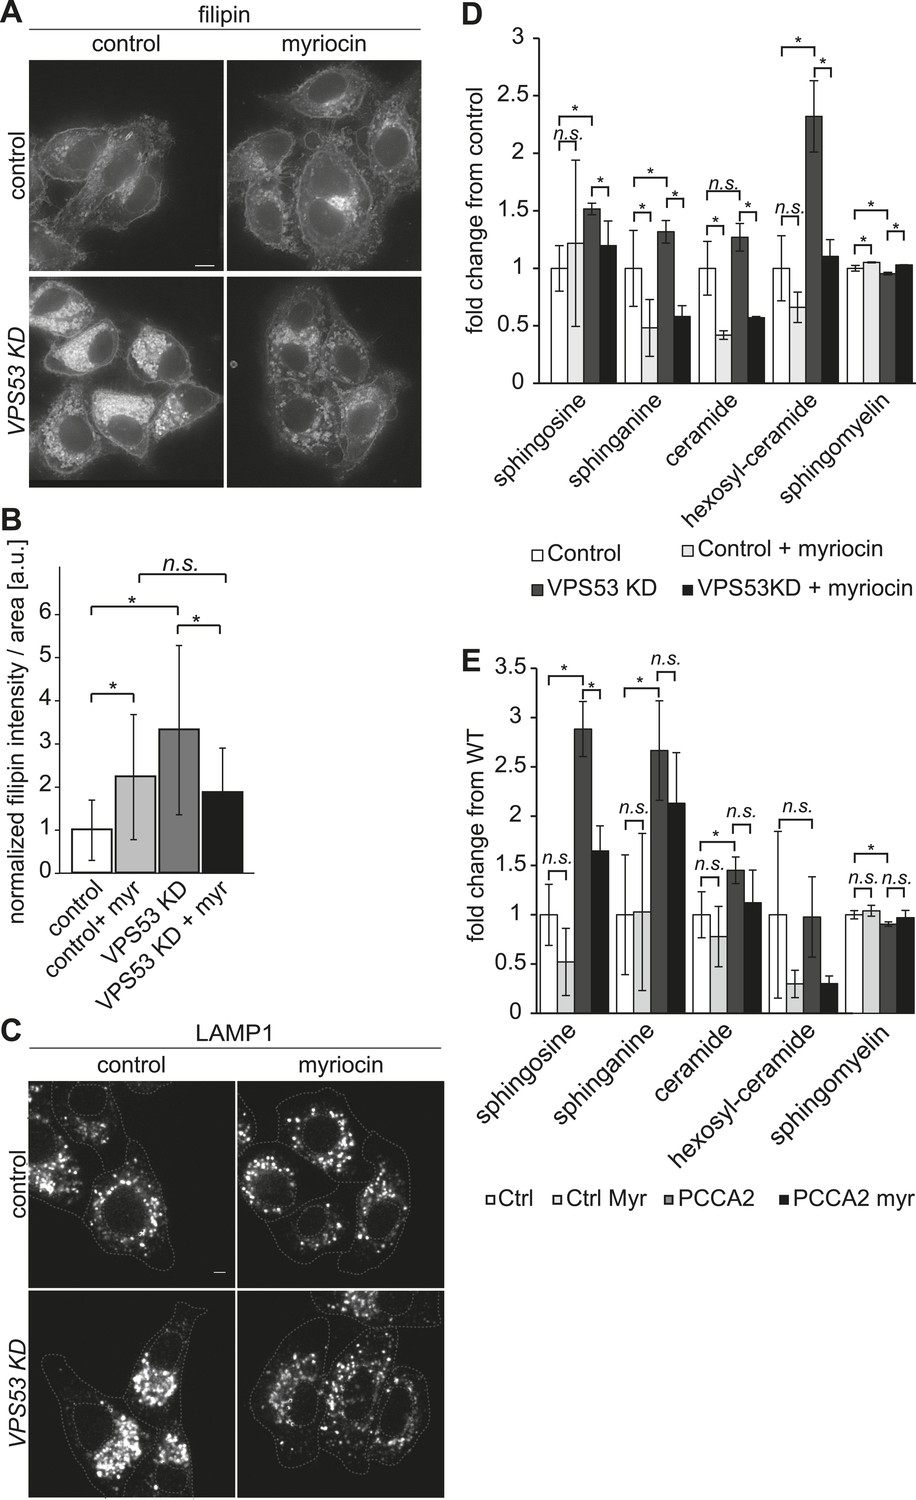
The depletion of sphingolipid levels reduced lysosome clustering and sterol accumulation due to GARP complex deficiency in HeLa cells.
(A, B) Myriocin treatment reduced build-up of free cholesterol due to GARP complex deficiency. (A) Filipin staining of unesterified cholesterol in control (top panels) or Vps53 knock-down (lower panels) in HeLa cells treated with 1 μM myriocin for 12 hr (right panels) or DMSO as a control (left panels). Representative images are shown. Scale bar = 5 μm. (B) Quantification of the average free cholesterol filipin intensity/cell normalized to control cells. n = 32. *p < 0.0005; n.s. not significant. (C) Myriocin treatment partially restored intracellular distribution of lysosomes in the GARP KD. Control cells (top panels) or Vps53-KD cells (lower panels) were treated with 1 μM myriocin for 12 hr (right panels) or DMSO as a control (left panels) and stained with an antibody against the lysosomal protein LAMP-1. Representative confocal midsections are shown; scale bar = 2.5 μm. (D) Myriocin treatment reduced accumulations of early sphingolipid intermediates due to GARP complex deficiency. Lipidomic analysis of mock-treated HeLa control cells (white bars), myriocin-treated control cells (light gray bars), mock-treated VPS53 KD cells (dark gray bars), or myriocin-treated VPS53 KD cells (black bars) is shown. Levels are plotted as fold change from that of mock-treated control cells. Error bars represent the average of three independent experiments. *p < 0.05; n.s. not significant. (E) Lipidomic analysis of mock-treated control fibroblasts (white bars), myriocin-treated control fibroblasts (light gray bars), mock-treated PCCA2 patient fibroblasts (dark gray bars), or myriocin-treated PCCA2 patient fibroblasts (black bars) is shown. Levels are plotted as fold change from mock-treated control fibroblasts. Error bars represent the average of six independent experiments. *p < 0.05; n.s. not significant.
Figure 6—figure supplement 1
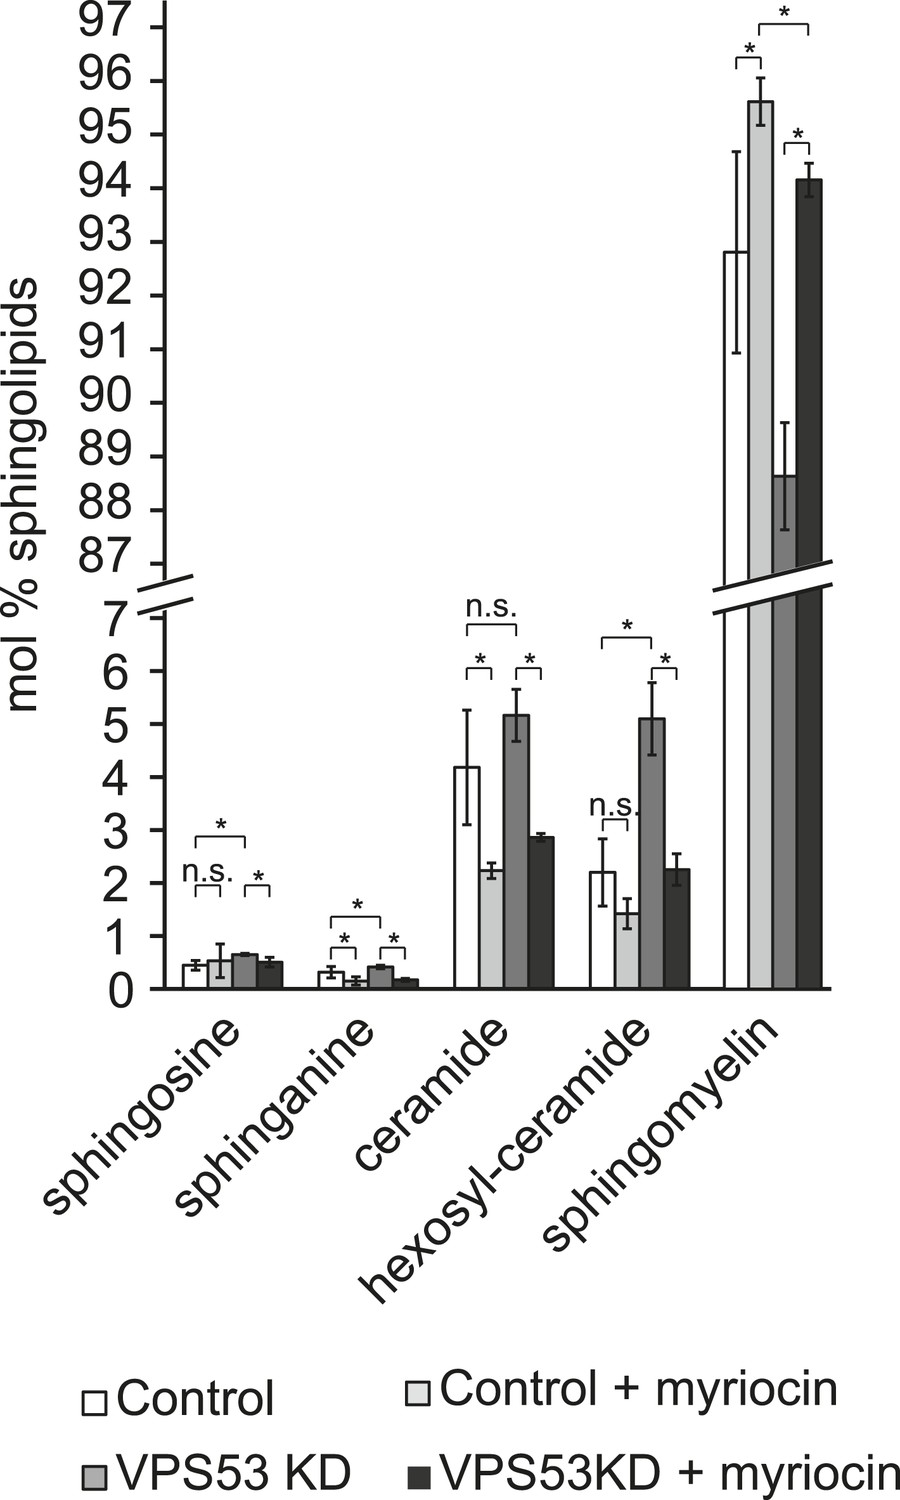
Myriocin treatment reduced accumulations of early sphingolipid intermediates due to GARP complex deficiency.
Lipidomic analysis of mock-treated HeLa control cells (white bars), myriocin-treated control cells (light gray bars), mock-treated VPS53 KD cells (dark gray bars), and myriocin-treated VPS53 KD cells (black bars) is shown. Levels are plotted as mole percent. Error bars represent the average of three independent experiments. *p < 0.05; n.s. not significant.
Figure 6—figure supplement 2

LAMP1 expression in VPS53 knock-down HeLa cells is not altered.
HeLa control cells and HeLa VPS53 KD cells were analyzed by Western blotting against VPS53, LAMP1, or tubulin as control.
Additional files
-
Supplementary file 1
List of all yeast strains used in this study.
- https://doi.org/10.7554/eLife.08712.018
-
Supplementary file 2
List of all plasmids used in this study.
- https://doi.org/10.7554/eLife.08712.019
-
Supplementary file 3
List of all hits identified in the chemical genomic screen.
- https://doi.org/10.7554/eLife.08712.020
-
Supplementary file 4
Phenotypes of different trafficking complexes identified in the chemical genetic screen.
- https://doi.org/10.7554/eLife.08712.021
Download links
A two-part list of links to download the article, or parts of the article, in various formats.
Downloads (link to download the article as PDF)
Open citations (links to open the citations from this article in various online reference manager services)
Cite this article (links to download the citations from this article in formats compatible with various reference manager tools)
The GARP complex is required for cellular sphingolipid homeostasis
eLife 4:e08712.
https://doi.org/10.7554/eLife.08712


