Intrinsic sequence specificity of the Cas1 integrase directs new spacer acquisition
- University of St Andrews, United Kingdom
- University of Duisburg-Essen, Germany
- University of Nottingham, United Kingdom
Figures
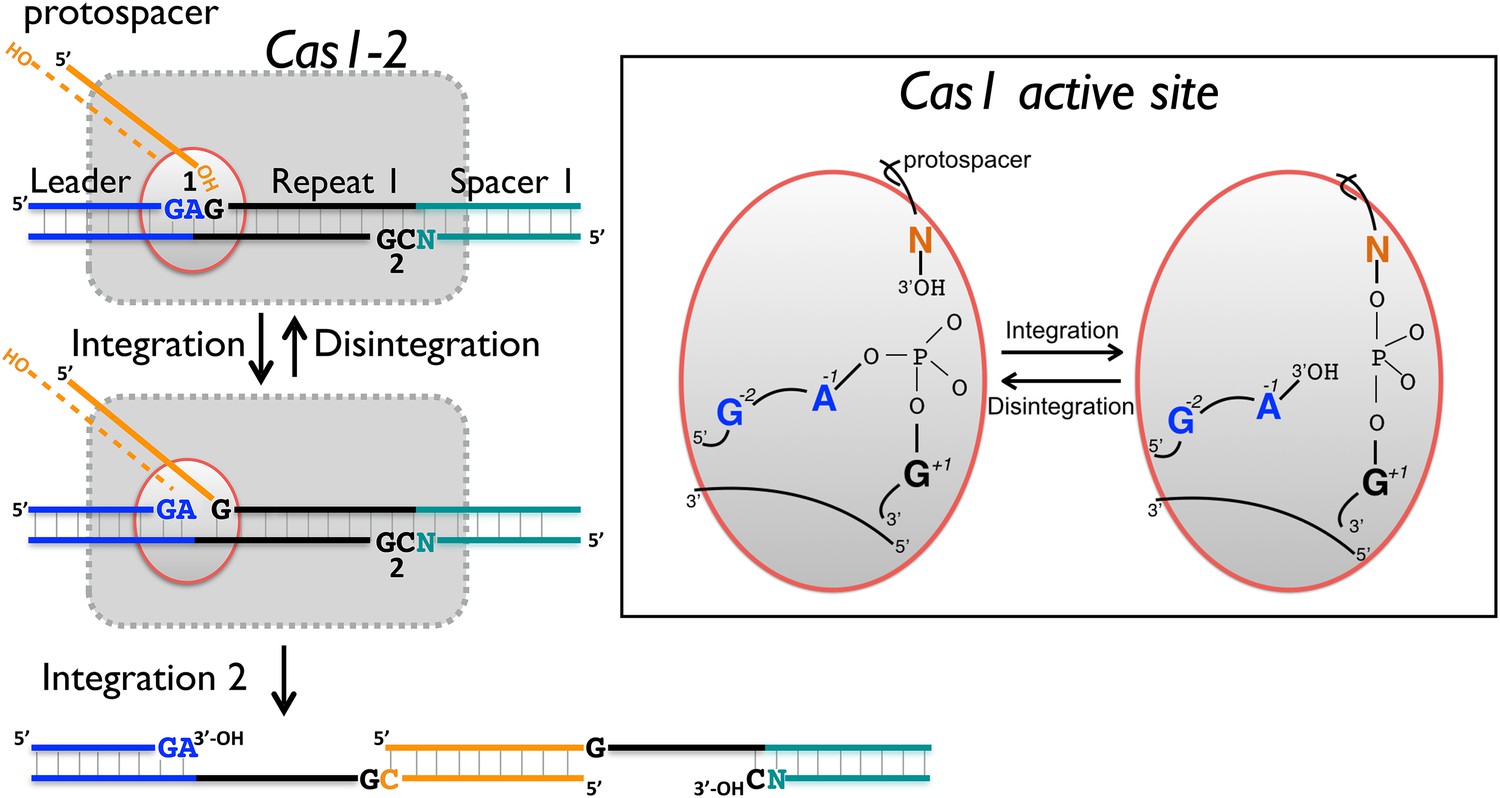
Figure 1
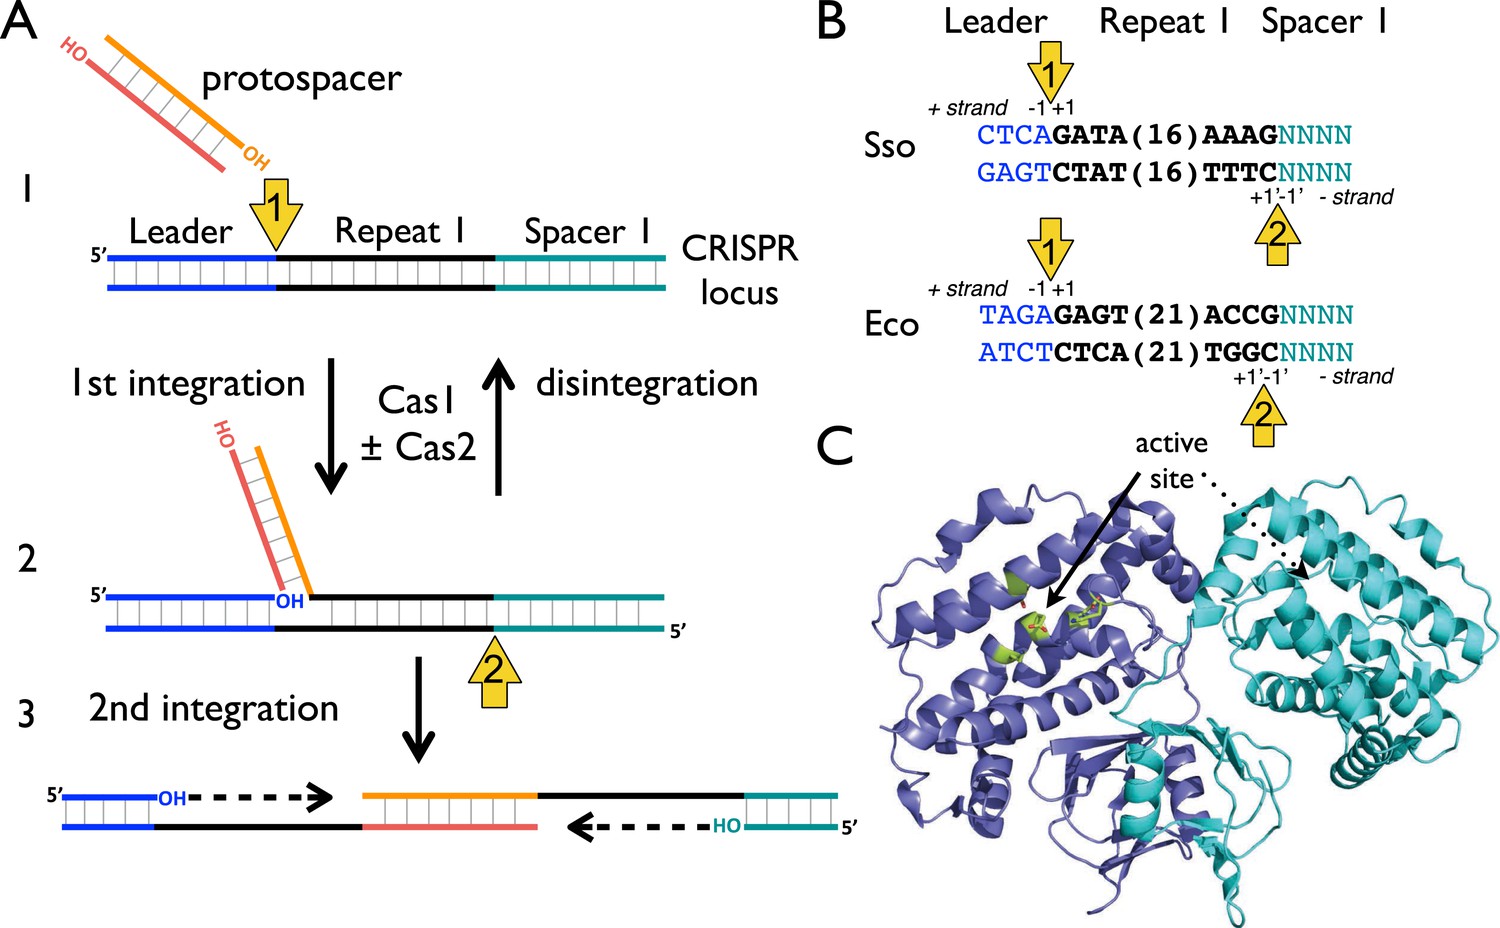
CRISPR spacer acquisition and Cas1.
(A, 1) The 3′-end of an incoming protospacer attacks the chromosomal CRISPR locus at the boundary between the leader sequence and repeat 1. A trans-esterification (TES) reaction (yellow arrow 1) catalyzed by Cas1 joins the protospacer to the 5′ end of repeat 1. For many integrases a (reverse) disintegration reaction can be observed in vitro. (2) Another TES reaction (yellow arrow 2) joins the other strand of the protospacer to the 5′ end of repeat 1 on the bottom (minus) strand, resulting in the formation of a gapped DNA duplex. (3) The gapped duplex is repaired by the host cell DNA replication machinery, resulting in the addition of a new spacer at position 1 and replication of CRISPR repeat 1. (B) Sequences flanking the two TES reaction sites at repeat 1 in Sulfolobus solfataricus and Escherichia coli are shown. The leader is in blue, repeat in black and spacer 1 in teal. The number of central nucleotides of the repeat omitted from the sequence is shown in parentheses. (C) Structure of Cas1 from Pyrococcus horikoshii (PDB 4WJ0) with subunits coloured blue and cyan, showing the dimeric ‘butterfly’ conformation with the active site residues highlighted in green.
Figure 2
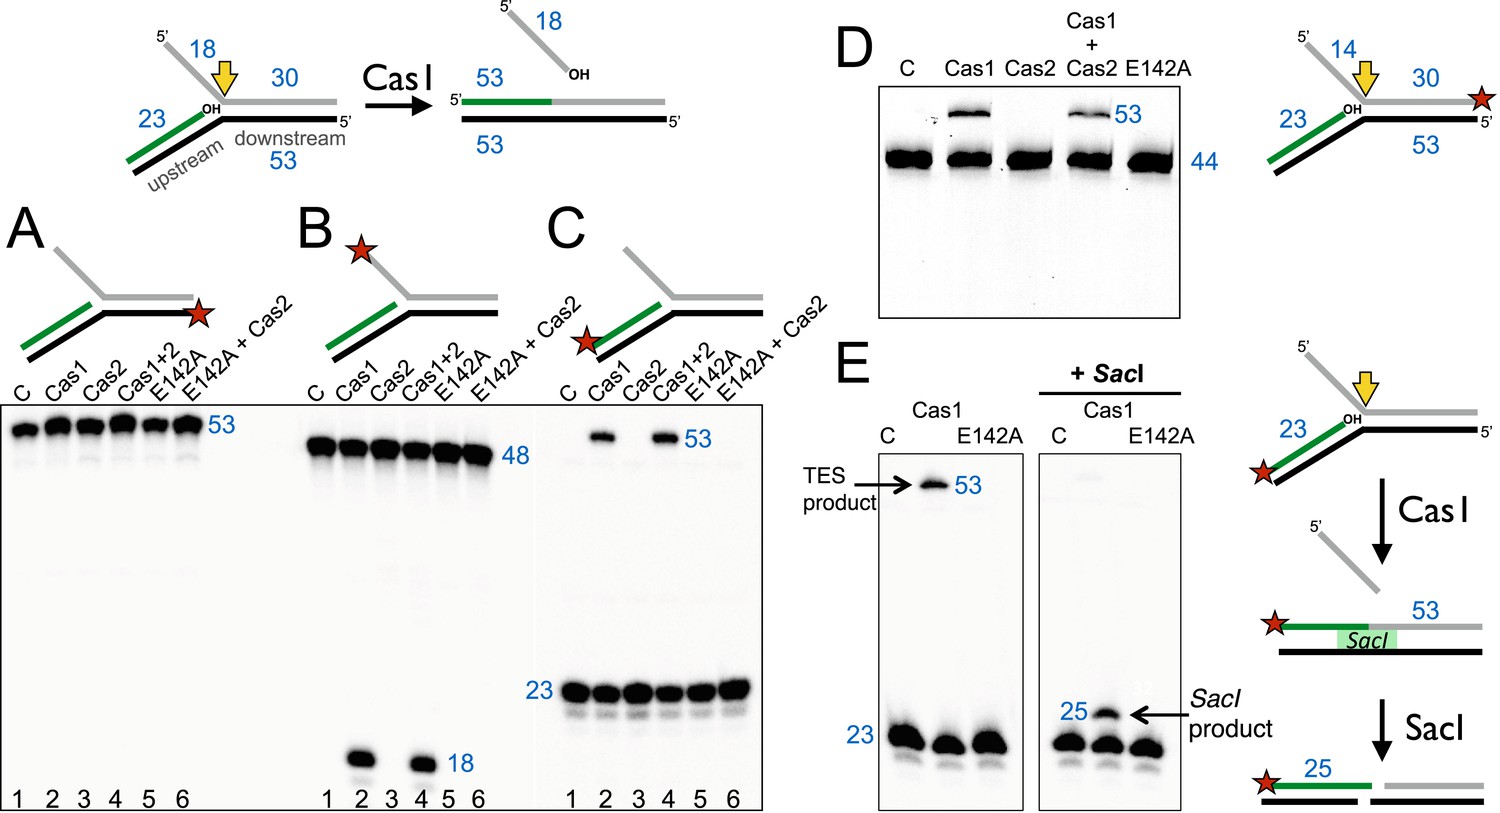
Disintegration of a branched DNA substrate by SsoCas1.
Denaturing gel electrophoresis was used to analyse the products generated by SsoCas1 with a branched DNA substrate (Substrate 1). The 5′ flap (18 nt) was released when the phosphodiester backbone was attacked by the 3′-hydroxyl group at the branch point. The reaction required active Cas1 and was independent of Cas2. DNA lengths are shown in blue (nt). The TES site is indicated with a yellow arrow and the labelled strand with a red star. (A) Shows reactions with the continuous strand (black) labelled; (B) with the flap (grey) strand labelled and (C) with the upstream (green) strand labelled, each on the 5′ end. Lanes: 1, control with no added protein; 2, WT Cas1; 3, Cas2; 4, Cas1 + Cas2; 5, Cas1 E142A variant; 6, E142A Cas1 + Cas2. (D) The 5′-flap strand was labelled on the 3′ end with a fluorescein moiety, and the flap reduced to 14 nt (Substrate 1-FAM). Cas1 catalyses the TES reaction generating a 53 nt labelled strand. Lane C: control incubation in absence of Cas1. (E) TES reactions were carried out with SsoCas1, or the E142A active site mutant, on a fork substrate containing a nicked SacI restriction site spanning the branch point (SacI substrate). A TES product of 53 nucleotides is visible in lane 2 containing Cas1. The right-hand panel shows the effect of adding SacI restriction enzyme after the TES reaction. The TES product is no longer visible, but a shorter product of 25 nucleotides is present indicating regeneration of the SacI recognition sequence by the TES reaction.
Figure 3
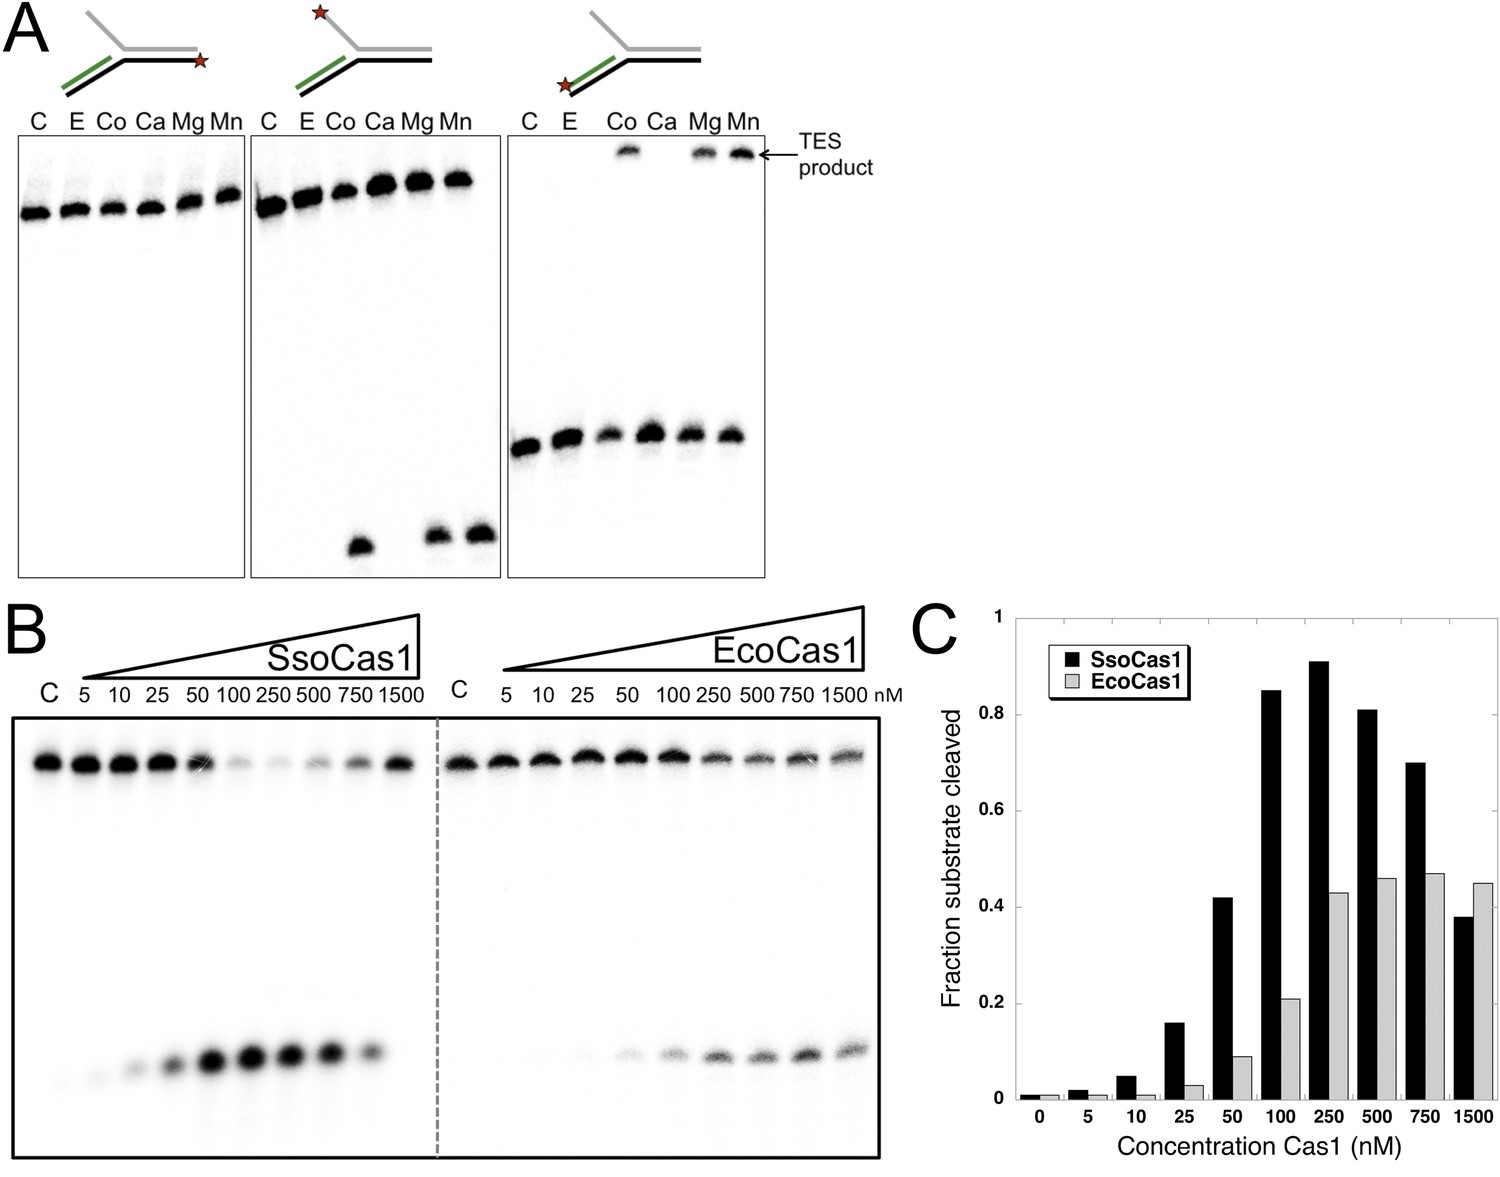
TES activity of E. coli and S. solfataricus Cas1.
(A) E. coli Cas1 also catalyses an efficient metal dependent disintegration reaction. TES reactions were carried out under standard conditions, using Substrate 3 and varying the divalent metal ion as indicated. EcoCas1 showed robust TES activity in the presence of cobalt, magnesium and manganese. Each of the three strands of the substrate was labelled individually as for Figure 2 (5′ label indicated by a star). Lanes were: c, substrate alone; substrate incubated with Cas1 and 5 mM of E, EDTA; Co, cobalt chloride; Ca, calcium chloride; Mg, magnesium chloride; Mn, manganese chloride for 30 min at 37°C. (B) Concentration dependence of Cas1 TES activity. Substrate 3 (50 nM) was incubated with the indicated concentration of Sso or EcoCas1 for 30 min under standard assay conditions and the reactants were analysed by denaturing gel electrophoresis and phosphorimaging. SsoCas1 showed maximal activity at 250 nM, representing a fivefold molar excess of enzyme over substrate, with a decline in activity above 500 nM enzyme. EcoCas1 had maximal activity that plateaued above 250 nM enzyme. (C) Quantification of the data (raw data provided in Figure 3—source data 1). These data are representative of duplicate experiments.
-
Figure 3—source data 1
Concentration Cas1.
- https://doi.org/10.7554/eLife.08716.006
Figure 4
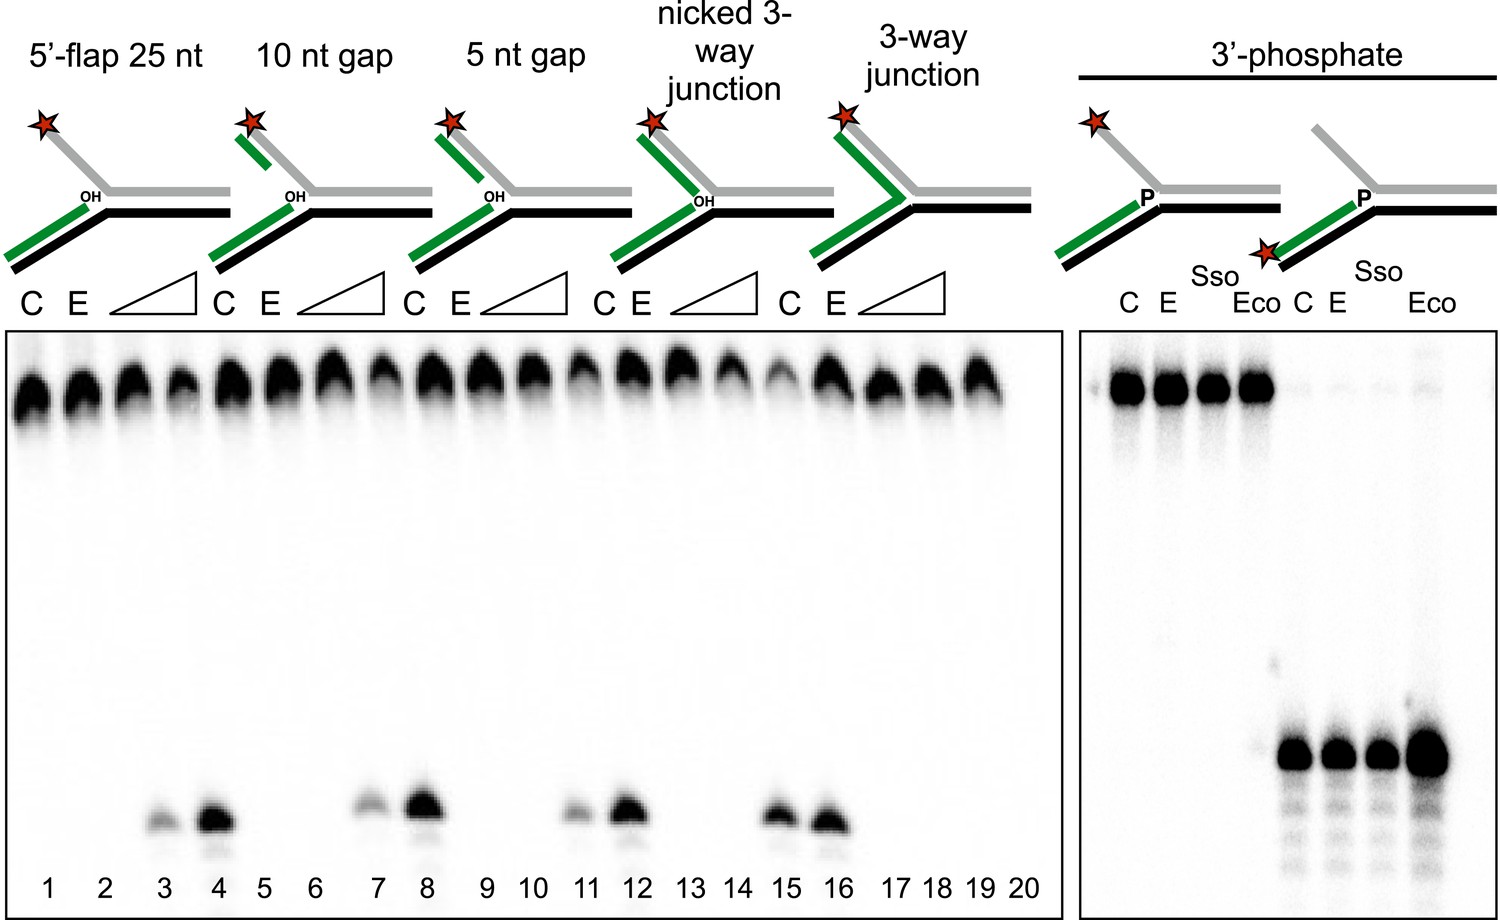
Importance of flap and 3′ terminus structure.
The importance of the released 25 nt 5′-flap structure was investigated by varying the length of duplex DNA in that arm from 0 (canonical 5′-flap) to a full 25 bp (nicked 3-way junction) (left hand panel, all based on substrate 19). All supported robust disintegration activity by SsoCas1. An intact Y- junction did not support TES activity. Lanes: C, substrate alone (1, 5, 9, 13, 17); E, SsoCas1 E142A variant 30 min incubation (2, 6, 10, 14, 18); incubation with wild-type SsoCas1 for 10 and 30 min (other lanes). The right hand panel shows the effect of replacing the attacking 3′-hydroxyl moiety at the branch point with a phosphate group (3′ phos substrate) no TES or nuclease activity was observed for either Sso or EcoCas1. C, substrate alone; E, SsoCas1 E142A variant.
Figure 5

Sequence specificity of the disintegration reaction at the +1 position.
The nucleotide at the acceptor (+1) position was varied systematically to assess the sequence dependence of the disintegration reaction carried out by Cas1 from S. solfataricus (A, B) and E. coli (C, D) (Substrates 3, 6, 7, 8). In the gels on the left (A, C) each substrate was incubated with Cas1 for 1, 2, 3, 5, 10, 15, 20 and 30 min in reaction buffer prior to electrophoresis to separate the cleaved 5′-flap from the intact substrate. C–control with no Cas1 added. The plots on the right (B, D) show quantification of these assays. Data points represent the means of triplicate experiments with standard errors shown (raw data provided in Figure 5—source data 1 and Figure 5—source data 2). The data were fitted to an exponential equation, as described in the ‘Materials and methods’, and for EcoCas1 a variable floating end point was included to allow fitting as the reaction did not go to completion. The effect of Cas2 (150 nM) on EcoCas1 (150 nM) sequence specificity for substrates (50 nM) varying at position +1 (substrates 3, 6, 7, 8) was also tested (E). The second panel from the right is a composite image from two phosphorimages of the same time course as indicated by a black line.
-
Figure 5—source data 1
Nucleotide at +1 position.
- https://doi.org/10.7554/eLife.08716.009
-
Figure 5—source data 2
Nucleotide at +1 position.
- https://doi.org/10.7554/eLife.08716.010
Figure 6
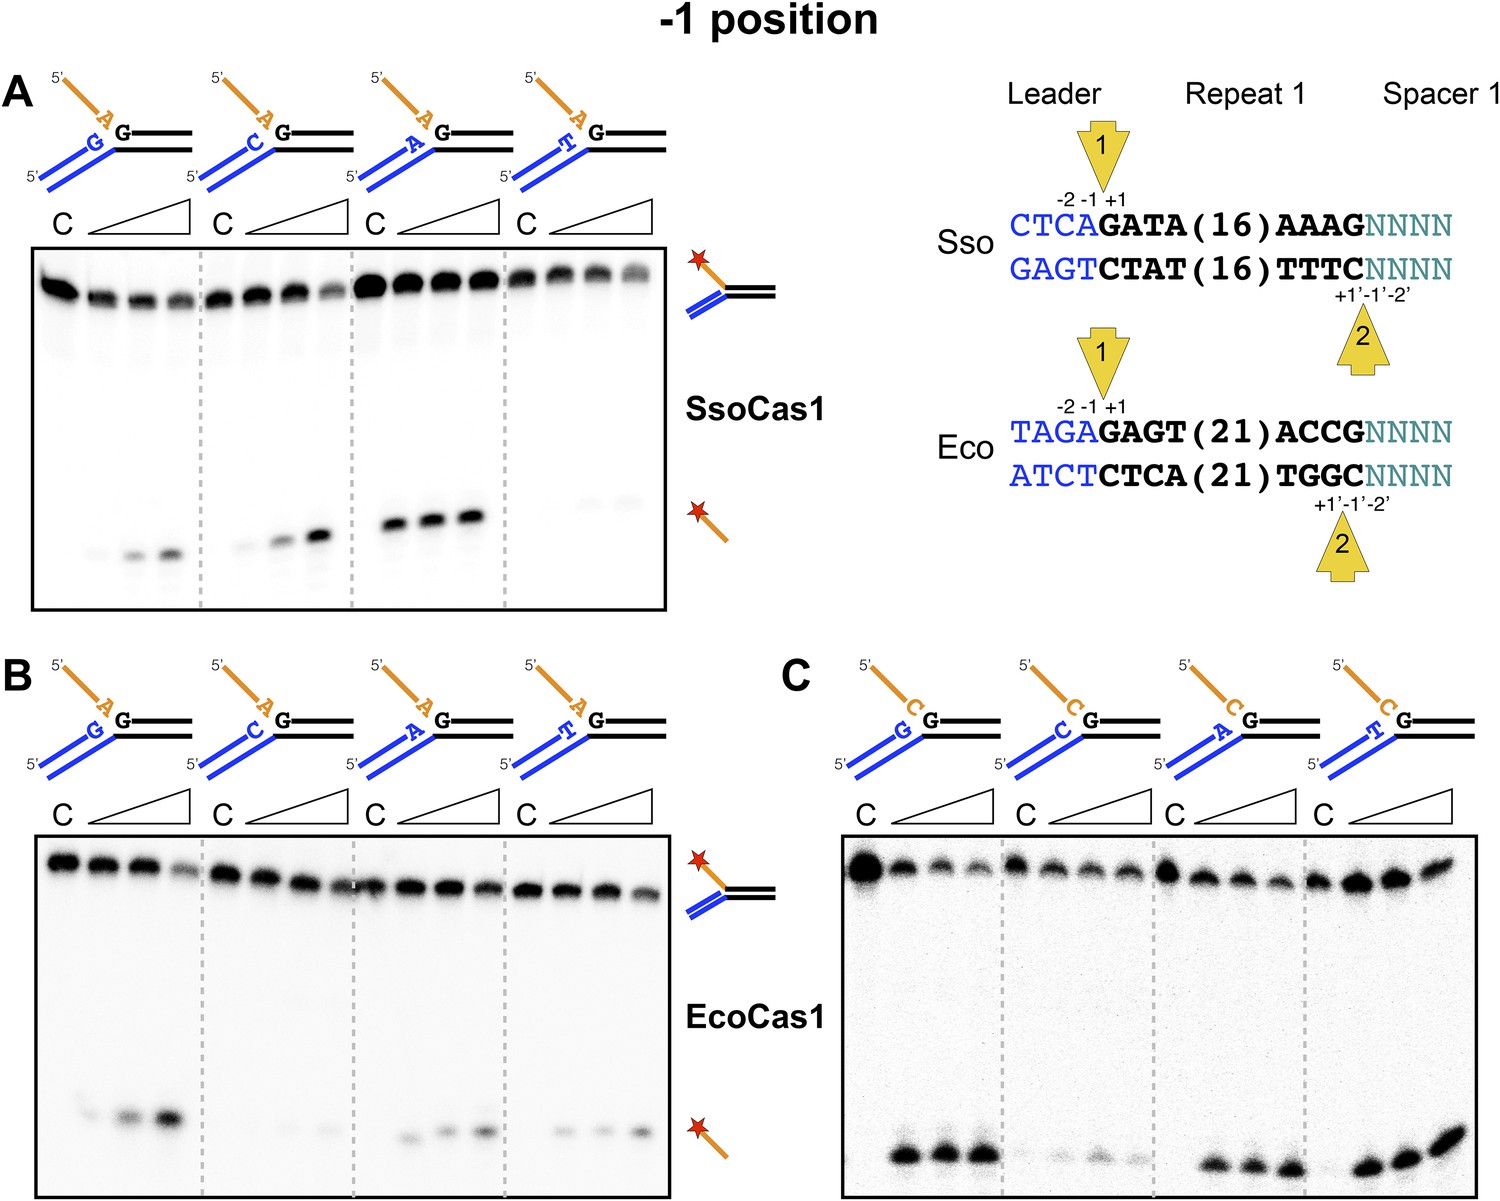
Sequence specificity of the disintegration reaction at the −1 position.
The nucleotides participating in the disintegration reaction were varied systematically at the −1 position (substrates 3, 9, 10, 11). For SsoCas1 (A) there was some preference for adenine at this position, consistent with integration site 1. For EcoCas1 (B, C), a cytosine at position −1 was disfavoured over all other possibilities, even when the residue equivalent to the ‘incoming’ nucleotide was also a cytosine (substrates 15, 16, 17, 18). Each substrate was incubated with Cas1 for 5, 10 and 30 min in reaction buffer prior to electrophoresis. C–control with no Cas1 added.
Figure 7
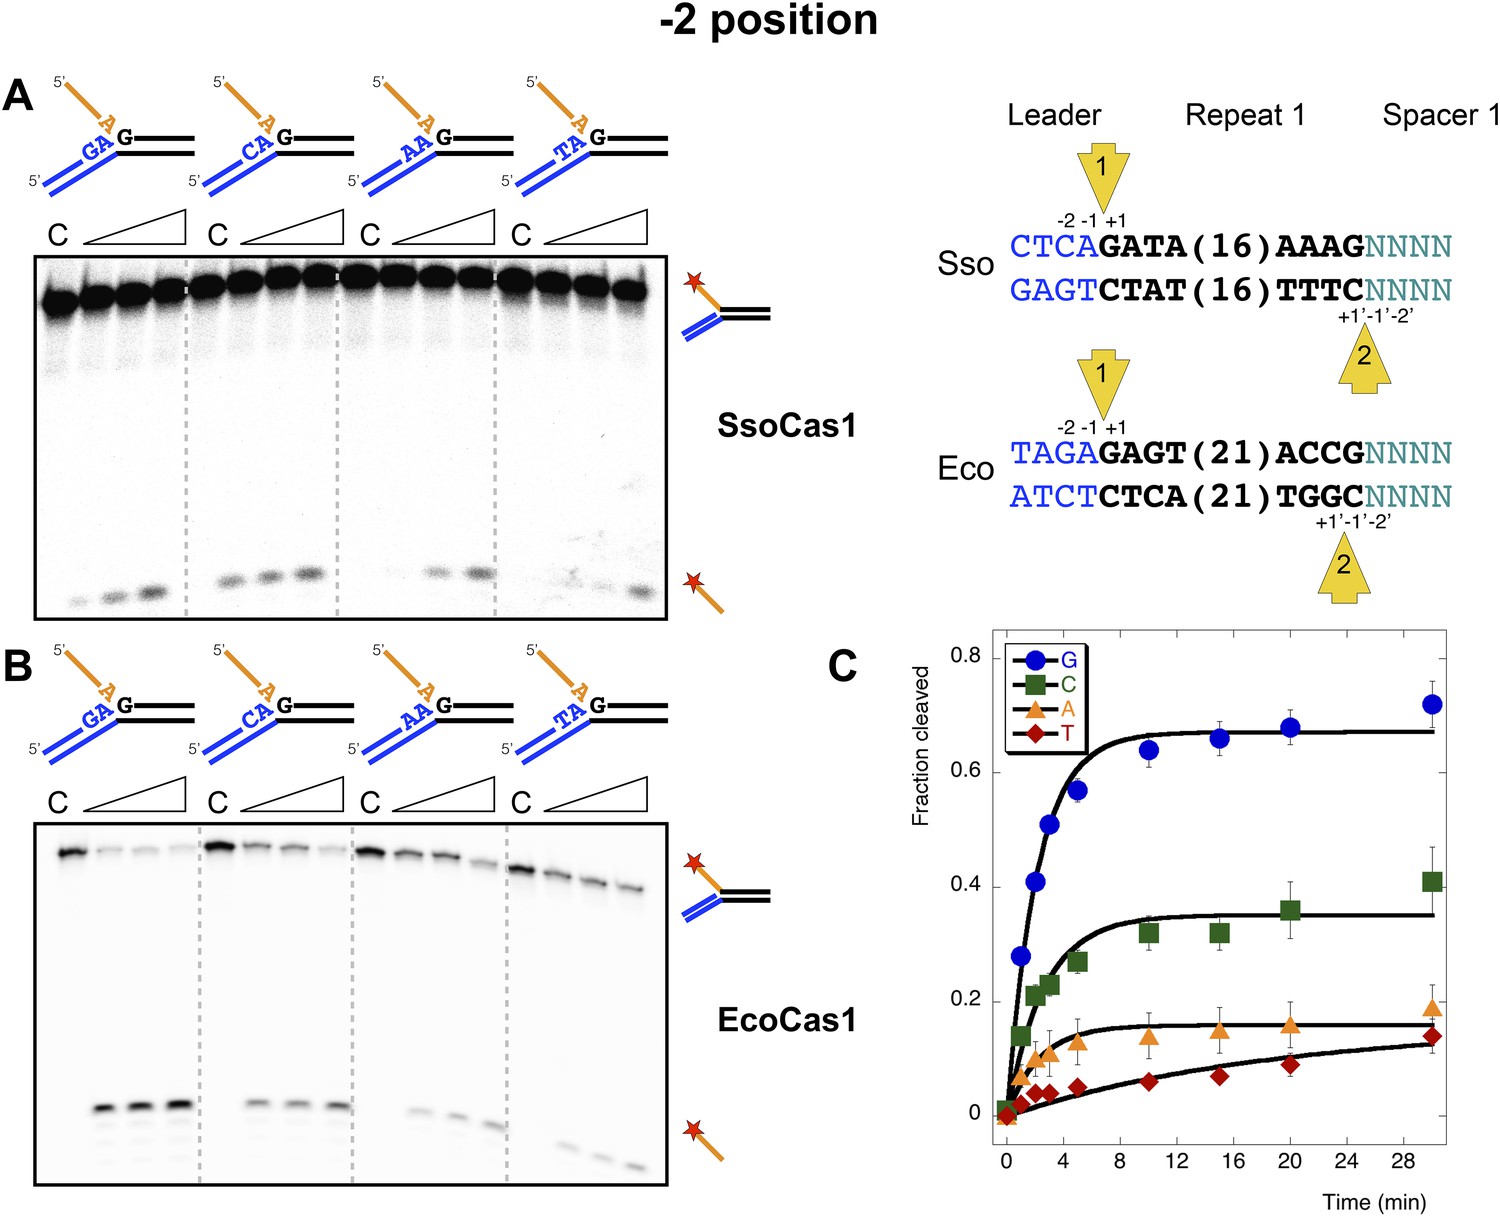
Sequence specificity of the disintegration reaction at the −2 position.
The nucleotides participating in the disintegration reaction were varied systematically at the −2 position, which is a cytosine (Sso) or guanine (Eco) at integration site 1, and variable at integration site 2 (substrates 10, 12, 13, 14). (A) SsoCas1; (B) EcoCas1. Each substrate was incubated with Cas1 for 5, 10 and 30 min in reaction buffer prior to electrophoresis. C–control with no Cas1 added. (C) For EcoCas1, the clear preference for guanine at position −2 was confirmed by more detailed kinetic analysis (raw data provided in Figure 7—source data 1) as described for Figure 5.
-
Figure 7—source data 1
Nucleotide at −2 position.
- https://doi.org/10.7554/eLife.08716.013
Figure 8
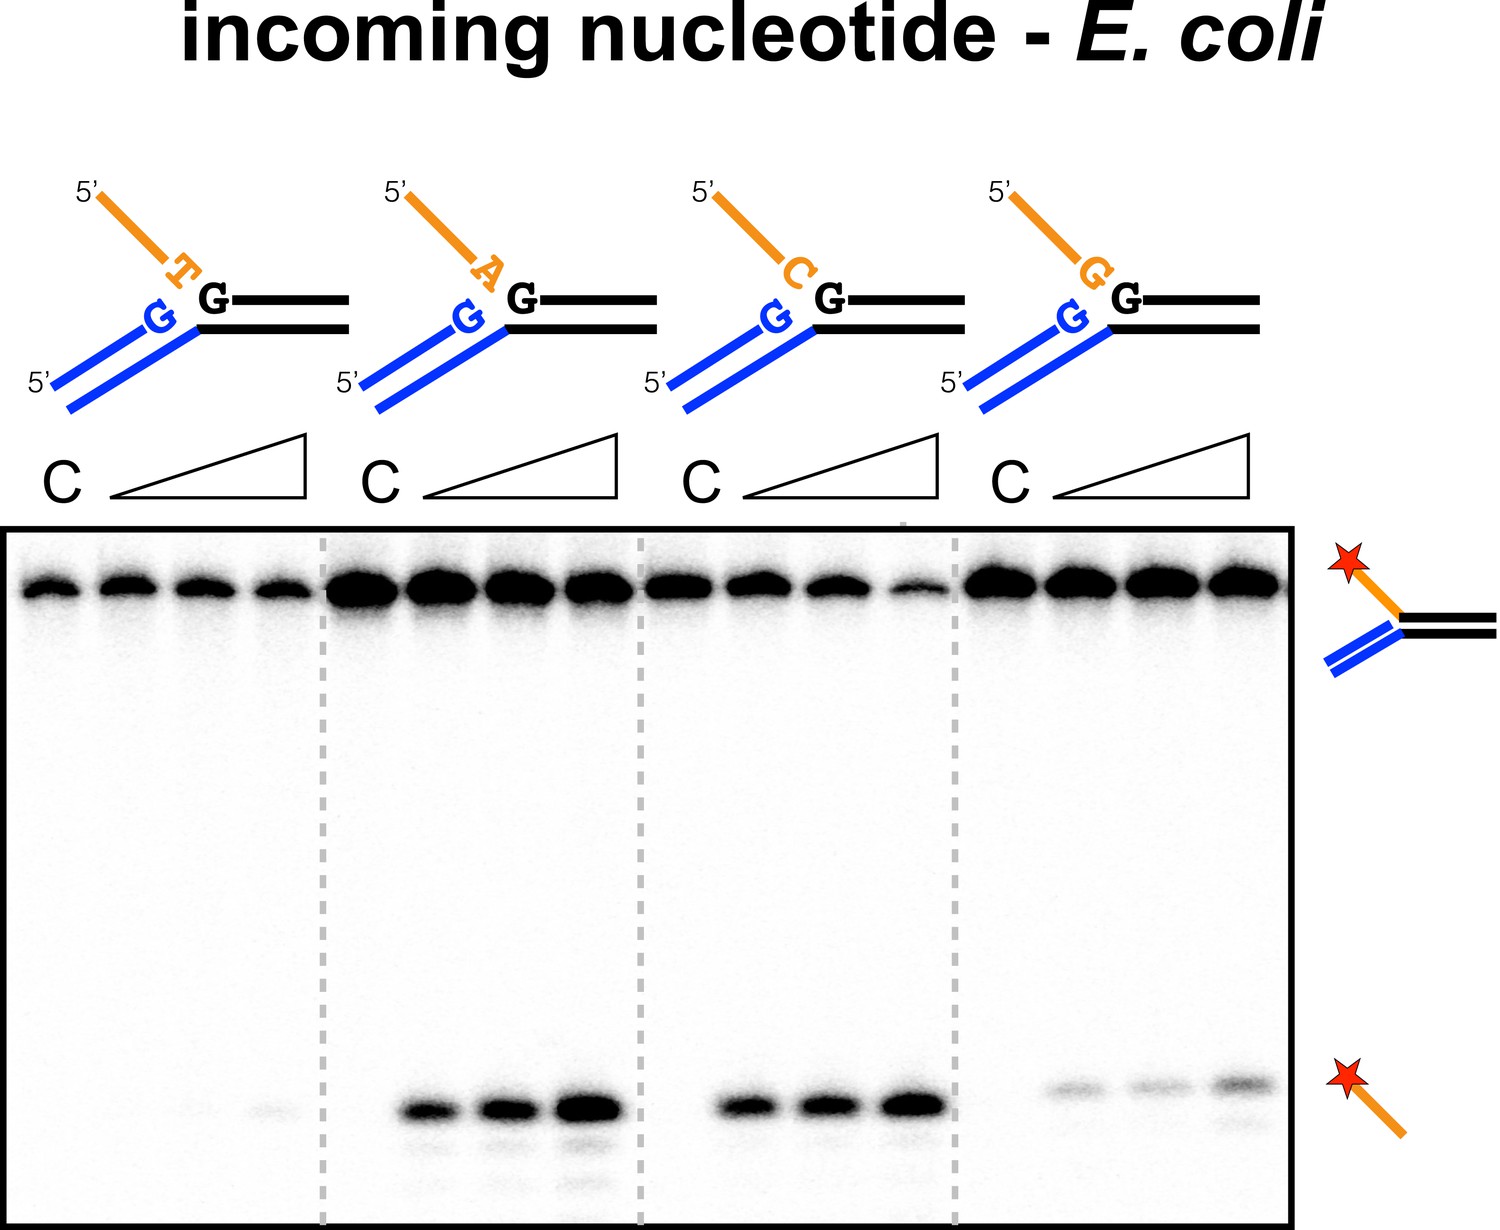
Sequence specificity of the EcoCas1 disintegration reaction for the incoming nucleotide.
The nucleotide corresponding to the incoming 3′ end of the new spacer, which is the nucleotide at the 3′ end of the 5′-flap in the disintegration substrate, was varied systematically to determine its effect on the disintegration reaction catalysed by EcoCas1 (substrates 2, 3, 4, 5). C–control with no Cas1 added. Time points were 5, 10 and 30 min.
Figure 9
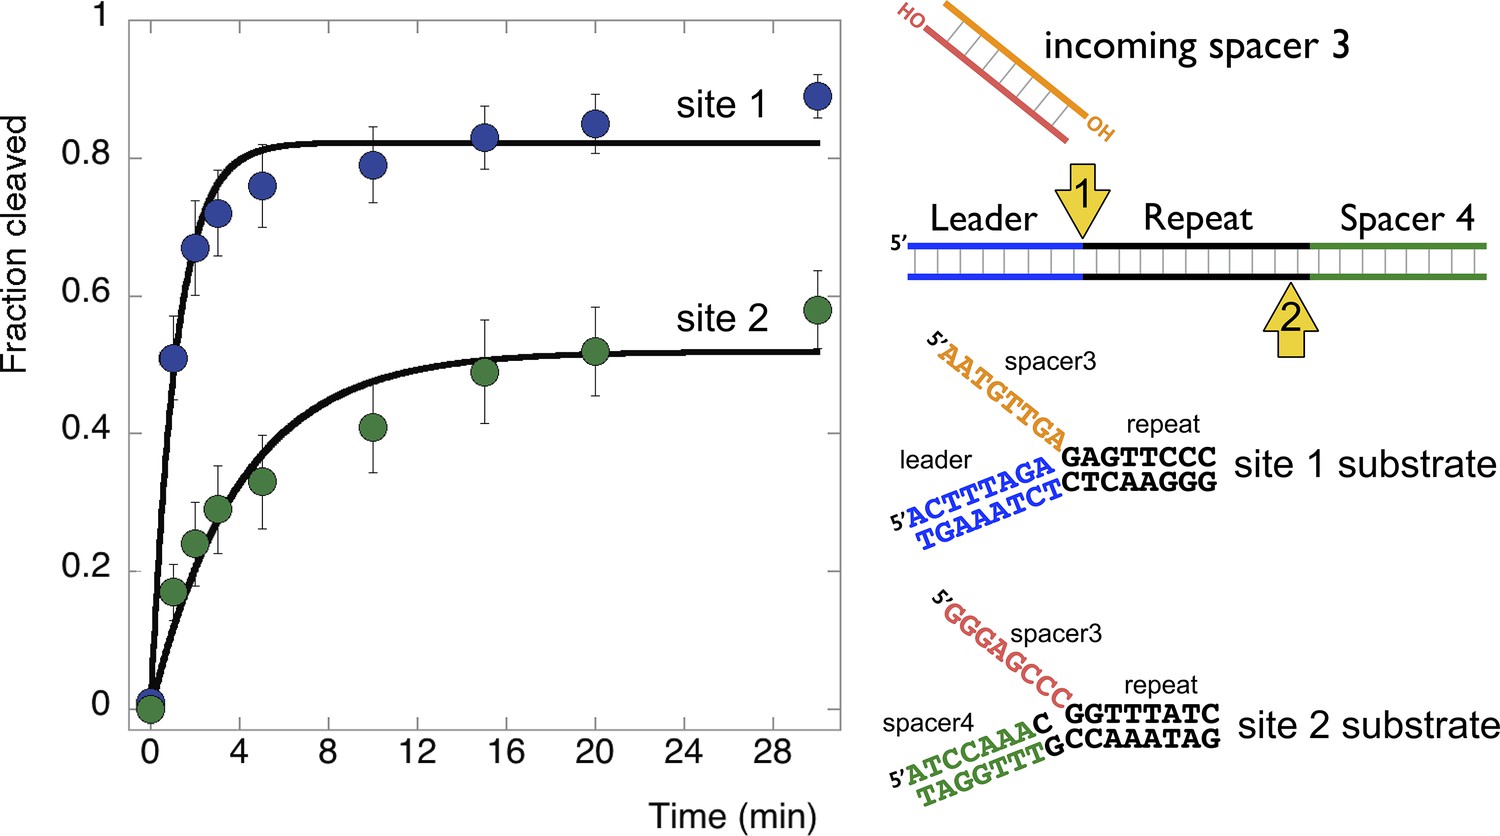
Disintegration of authentic E. coli integration intermediates.
Disintegration substrates corresponding to the expected site 1 and site 2 integration products arising from the integration of spacer 3 into the CRISPR array were constructed and tested (spacer 3-1 and spacer 3-2 substrates). EcoCas1 processed both, with the rate of reaction significantly higher for the substrate corresponding to site 1 (the top strand) at the leader-repeat junction. Data points represent the means of triplicate experiments with standard errors shown (raw data provided in Figure 9—source data 1).
-
Figure 9—source data 1
E. coli Site 1 vs Site 2 time course.
- https://doi.org/10.7554/eLife.08716.016
Figure 10
Reaction scheme for spacer integration and disintegration by E. coli Cas1.
The Cas 1-2 complex integrates new spacers via two joining reactions (1 and 2) at either end of the first CRISPR repeat, which differ in their sequence context. Disintegration activity by E. coli Cas1 shows clear preference for the sequence at site 1, with the guanines at position +1 and −2 particularly important. At site 2, the sequence context is not optimal for disintegration in vitro, leading to slower reaction rates. In the active site of Cas1, these nucleobases likely make specific interactions with catalytic residues, and the DNA duplex structure may be distorted.
Tables
Table 1
Sequence of oligonucleotides used for substrate construction
| Strand | Sequence 5′→3′ | Length |
|---|---|---|
| 1a | TAGTAAGAGATTAATAAACCCTCAGATAATCTCTTATAGAATTGAAAGTTCGG | 53 |
| 1b | TTTTTTTTTTTTTTTTTTATTATCTGAGGGTTTATTAATCTCTTACTA | 48 |
| 1c | CCGAACTTTCAATTCTATAAGAG | 23 |
| 2a | TAGTAAGAGATTAATAAACCCTCAGATAACCTCTTATAGAATTGAAAGTTCGG | 53 |
| 2b | TTTTTTTTTTTTTTTTTTGTTATCTGAGGGTTTATTAATCTCTTACTA | 48 |
| 3b | TTTTTTTTTTTTTTTTTAGTTATCTGAGGGTTTATTAATCTCTTACTA | 48 |
| 4b | TTTTTTTTTTTTTTTTTCGTTATCTGAGGGTTTATTAATCTCTTACTA | 48 |
| 5b | TTTTTTTTTTTTTTTTTGGTTATCTGAGGGTTTATTAATCTCTTACTA | 48 |
| 6a | TAGTAAGAGATTAATAAACCCTCAGATAAGCTCTTATAGAATTGAAAGTTCGG | 53 |
| 6b | TTTTTTTTTTTTTTTTTACTTATCTGAGGGTTTATTAATCTCTTACTA | 48 |
| 7a | TAGTAAGAGATTAATAAACCCTCAGATAAACTCTTATAGAATTGAAAGTTCGG | 53 |
| 7b | TTTTTTTTTTTTTTTTTATTTATCTGAGGGTTTATTAATCTCTTACTA | 48 |
| 8b | TTTTTTTTTTTTTTTTTAATTATCTGAGGGTTTATTAATCTCTTACTA | 48 |
| 9a | TAGTAAGAGATTAATAAACCCTCAGATAACATCTTATAGAATTGAAAGTTCGG | 53 |
| 9c | CCGAACTTTCAATTCTATAAGAT | 23 |
| 10a | TAGTAAGAGATTAATAAACCCTCAGATAACTTCTTATAGAATTGAAAGTTCGG | 53 |
| 10c | CCGAACTTTCAATTCTATAAGAA | 23 |
| 11a | TAGTAAGAGATTAATAAACCCTCAGATAACGTCTTATAGAATTGAAAGTTCGG | 53 |
| 11c | CCGAACTTTCAATTCTATAAGAC | 23 |
| 12a | TAGTAAGAGATTAATAAACCCTCAGATAACTCCTTATAGAATTGAAAGTTCGG | 53 |
| 12c | CCGAACTTTCAATTCTATAAGGA | 23 |
| 13a | TAGTAAGAGATTAATAAACCCTCAGATAACTGCTTATAGAATTGAAAGTTCGG | 53 |
| 13c | CCGAACTTTCAATTCTATAAGCA | 23 |
| 14a | TAGTAAGAGATTAATAAACCCTCAGATAACTACTTATAGAATTGAAAGTTCGG | 53 |
| 14c | CCGAACTTTCAATTCTATAAGTA | 23 |
| SacI-a | TAGTAAGAGATTAATAAACCCTCAGATGAGCTCTTATAGAATTGAAAGTTCGG | 53 |
| SacI-b | TTTTTTTTTTTTTTCTCATCTGAGGGTTTATTAATCTCTTACTA | 44 |
| 1b-3′-FAM | TTTTTTTTTTTTTTATTATCTGAGGGTTTATTAATCTCTTACTA-FAM | 48 |
| 19a | CCTCGAGGGATCCGTCCTAGCAAGCCGCTGCTACCGGAAGCTTCTGGACC | 50 |
| 19b | GCTCGAGTCTAGACTGCAGTTGAGAGCTTGCTAGGACGGATCCCTCGAGG | 50 |
| 19c | GGTCCAGAAGCTTCCGGTAGCAGCG | 25 |
| 20d-10 | AGTCTAGACTCGAGC | 15 |
| 20d-5 | ACTGCAGTCTAGACTCGAGC | 20 |
| 20d | TCTCAACTGCAGTCTAGACTCGAGC | 25 |
| 25c-d | GGTCCAGAAGCTTCCGGTAGCAGCGTCTCAACTGCAGTCTAGACTCGAGC | 50 |
| 1c-3′P | CCGAACTTTCAATTCTATAAGAG-phos | 25 |
| Sp3-1a | CTGGCGCGGGGAACTCTCTAAAAGTATACATTTGTTCTT | 39 |
| Sp3-1b | TGTAATTGATAATGTTGAGAGTTCCCCGCGCCAG | 34 |
| Sp3-1c | AAGAACAAATGTATACTTTTAGA | 23 |
| Sp3-2a | CCAGCGGGGATAAACCGTTTGGATCGGGTCTGGAATTTC | 39 |
| Sp3-2b | TGTTCCGACAGGGAGCCCGGTTTATCCCCGCTGG | 34 |
| Sp3-2c | GAAATTCCAGACCCGATCCAAAC | 23 |
Table 2
DNA constructs used in this study
| Substrate | Oligonucleotide components | Junction sequence | |||
|---|---|---|---|---|---|
| −2 | −1 | 1 | IC | ||
| Substrate 1 | 1a, 1b, 1c | A | G | A | T |
| Substrate 1-FAM | 1a, 1b-3′-FAM, 1c | A | G | A | T |
| SacI substrate | SacI-a, SacI-b, 1c | A | G | C | T |
| Substrate 2 | 2a, 2b, 1c | A | G | G | T |
| Substrate 3 | 2a, 3b, 1c | A | G | G | A |
| 3′-phos substrate | 2a, 3b, 1c-3′P | A | G | G | A |
| Substrate 4 | 2a, 4b, 1c | A | G | G | C |
| Substrate 5 | 2a, 5b, 1c | A | G | G | G |
| Substrate 6 | 6a, 6b, 1c | A | G | C | A |
| Substrate 7 | 7a, 7b, 1c | A | G | T | A |
| Substrate 8 | 1a, 8b, 1c | A | G | A | A |
| Substrate 9 | 9a, 3b, 9c | A | T | G | A |
| Substrate 10 | 10a, 3b, 10c | A | A | G | A |
| Substrate 11 | 11a, 3b, 11c | A | C | G | A |
| Substrate 12 | 12a, 3b, 12c | G | A | G | A |
| Substrate 13 | 13a, 3b, 13c | C | A | G | A |
| Substrate 14 | 14a, 3b, 14c | T | A | G | A |
| Substrate 15 | 2a, 4b, 1c | A | G | G | C |
| Substrate 16 | 11a, 4b, 11c | A | C | G | C |
| Substrate 17 | 10a, 4b, 10c | A | A | G | C |
| Substrate 18 | 9a, 4b, 9c | A | T | G | C |
| Substrate 19 | 19a, 19b, 19c | C | G | G | A |
| Gap10 | 19a, 19b, 19c, 20d-10 | C | G | G | A |
| Gap5 | 19a, 19b, 19c, 20d-5 | C | G | G | A |
| Nick | 19a, 19b, 19c, 20d | C | G | G | A |
| Y-junction | 19a, 19b, 20c-d | C | G | G | A |
| Spacer 3-1 substrate | Sp3-1a, Sp3-1b, Sp3-1c | G | A | G | A |
| Spacer 3-2 substrate | Sp3-2a, Sp3-2b, Sp3-2c | A | C | G | C |
-
The sequence of the central portion of the junction (positions −2, −1, 1 and the incoming nucleotide (IC)) for each substrate is shown. The oligonucleotides used to assemble the complete substrate are indicated.
Download links
A two-part list of links to download the article, or parts of the article, in various formats.
Downloads (link to download the article as PDF)
Open citations (links to open the citations from this article in various online reference manager services)
Cite this article (links to download the citations from this article in formats compatible with various reference manager tools)
Intrinsic sequence specificity of the Cas1 integrase directs new spacer acquisition
eLife 4:e08716.
https://doi.org/10.7554/eLife.08716


