GnT1IP-L specifically inhibits MGAT1 in the Golgi via its luminal domain
- Albert Einstein College of Medicine, United States
- University of Oulu, Finland
- University Medical Center Hamburg-Eppendorf, Germany
Figures
Figure 1
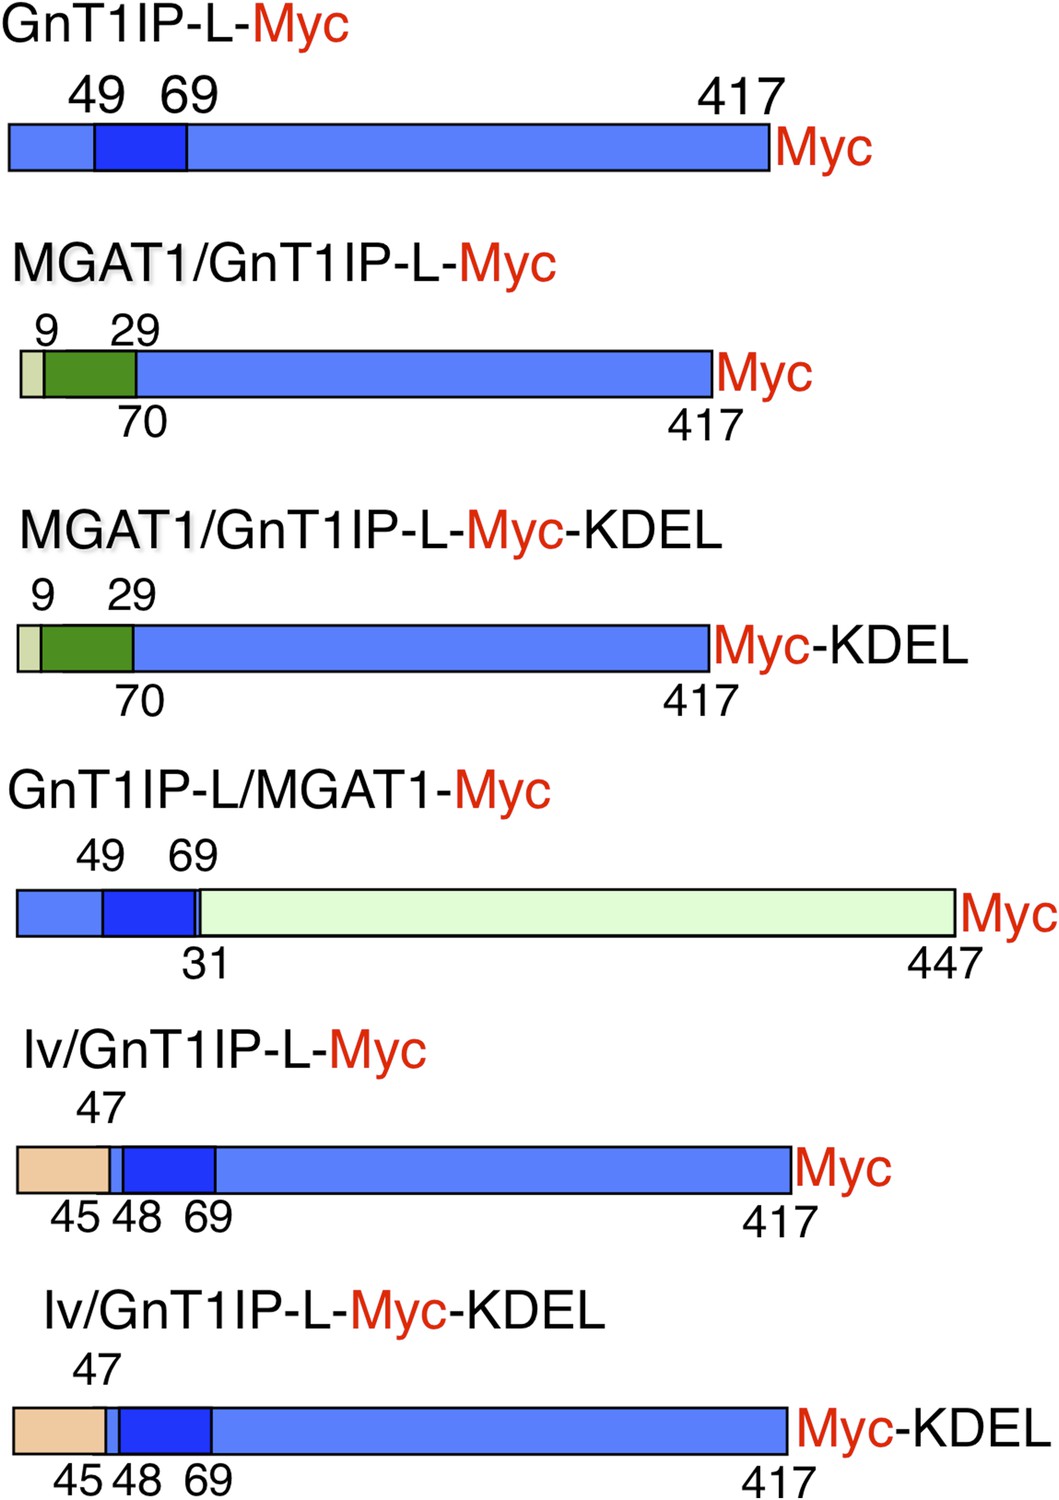
Expression constructs.
Mouse GnT1IP-L (417 aa) contains an N-terminal cytoplasmic domain of 48 aa, a transmembrane (TM) domain of 21 aa (shaded), and a luminal domain of 348 amino acids. The location of the Myc tag (red) is shown for each construct. Chimeric constructs contained the cytoplasmic and TM domain of MGAT1 (green) linked to the luminal domain of GnT1IP-L (blue), or the cytoplasmic and TM domain of GnT1IP-L linked to the luminal domain of MGAT1, or N-terminal aa 1–47 of human Invariant chain p33 (Iv; beige) linked to aa 45 to 417 of GnT1IP-L. Predicted TM domains are shown in darker colors. Numbers on top of each chimera are aa from the N-terminal domain and underneath are aa from the luminal domain.
Figure 2
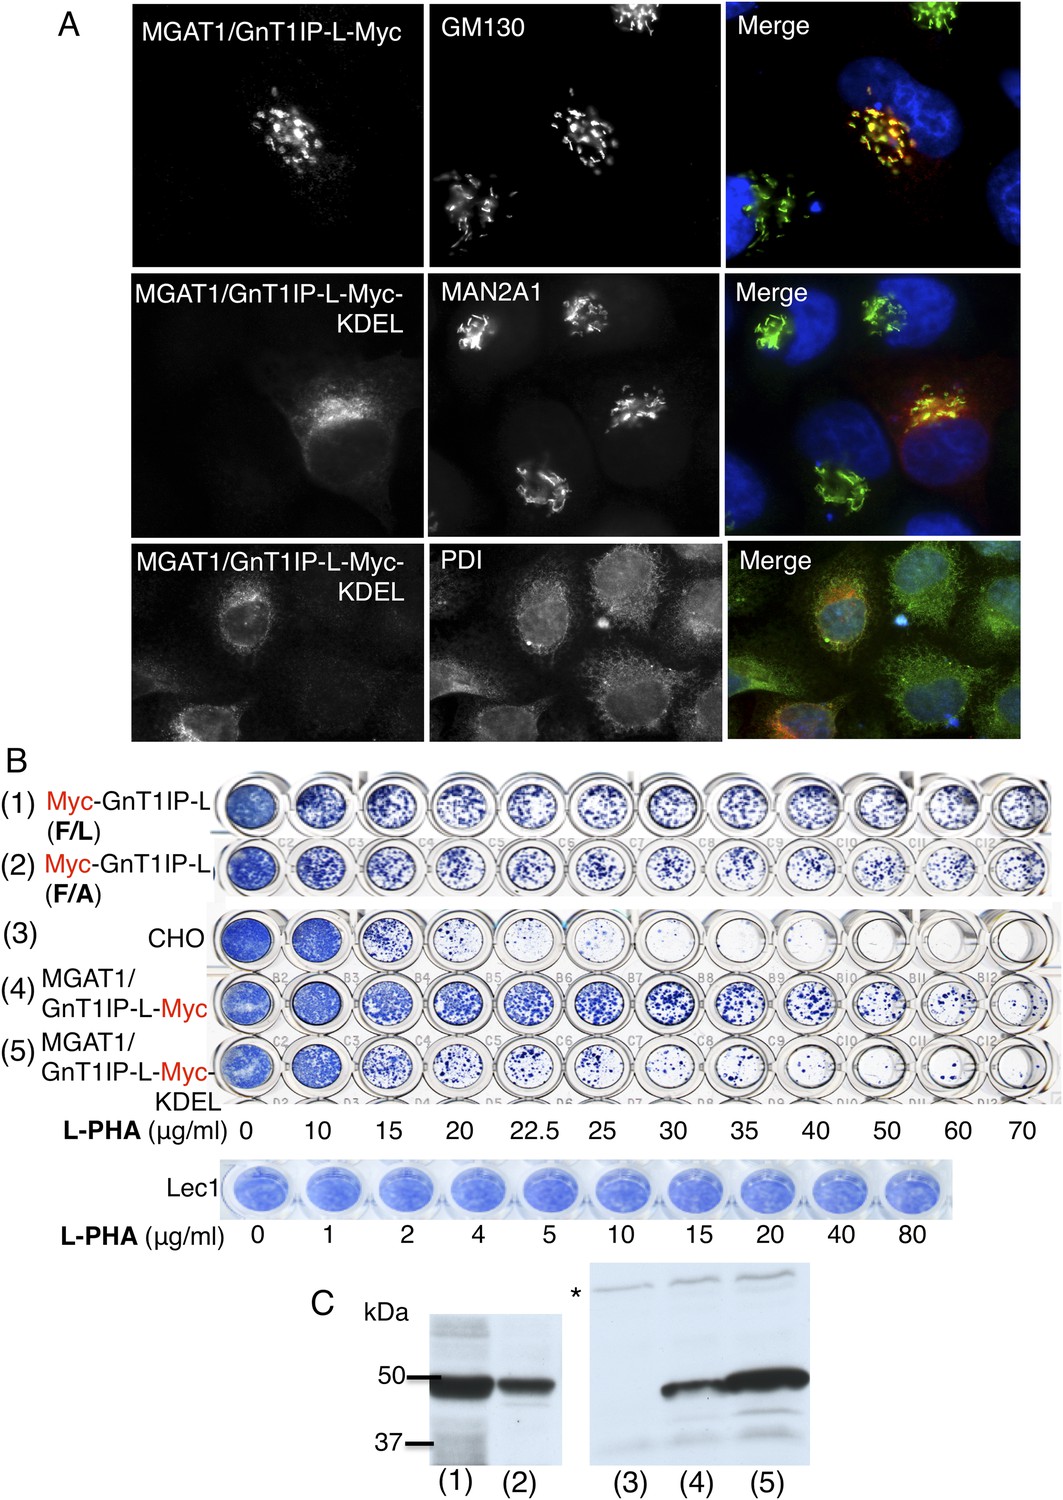
The luminal domain of GnT1IP-L inhibits MGAT1.
(A) HeLa cells transiently expressing the chimera MGAT1/GnT1IP-L-Myc or MGAT1/GnT1IP-L-Myc-KDEL were analysed for expression of Myc, MAN2A1, GM130 and protein disulfide isomerase (PDI). Each result is representative of 40–50 cells examined. (B) Resistance to L-PHA of the same chimeric proteins along with Myc-GnT1IP-L(F/L) and Myc-GnT1IP-L(F/A) in Chinese hamster ovary (CHO) transfectant populations selected for hygromycin resistance, compared to CHO and Lec1 cells. Independent transfectant populations gave the same results in 2–3 replicate assays. (C) Western analysis of lysates corresponding to CHO populations numbered in panel B. The blot was probed with anti-Myc antibodies. * non-specific band loading control.
Figure 3
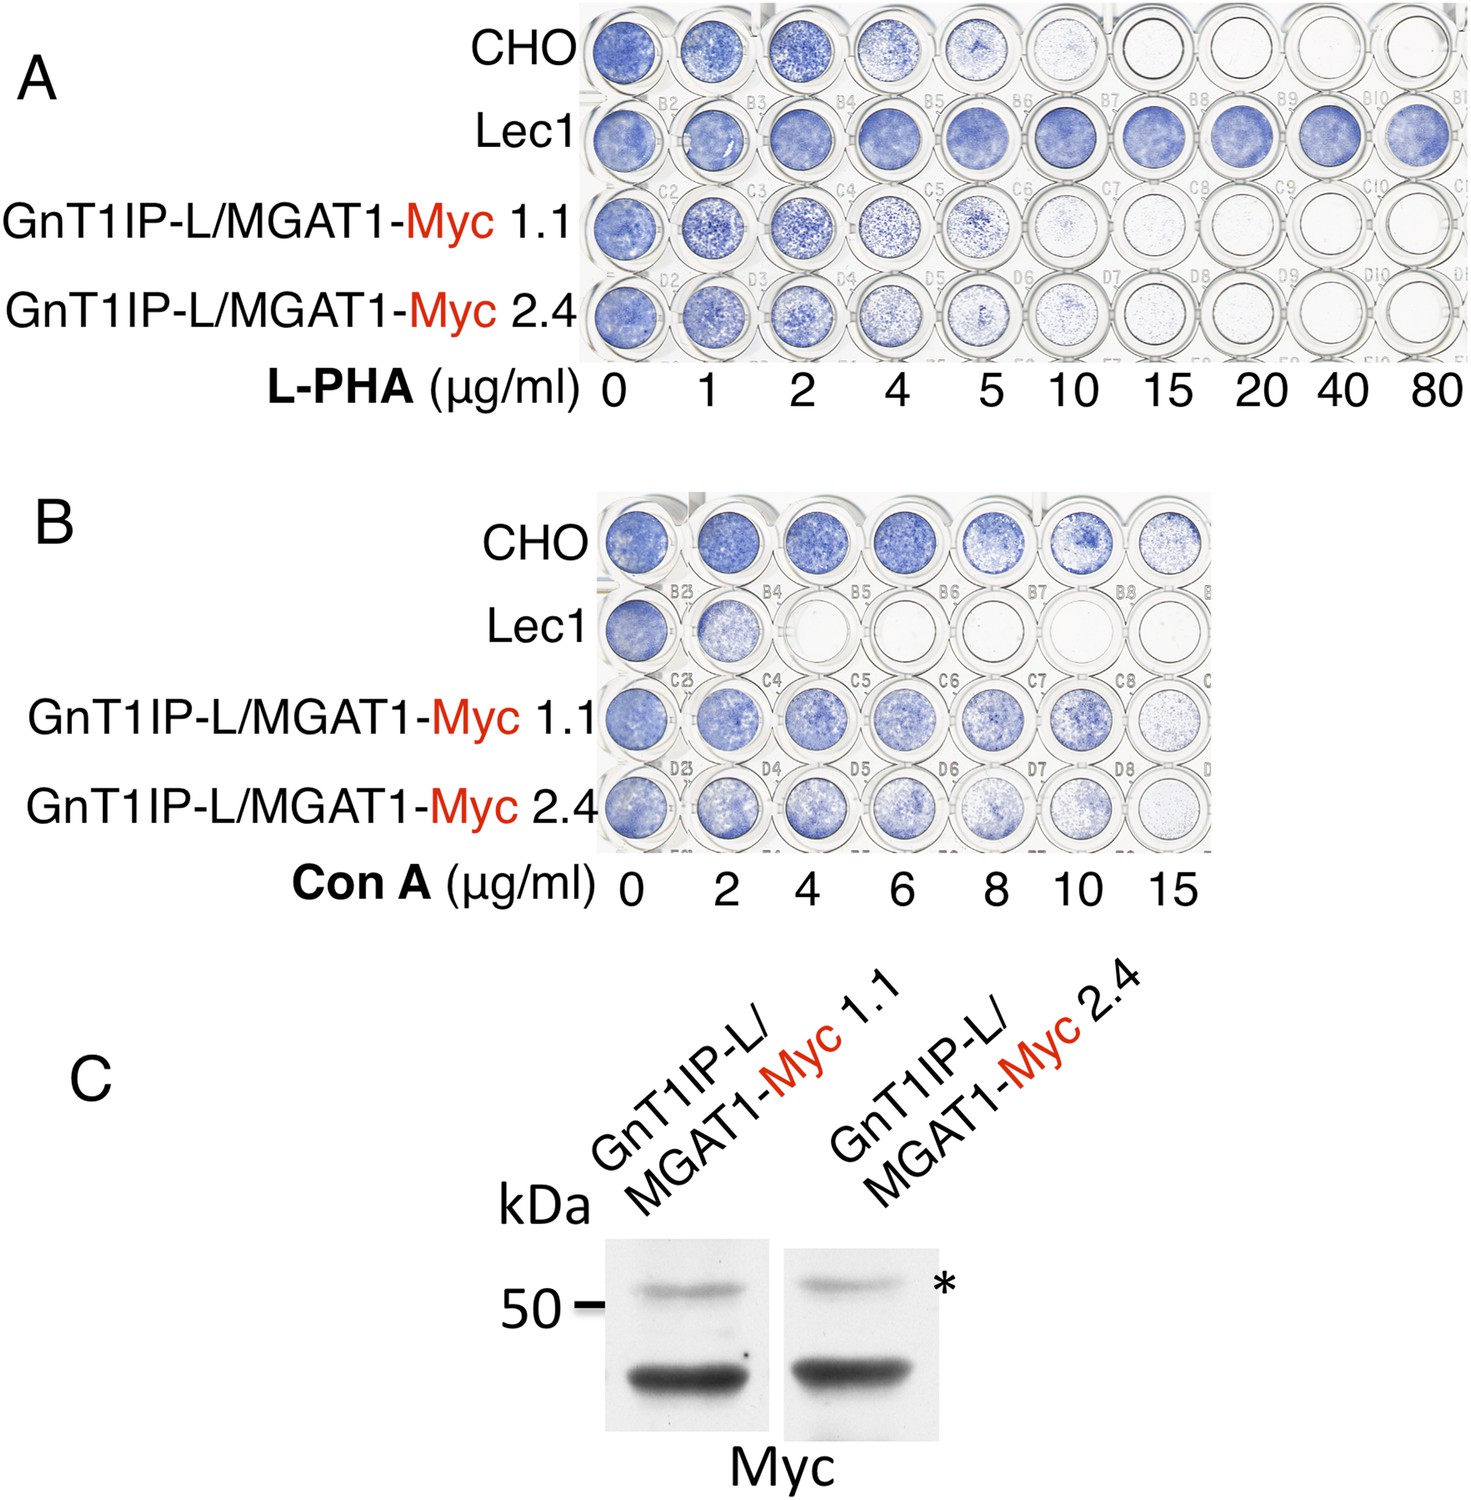
The TM and cytoplasmic domain of GnT1IP-L does not inhibit MGAT1.
(A) Lectin-resistance test of cloned CHO cells stably expressing GnT1IP-L/MGAT1-Myc compared to CHO cells and Lec1 CHO cells that lack MGAT1 (n = 2). (B) The same cloned GnT1IP-L transfectant lines were compared to CHO and Lec1 cells for resistance to Con A (n = 2). (C) Western analysis of CHO cell lysates from the cloned transfectants in (A) and (B). * non-specific band shows equal loading.
Figure 4
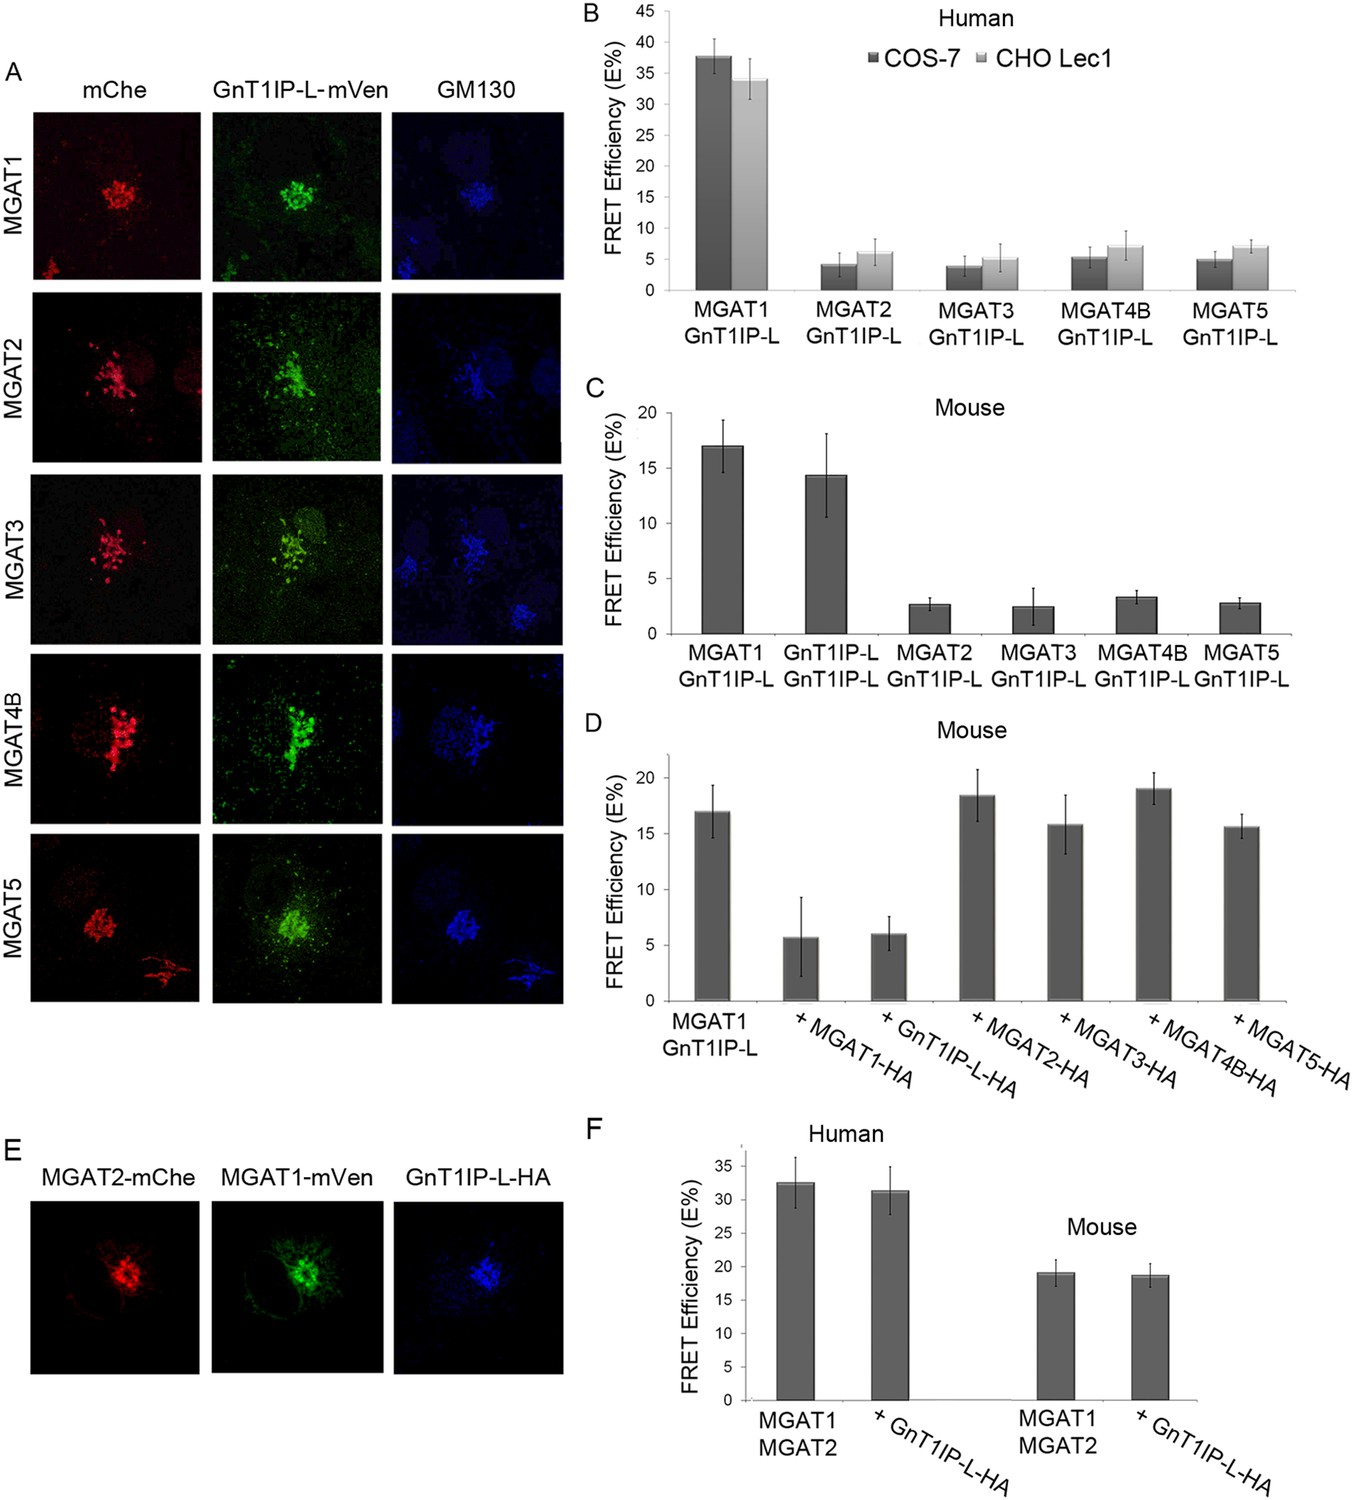
GnT1IP-L interacts specifically with MGAT1 in the Golgi.
(A) Fluorescence microscopy of COS-7 cells stably expressing GnT1IP-L-mVen and transiently expressing medial Golgi GlcNAc-transferases MGAT1 to MGAT5 conjugated to mChe at their C-terminus compared to the Golgi marker GM130. (B) GnT1IP-L interaction with human GlcNAc-transferases. COS-7 or Lec1 CHO cells stably expressing GnT1IP-L-mVen were transfected with human cDNAs encoding MGAT1 to MGAT5 C-terminally tagged with mChe, and fluorescent resonance energy transfer (FRET) efficiencies were determined. (C) GnT1IP-L interaction with mouse GlcNAc-transferases. COS-7 cells transiently expressing mouse GnT1IP-L-mVen and GnT1IP-L-mChe or mouse MGAT1-mChe, MGAT2-mChe, MGAT3-mChe, MGAT4B-mChe or MGAT5-mChe and FRET efficiencies determined. (D) COS-7 cells stably expressing GnT1IP-L-mVen were co-transfected with mouse MGAT1-mChe together with competitive cDNA encoding mouse MGAT1 to MGAT5 C-terminally tagged with HA. (E) Transiently co-expressed MGAT1-mVen, MGAT2-mChe and GnT1IP-L-HA are localized in the Golgi. (F) COS-7 cells were transiently expressed with MGAT1-mVen, MGAT2-mChe and GnT1IP-L-HA, and FRET efficiencies were determined. Bars represent the mean ± STDEV (n = 10 cells).
-
Figure 4—source data 1
GnT1IP-L interactions with human and mouse MGATs in the Golgi of COS-7 and CHO Lec1 cells.
- https://doi.org/10.7554/eLife.08916.010
Figure 5
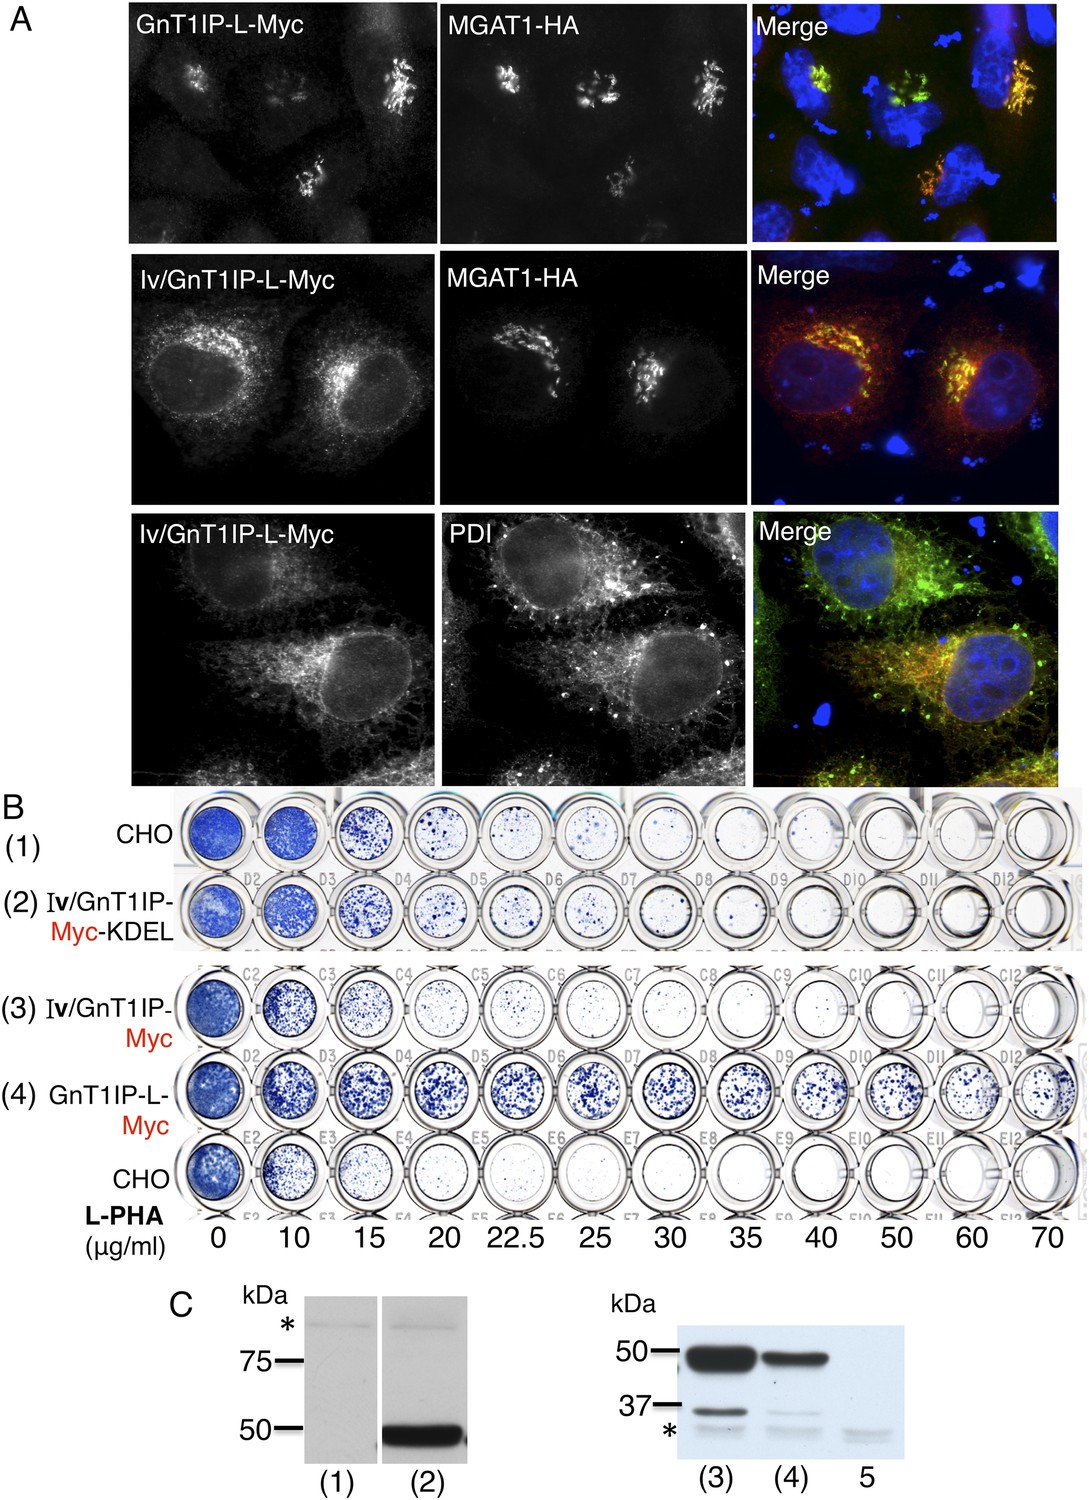
ER-localized GnT1IP-L does not inhibit MGAT1.
(A) HeLa cells transiently expressing GnT1IP-L-Myc and MGAT1-HA, or the chimera Iv/GnT1IP-L-Myc with and without MGAT1-HA were analysed for expression of Myc, HA and PDI. Each result is representative of 40–50 cells examined. (B) Lectin-resistance test comparing the various GnT1IP-L stable transfectant populations with CHO cells for resistance to L-PHA. (C) Western analyses of CHO and stable transfectant populations expressing GnT1IP-L chimeric proteins probed with anti-Myc antibody. Lanes are numbered according to the corresponding cell populations in panel B. Lanes (1) and (2) were cropped from the same blot. Lane 5 is CHO cells expressing MGAT1-HA. * non-specific band loading control.
Figure 6
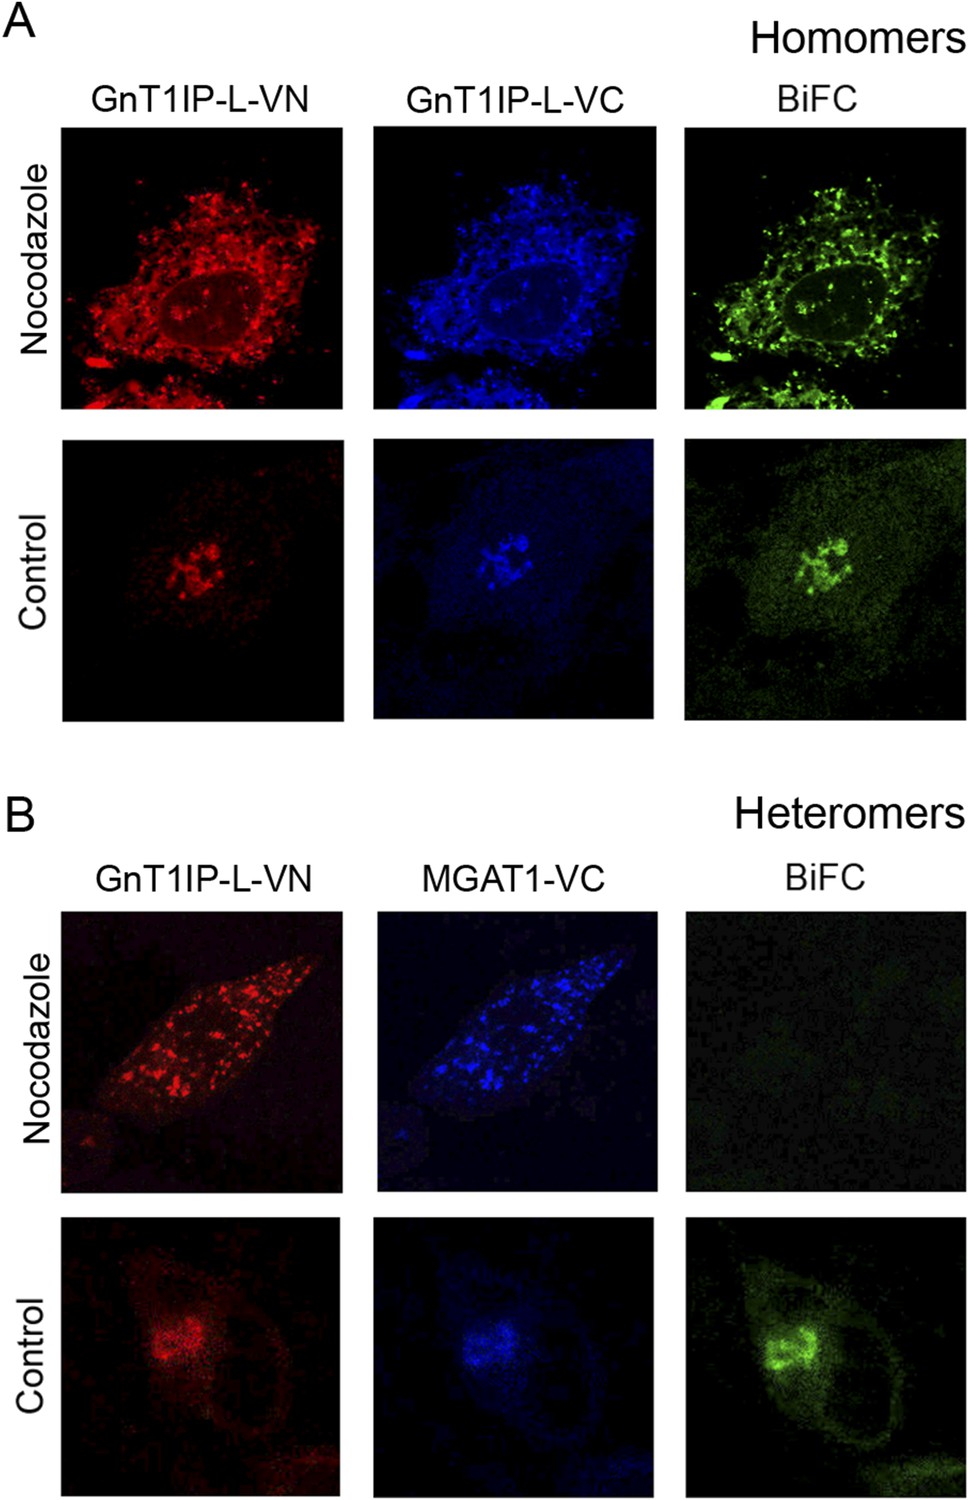
GnT1IP-L and MGAT1 form homomers in the endoplasmic reticulum (ER) and heteromers in the Golgi.
(A) COS-7 cells were co-transfected with mouse GnT1IP-L-VN and GnT1IP-L-VC and, after 8 hr in culture, one set of plates was treated with 1 µg/ml nocodazole overnight. Cells were examined by fluorescence microscopy (50 cells/view) for expression and bimolecular fluorescence complementation (BiFC) signal. The VN tag was detected with rabbit anti-GFP and anti-rabbit Ab conjugated to Alexa Fluor 594, and the VC tag was detected with goat anti-GFP and anti-goat Ab conjugated to Alexa Fluor 405. Confocal imaging detected the BiFC signal (green), VN signal (red) and VC signal (blue). (B) COS-7 cells were co-transfected with mouse GnT1IP-L-VN and human MGAT1-VC, treated with nocodazole as in (A), and examined by fluorescence microscopy for expression and BiFC signal. All cells expressing GnT1IP-L-VN with GnT1IP-L-VC gave a BiFC signal in the presence and absence of nocodazole. In contrast, no signal was detected in nocodazole-treated cells expressing GnT1IP-L-VN with MGAT1-VC.
Figure 7
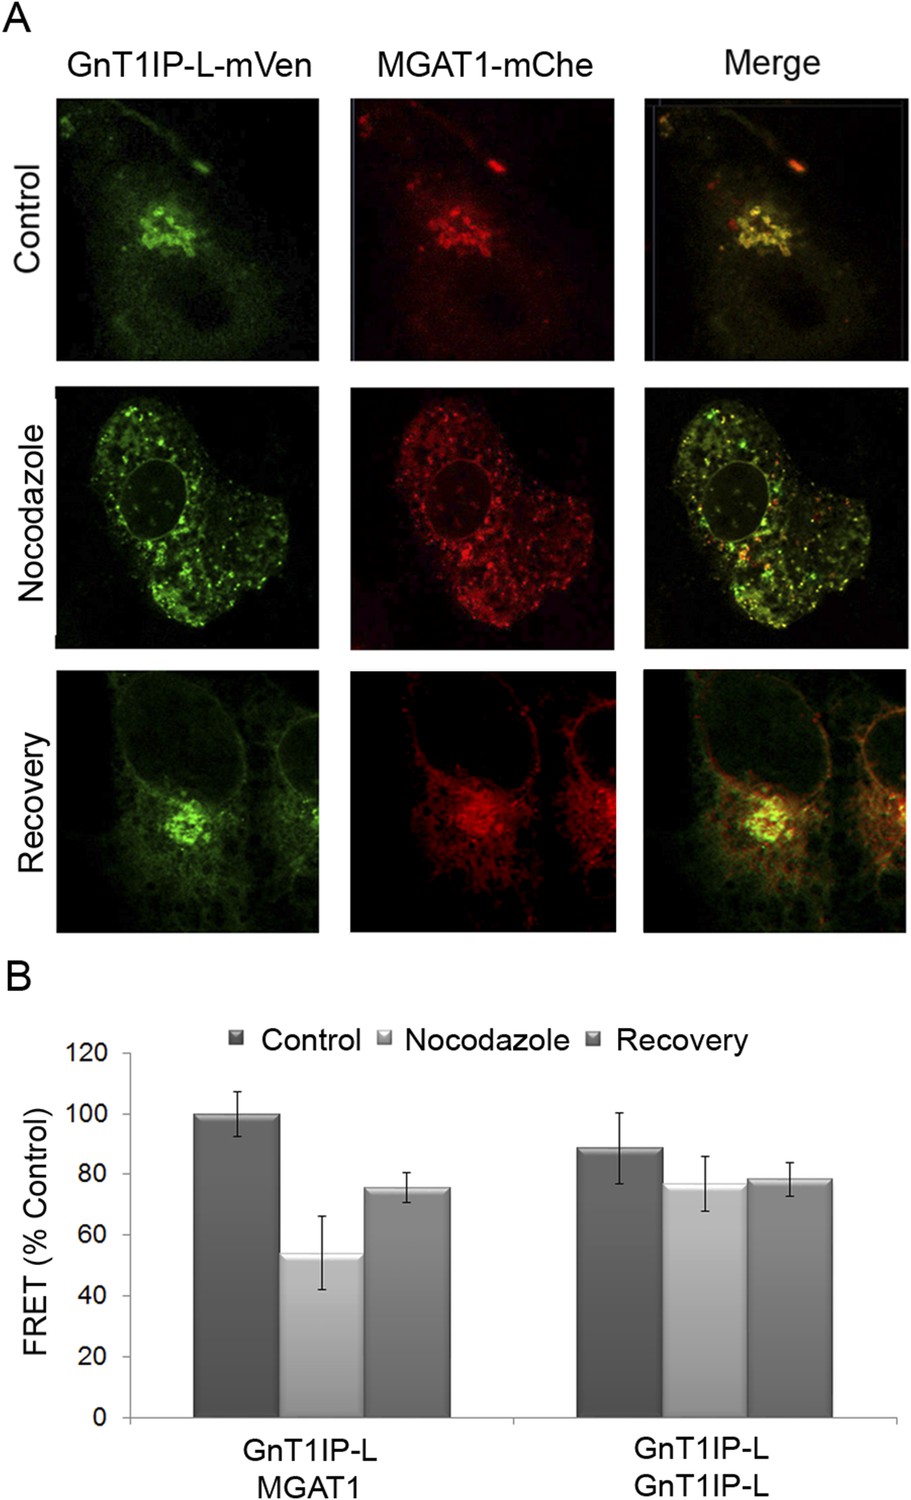
Golgi-localized GnT1IP-L and MGAT1 heteromers are disrupted in the ER following nocodazole treatment and reform after recovery.
(A) COS-7 cells stably expressing GnT1IP-L-mVen were transfected with human MGAT1-mChe and, after 16 hr, treated with 1 µg/ml nocodazole. After 4 hr of treatment, nocodazole was removed from half the samples and recovery allowed to occur for 4 hr. Samples were examined by fluorescence microscopy. (B) FRET efficiencies of COS-7 cells stably expressing GnT1IP-L-mVen and transfected with either MGAT1-mChe or GnT1IP-L-mChe (as in A) were determined by FRET microscopy. FRET efficiencies (mean ± STDEV; n = 10 cells) are given as % of control. Control samples (100%) gave a FRET efficiency of 38 ± 3%.
-
Figure 7—source data 1
Disruption of Golgi-localized GnT1IP-L and MGAT1 heteromers in the ER following nocodazole treatment and their recovery in the Golgi after drug removal.
- https://doi.org/10.7554/eLife.08916.013
Figure 8
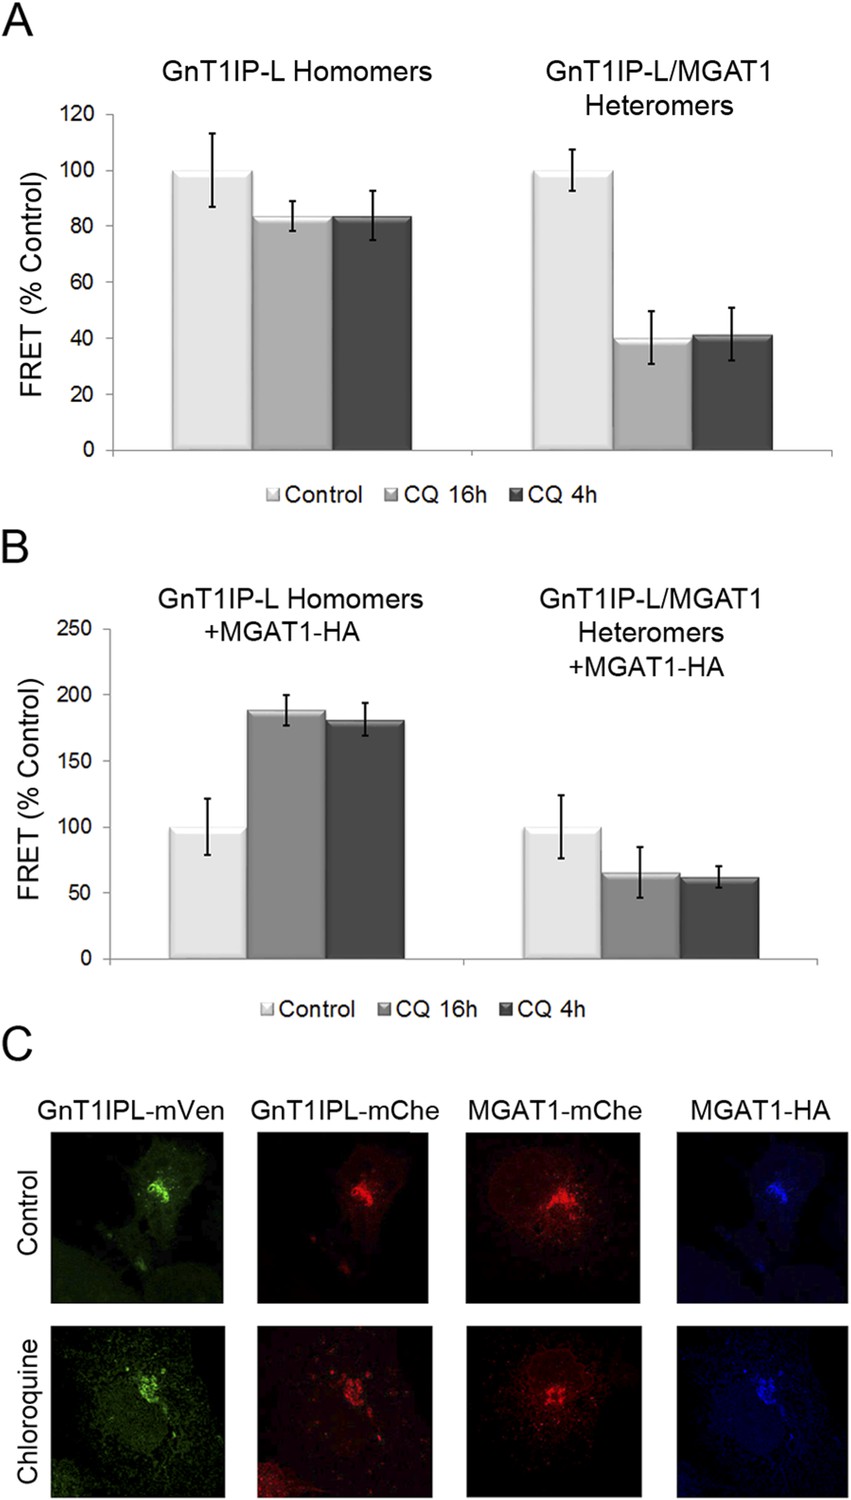
Chloroquine inhibits the formation of GnT1IP-L and MGAT1 heteromers and favors homomers.
(A) COS-7 cells stably expressing GnT1IP-L-mVen were transfected with mouse GnT1IP-L-mChe or human MGAT1-mChe and treated after 8 or 16 hr with 40 μM chloroquine for 16 hr or 4 hr, respectively. Untreated control cells (100%) gave FRET efficiencies of 32% for the GnT1IP-L homomer and 38% for the heteromer with MGAT1. (B) The same experiment as in (A) was performed except that, in addition, MGAT1-HA was added as a competitor. Bars in (A) and (B) show mean ± STDEV (n = 10 cells). (C) Fluorescence microscopy of the transfected cells in the presence or absence of 40 µM chloroquine.
-
Figure 8—source data 1
Disruption of GnT1IP-L and MGAT1 heteromers and enhanced formation of homomers following chloroquine treatment.
- https://doi.org/10.7554/eLife.08916.015
Figure 9
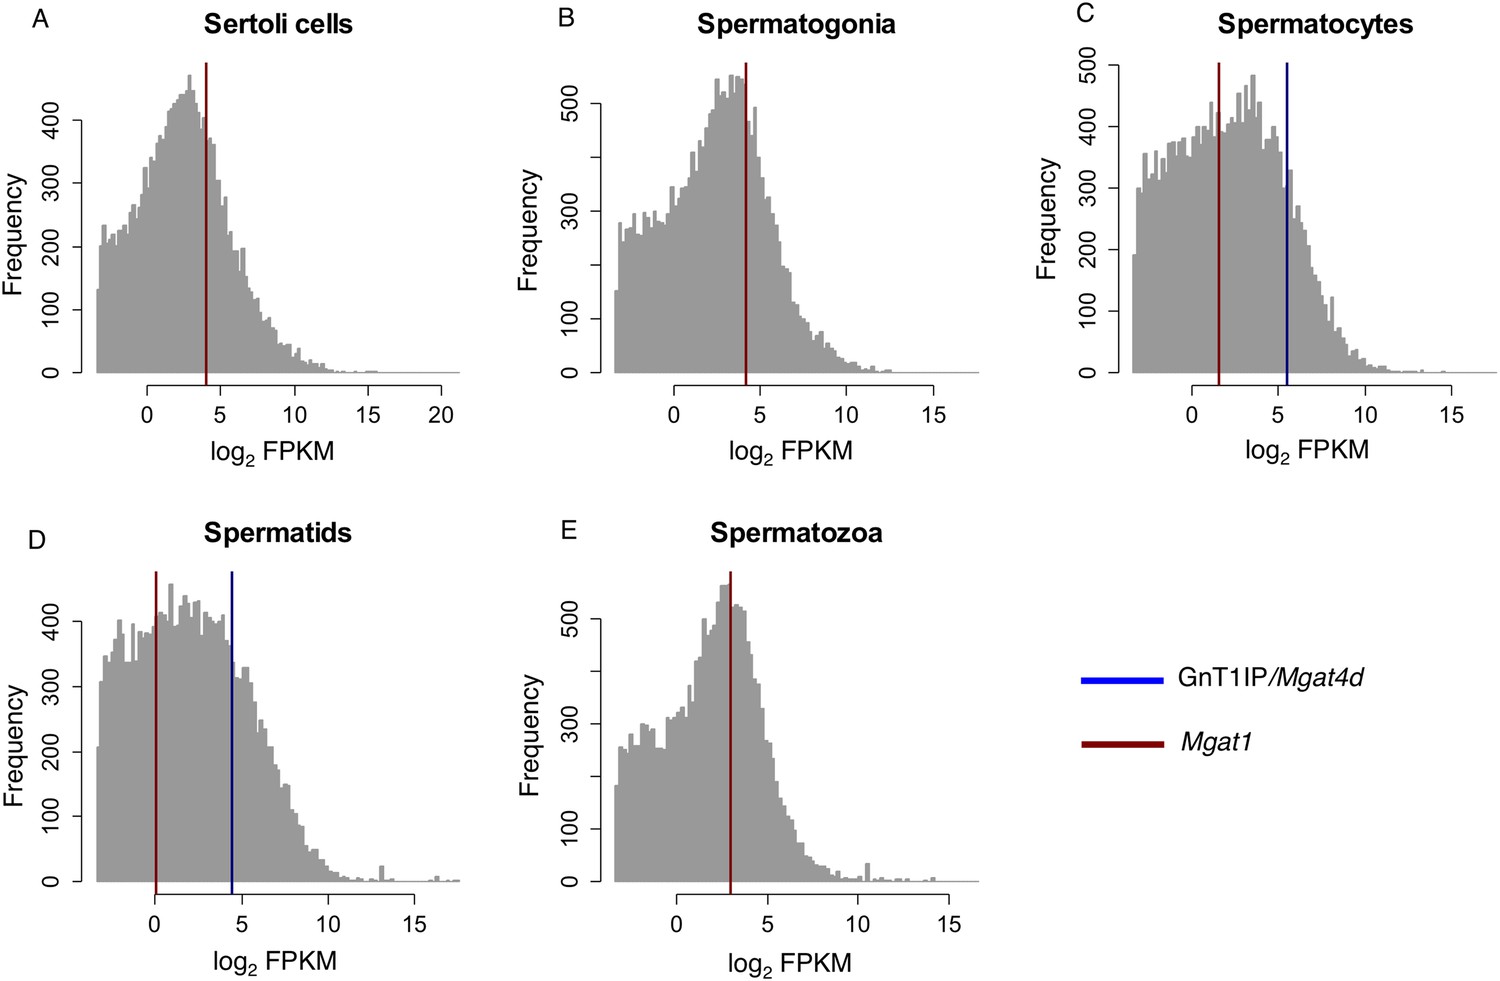
RNA-Seq data for GnT1IP/Mgat4d and Mgat1 in mouse germ cells.
Histogram overlay plot for GnT1IP/Mgat4D (blue) and Mgat1 (red) gene expression in isolated mouse germ cell subtypes as described in Soumillon et al. (2013a). (A) Sertoli cells, (B) Spermatogonia, (C) Spermatocytes, (D) Spermatids, (E) Spermatozoa. The grey histogram reflects the log2-transformed Fragments Per Kilobase of transcript per Million mapped reads (FPKM) values of all 36,823 transcripts identified by RNA sequencing and deposited in the GEO database as GSE43717. Red and blue overlayed vertical lines depict the expression values for Mgat1 (ENSMUSG00000020346) and GnT1IP/Mgat4D (ENSMUSG00000035057), respectively. Note the absence of GnT1IP/Mgat4D transcripts in Sertoli cells, spermatogonia and spermatozoa.
-
Figure 9—source data 1
R code and comma-delimited data files for generating Figure 9.
The R code files import the data files and exactly reproduce Figure 9. The data file contains the log2 FPKM data for the different testicular cell types from Soumillon et al. (Cell Reports 3, 2179–2190, 2013).
- https://doi.org/10.7554/eLife.08916.017
Figure 10
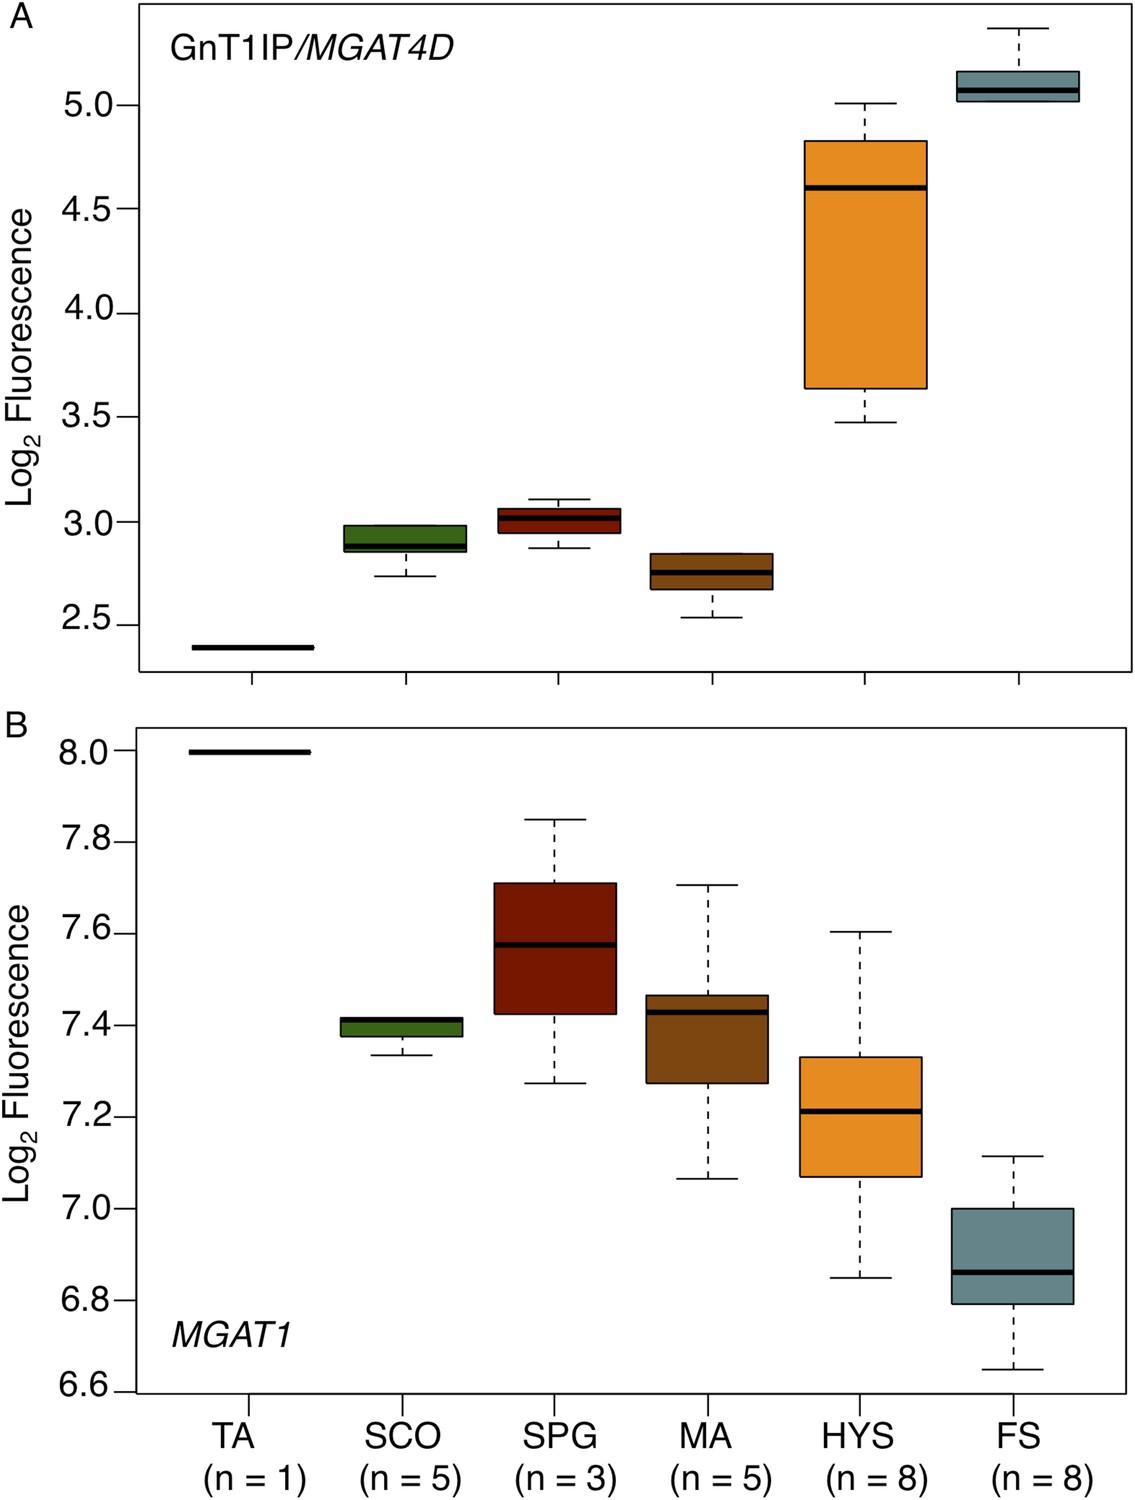
GnT1IP/MGAT4D and MGAT1 transcripts in testis biopsies from men with impaired spermatogenesis.
Transcript levels of GnT1IP/MGAT4D and MGAT1 were determined from the microarray data of Spiess et al. (2007). (A) Boxplot of GnT1IP/MGAT4D log2 fluorescence in human testicular biopsies presenting with different types of spermatogenic impairment (tubular atrophy (TA), Sertoli cell only (SCO), presence of spermatogonial cells (SPG), meiotic arrest (MA) at the level of primary spermatocytes, hypospermatogenesis with decreased numbers of round/elongated spermatids (HYS), and full spermatogenesis with normal numbers of round/elongated spermatids (FS)). Sample size (n) for each group is given below the abscissa. (B) Same as in (A), but for MGAT1. Note the decreasing transcript abundance, which is a common observation for somatic transcripts in the presence of increasing germ cell content (Cappallo-Obermann et al., 2013).
-
Figure 10—source data 1
R code and comma-delimited data files for generating Figure 10.
The R code files import the data files and exactly reproduce Figure 10. The data file contains the log2-transformed expression values for MGAT4D and MGAT1 for sample replicates of different spermatogenic arrest states, as described in Spiess et al. (Hum Reprod 22, 2936–2946, 2007).
- https://doi.org/10.7554/eLife.08916.019
Tables
Table 1
Primers for expression constructs
| GnT1IP-L-Myc |
| For: 1301: (HindIII, Kozak) CAGATCAAGCTTCCACCATGTGCCTGGGAGAAAGTGTTGGGGACC |
| Rev: 1346: (Myc, BamH1) GACTAGGGATCCCTACAGATCCTCTTCTGAGATGAGTTTTTGTTCGTAATAATTATCCTTGAGGTGC |
| Myc-GnT1IP-L |
| For: 1312: (HindIII, Kozak, Myc) CAGATCAAGCTTCCACCATGGAACAAAAACTCATCTCAGAAGAGGATCTGTGCCTGGGAGAAAGTGTTGGGGACC |
| Rev: 1313: (BamH1) GCCTGTGGATCCCTAGTAATAATTATCCTTGAGGTGCTG |
| HA-GnT1IP-L |
| For: 1068: (HindIII, Kozak, HA-GnT1IP-L) GGAACTAAGCTTCCACCATGTACCCTTATGACGTCCCCGATTACGCCAGCCTGTGCCTGGGAGAAAGTG TTGGGG |
| Rev: 1313 |
| GnT1IP-L (F/L) |
| For: 1431: CTCTTAGCCTTAGTTGCCGTCCTGCTCTTAGGTTTATCGTGTTTATGC |
| Rev: 1432: GCATAAACACGATAAACCTAAGAGCAGGACGGCAACTAAGGCTAAGAG |
| GnT1IP-L (F/A) |
| For: 1467: CTCGCCGCCGCCGTTGCCGTCCTGCTCGCTGGTGCCTCGTGTGCCTGC |
| Rev: 1468: GCAGGCACACGAGGCACCAGCGAGCAGGACGGCAACGGCGGCGGCGAG |
| GnT1IP-L-Myc-KDEL |
| For: 1301 |
| Rev: 1471: (BamH1 Myc-KDEL) GGATCCCTACAACTCATCTTTCAGATCCTCTTCTGAGATGAG |
| MGAT1/GnT1IP-L-Myc |
| For: 1282 (HindIII, Kozak) GGACCGAAGCTTCCACCATGCTGAAGAAGCAGTCTGCAGGGC |
| Internal: MGAT1/GnT1IP-L |
| Rev: 1434: TTGATTATTGGTTTGGTTCATCCTCCAGAAGAAGAGGAGCAGCAG |
| For: 1433: CTGCTGCTCCTCTTCTTCTGGAGGATGAACCAAACCAATAATCAA |
| Rev: 1346: (BamH1, Myc) GACTAGGGATCCCTACAGATCCTCTTCTGAGATGAGTTTTTGTTCGTAATAATTATCCTTGAGGTGC |
| MGAT1/GnT1IP-L-Myc-KDEL |
| For: 1282 |
| Rev: 1471: (BamH1, Myc-KDEL) GGAGTCGGATCCCTACAACTCATCTTTCAGATCCTCTTCTGAGATGAG |
| Iv/GnT1IP-L-Myc |
| For: 1435: (HindIII, Kozak) GGACCGAAGCTTCCACCATGCACAGGAGGAGAAGCAGG |
| Internal Iv/GnT1IP-L |
| Rev: 1436: CAAGTTAACGTTCTTGGCCTTCATTCCGCGGCTGCACTTGCTCTC |
| For: 1437: GAGAGCAAGTGCAGCCGCGGAATGAAGGCCAAGAACGTTAACTTG |
| Rev: 1346: (BamH1, Myc) |
| Iv/GnT1IP-L-Myc-KDEL |
| For: 1435 |
| Rev: 1471 |
| GnT1IP-L/MGAT1-Myc |
| For: 161: (Kozak) GCCACCATGTGCCTGGGAGAAAGTGTTGGGGACCTG |
| Internal (MGAT1/GnT1IP-L) |
| Rev: 162: GTCTGAGGGCAGCCTGCCAGGTGCTGGGCGGGAGATGCAGAAACACGAGAAACCAAAGAG |
| For: 163: CTCTTTGGTTTCTCGTGTTTCTGCATCTCCCGCCCAGCACCTGGCAGGCTGCCCTCAGAC |
| Rev: 164: (MGAT1-Myc) CTACAGATCTTCTTCAGAAATAAGTTTTTGTTCATTCCAGCTAGGATCATAGCCAGTCCATGT |
Table 2
Glycosyltransferase activities in CHO cells expressing HA-GnT1IP-L
| Cells | B4GALT1 nmol/mg/hr | MGAT1 nmol/mg/hr | MGAT2 nmol/mg/hr | MGAT5 nmol/mg/hr |
|---|---|---|---|---|
| CHO Ratio to B4GALT1 | 15.6 (11–23.8) – | 4.2 (3.2–5.5) 0.27 | 0.41 (0.4–0.42) 0.026 | 0.34 (0.35–0.48) 0.022 |
| CHO/HA-GnT1IP-L Ratio to B4GALT1 | 11.5 (9.7–13.2) – | 1.1 (0.9–1.3) 0.096 | 0.38 (0.16–0.61) 0.033 | 0.33 (0.24–0.41) 0.028 |
| Ratio activity GnT1IP-L:CHO | 0.74 | 0.26 | 0.93 | 0.97 |
-
Glycosyltransferase assays were performed as described in ‘Materials and methods’ on cell extracts from CHO cells and CHO cells stably expressing HA-GnT1IP-L. Each assay was performed in duplicate, and activity (with range) is given as the average of duplicates for 2–3 independent assays.
Additional files
-
Source code 1
Glycosyltransferase assay data for CHO cells expressing HA-GnT1IP-L.
- https://doi.org/10.7554/eLife.08916.020
Download links
A two-part list of links to download the article, or parts of the article, in various formats.
Downloads (link to download the article as PDF)
Open citations (links to open the citations from this article in various online reference manager services)
Cite this article (links to download the citations from this article in formats compatible with various reference manager tools)
GnT1IP-L specifically inhibits MGAT1 in the Golgi via its luminal domain
eLife 4:e08916.
https://doi.org/10.7554/eLife.08916


