The splicing regulators Esrp1 and Esrp2 direct an epithelial splicing program essential for mammalian development
- Perelman School of Medicine, University of Pennsylvania, United States
- University of California, Los Angeles, United States
Figures
Figure 1 with 4 supplements
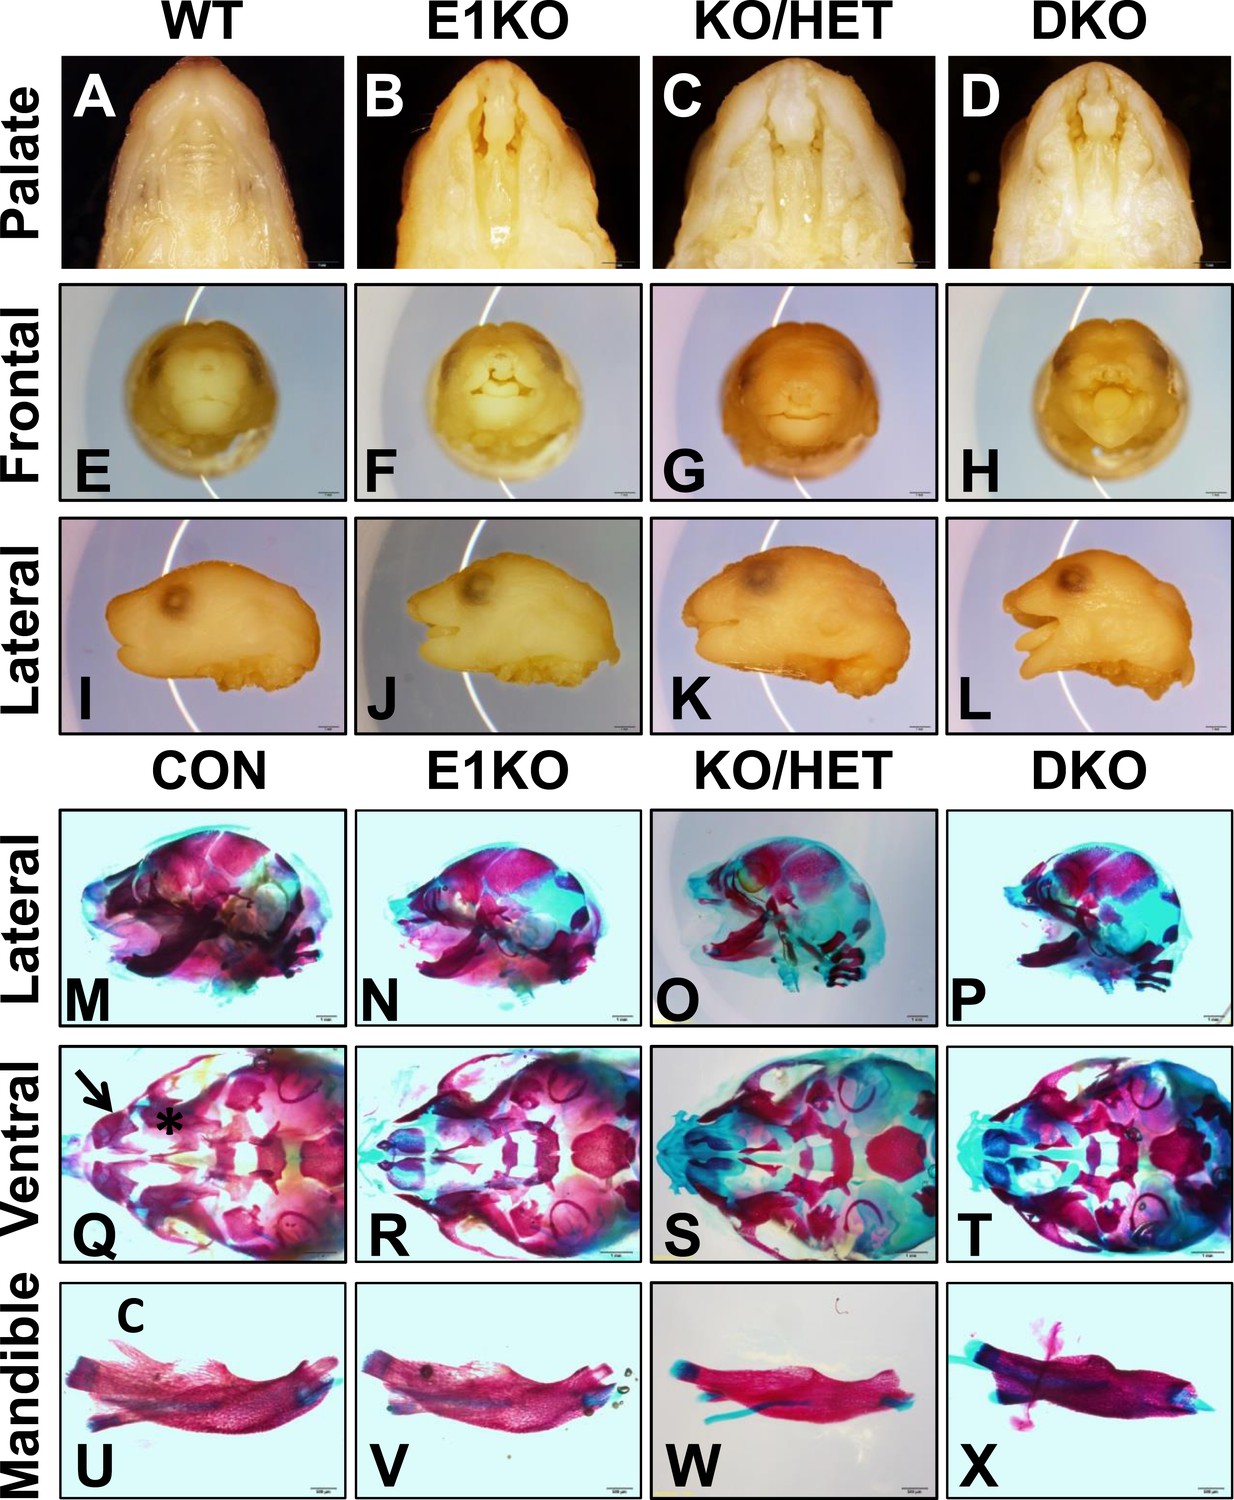
Esrp knockout (KO) mice have defects in craniofacial development.
(A–D) E18.5 palatal images of Esrp KO mice reveal bilateral cleft lip and cleft palate (CL/P) (n = 4 for each genetic group). (E–L) Frontal (E–H) and lateral (I–L) images Esrp KO mice show bilateral cleft lip and rostral malformation/foreshortening (n = 4 for each genetic group). (M–X) Alizarin Red/Alcian Blue Bone and cartilage stains of E18.5 embryos (n = 3 for each genetic group). (M–P) Esrp KO mice exhibit rostral shortening and mandibular malformation. (Q–T) Esrp KO mice have palatal hypoplasia and absence of premaxillary bones consistent with CL/P. Premaxilla bone (arrow in Q) and palatal bone (* in Q) are indicated in control embryos. (U–X) Mandibles of Esrp KO mice lack the coronoid process (C). DKO mandibles are profoundly malformed (X).
Figure 1—figure supplement 1
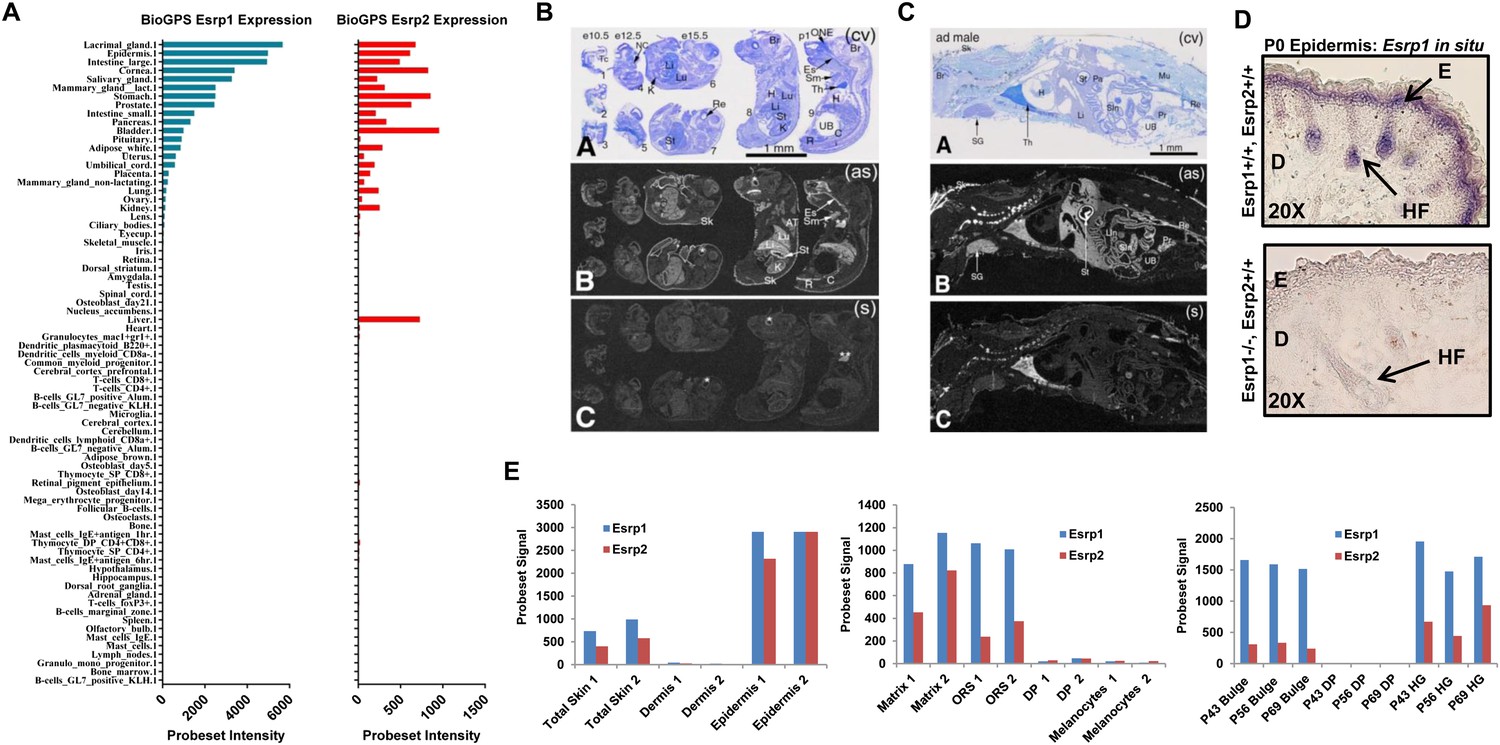
Esrp1 and Esrp2 expression in tissues and cells of embryonic and adult mice.
(A) Graphical representation of Esrp1 (blue) and Esrp2 (red) expression in mouse tissues and cells (BioGPS) (Su et al., 2002). Relatively overlapping expression patterns for Esrp1 and Esrp2, except in the Liver where Esrp2 is expressed and Esrp1 is not. (B) (Panel A) Array of whole-body sections with e10.5 (#1–#3), e12.5 (#4 and #5), e15.5 (#6 and #7) and postnatal (#8 and #9) mice following staining with cresyl violet. (Panel B) X-ray film autoradiography detection of Esrp2 mRNA, seen as bright labeling. The labeling is clearly detectable at stage e15.5 in the skin. Pronounced signal is detectable in postnatal mice skin, olfactory neuroepithelium, esophagus, stomach and rectum. Moderate labeling is seen in submaxillary gland, liver, lung and kidney. (Panel C) Control (sense) hybridization in an adjacent section comparable to (panel B). (C) (Panel A) Whole-body sections of adult mouse (male) following staining with cresyl violet. (Panel B) X-ray film autoradiography detection of Esrp2 mRNA. The expression pattern encompasses skin, stomach, intestine and gut-associated salivary glands and liver. In the stomach, Esrp2 is expressed in glandular epithelium, but not in non-glandular epithelium. Non-specific labeling is seen in bone (*) and thymus (**). (Panel C) Control (sense) hybridization. Abbreviations: AT—adipose tissue; Br—brain; C—colon; Es—esophagus; H—heart; K—kidney; Li—liver; Lu—lung; Mu—skeletal muscles; NC—nasal chamber; ONE—olfactory neuroepithelium; Pa—pancreas; R(embryo)/Re(adult)—rectum; Re (embryo)—retina; Sm—submaxillary gland; St—stomach; Tc—telencephalon; Th—thymus; UB—urinary bladder; (as)—antisense; (s)—sense (Magnification: 2.4×). (D) Digoxigenin-UTP-labeled in situ hybridization of Esrp1 in P0 epidermis of WT (Esrp1+/+, Esrp2+/+) and KO (Esrp1−/−, Esrp2+/+). Esrp1 expression in restricted to the basal keratinocyte (including epithelial cells of the hair follicle) to the granular layer of the epidermis, and absence of signal in the Esrp1 KO epidermis. E: Epidermis, D: Dermis, HF: Hair follicle. (E) Expression of Esrp1 and Esrp2 from published microarrays. Esrp1 and Esrp2 are enriched in the epithelial compartments of the skin and associated appendages: Epidermis, Matrix, Outer Root Sheath (ORS), Bulge cells, and Hair Germ (HG) while absent in the non-epithelial cells: Dermis, Dermal Papilla (DP), and Melanocytes. Graphs from left to right: (Zhang et al., 2008, GSE10773), (Rendl et al., 2005, GSE3142), and (Greco et al. 2009, GSE15185) represent Esrp1 and Esrp2 expression from publically available microarray data.
Figure 1—figure supplement 2
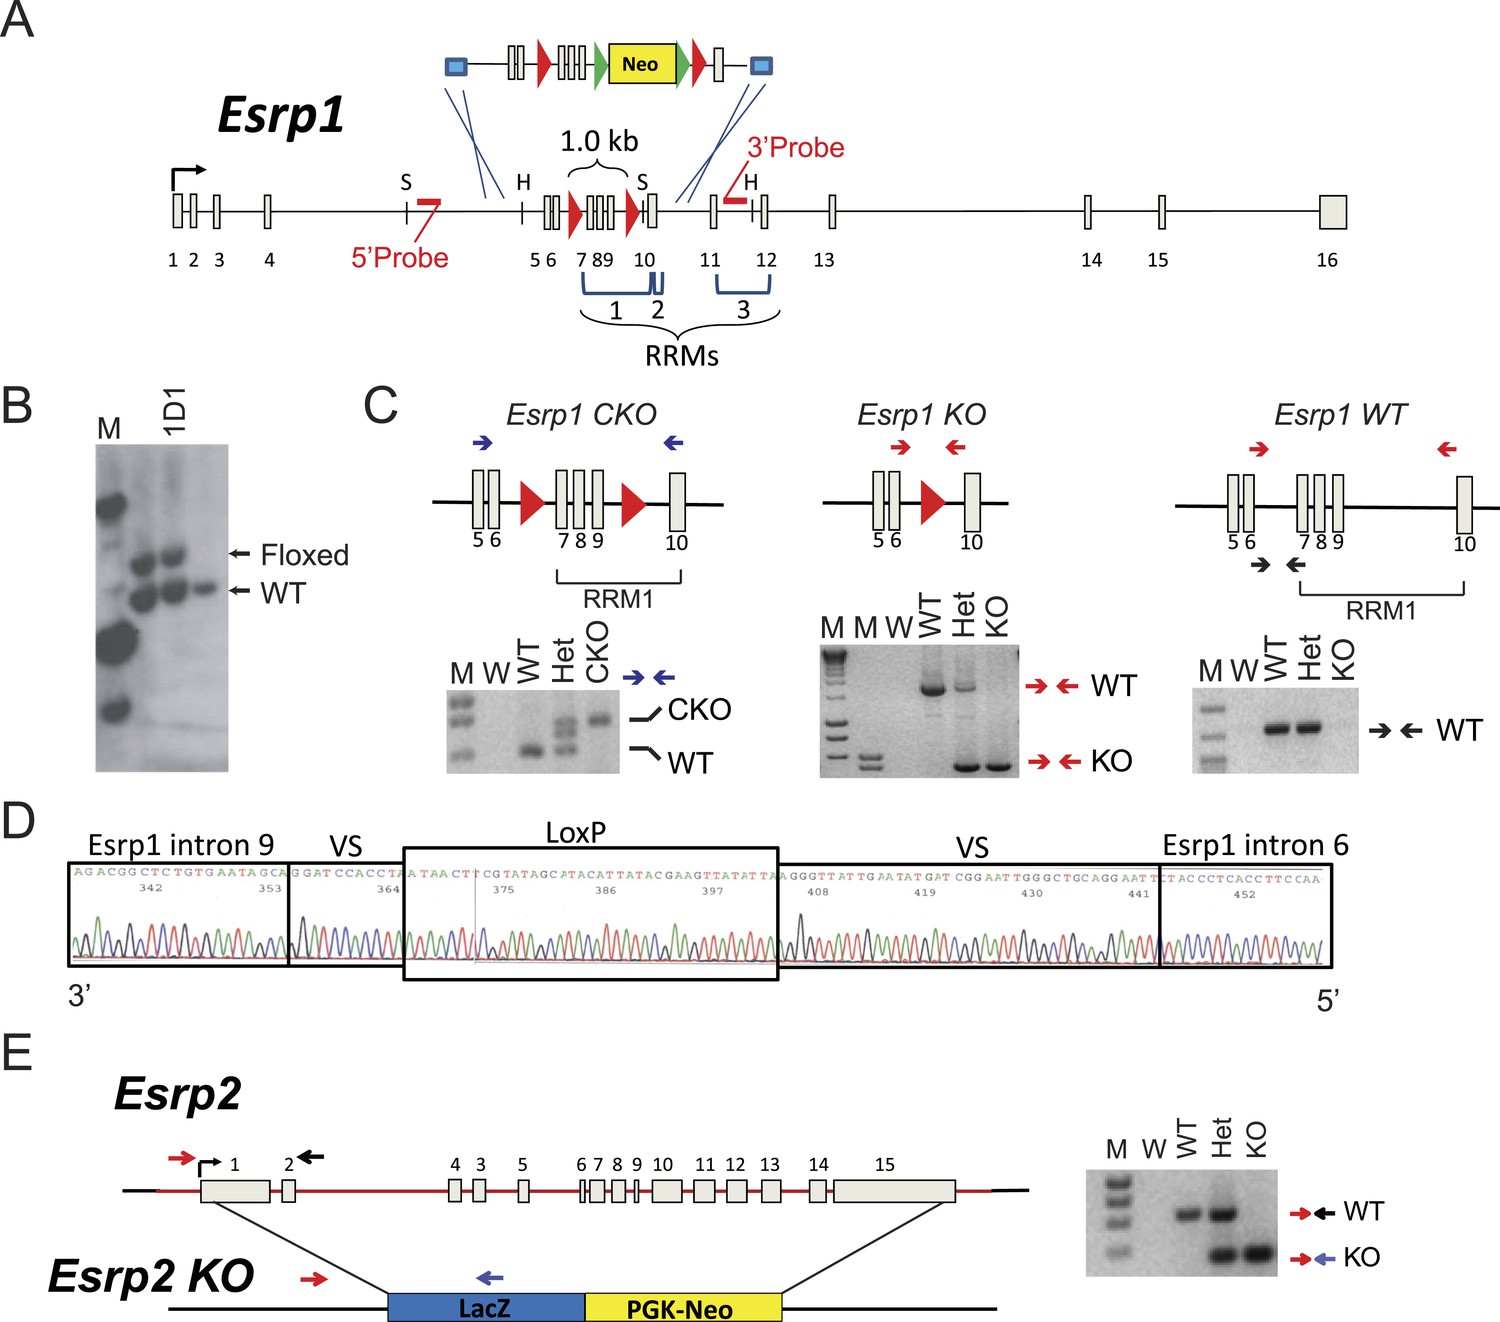
Generation of Esrp1 and Esrp2 KO alleles.
(A) Schematic of the knock-in strategy used for generation of the Esrp1 floxed allele for conditional and ubiquitous KO. The floxed neomycin cassette targeted exons 7–9. Restriction site for SacI (S) and HincII (H) are indicated. The RNA Recognition Motifs (RRMs) 1–3 are indicated by brackets and loxP sites are red triangles. (B) Southern blot validation of V6.5, hybrid C57BL6/129Sv, mouse ES cells used for blastocyst injection. Clone 1D1 was verified as heterozygous, a representative southern is shown. (C) Schematic and genotyping for Esrp1 CKO (floxed), KO, and WT alleles are shown. Primers are indicated by arrows and representative genotyping gels are presented. (D) Sequencing histogram of the KO PCR product confirms Cre-mediated recombination. VS: variable sequence, as part of the targeting construct. (E) Schematic of full gene replacement of Esrp2 by LacZ:PGK-Neo cassette generated by Knockout Mouse Project and purchased from Velocigene. A representative genotyping gel is presented.
Figure 1—figure supplement 3
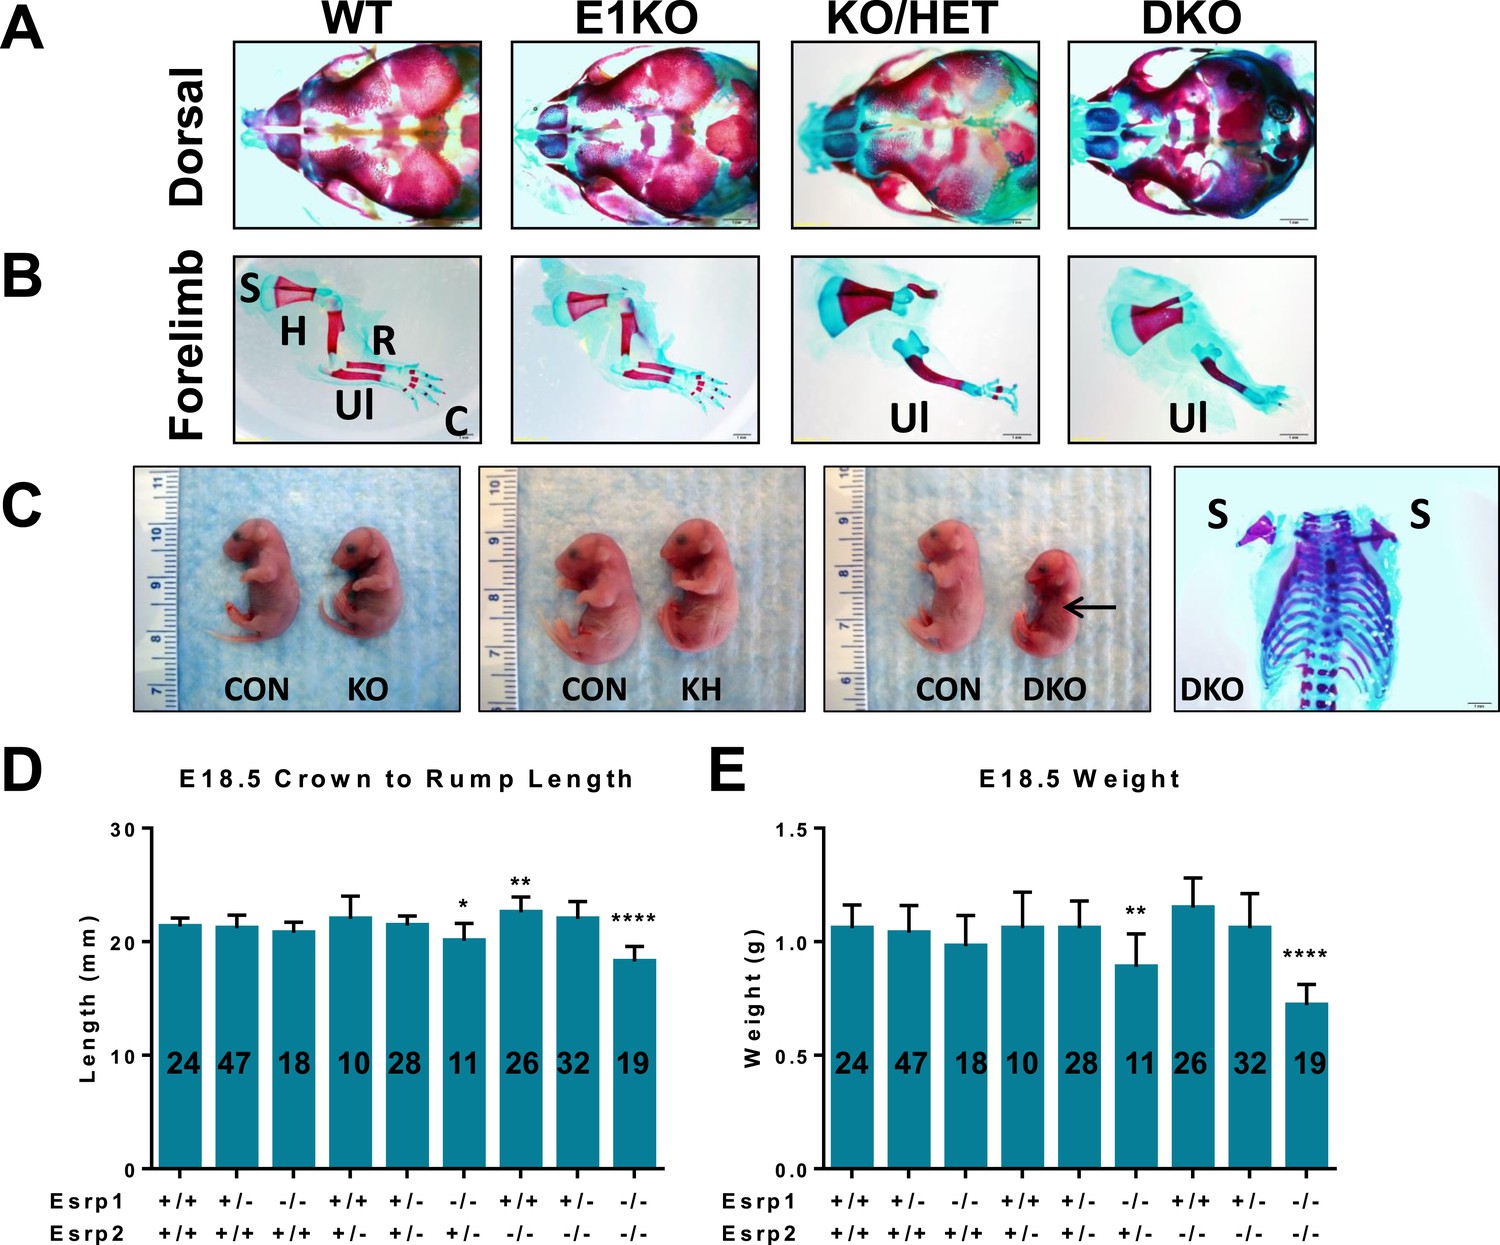
Phenotypes in Esrp KO embryos.
(A) Dorsal aspect of E18.5 embryo bone and cartilage stains reveals hypoplasia of nasal and premaxilla bones. The rostral foreshortening is more pronounced in KO/HET and DKO embryos (n = 3). (B) Esrp KO/HET and DKO mice lack radius and humerus bones, and exhibit forepaw syndactyly. Scapula (S), humerus (H), radius (R), ulna (Ul), and carple (C) bones are indicated. (C) Gross pictures of E18.5 Esrp deficient embryos show forelimb and cranial defects. A representative bone and cartilage stain of a DKO embryo with forelimb agenesis of both left and right forelimbs is presented. (D, E) Average crown to rump length (D) and weights (E) of E18.5 embryos. One-way ANOVA multiple comparisons analysis. Adjusted p-values for multiple comparisons (*) p < 0.05, (**) p < 0.01, (***) p < 0.001, (****) p < 0.0001.
Figure 1—figure supplement 4

Organogenesis defects in Esrp deficient embryos.
Sagittal sections were generated from WT, KO, and DKO E15.5 embryos. Indicated organs were evaluated for gross morphological defects by H&E staining of sections. Esrp1/Esrp2 DKO embryos do not form lungs (*) and salivary glands (arrow). Thoracic, lung, and kidney images were taken at 4×. Thymus and salivary images were taken at 10× (except for the DKO salivary section for orientation and clear indication of salivary gland agenesis) (n = 3 for each genetic group).
Figure 2 with 1 supplement
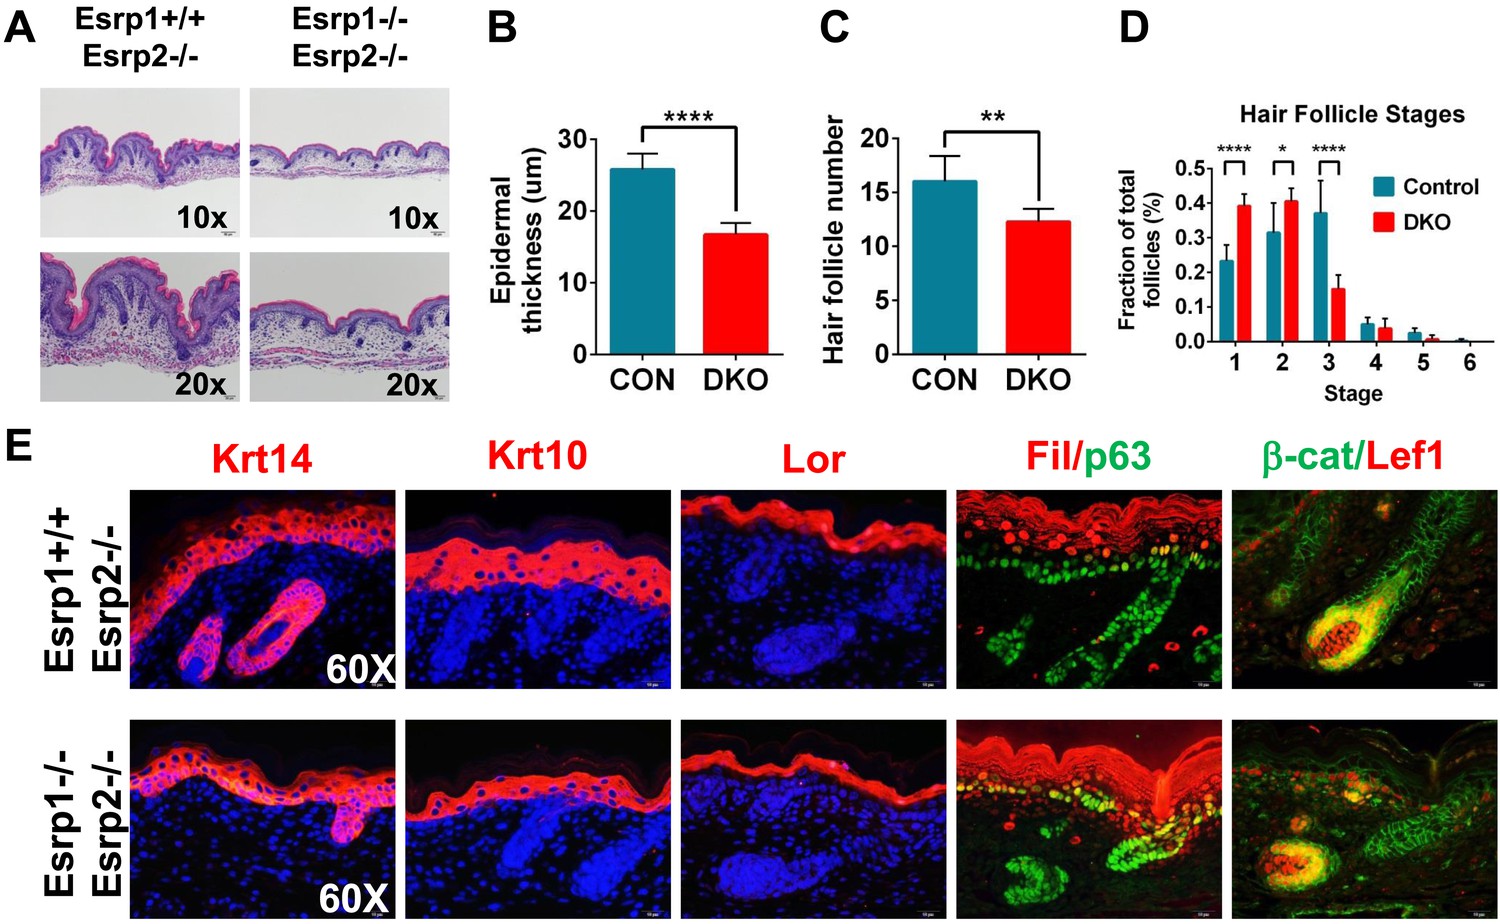
KO of Esrp1 and Esrp2 results in defects in epidermal and follicular development.
(A) Representative H&E stained sections of dorsal skin from control Esrp1+/+, Esrp2−/− and Esrp DKO (Esrp1−/−, Esrp2−/−) E18.5 embryos used in B–E. (B–D) Metrics of epidermal thickness measured from basal keratinocyte layer to granular layer (B), hair follicle number measured over 9 fields of view (C), and hair follicle stages from Esrp DKO (n = 6) and control (CON) (n = 8) littermates. Two-tailed Student's t-test was used for B, C and 2way ANOVA multiple comparisons test for D. (E) Immunofluorescence of skin differentiation markers for basal keratinocytes (Krt14 and p63), spinous layer (K10), cornified layer (Loricrin (Lor)), and granular layer (Filaggrin (Fil)). β-catenin and its transcriptional target Lef1 are markers of developing hair follicles (n = 3).
Figure 2—figure supplement 1

KO of Esrp1 and Esrp2 results in defects in epidermal development and hair follicle formation.
Immunofluorescence of skin differentiation markers for basal keratinocytes (Krt14 and p63), spinous layer (Krt10), cornified layer (Loricrin (Lor), and granular layer Filaggrin (Fil)). β-catenin and its transcriptional target Lef1 are markers of developing hair follicles. Note the thinner epidermal layers and disorganized basal keratinocyte layer (p63). While fewer hair follicles are present in DKO skin nuclear β-catenin and Lef1 are present in the DP and developing hair (n = 3).
Figure 3
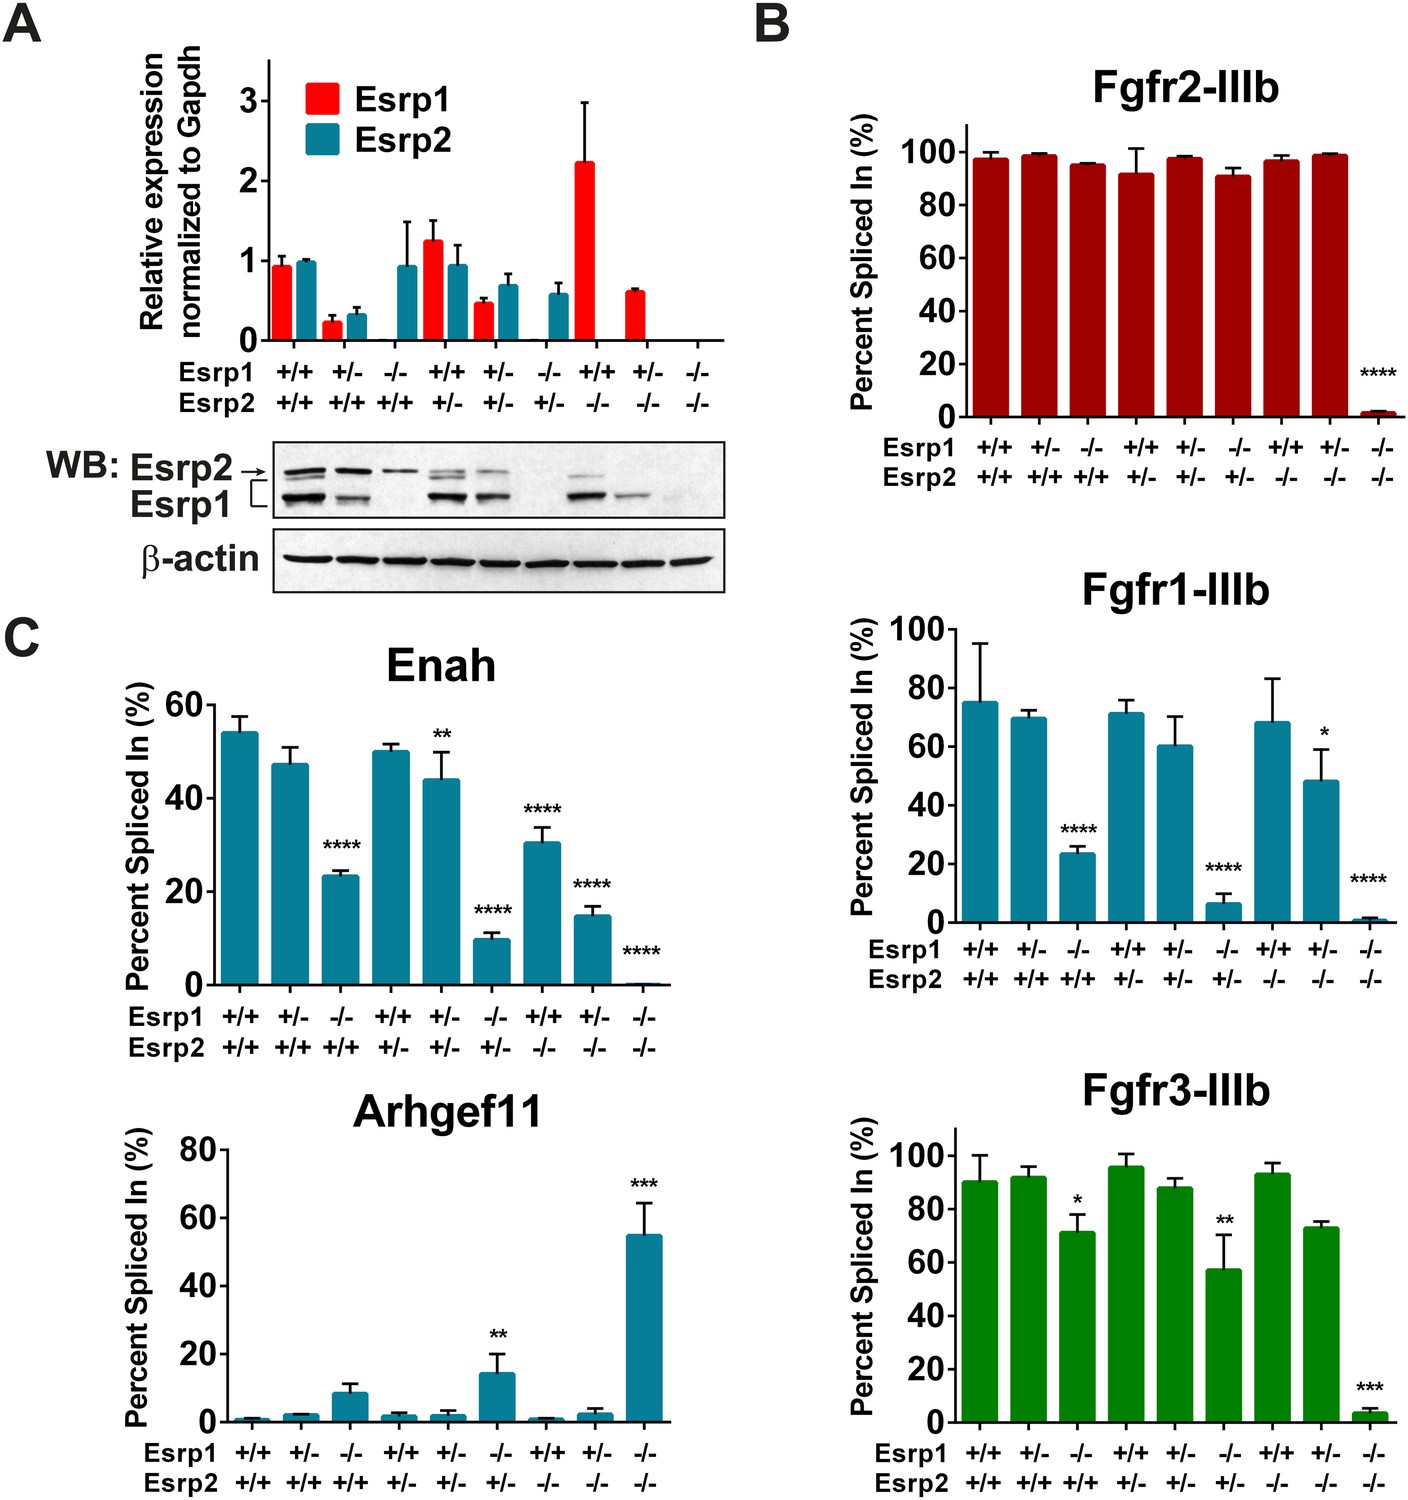
Esrp regulated splicing events show variable sensitivity to loss of Esrp1 and Esrp2.
(A) qRT-PCR expression of Esrp1 and Esrp2 in purified E18.5 epidermis from the designated genetics of Esrp1 and Esrp2 KO embryos (n = 3). Western blot confirmation of Esrp1 and Esrp2 KO in purified epidermis from E18.5 embryos (n = 2). (B) Graphical representation of the epithelial -IIIb exon inclusion rates for Fgfr1, Fgfr2, and Fgfr3 in epidermis (n = 3). (C) Esrp regulated splicing events in Enah and Arhgef11. Graphical representation of Percent Spliced in (PSI) are presented (n = 3). Two-way ANOVA multiple comparisons tests statistical analysis was used and all groups were compared to Esrp1+/+, Esrp2+/+ (WT). Statistical indications for p-values, *<0.05, **<0.01, ***<0.001, ****<0.0001.
Figure 4 with 2 supplements

Global analysis of Esrp-mediated alternative splicing (AS) in epidermis.
(A) Heatmap representing the predicted ΔPSI values for skipped exon (SE) events from KO, KH, and DKO epidermis compared to WT. Summary table of total detected splicing events in KO, KH, and DKO strand-specific RNA-seq. Venn diagram depicting overlap in detected SE events in KO, KH, and DKO datasets. Splicing events detected by rMATS at a FDR < 5% and |deltaPSI| ≥ 5% are depicted here. (B) Graphs for PSI for six Esrp targets are shown. Representative radioactive RT-PCR PAGE gels are presented. All events measured are from three independent biological samples. Two-way ANOVA multiple comparisons tests statistical analysis was used and all groups were compared to Esrp1+/+, Esrp2+/+ (WT). (C) Representative UCSC custom genome browser snapshots of Esrp1 KO full switch (Fam213b), gradual (Lsm14b), and DKO only (Arhgef10l) SE splicing events. Negative strand transcripts are shown in faded colors compared to bold colored positive strand transcripts. (D) Graphical representation of the predicted deltaPSI of 25 ssRNA-seq targets from WT vs DKO rMATS analysis, compared to the RT-PCR validated deltaPSI. Pierson Correlation with r- and p-values is indicated.
-
Figure 4—source data 1
rMATS analysis of Esrp deficient epidermis.
- https://doi.org/10.7554/eLife.08954.012
-
Figure 4—source data 2
RNAseq and RT-PCR validated SE splicing events.
- https://doi.org/10.7554/eLife.08954.013
Figure 4—figure supplement 1
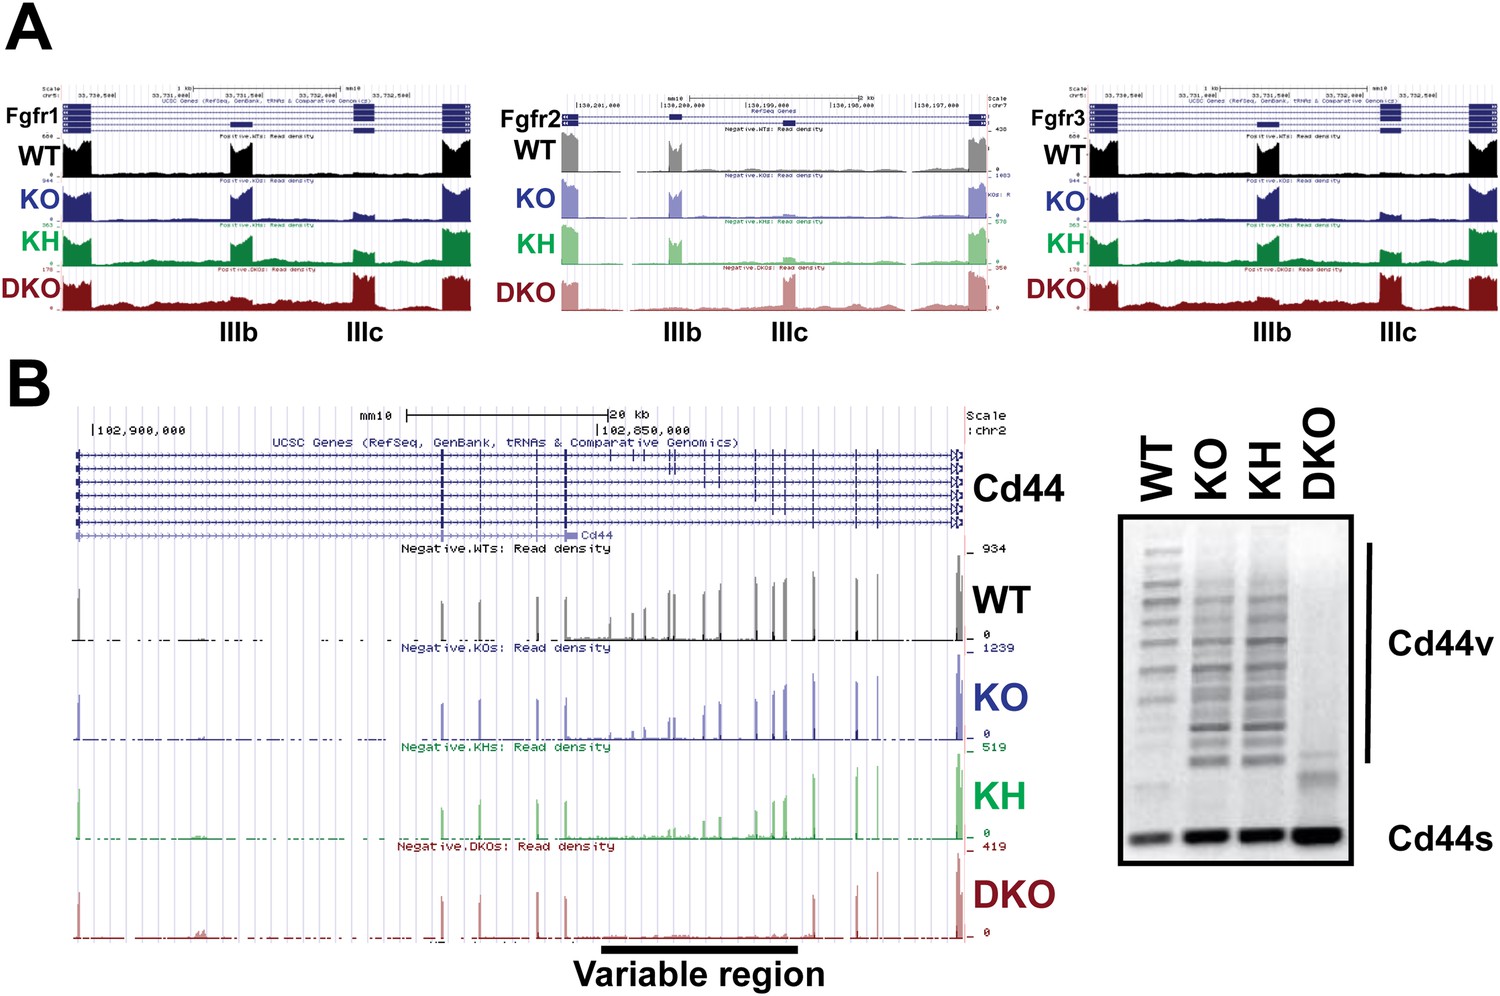
The Esrps regulate AS of the Fgfr family and Cd44 genes in epidermis.
(A) Strand-specific RNA-seq custom UCSC genome browser snapshots of Fgfr1-, Fgfr2-, and Fgfr3-IIIb and -IIIc mutually exclusive splicing events. These tracks confirm the variable sensitivity of this family of mutually exclusive splicing events to loss of Esrp1 and Esrp2. All three Fgfr transcripts include the mesenchymally expressed -IIIc isoform when both Esrp1 and Esrp2 are knocked out. Fgfr2 shows no switch in splicing until both Esrps are ablated, whereas both Fgfr1 and Fgfr3 show variable sensitivity to Esrp1 and Esrp2 loss. Negative strand transcripts are shown as faded colors compared to bold colored positive strand transcripts. (B) Strand-specific RNA-seq custom UCSC genome browser snapshot of the Cd44 gene. Inclusion of the variable region (10 exons) results in the multiple isoforms termed the Cd44v which are expressed in epithelial cells. KO of Esrp1 and Esrp2 results in full conversion of Cd44v to the mesenchymally expressed Cd44s (short) isoform. This confirms the Esrps also regulate the complex splicing of 10 consecutive exons in Cd44 in vivo. Representative gel of an ethidium bromide stained agarose gel of a Cd44 RT-PCR is shown (n = 3).
Figure 4—figure supplement 2

RT-PCR validation of Esrp regulated SE splicing events.
(A) Graphical representation of Esrp enhanced and silenced SE events identified from strand-specific RNA-seq and previously identified orthologous splicing events from in vitro cell based splicing analysis. The average PSI of replicate validations (n = 3) and individually validated splicing events are plotted for WT, KO, KH, and DKO samples. Events are organized left to right from full switch with loss of Esrp1, gradual, to splicing switch only after DKO. (B) Radioactive RT-PCR analysis from total epidermis for rMATS detected SE events. (C) RT-PCR evaluation of three SE events observed in KO/KH (Exoc1 and Stx2) or KH (Golga2), but not in the DKO rMATS analysis. All three exhibit a larger ΔPSI in the DKO sample compared to the KO or KH samples, indicating these as false negatives rather than non-overlapping SE events (n = 2).
Figure 5 with 1 supplement
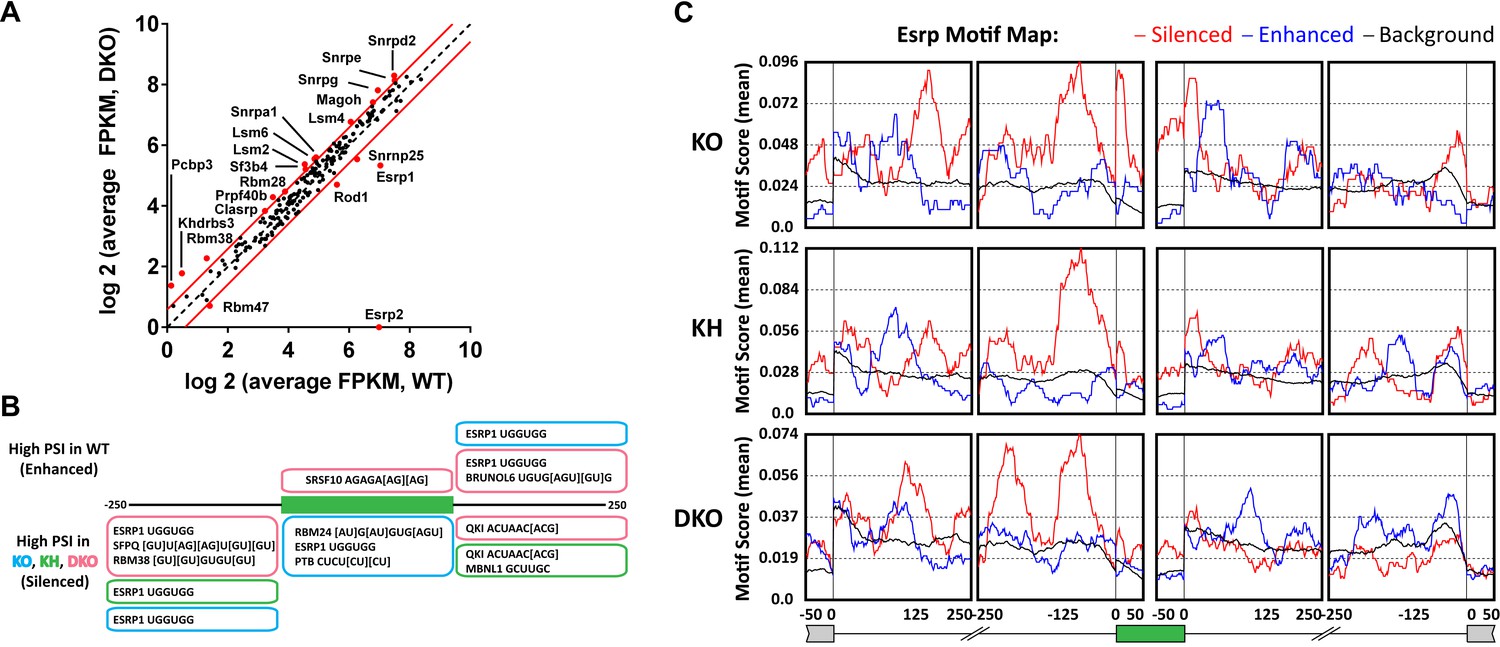
Esrp and known splicing factors RNA binding motif enrichment in Esrp-regulated SE events.
(A) Differential gene expression of 188 mouse orthologues of known human RNA binding proteins (RBPs) or other putative splicing factors with at least 1.5-fold change in expression. Gene expression levels are from Cuffdiff v2.2.0. (B) Motif enrichment for RNA binding motifs of known splicing factors for SEs identified from KO (blue), KH (green), or DKO (pink) rMATS analysis. (C) RNA binding map for the top 12 Esrp bound 6-mer motifs identified by SELEX-seq. Maps for Esrp motif enrichment for SE events from the KO, KH, and DKO rMATS analysis are shown for silenced (red) and enhanced (blue) splicing events.
-
Figure 5—source data 1
Differential gene expression of splicing factors in Esrp deficient epidermis.
- https://doi.org/10.7554/eLife.08954.017
-
Figure 5—source data 2
Enriched known RNA binding motifs in Esrp regulated SE splicing events.
- https://doi.org/10.7554/eLife.08954.018
-
Figure 5—source data 3
Enriched 6-mers in Esrp regulated SE splicing events.
- https://doi.org/10.7554/eLife.08954.019
Figure 5—figure supplement 1

Differential gene expression of RBPs in Esrp KO and KH epidermis.
(A) Differential gene expression of 188 mouse orthologues of known human RNA binding proteins or other putative splicing factors with at least 1.5-fold change in expression. Gene expression levels are from Cuffdiff v2.2.0.
Figure 6

Global analysis of differential gene expression in Esrp KO epidermis.
(A) Heatmap of differentially expressed genes (DEGs) in Esrp KO epidermis. Table of the total number of DEGs from WT comparisons to KO, KH, and DKO samples. Venn diagram depicting the overlap in DEGs from WT comparisons to KO, KH, and DKO samples. (B) Functional gene ontology (GO) term enrichment of DEGs from the WT vs DKO comparison (indicated FDR [Benjamini-Hochberg] <0.05 as calculated by DAVID 6.7 are listed). (C) qRT-PCR validation of eight epidermal differentiation complex (EDC) genes with increased expression in DKO samples, and down regulation of three genes including the AS-mediated non-sense mediated decay (AS-NMD) target, Grhl1 (n = 3).
-
Figure 6—source data 1
DEG analysis in Esrp deficient epidermis.
- https://doi.org/10.7554/eLife.08954.022
-
Figure 6—source data 2
DAVID analysis of DEGs in DKO epidermis.
- https://doi.org/10.7554/eLife.08954.023
Figure 7
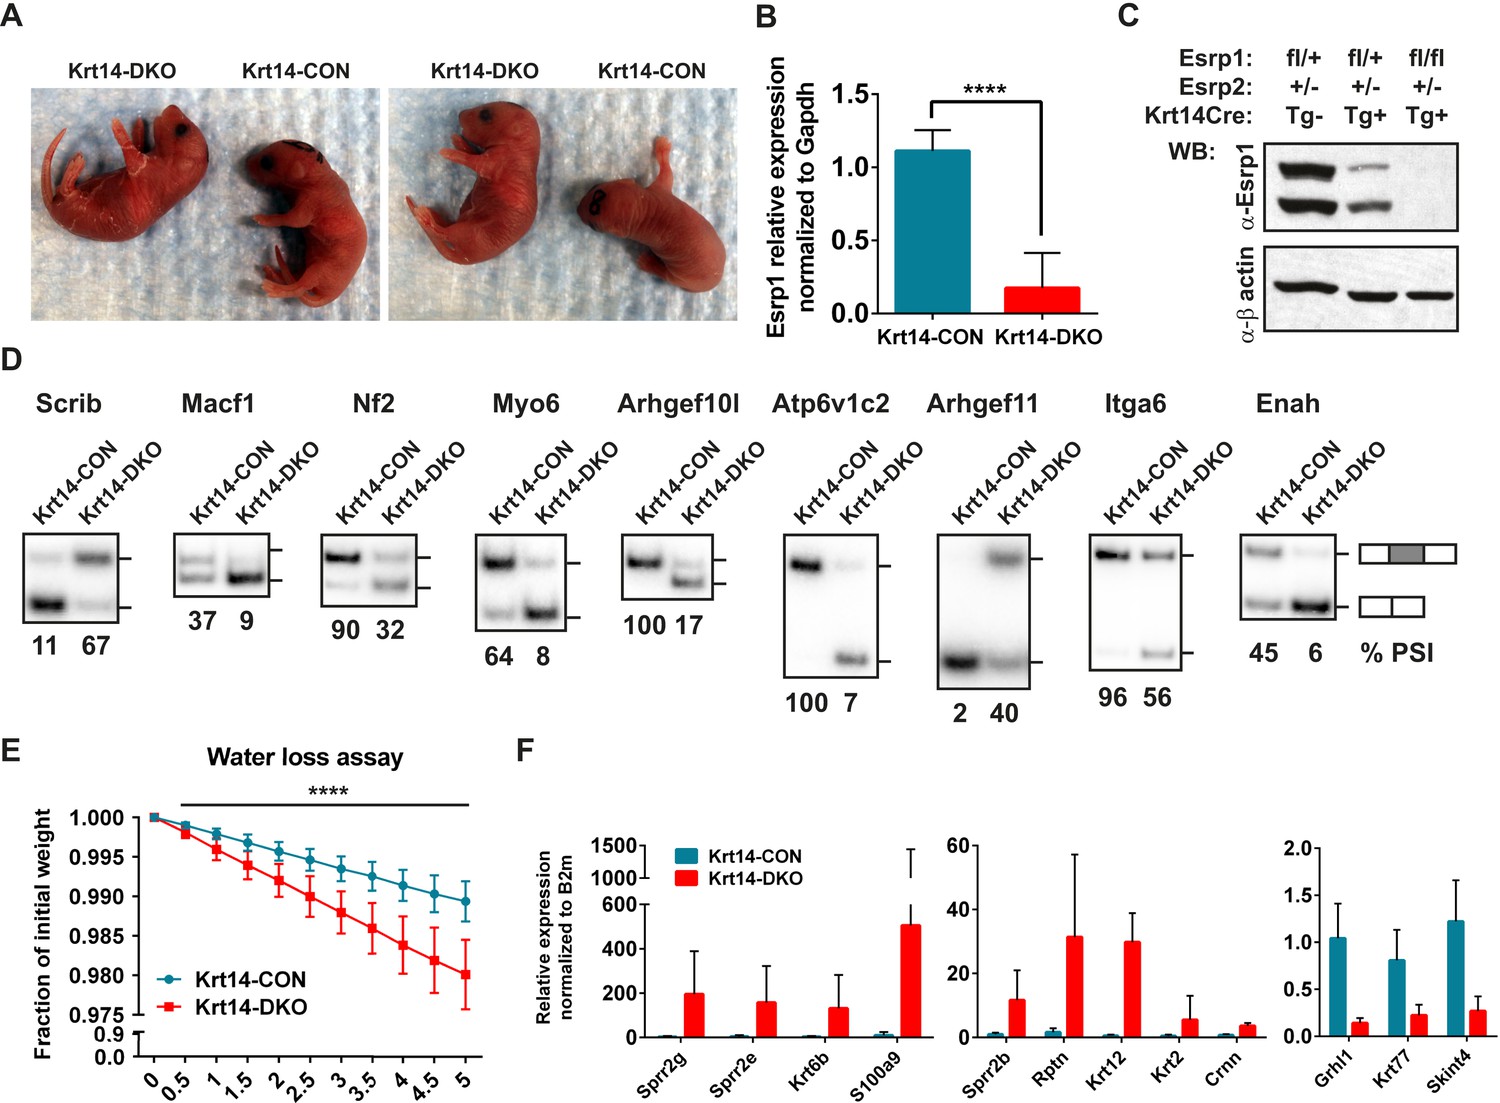
Conditional KO of the Esrps in the epidermis result in skin barrier defects.
(A) Images of P0.5 Krt14-CON and Krt14-DKO pups, which present with dry flaky skin or red shinny skin. (B) qRT-PCR validation of Keratin14-Cre mediated KO of the floxed Esrp1 targeted cassette in isolated Krt14-CON (n = 5) and Krt14-DKO (n = 6) epidermis. (C) Western validation of Esrp1 protein KO in Krt14-Cre mice harboring floxed Esrp1 alleles (n = 2). (D) Hot RT-PCR gel images of Esrp SE targets, confirming Krt14-DKO epidermis have defects in Esrp-regulated splicing targets (n = 2). (E) Water loss assay for barrier defect in P0.5 pups. Fraction of initial weight is graphed over 5 hr in 30 min intervals. Multiple t-tests analysis indicate significant differences between the Krt14-CON (n = 16) and Krt14-DKO (n = 7) pups. (F) qRT-PCR validation of nine EDC genes identified with increased expression in DKO samples, and down regulation of three genes including the AS-NMD target, Grhl1 (n = 4).
Additional files
-
Supplementary file 1
Mapping statistics for the epidermis samples used for rMATS splicing analysis. Epidermis samples and the associated reads from 2 lanes of a HiSeq 2000, 2 × 100 bp paired-end reads. Total reads and associated mapped reads when aligned to the mm10 mouse genome. Percent of mapped reads assigned to genomic regions are indicated.
- https://doi.org/10.7554/eLife.08954.025
-
Supplementary file 2
DAVID analysis of all SE splicing events.
- https://doi.org/10.7554/eLife.08954.026
-
Supplementary file 3
Primer sequences.
- https://doi.org/10.7554/eLife.08954.027
Download links
A two-part list of links to download the article, or parts of the article, in various formats.
Downloads (link to download the article as PDF)
Open citations (links to open the citations from this article in various online reference manager services)
Cite this article (links to download the citations from this article in formats compatible with various reference manager tools)
The splicing regulators Esrp1 and Esrp2 direct an epithelial splicing program essential for mammalian development
eLife 4:e08954.
https://doi.org/10.7554/eLife.08954


