An extrafollicular pathway for the generation of effector CD8+ T cells driven by the proinflammatory cytokine, IL-12
- Rutgers University, United States
- National University of Singapore, Singapore
Figures
Figure 1 with 2 supplements
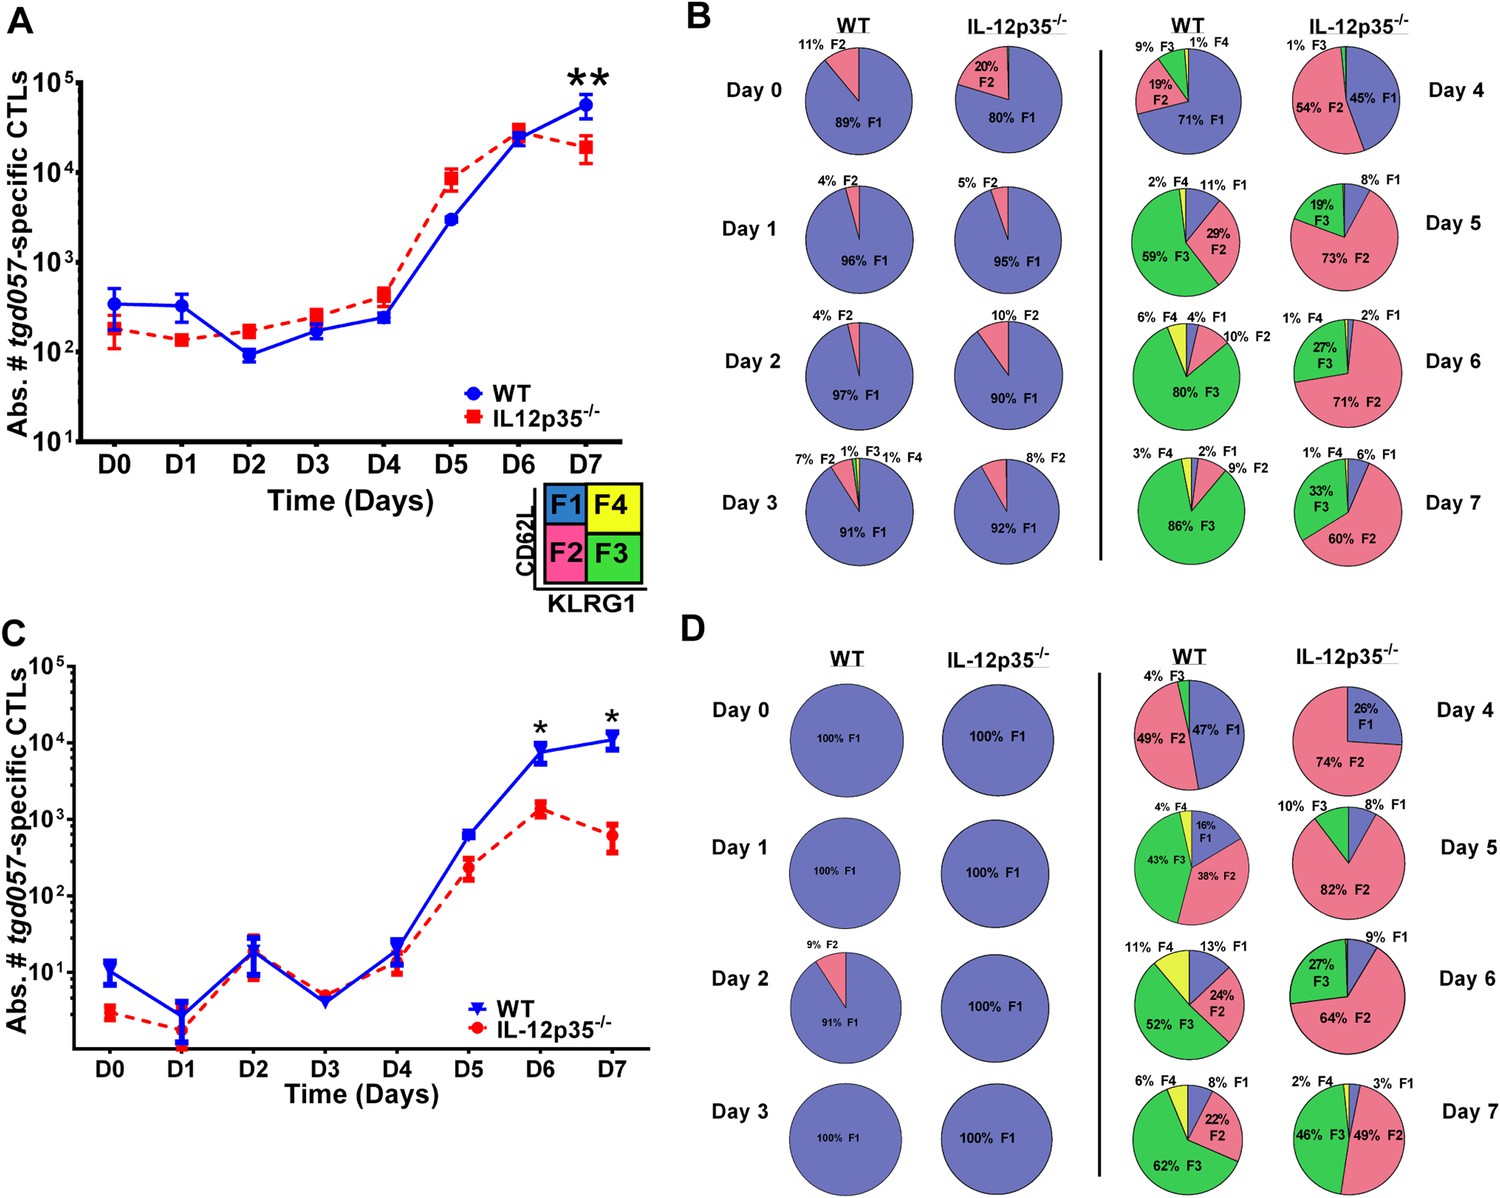
CD8+ T cell proliferative response is IL-12 independent while effector cell differentiation is IL-12 dependent.
(A) Absolute numbers of tgd057-specific CD8+ T cells in spleen after CPS vaccination in wild-type (WT) and IL-12p35−/− mice. (B) tgd057-specific CD8+ T cells were analyzed for CD44, CD62L and KLRG1 cell surface expression. Pie charts represent frequency averages of F1 (CD62L+ KLRG1−), F2 (CD62L−, KLRG1−), F3 (CD62L−, KLRG1+), and F4 (CD62L+, KLRG1+) subsets of tgd057-specific CD8+ T cells from WT and IL-12p35−/− spleens D0–D7 post CPS vaccination. Data shown include only CD44hi cells on D4–D7 and include all tgd057-specific CD8+ T cells on D0–D3. (C) Absolute numbers of tgd057-specific CD8+ T cells in peritoneal exudate cells (PECs) of WT and IL-12p35−/− mice after CPS vaccination. Cells were characterized based on tgd057-specific CD8+ T cells. (D) Average of frequencies of F1 (CD62L+ KLRG1−), F2 (CD62L−, KLRG1−), F3 (CD62L−, KLRG1+), and F4 (CD62L+, KLRG1+) subsets of tgd057-specific CD8+ T cells in PECs D0–D7. Data represent 5 independent experiments with 3–5 mice per group per experiment. Data were analyzed using two-way ANOVA and (A) Holms-Sidak or (C) Bonferroni post-hoc tests; *p < 0.05. See Figure 1—figure supplements 1, 2 for the methodology employed to enumerate absolute numbers of tgd057-specific CD8+ T cells.
Figure 1—figure supplement 1
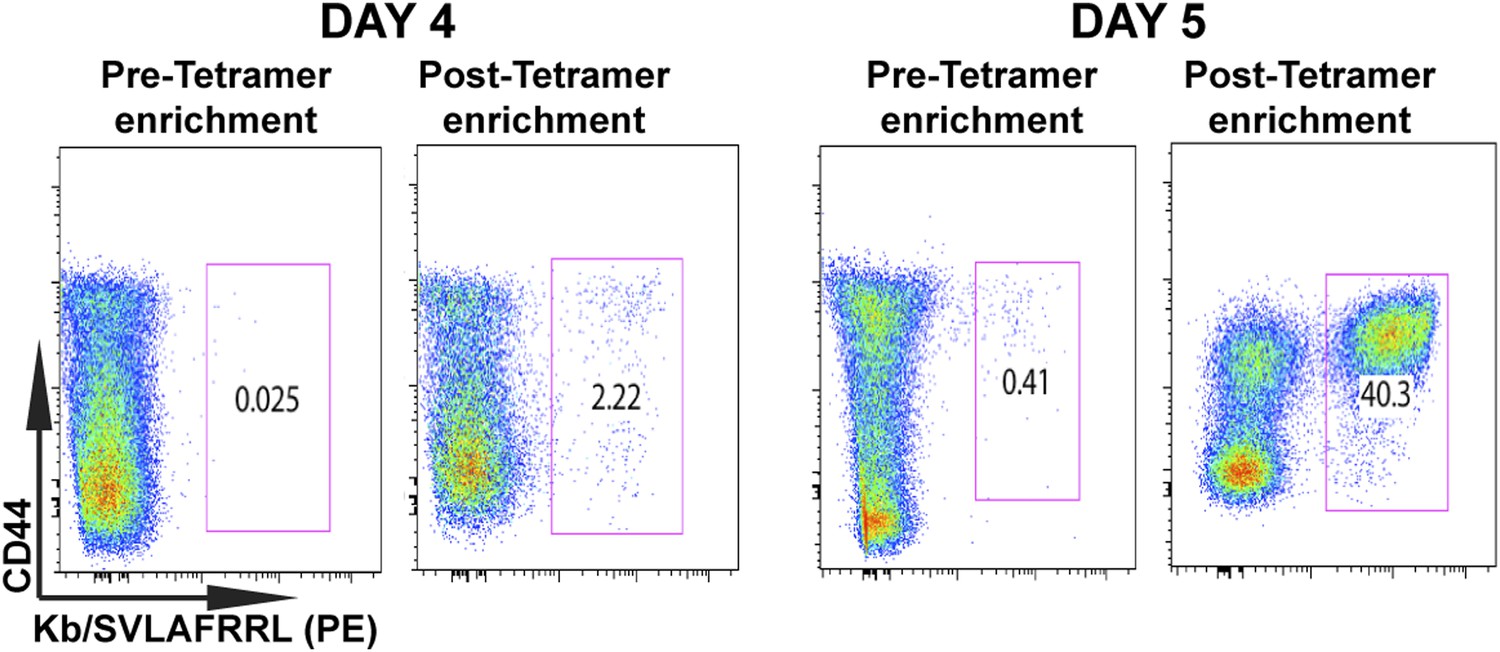
Tetramer-based enrichment increases detection of epitope-specific naïve CD8+ T cells in spleen.
Samples from pre- and post-tetramer-based enrichment of D4 and D5 post CPS vaccinated spleens, showing a 2-log increase in detection of tgd057:H-2Kb+ specific CD8+ T cells. Data represent 5 independent experiments with 3–5 mice per group per experiment.
Figure 1—figure supplement 2

Accurate determination of endogenous naïve tgd057:H-2Kb-specific CD8+ T cells.
To quantify absolute numbers of endogenous tgd057-specific CD8+ T cells, naïve B6 spleens were pulsed with 50 naïve monoclonal Thy1.1+ SCNT CD8+ T cells. Representative flow cytometry plots of tetramer binding cells (doubly stained with APC and PE-labeled tetramers) partitioned according to Thy1.1 staining are shown. Absolute numbers of naïve endogenous tgd057-specific CD8+ T cells in a naïve spleen was calculated based on the ratio of endogenous CD8+ T cells to the pulsed Thy1.1+ cells. Total numbers of tgd057-specific CD8+ T cells in a naïve spleen were found to be 2093 ± 273 in WT hosts and 1200 ± 138 cells in IL-12p35−/− hosts. Data represent 5 independent experiments with 3–5 mice per group per experiment. Scatter plots are mean ± SEM, data were analyzed using paired t test and Holms-Sidak post-hoc test; **p ≤ 0.01.
Figure 2
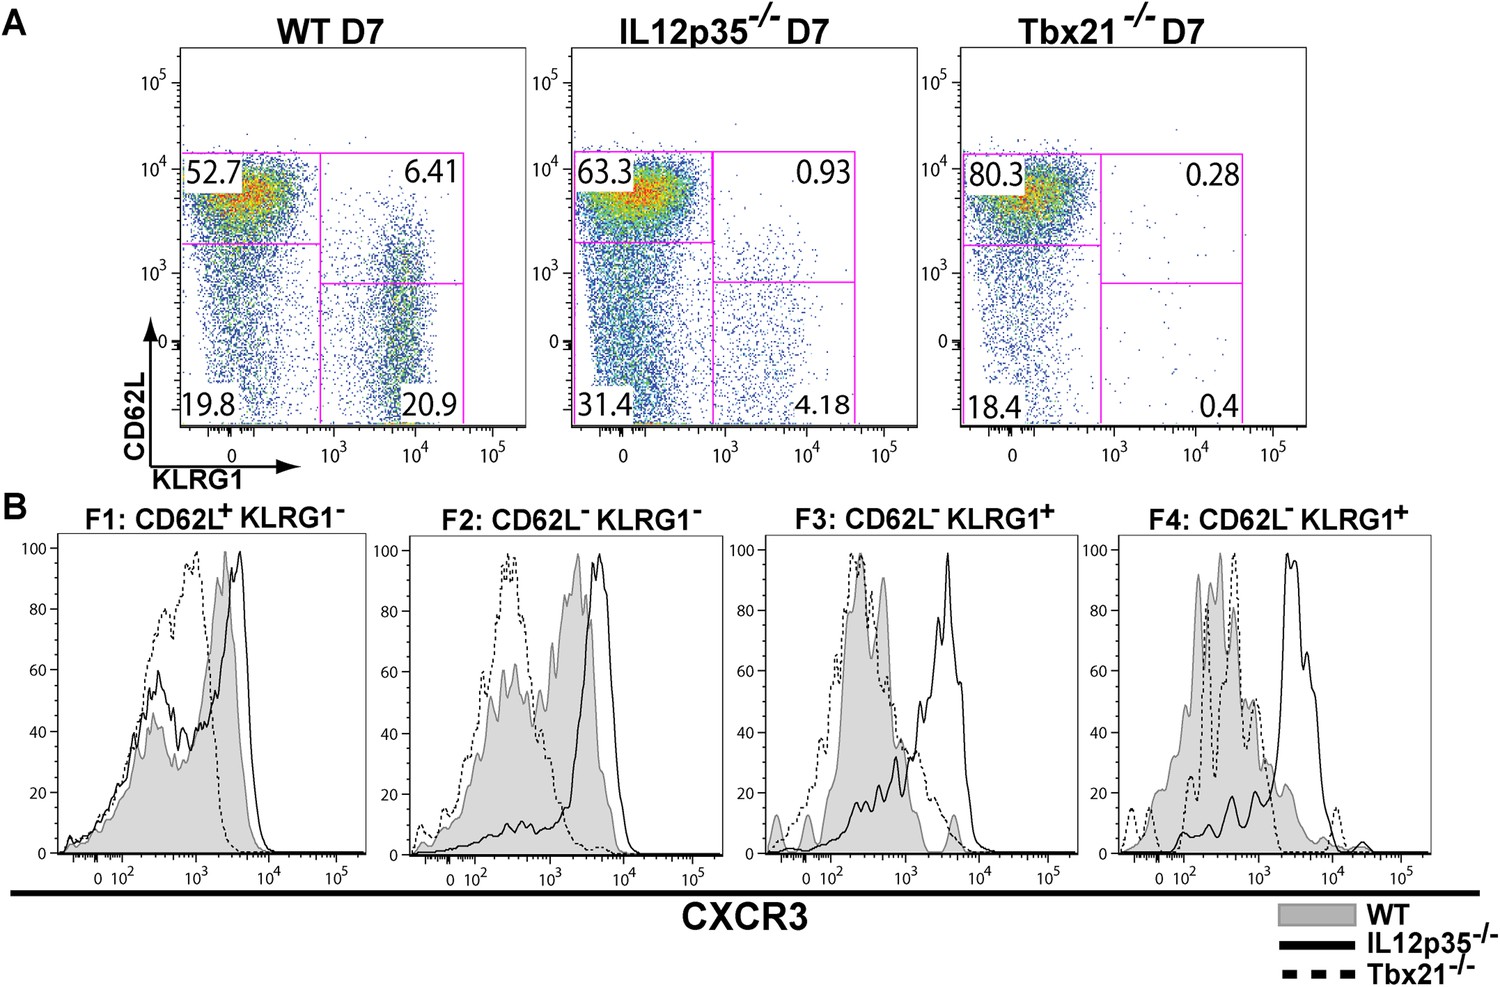
During effector CD8+ T cell differentiation, expression of CXCR3 is downregulated in an IL-12 dependent manner.
CD62L and KLRG1 surface expression (A) and CXCR3 surface expression (B) on total CD8+ T cells were assessed by flow cytometry 7 days post-vaccination. Data represent 3–4 independent experiments with 4–5 mice per group per experiment. Mean ± SEM, data were analyzed using unpaired t test, and Holms-Sidak post-hoc test, *p ≤ 0.05, **p ≤ 0.01, ***p ≤ 0.001.
Figure 3
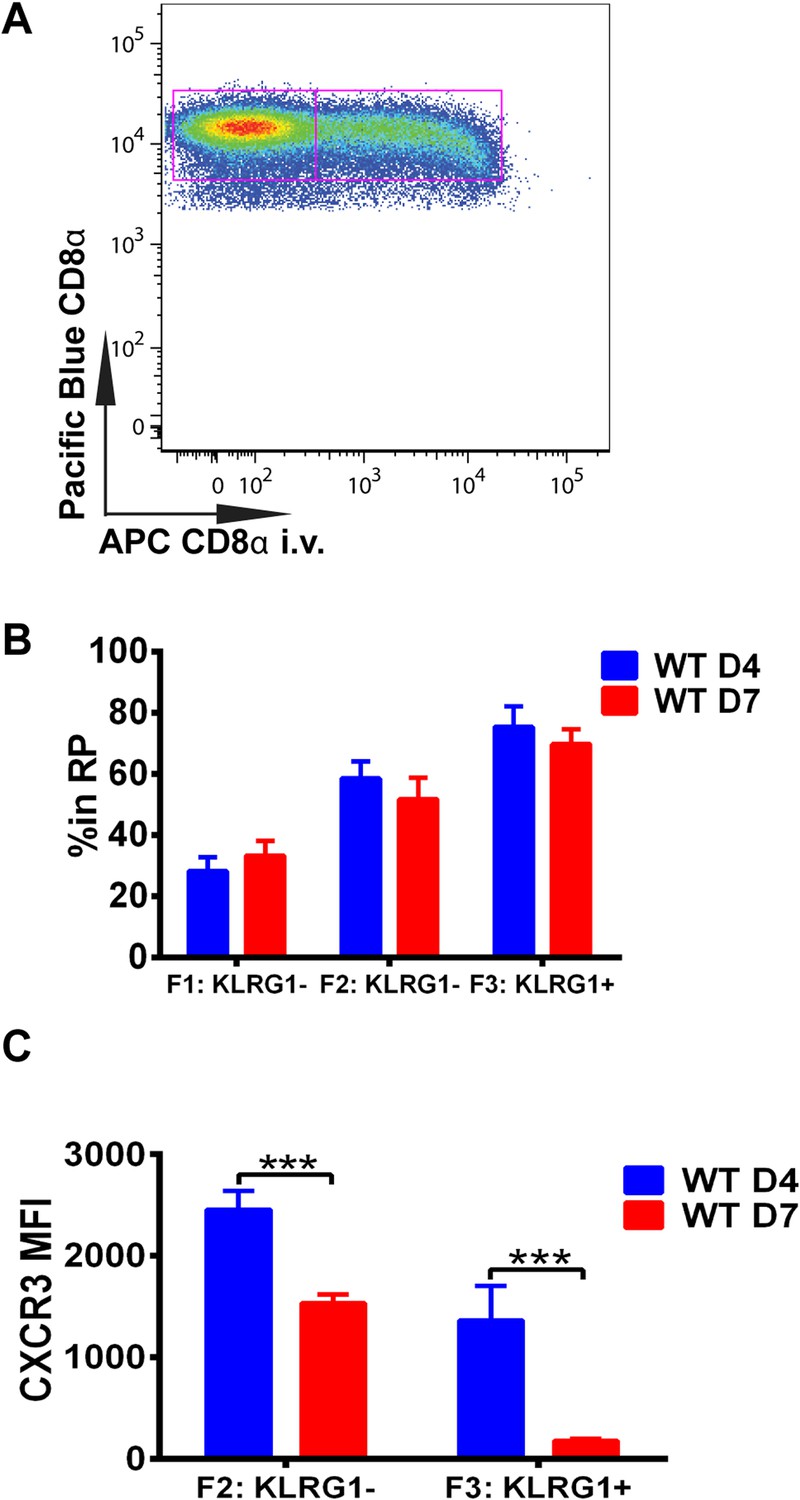
Downregulation of CXCR3 expression on CD8+ T cells occurs following KLRG1 induction in the splenic red pulp (RP).
(A) Representative FACS profile identifying splenic RP and white pulp by differential staining with i.v injected APC conjugated anti-CD8α antibody. (B) Compiled data of RP distribution of F1, F2 and F3 tgd057-specific CD8+ T cells in spleen on D4 and D7 post CPS vaccination. (C) CXCR3 expression on F2-KLRG1− and F3-KLRG1+ tgd057-specific CD8+ T cells on D4 and D7 post CPS vaccination. Data are representative of 3 independent experiments with 6–8 mice per experiment. Mean ± SEM, data were analyzed using unpaired t test, and Holms-Sidak post-hoc test, ***p ≤ 0.001.
Figure 4
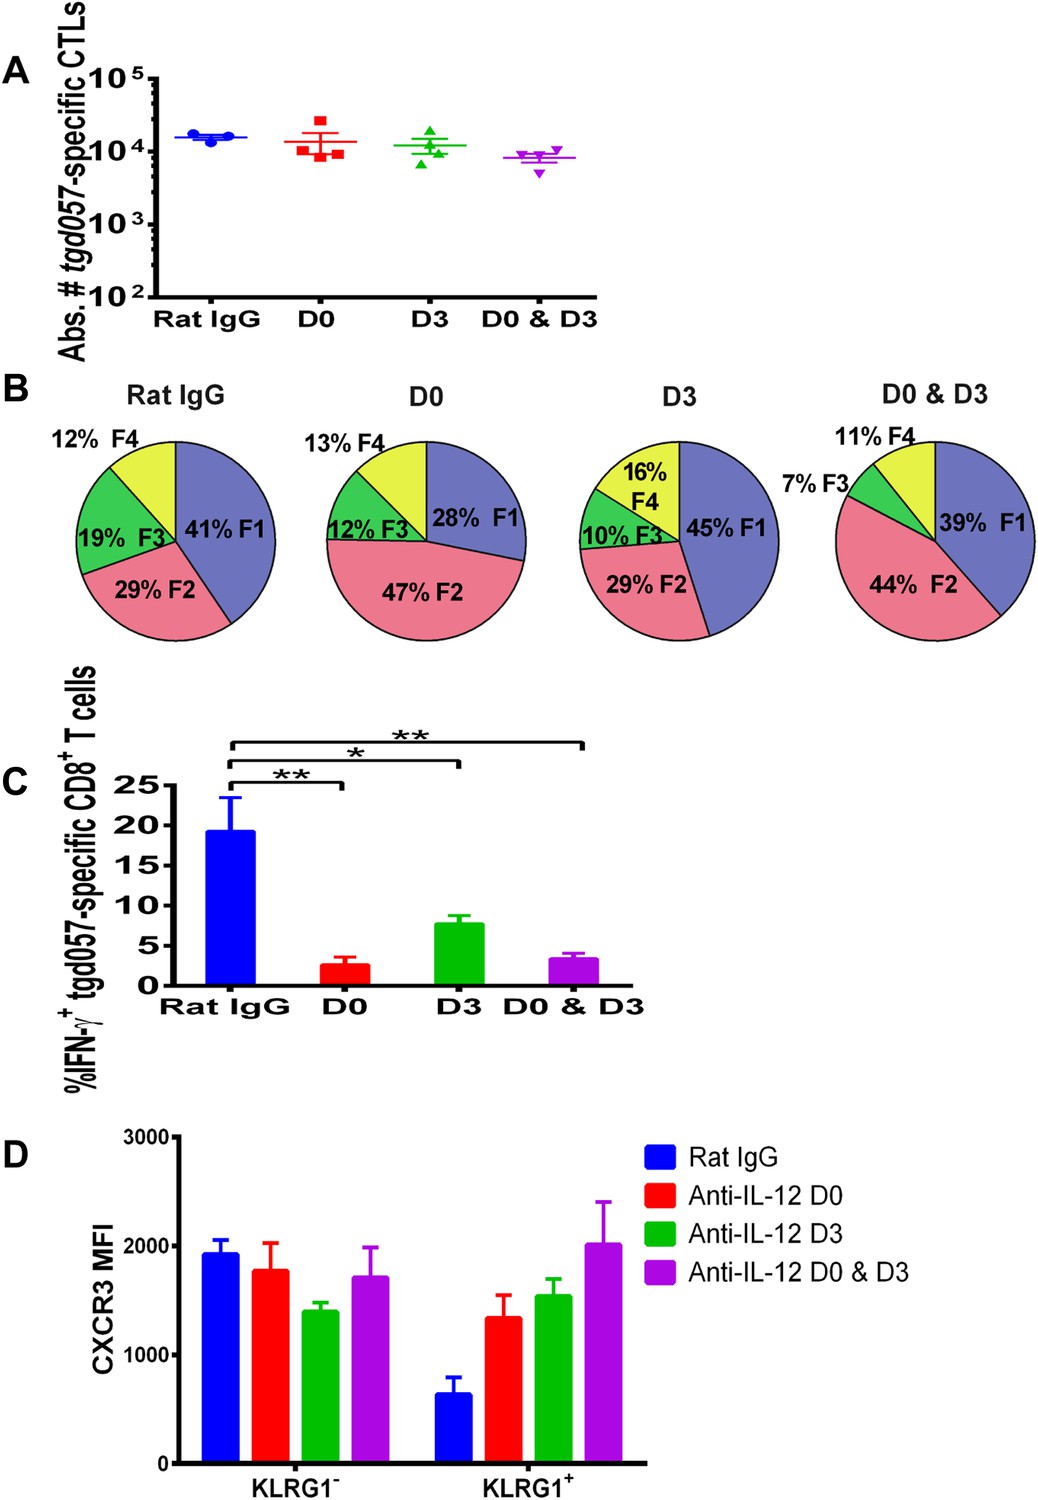
IL-12 exerts both early and late effects on CD8+ T cell differentiation, function and chemokine receptor expression.
Anti-IL-12p40 mAb was administered i.p. on D0, D3 or both days post CPS vaccination. Spleens were harvested on D5 post CPS vaccination. (A) Absolute numbers of tgd057-specific CD8+ T cells, (B) average frequency of F1–F4 stages defined by cell surface expression of CD62L and KLGR1, (C) IFN-γ production and (D) CXCR3 downregulation on tgd057-specific CD8+ T cells. Data are from 3 independent experiments with 3–4 mice per group per experiment. Mean ± SEM, data were analyzed using multiple unpaired t test, and Holm-Sidak post-hoc test, *p ≤ 0.05, **p ≤ 0.01.
Figure 5
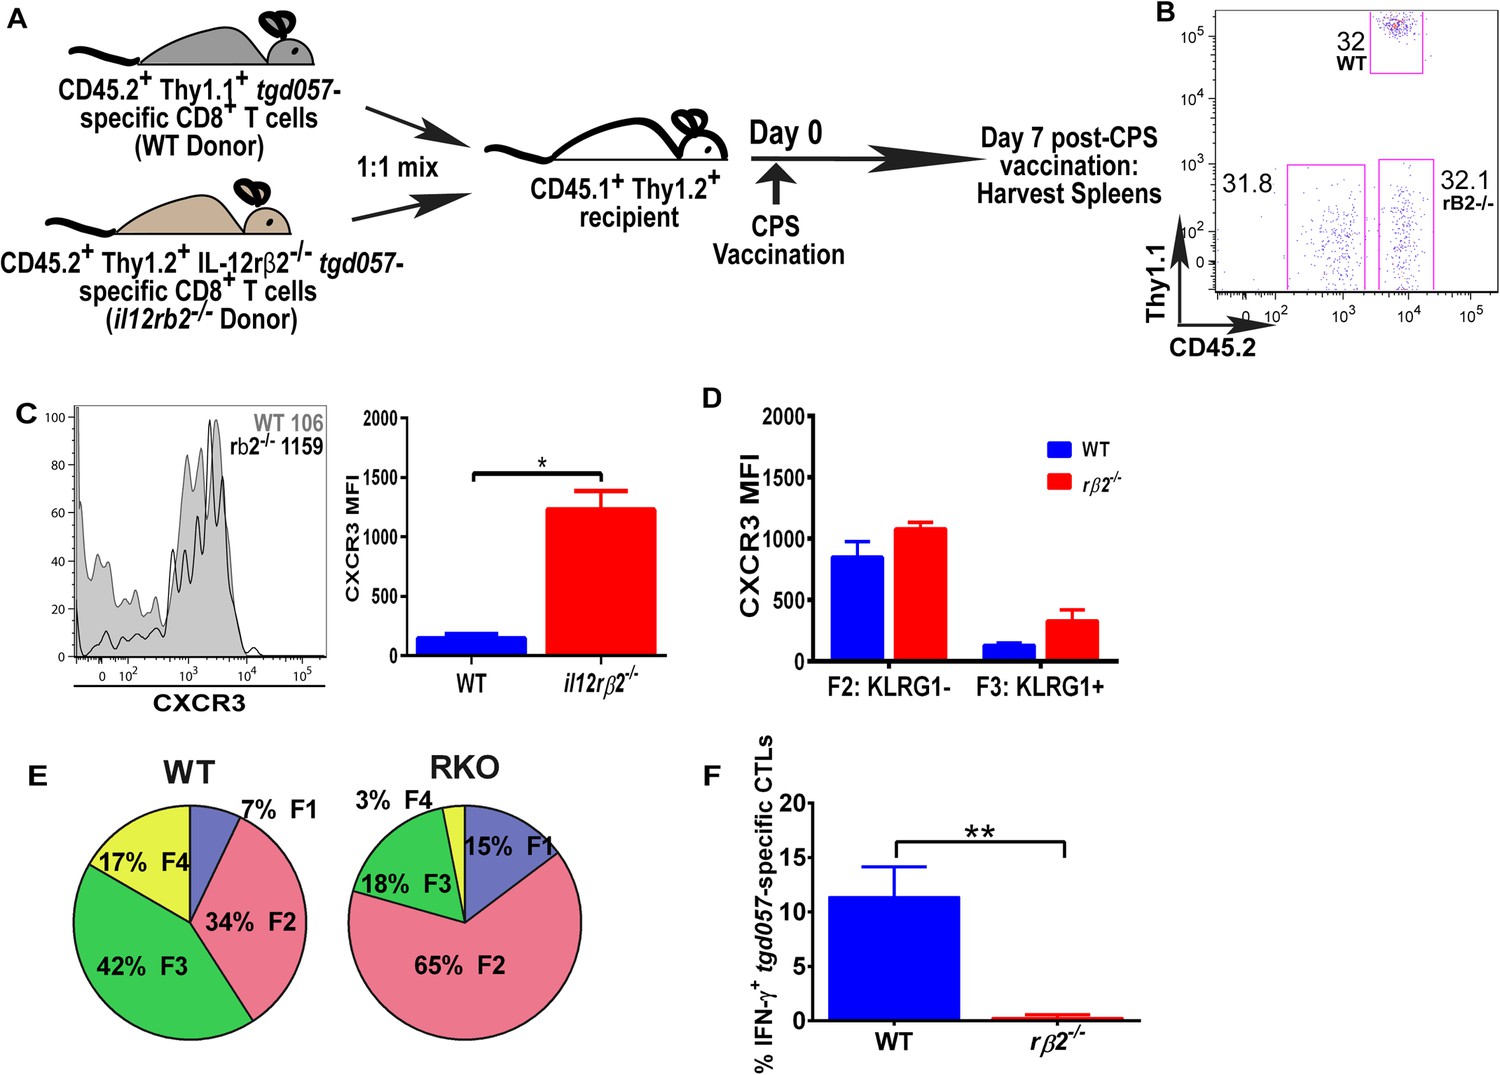
IL-12 mediates CXCR3 downregulation in a CD8+ T cell-extrinsic manner.
(A) A schematic representation of adoptive co-transfer of naive 500 WT somatic cell nuclear transfer (SCNT, CD45.2+, Thy1.1+) and naïve 500 il12rβ2−/− SCNT (CD45.2+, Thy1.2+) CD8+ T cells into naïve CD45.1+ WT recipients 1 hr prior to CPS vaccination. (B) Representative FACS profile shows frequency of antigen specific polyclonal endogenous and monoclonal donor CD8+ T cells D7 post CPS vaccination. (C) CXCR3 expression on total tgd057-specific donor CD8+ T cells on D7 post vaccination (left) and expressed as MFI (right). (D) tgd057-specific donor CD8+ T cells were analyzed for CXCR3 expression by first gating for CD62L and KLRG1 cell surface expression, then studying expression of CXCR3 in F2 and F3 stages. (E) Frequency of F1–F4 stages of WT CD8+ T cells and IL-12rβ2−/− SCNT CD8+ T cells D7 post-CPS vaccination. (F) IFN-γ production by WT SCNT and IL-12rβ2−/− SCNT CD8+ T cells was analyzed after CPS restimulation. Data are from 3 independent experiments consisting of 4–8 mice per group per experiment. Mean ± SEM. Data were analyzed using unpaired t test, and (D) Bonferroni post-hoc test. (E) Mann–Whitney post-doc test; *p < 0.01, ***p < 0.001.
Figure 6
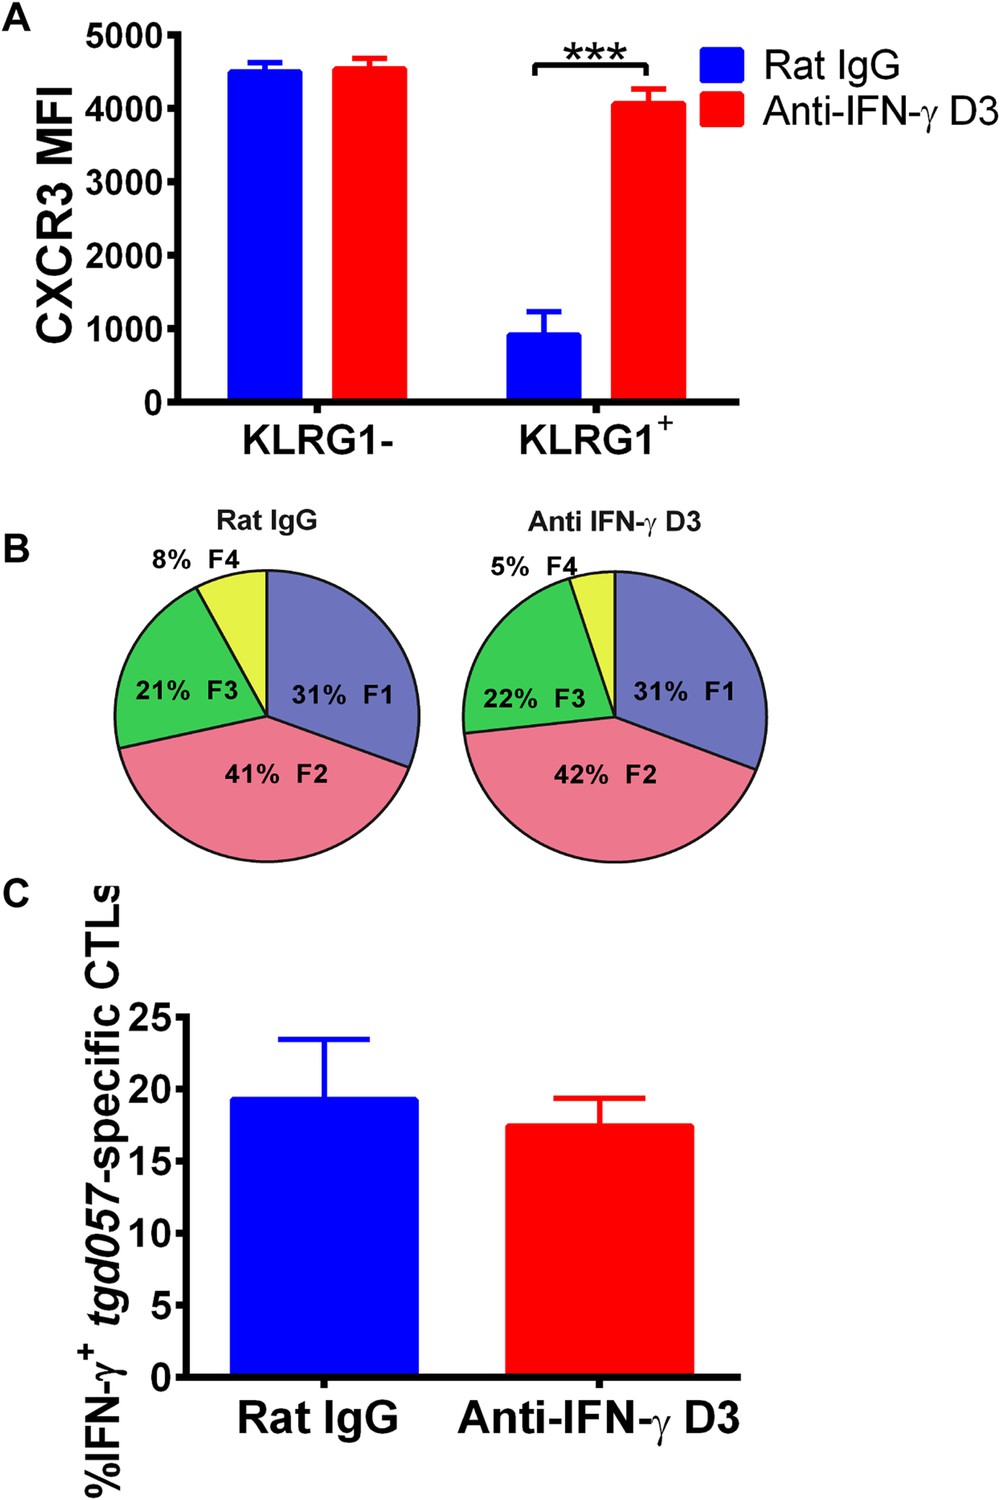
Neutralization of IFN-γ is sufficient to prevent CXCR3 downregulation on effector CD8+ T cell precursors.
Anti-IFN-γ mAb was administered i.p. on D3 post-CPS vaccination. Mice were sacrificed on D5 post-CPS vaccination and tgd057-specific CD8+ T cells were analyzed for (A) CXCR3 expression, (B) CD62L and KLRG1 surface expression on tgd057-specific CD8+ T cells and (C) IFN-γ production post in vitro CPS restimulation in tgd057-specific CD8+ T cells. Data are from 2 experiments consisting of 3–5 mice per group per experiment. Mean ± SEM, paired t test and Holm-Sidak post-hoc test, ***p < 0.001.
Figure 7 with 1 supplement
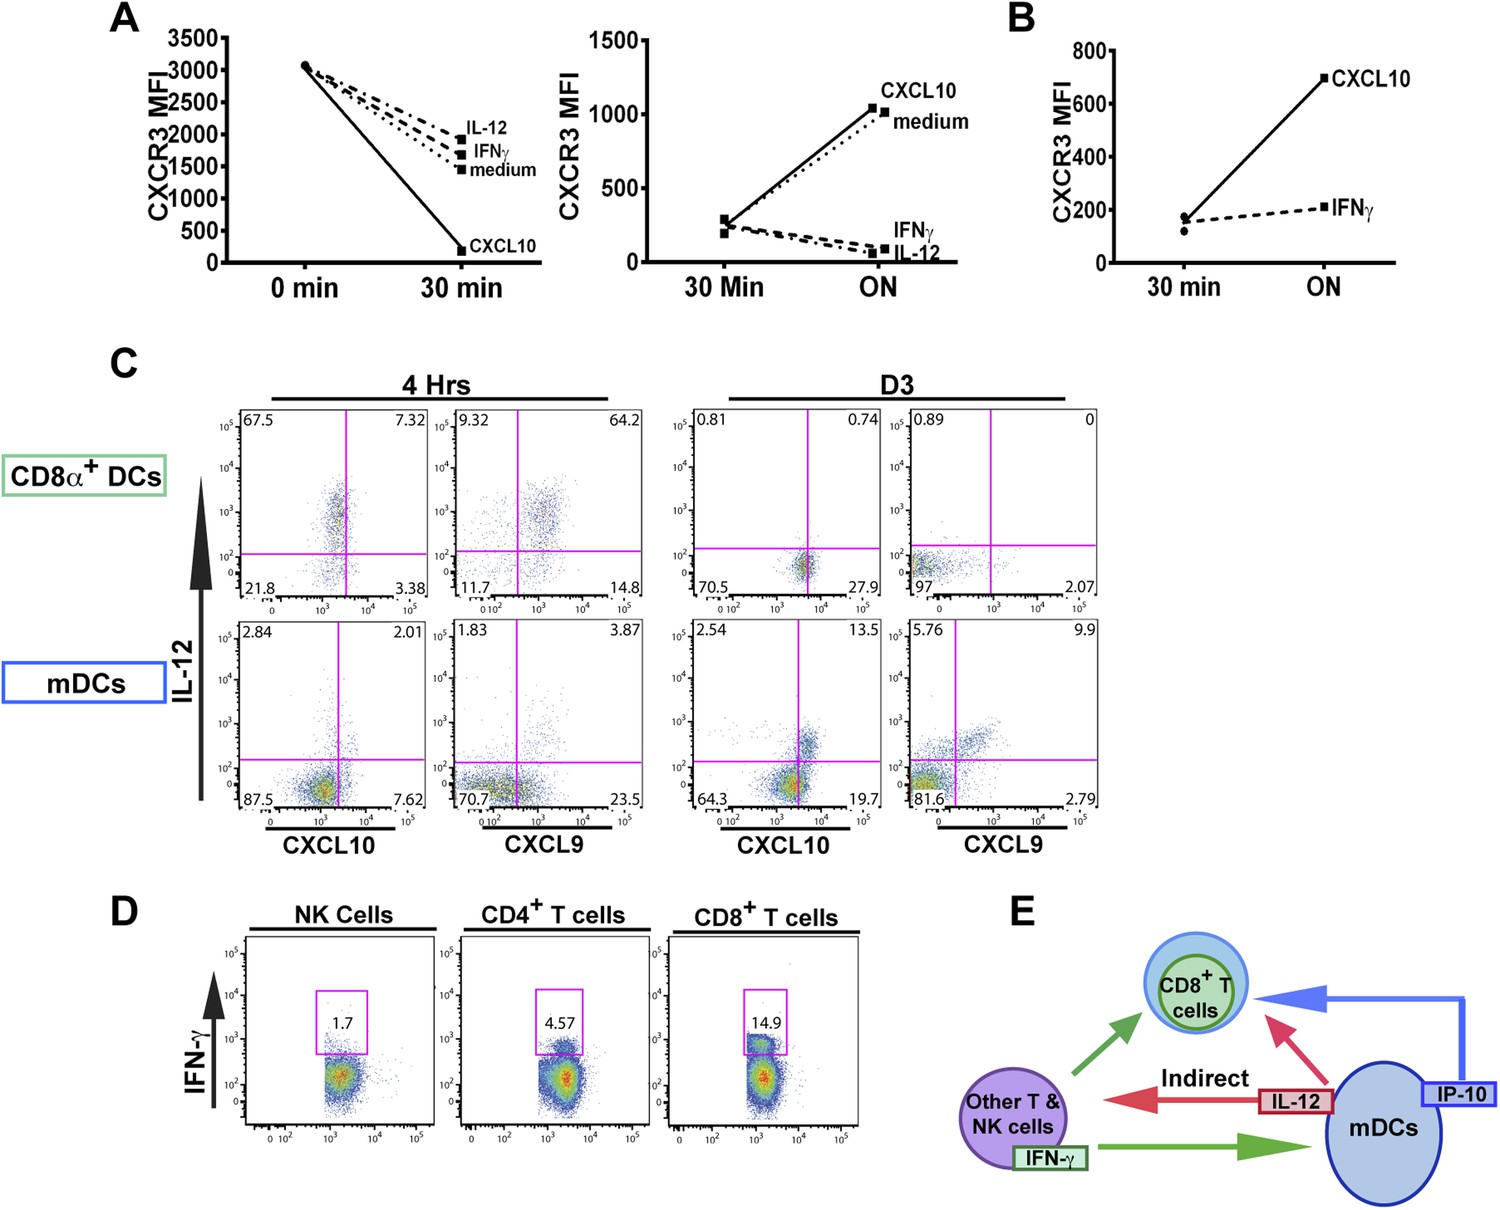
An alternative pathway involving IFN-γ and IFN-γ-inducible chemokines mediates suppression of CXCR3 on late-stage effector CD8+ T cell precursors.
CXCL10, IL-12, or IFN-γ was added in vitro to (A) total splenocytes or (B) purified CD8+ T cells from D7 IL-12p35−/− mice post CPS vaccination. Cells were first ‘stripped’ of CXCR3 surface expression by addition of CXCL10 for 30 min (left panel), washed, and then incubated overnight (ON) with chemokine or cytokines. KLRG1+ CD8+ T cells were analyzed for CXCR3 expression. (C) Representative FACS profiles of ex vivo ICS of IL-12 and chemokines from 4 hr or D3 after CPS vaccination. Splenocytes were analyzed for IL-12p40, CXCL9 (MIG) and CXCL10 (IP-10) production in CD11c+ CD8α+ dendritic cells (DCs), and CD11c+ CD11b+ myeloid DCs (mDCs). (D) Representative FACS profiles of IFN-γ production from NK, CD4+ and CD8+ T cells in spleens of D3 CPS vaccinated WT mice. (E) Three cell model showing that CD8+ T cells are not the direct targets of IL-12. Rather IL-12 acts through bystander T cell production of IFN-γ, which targets both the developing CD8+ T cells and mDCs to secrete IFN-γ-inducible chemokines. CXCR3 chemokine ligands together with IFN-γ directly act on the developing CD8+ T cells to downregulate CXCR3 expression. (A and B) Data are from 4 experiments of 3–5 pooled IL-12p35−/− CPS vaccinated mice each, Mean ± SEM. (C and D) Data are from 2 experiments with 3–4 WT mice each.
Figure 7—figure supplement 1
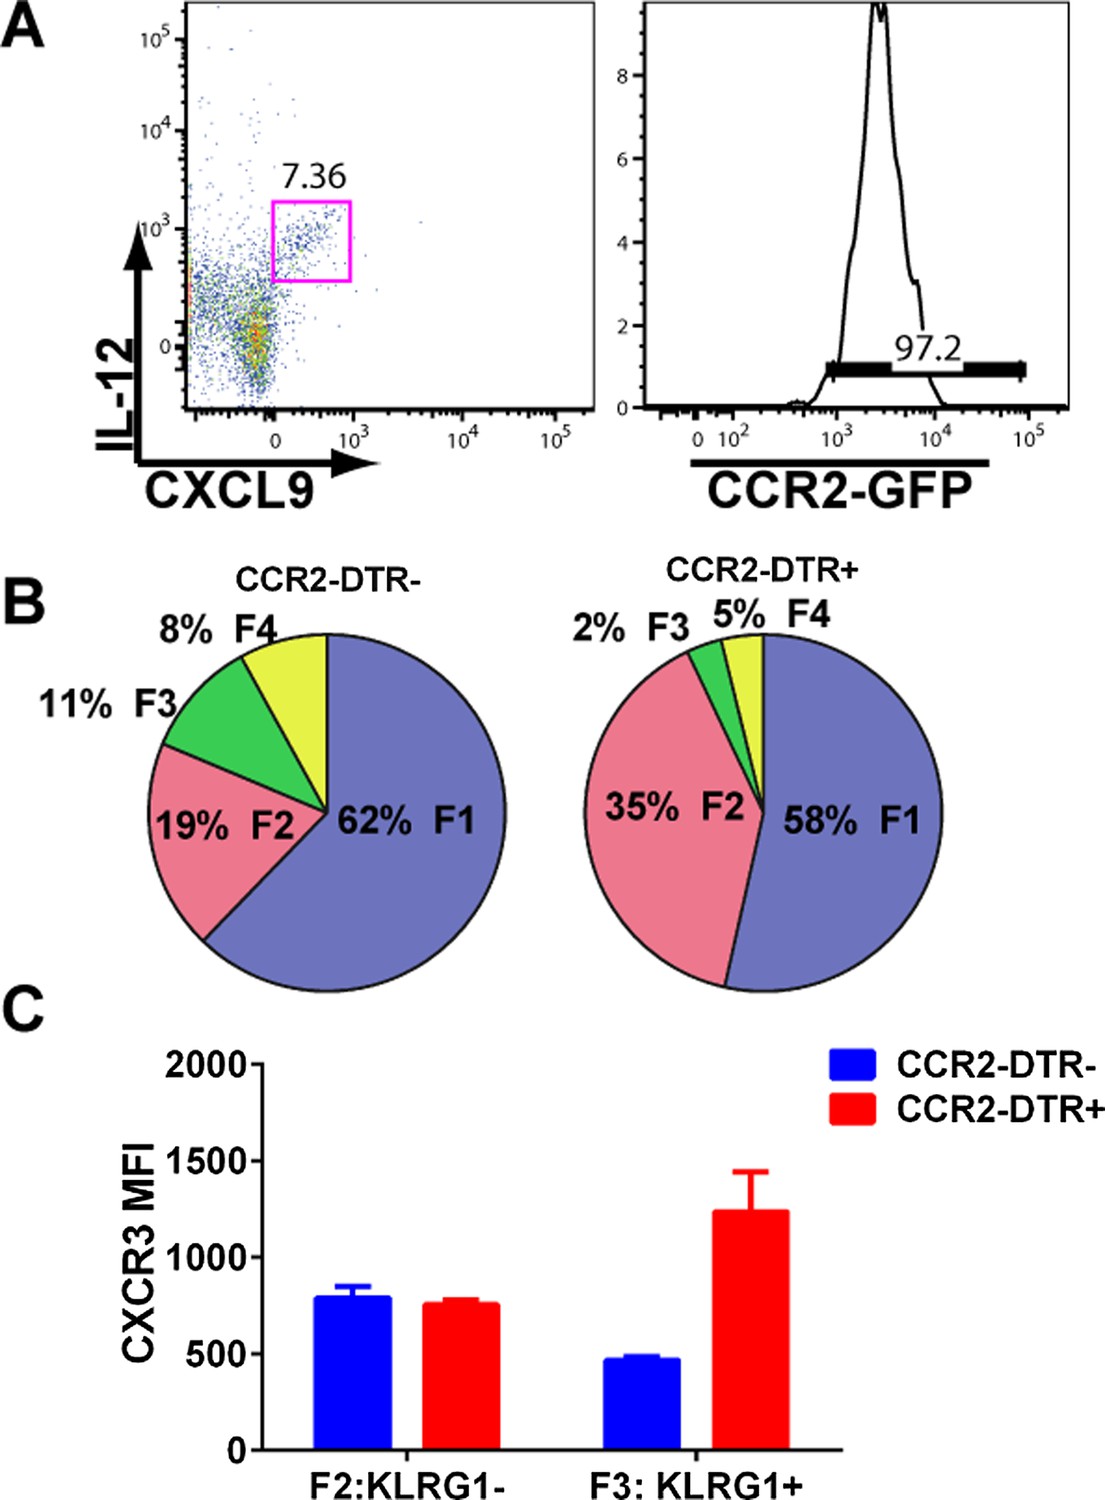
mDCs producing IL-12 and CXCL9 are CCR2+ and their depletion attenuates CD8+ T cell differentiation.
(A) mDCs from D3 CPS vaccinated mice producing both IL-12 and CXCL9 are over 95% CCR2-positive. CPS vaccinated CCR2-DTR+ mice and CCR2-DTR− control littermates were injected i.p with 250 ng of diphtheria toxin on D2.5 and sacrificed on D5. Tgd057-specific CD8+ T cells from D5 spleens were analyzed for (B) fractional distribution based on CD62L and KLRG1 expression and for (C) CXCR3 expression in KLRG1− (F2 subpopulation) and KLRG1+ (F3 subpopulation). Data represent 5 mice per group.
Figure 8 with 1 supplement

Generation of terminally differentiated CD8+ T cells occurs after cessation of proliferation in the splenic RP.
D5.5 post CPS vaccinated WT mice were first injected i.p. with EdU 2 hr prior to sacrifice, then injected i.v. with 4 μg of anti-CD8-FITC antibody and sacrificed within 2–3 min. The differential localization and fractional distribution of F1–F4 stages in EdU− and EdU+ (A) for total CD8+ T cells and (C) tgd057-specific CD8+ T cells are shown. The rate of EdU-positivity as a function of differentiation stage (B, D left panels) or differentiation stage and i.v. anti-CD8 accessibility (B, D right panels) are shown for total CD8+ T cells (B) and tgd057-specific CD8+ T cells (D). Immunofluorescence images showing D5.5 splenic localization of EdU+ and double-positive for IV α-CD8 and ex vivo α-CD8 antibodies (E), and KLRG1 (F) staining. Splenic compartments are represented as follows: dashed line, MZ border; RP–red pulp; BC–bridging channel; MZ–marginal zone. Sections were stained for IV α-CD8 (green, CD8), ex vivo α-CD8 (red, EX CD8), EdU (blue), α-KLRG1 (white). Key to symbols: Yellow arrows: EdU+ IV CD8+ EV CD8+, Pink Arrows: EdU+ KLRG1+ IV CD8+ EV CD8+. Expression of CXCR3 in proliferating and non-proliferating CD8+ T cells (G). Data are from 2 experiments of 3–5 CPS vaccinated mice each. Immunofluorescence represents more than six sections per mouse taken from three mice. Mean ± SEM. Student's t-test or ANOVA analysis was done Holms-Sidak post hoc test, *p < 0.01, **p < 0.001 and ***p < 0.0001. Refer to Figure 8—figure supplement 1 for IHC image of EdU+ CD8+ T cells in splenic bridging channels.
Figure 8—figure supplement 1
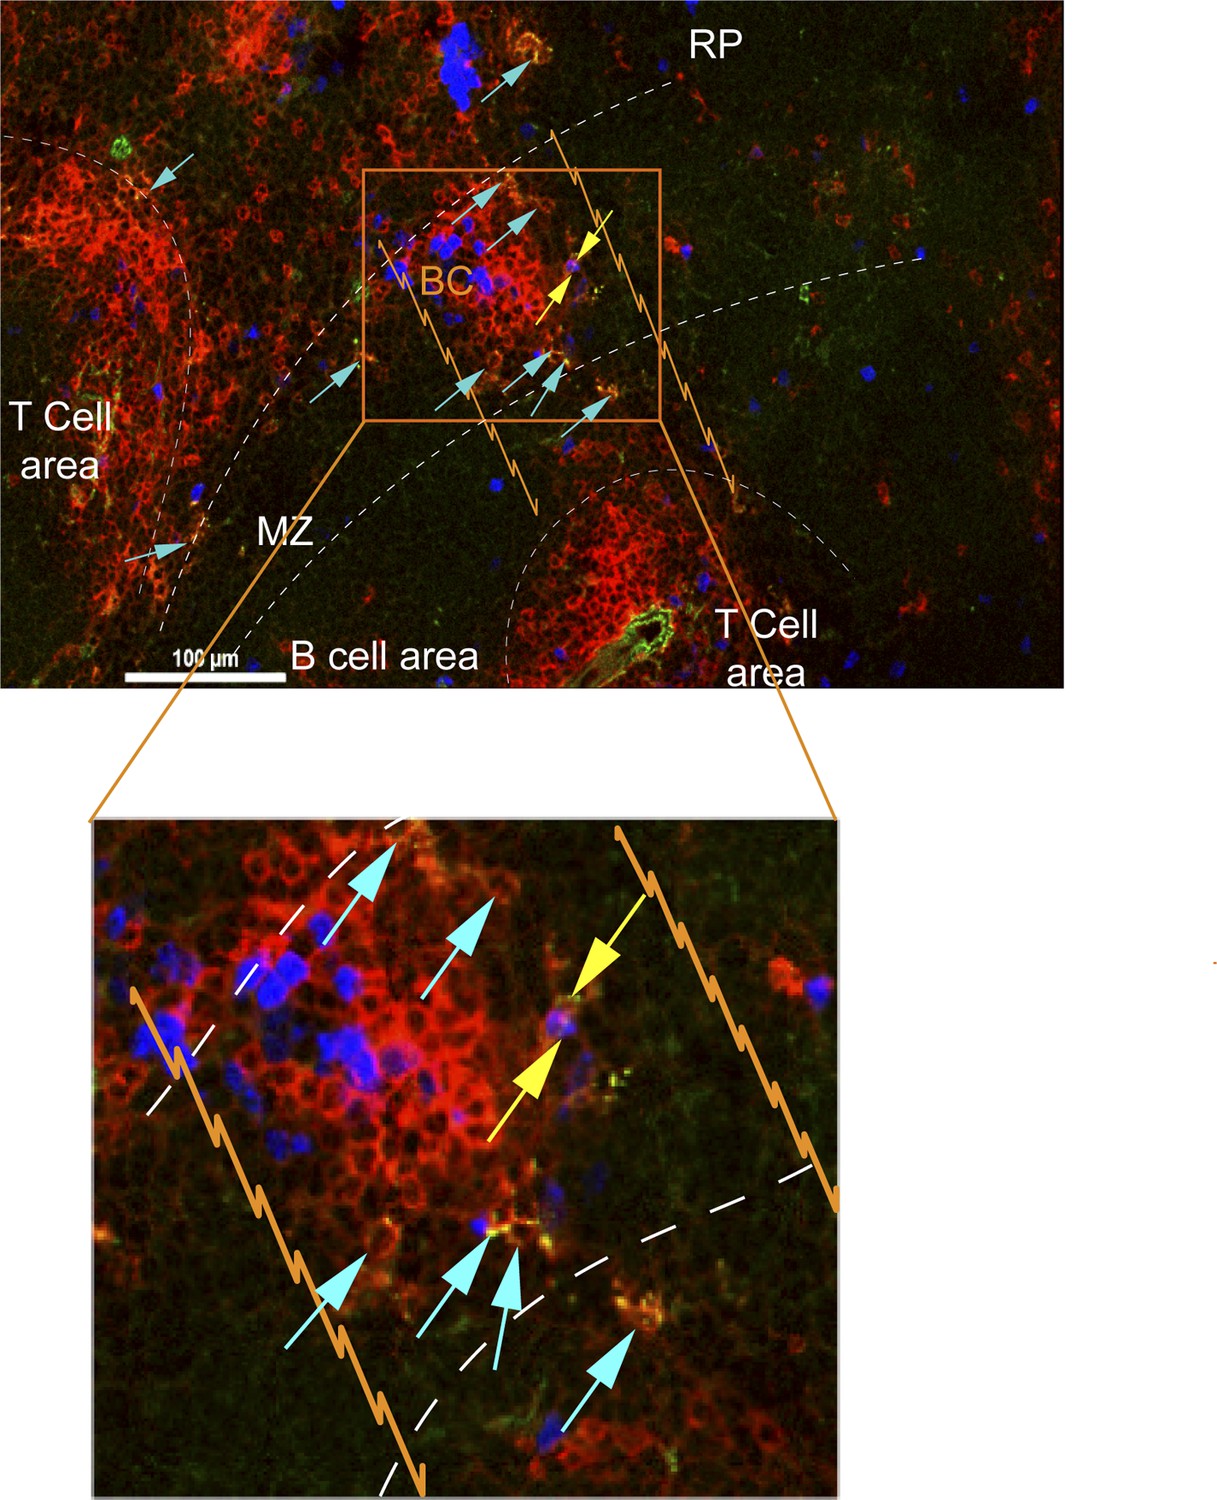
CD8+ T cells in bridging channels are proliferating.
D4.5 post CPS vaccinated WT mice were injected i.p. with EdU 2 hr prior to sacrifice and then injected i.v. with 4 μg anti-CD8-FITC antibody and sacrificed within 2–3 min. 6 μm splenic sections were stained for α-CD8α antibody and developed for EdU. Immunofluorescence showing localization of double stained CD8α+ T cells that are proliferating (EdU+, yellow arrows) or non-proliferating (Edu−, blue arrows) within the bridging channel and MZ. Enlarge inset depicts proliferating and non-proliferating double stained CD8+ T cells in the bridging channel. Splenic compartments are represented as follows: dashed lines–MZ border; orange lines–bridging channel; RP–red pulp; BC–bridging channel; MZ–marginal zone. Sections were stained for IV CD8 (green, CD8), CD8 ex vivo (red, EX CD8), EdU (blue). Key to symbols: Yellow arrows: EdU+ CD8+ T cells, Blue arrows: EdU− CD8+ T cells. Data are representative of more than 4 sections per mouse taken from three mice.
Figure 9
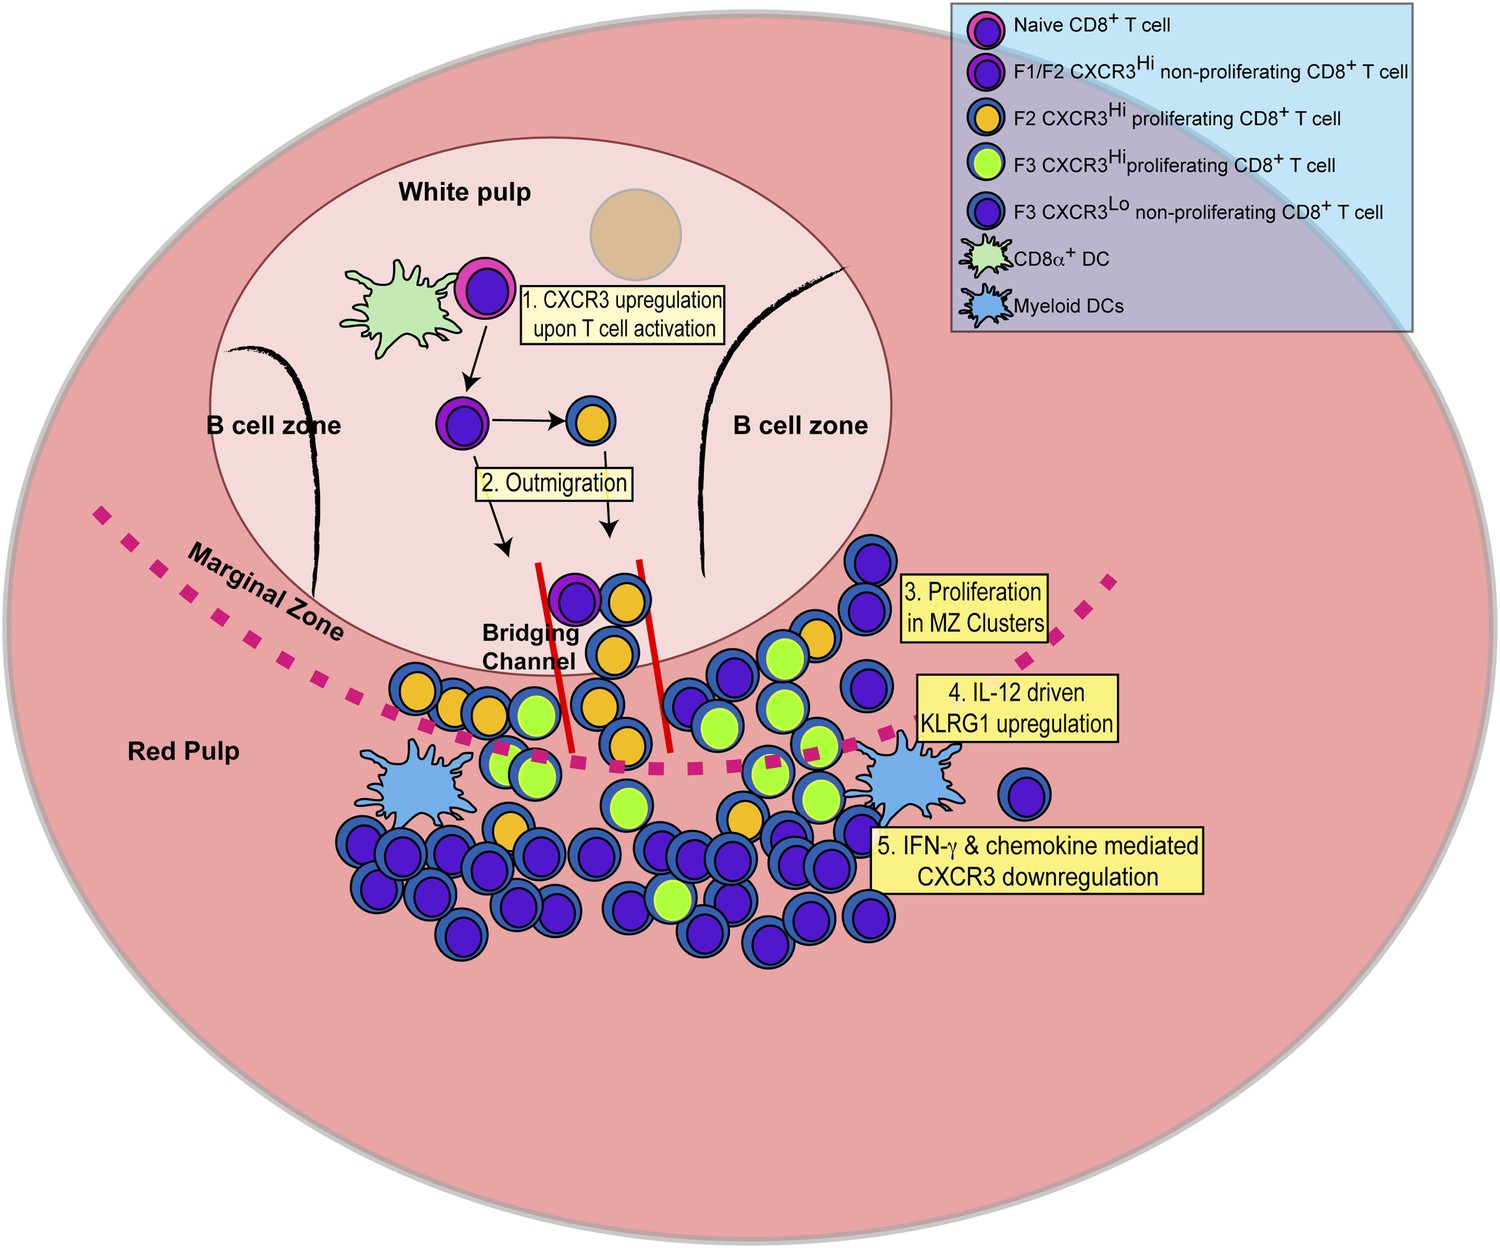
Schematic depicting the sequence of events leading to the generation of late-stage KLRG1+ effector CD8+ T cells.
1: While in the white pulp, CD8α+ DCs activate CD8+ T cells causing the upregulation of CXCR3 expression. 2: CXCR3Hi CD62LLo CD8+ T cells outmigrate towards RP and begin to proliferate. 3: Upon outmigration through bridging channels, CXCR3Hi CD62LLo CD8+ T cells continue to proliferate in clusters found in the MZ. 4: Exposure to IL-12 produced by mDCs in the MZ/RP areas induces KLRG1 upregulation. 5: Subsequent exposure to IFN-γ and IFN-γ-inducible chemokines downregulate CXCR3 expression on RP-localized KLRG1+ effector CD8+ T cells.
Download links
A two-part list of links to download the article, or parts of the article, in various formats.
Downloads (link to download the article as PDF)
Open citations (links to open the citations from this article in various online reference manager services)
Cite this article (links to download the citations from this article in formats compatible with various reference manager tools)
An extrafollicular pathway for the generation of effector CD8+ T cells driven by the proinflammatory cytokine, IL-12
eLife 4:e09017.
https://doi.org/10.7554/eLife.09017


