Chromatin-prebound Crm1 recruits Nup98-HoxA9 fusion to induce aberrant expression of Hox cluster genes
- National Institutes of Biomedical Innovation, Health and Nutrition, Japan
- Graduate School of Pharmaceutical Sciences, Osaka University, Japan
- Osaka University, Japan
- Kyushu University, Japan
- National Institute of Genetics, Japan
- Osaka City University, Graduate School of Engineering, Japan
- Tokyo Institute of Technology, Japan
Figures
Figure 1 with 1 supplement
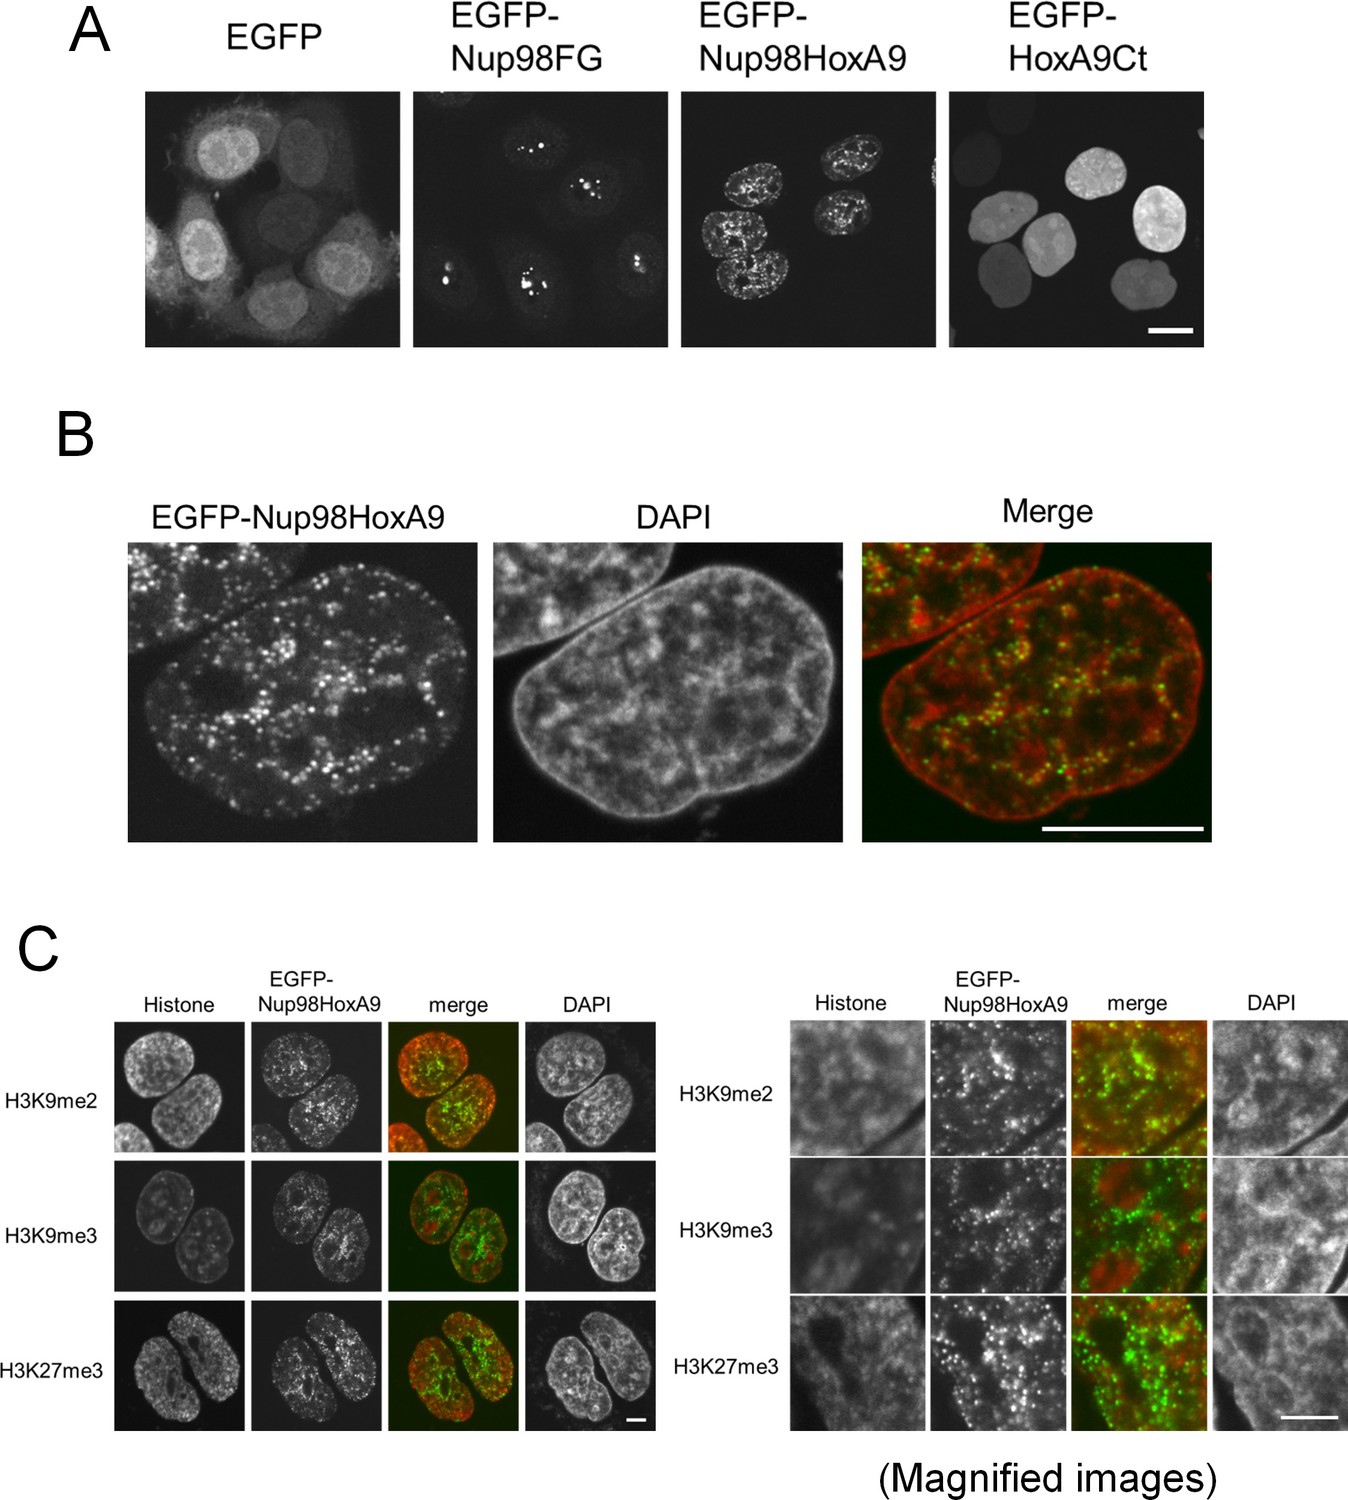
Nup98-HoxA9 dots associate with facultative heterochromatin.
(A) Subcellular localization of Nup98-HoxA9 and its truncated mutants. EGFP, EGFP-Nup98FG, EGFP-Nup98-HoxA9, or EGFP-HoxA9-Ct expressing plasmids were transfected into HeLa cells for 24 hr and observed. Bar, 10 μm. (B) Confocal microscopy analysis of EGFP-Nup98-HoxA9 in HeLa cells. A merged image shows EGFP-Nup98-HoxA9 (green) and DAPI (red). Bar, 10 μm. (C) Association of Nup98-HoxA9 dots with specific histone modifications. HeLa cells were transfected with the EGFP-Nup98-HoxA9 expressing plasmid. Twenty-four hours after transfection, cells were fixed and stained with antibodies against indicated histone modifications. DAPI staining was used to visualize the nuclei. Bar, 5 μm. DAPI, 4',6-diamidino-2-phenylindole; EGFP, enhanced green fluorescent protein.
Figure 1—figure supplement 1
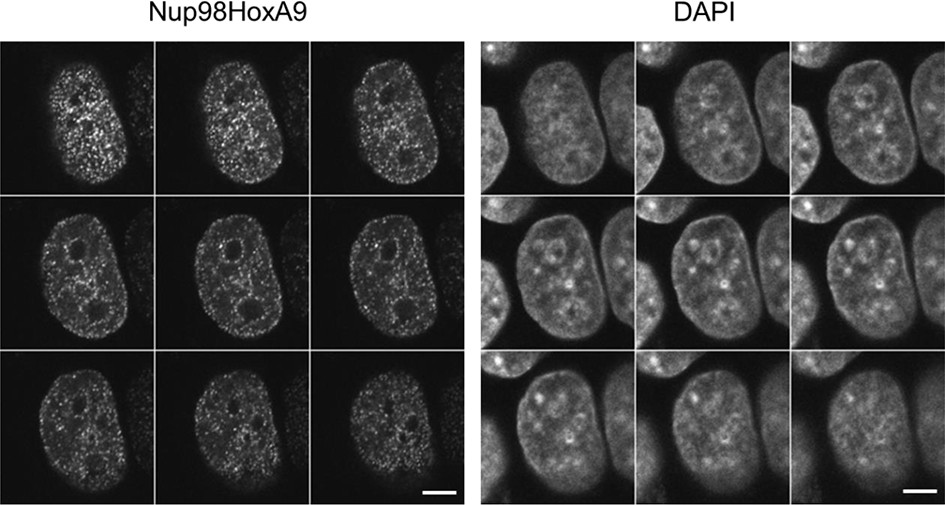
Serial z-sectioning of EGFP-Nup98-HoxA9 in HeLa cell.
Serial z-sectioning was performed at a depth of 0.48 μm per section using confocal microscopy. DAPI staining was used to visualize nuclei. Bar, 5 μm. DAPI, 4',6-diamidino-2-phenylindole; EGFP, enhanced green fluorescent protein.
Figure 2 with 3 supplements
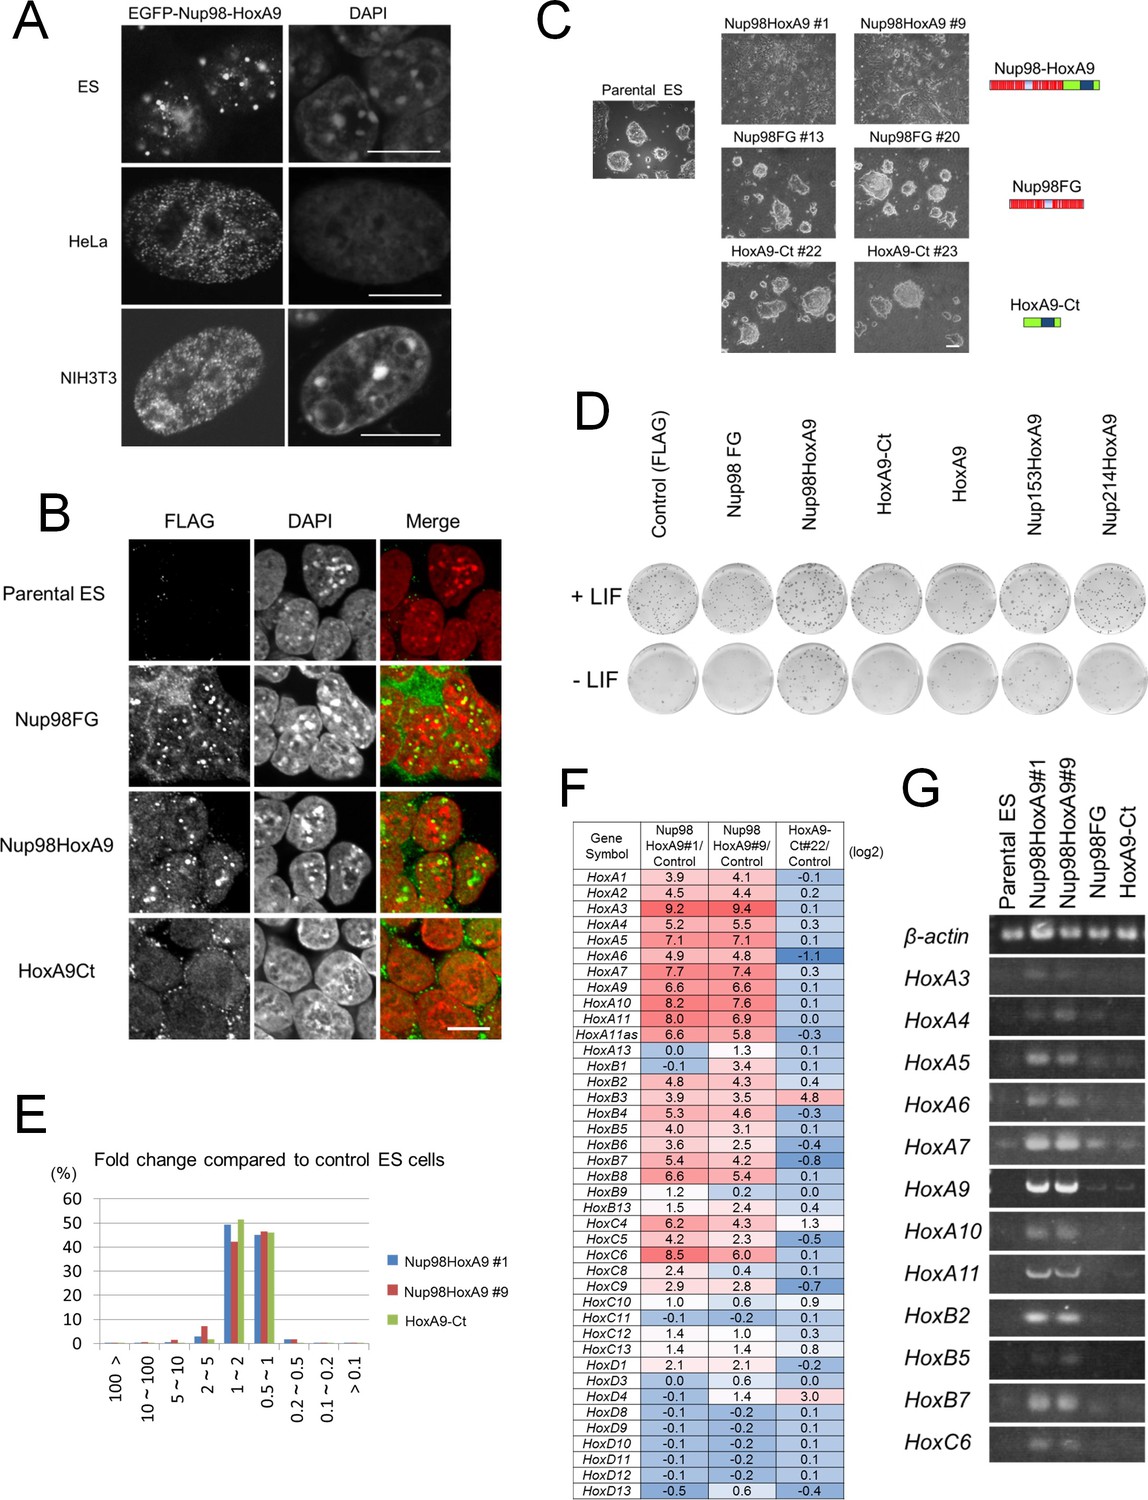
Nup98-HoxA9 evokes the expression of Hox cluster genes in ES cells.
(A) Differential intranuclear localization of Nup98-HoxA9 in mouse ES, HeLa and NIH3T3 cells. Cells were transfected with the EGFP-Nup98-HoxA9 expressing plasmid for 24 hr, fixed, and stained with DAPI. Samples were analyzed using confocal microscopy. Bar, 10 μm. (B) Subcellular localization of Nup98-HoxA9 and its truncated mutants in ES cells. ES cell clones expressing FLAG-tagged Nup98FG, Nup98-HoxA9, or HoxA9-Ct were fixed and stained with an anti-FLAG (polyclonal) antibody. Nuclei were stained with DAPI. Merged images show FLAG staining (green) and DAPI (red). Bar, 10 μm. (C) Cell morphology of stable ES cell lines expressing FLAG-tagged Nup98-HoxA9, Nup98FG, or HoxA9-Ct. Bar, 100 μm. (D) Differentiation assay of stable ES cell clones. ES cells stably expressing FLAG (control), FLAG-tagged Nup98FG, Nup98-HoxA9, HoxA9-Ct, HoxA9, Nup153-HoxA9, or Nup214-HoxA9 were plated at a density of 103 cells per well in 12-well plates either in the presence or absence of LIF. After 5 d, the plates were fixed and stained with alkaline phosphatase, a marker for undifferentiated stem cells. (E) Gene expression profiling of ES cell lines stably expressing FLAG-tagged Nup98-HoxA9 (#1 and #9; two independent clones) and HoxA9-Ct is compared with that of parental ES cells. A greater than 10-fold upregulation of gene expression was commonly observed in both Nup98-HoxA9 clone #1 and Nup98-HoxA9 clone #9 cells. (F) Hox gene expression profiling. The log2 fold ratios of the normalized signal value of Hox cluster genes from Nup98-HoxA9 or HoxA9-Ct expressing ES cells relative to signals from parental control ES cells are indicated. (G) Upregulation of Hox cluster genes in FLAG-Nup98-HoxA9 expressing ES cell lines was confirmed using semi-quantitative polymerase chain reaction. DAPI, 4',6-diamidino-2-phenylindole; EGFP, enhanced green fluorescent protein; ES, embryonic stem; LIF, leukemia inhibitory factor
Figure 2—figure supplement 1
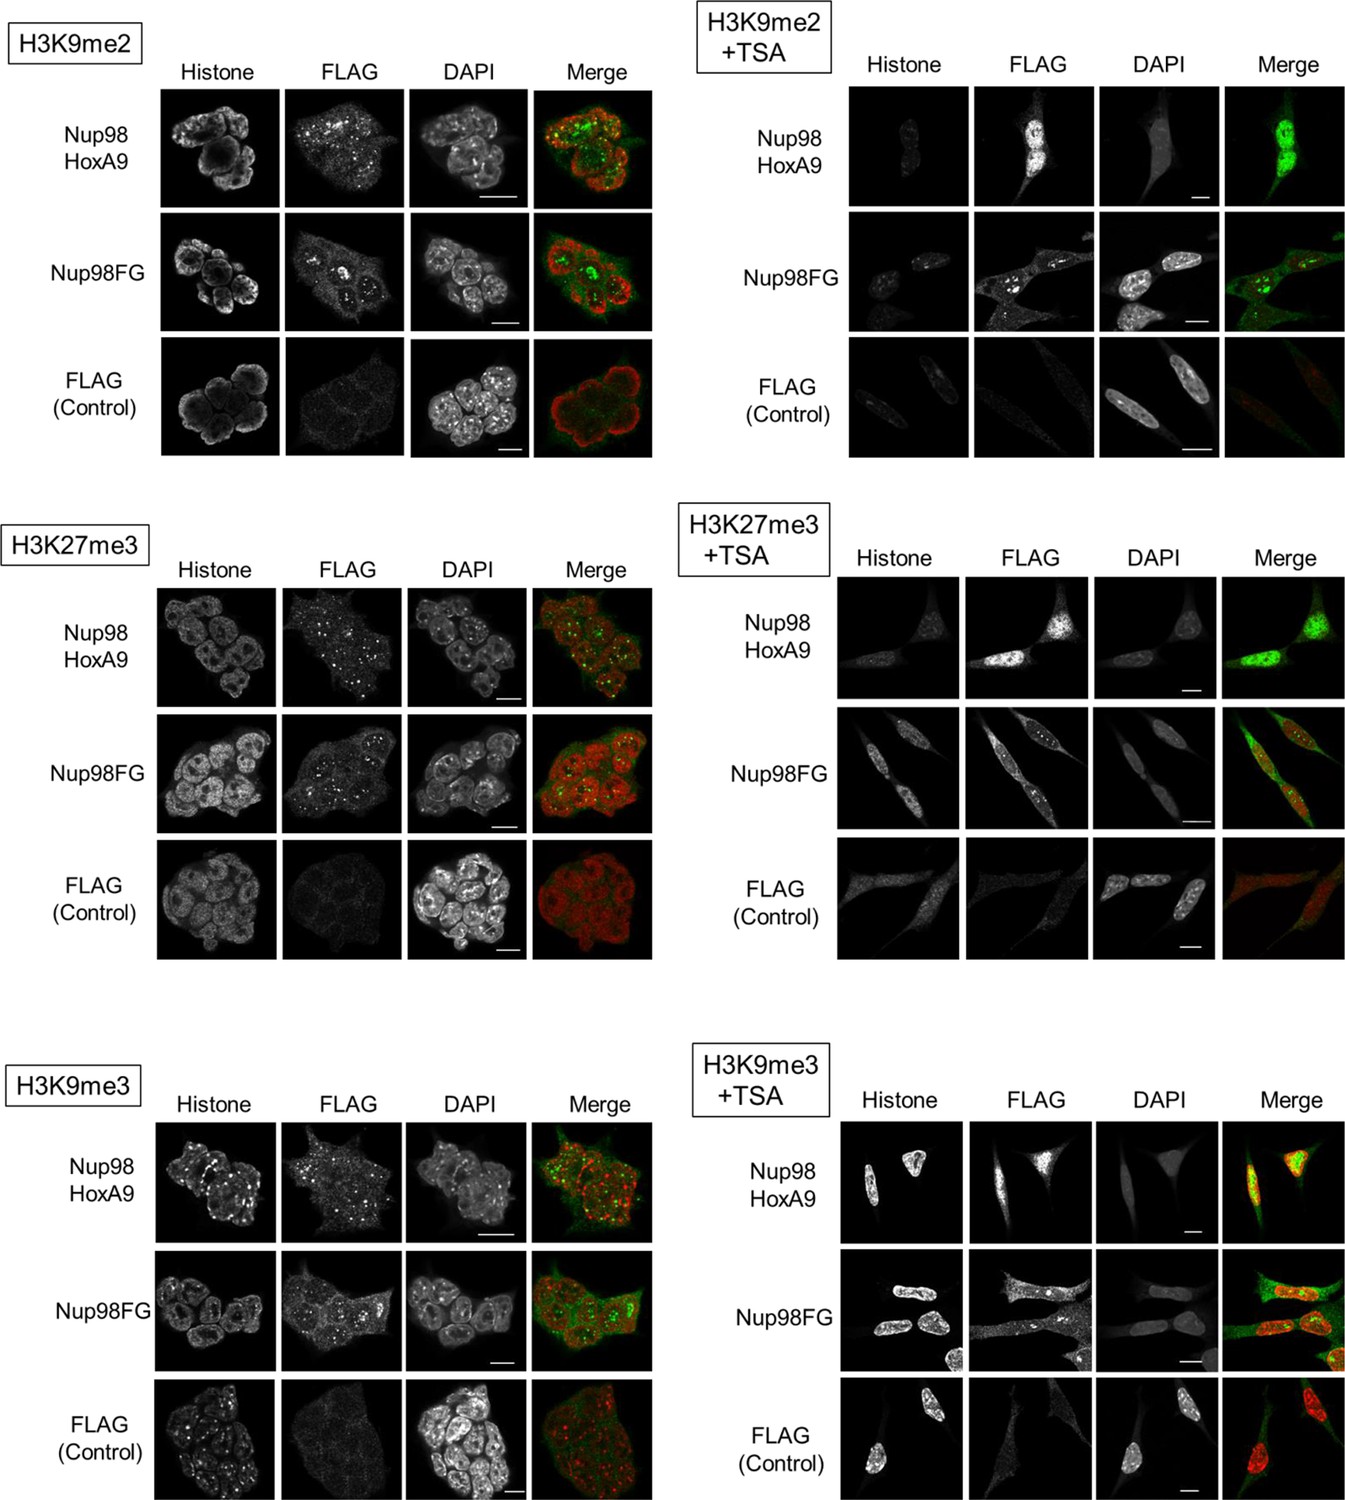
Co-staining of Nup98-HoxA9 with various histone marks.
ES cell lines expressing FLAG (control), FLAG-Nup98FG, or FLAG-Nup98-HoxA9 either cultured in the absence or presence of TSA (50 nM, 24 hr) were fixed and stained with antibodies against FLAG (polyclonal) and indicated histone modifications. DAPI staining was used to visualize nuclei. Merged picture of histone modification (red) and FLAG staining (green) are shown. Bar, 5 μm. DAPI, 4',6-diamidino-2-phenylindole; ES, embryonic stem; TSA, trichostatin A.
Figure 2—figure supplement 2
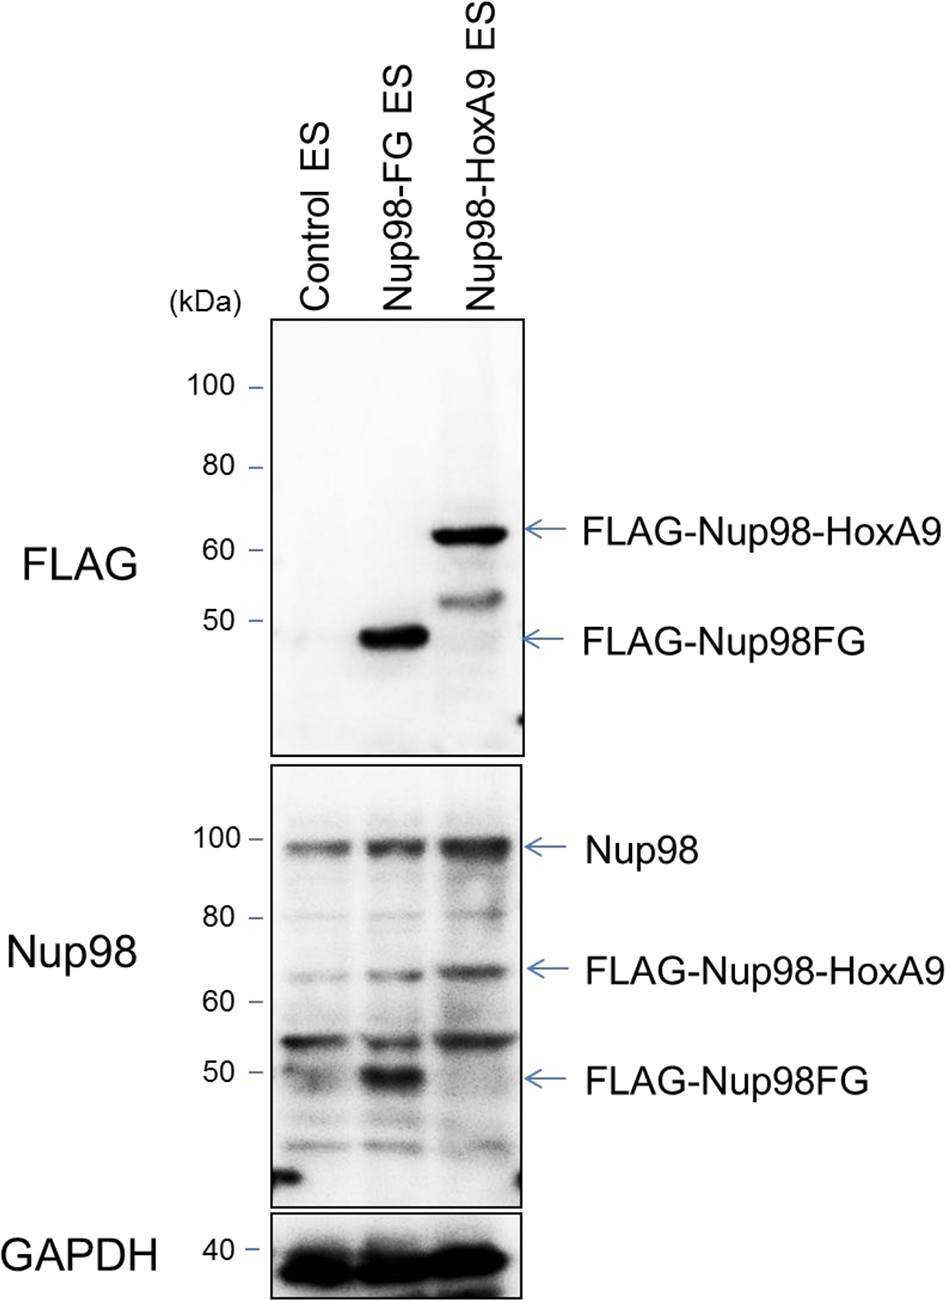
Protein expression levels of Nup98-HoxA9 and Nup98FG.
Immunoblotting was performed with antibodies against FLAG (M2), Nup98, and GAPDH using lysates from ES cell lines (equivalent to 105 cells) expressing FLAG (control), FLAG-Nup98FG, or FLAG-Nup98-HoxA9. Can Get Signal Immunoreaction Enhancer Solution (Toyobo, Osaka, Japan) was used to enhance the signal.
Figure 2—figure supplement 3
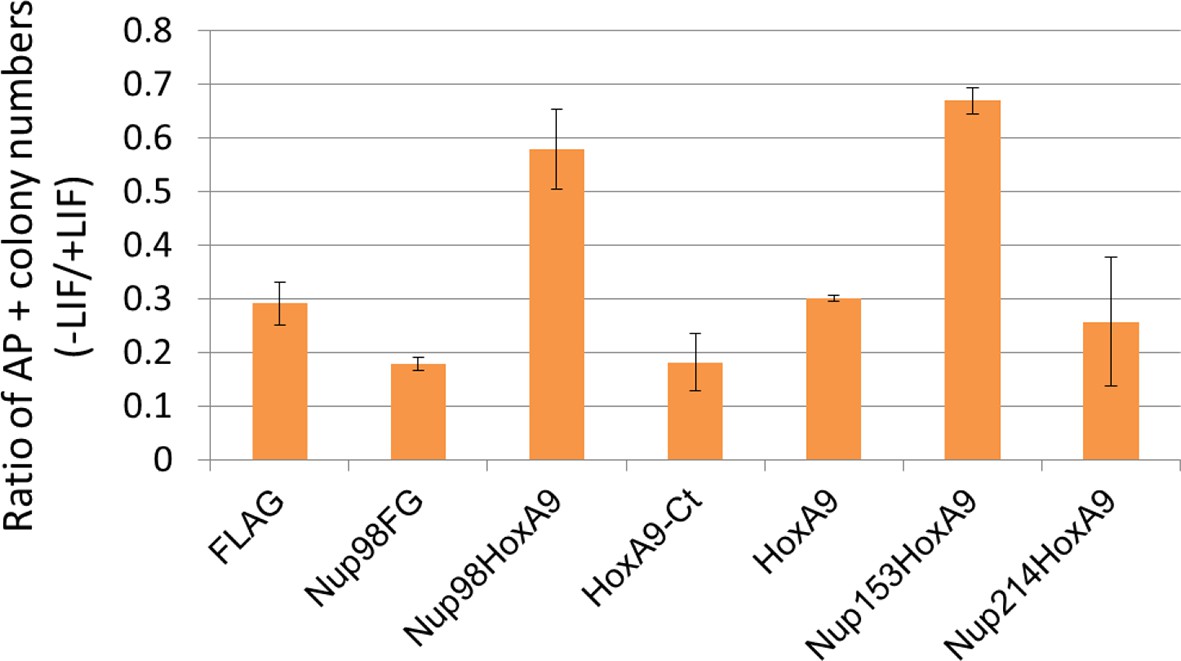
Differentiation assay of stable embryonic stem cell clones.
Alkaline phosphatase assay was performed as in Figure 2D. Data are mean values ± standard error of the mean of three independent experiments.
Figure 3 with 1 supplement
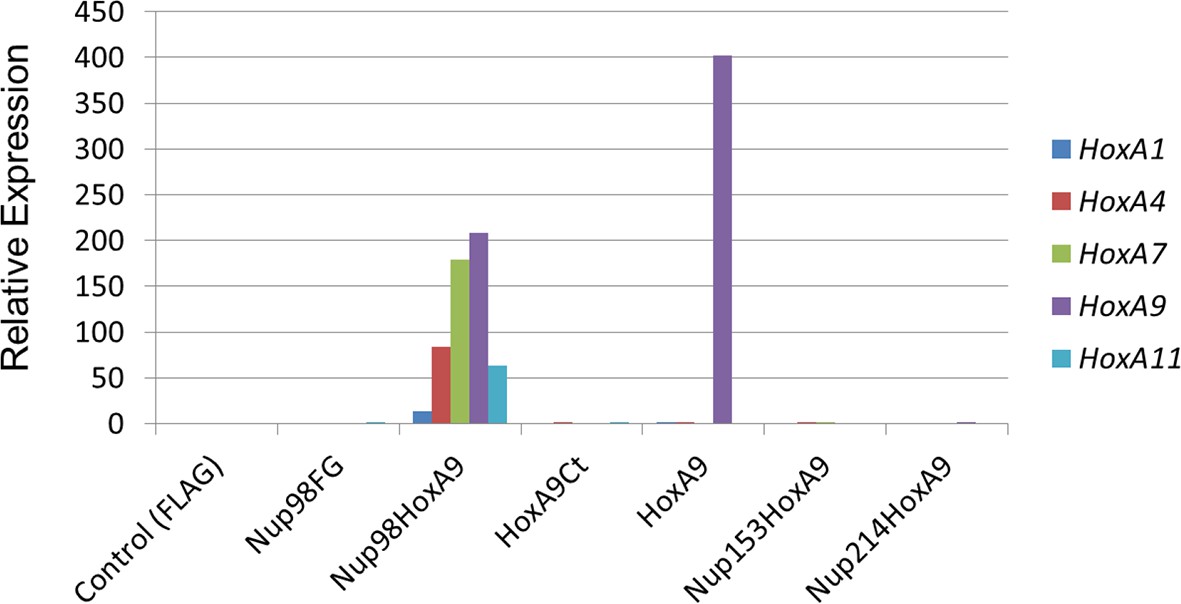
Functional characterization of various NupFG-HoxA9 fusions.
qPCR analysis of Hox-A cluster gene expression in various ES cell lines expressing the NupFG-HoxA9 fusion, Nup98FG, or HoxA9. GAPDH was used as a reference gene. ES, embryonic stem ; qPCR, quantitative polymerase chain reaction.
Figure 3—figure supplement 1
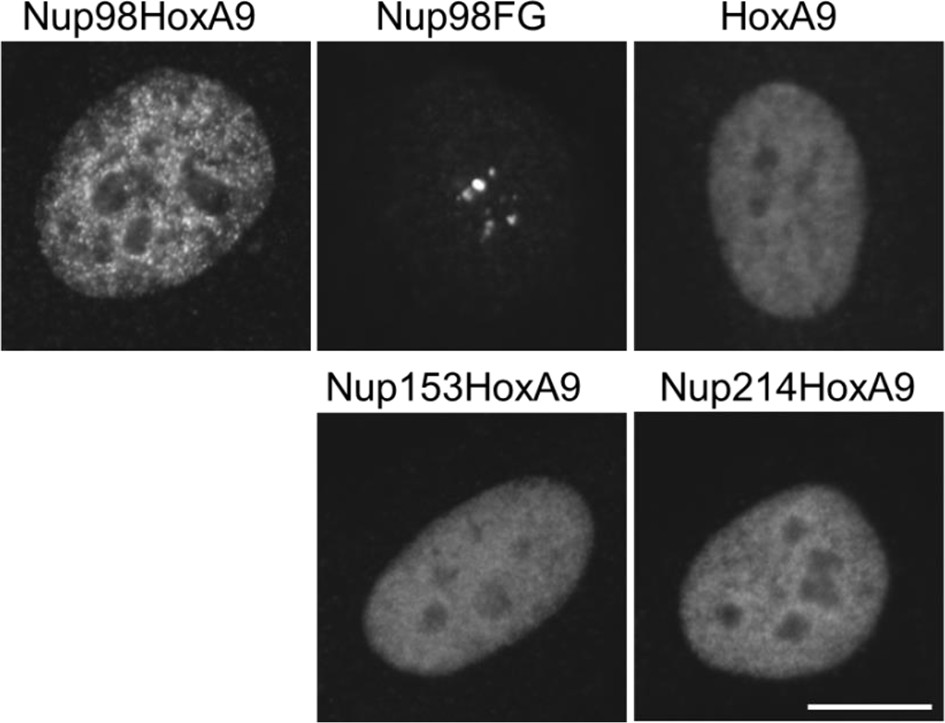
Subcellular localization of various NupFG-HoxA9 fusions.
Subcellular localization of various FLAG-NupFG-HoxA9 fusions or HoxA9 in transiently transfected HeLa cells. Bar, 10 μm.
Figure 4 with 2 supplements
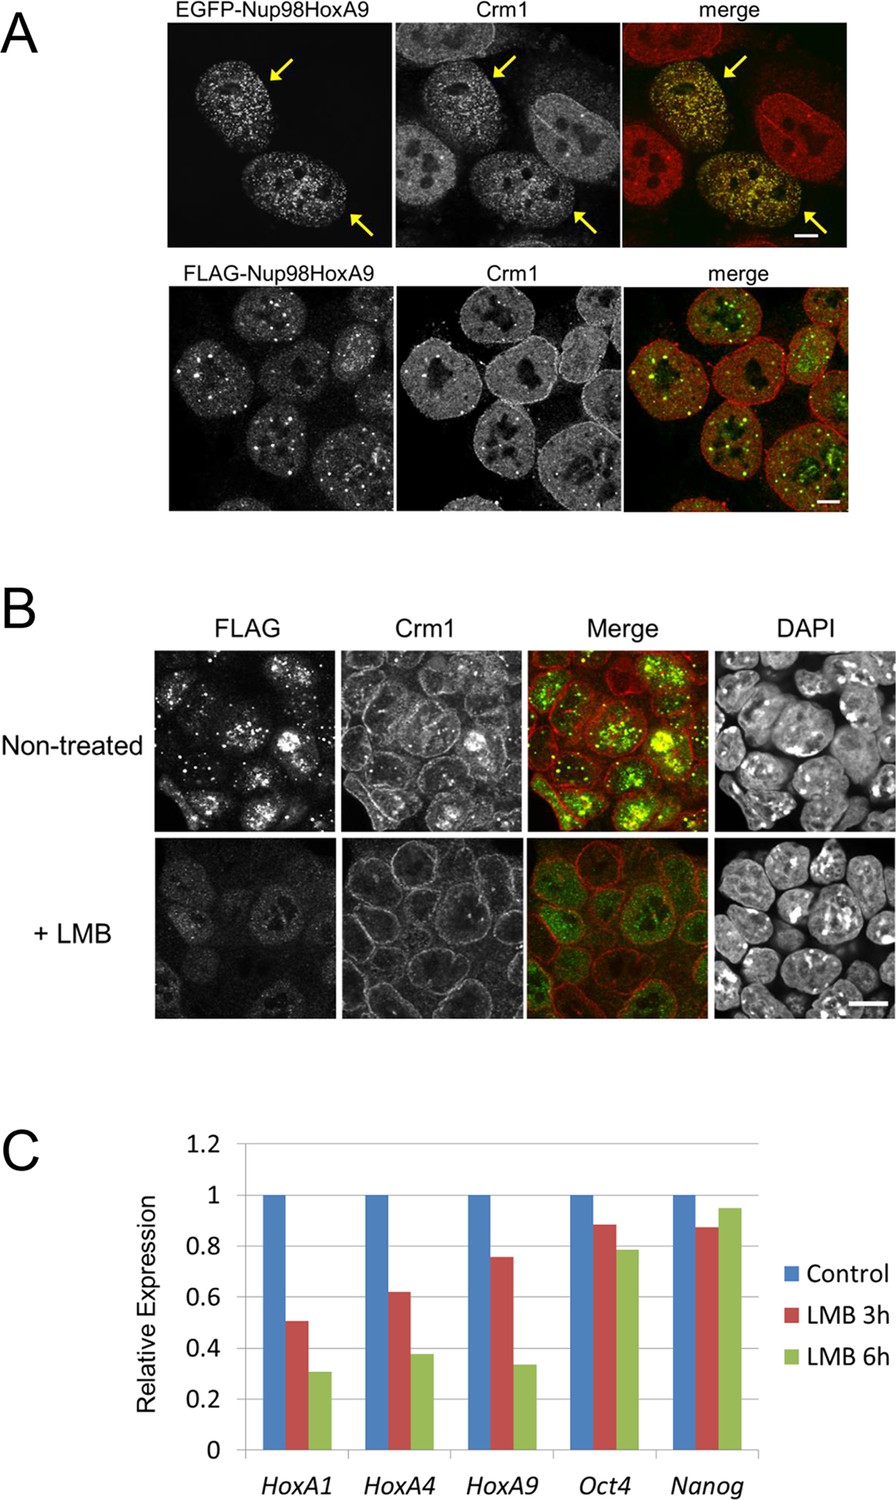
Association between Nup98-HoxA9 and Crm1 is critical for the Hox Gene activation mediated by Nup98-HoxA9.
(A) Top panel: Nup98-HoxA9 interacts and sequesters Crm1 onto Nup98-HoxA9 dots. HeLa cells were transfected with the EGFP-Nup98-HoxA9 expressing plasmid. After 24 hr, cells were fixed and stained with an anti-Crm1 antibody. Arrows indicate the cells transfected. Bottom panel: Nup98-HoxA9 ES cells were fixed and co-stained with anti-FLAG (M2) and anti-Crm1 antibodies. Merged image of FLAG (green) and Crm1 (red) is shown. Bar, 5 μm. (B) The effect of LMB treatment on the cellular localization of Nup98-HoxA9. Nup98-HoxA9 ES cells were cultured either in the presence or absence of 5 nM LMB for 2 hr, fixed and stained with antibodies against FLAG (M2) and Crm1. Merged images of FLAG (green) and Crm1 (red) are shown. Nuclei were stained with DAPI. Bar, 10 μm. (C) Effect of LMB treatment on the regulation of Hox cluster genes. Nup98-HoxA9 ES cells were cultured in the presence or absence of 5 nM LMB for 3 or 6 hr and the expression of indicated genes was analyzed by qPCR. GAPDH was used as a reference gene. EGFP, enhanced green fluorescent protein; LMB, leptomycin B; qPCR, quantitative polymerase chain reaction.
Figure 4—figure supplement 1
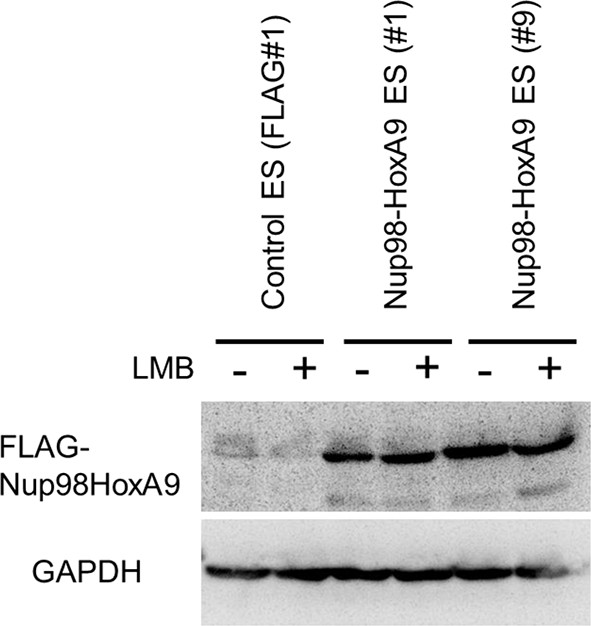
Effect of LMB treatment on the FLAG-Nup98-HoxA9 protein level.
Cell extracts of control (FLAG#1), Nup98-HoxA9 (clone#1), and Nup98-HoxA9 (clone#9) ES cells (equivalent of 105 cells) either incubated with LMB (5 nM, 2 hr) or left untreated were, loaded onto corresponding lanes. Immunoblotting was performed using an anti-FLAG or an anti-GAPDH antibody. ES, embryonic stem; LMB, leptomycin B.
Figure 4—figure supplement 2
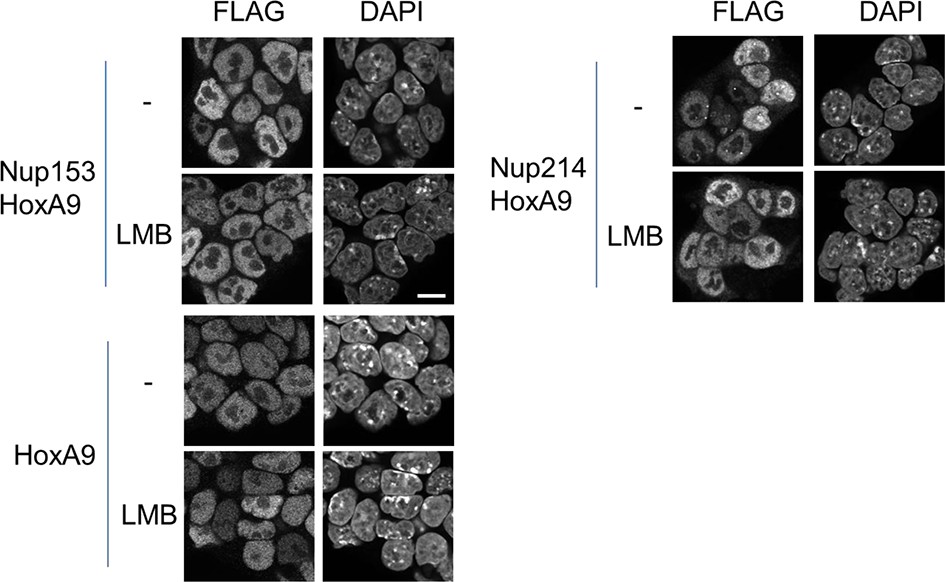
Effect of LMB treatment on the cellular localization of various NupFG-HoxA9 fusions.
ES cell clones expressing FLAG-tagged Nup153-HoxA9, Nu214-HoxA9, or HoxA9 were cultured in the presence or absence of 5 nM LMB for 2 hr, fixed and stained with an anti-FLAG (M2) antibody. Nuclei were stained with DAPI. Bar, 10 μm. DAPI, 4',6-diamidino-2-phenylindole; ES, embryonic stem; LMB, leptomycin B.
Figure 5 with 1 supplement
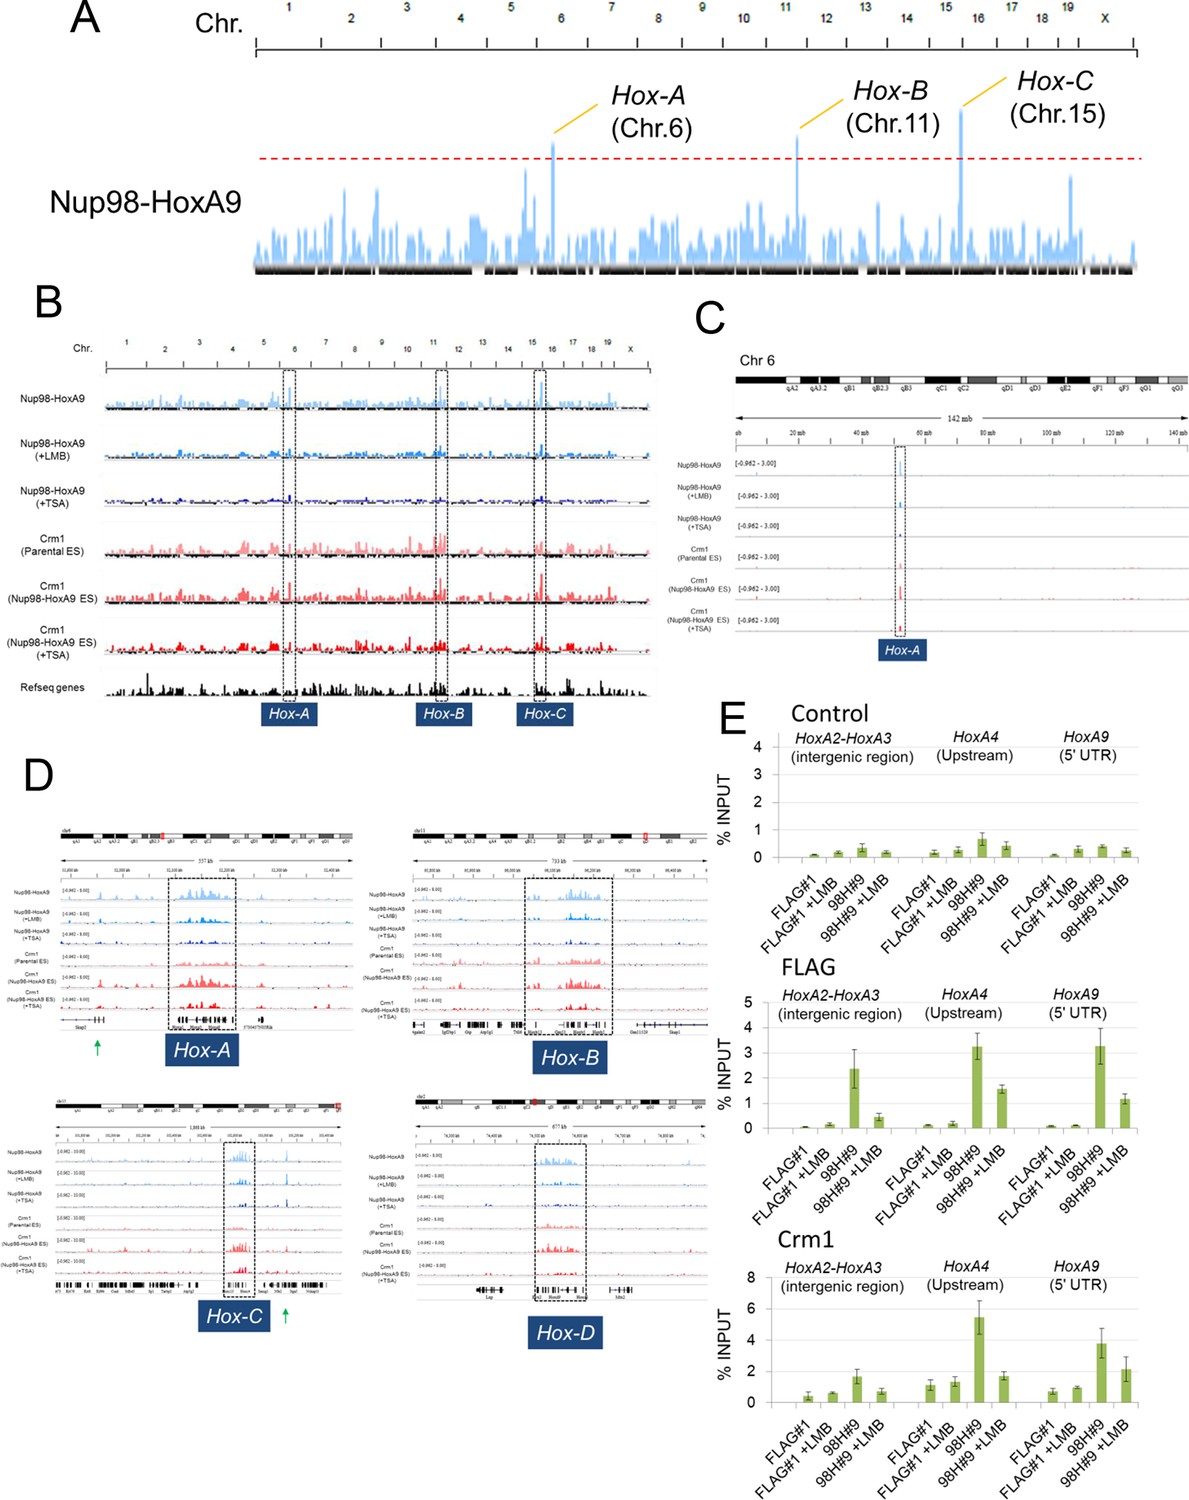
Nup98-HoxA9 is highly selectively targeted to Hox cluster regions through the chromatin-associated Crm1.
(A–D) ChIP-seq analysis of Nup98-HoxA9 or Crm1 (A, B: whole genome; C: chromosome 6; D: Hox cluster regions). The parental ES or Nup98-HoxA9 ES cells were cultured either in the absence or presence of LMB (5 nM, 2 hr) or TSA (50 nM, 24 hr) and used for ChIP-seq analysis. Also in (D) are regions that show Crm1 signals only when Nup98-HoxA9 is expressed (eg. green arrows point to regions next to Hox-A and Hox-C). (E) ChIP-qPCR analysis of FLAG-Nup98-HoxA9 and Crm1. Data are mean values ± standard error of the mean of three independent experiments. ChIP-seq, ChIP sequencing; ES, embryonic stem; LMB, leptomycin B; qPCR, quantitative polymerase chain reaction; TSA, trichostatin A.
Figure 5—figure supplement 1
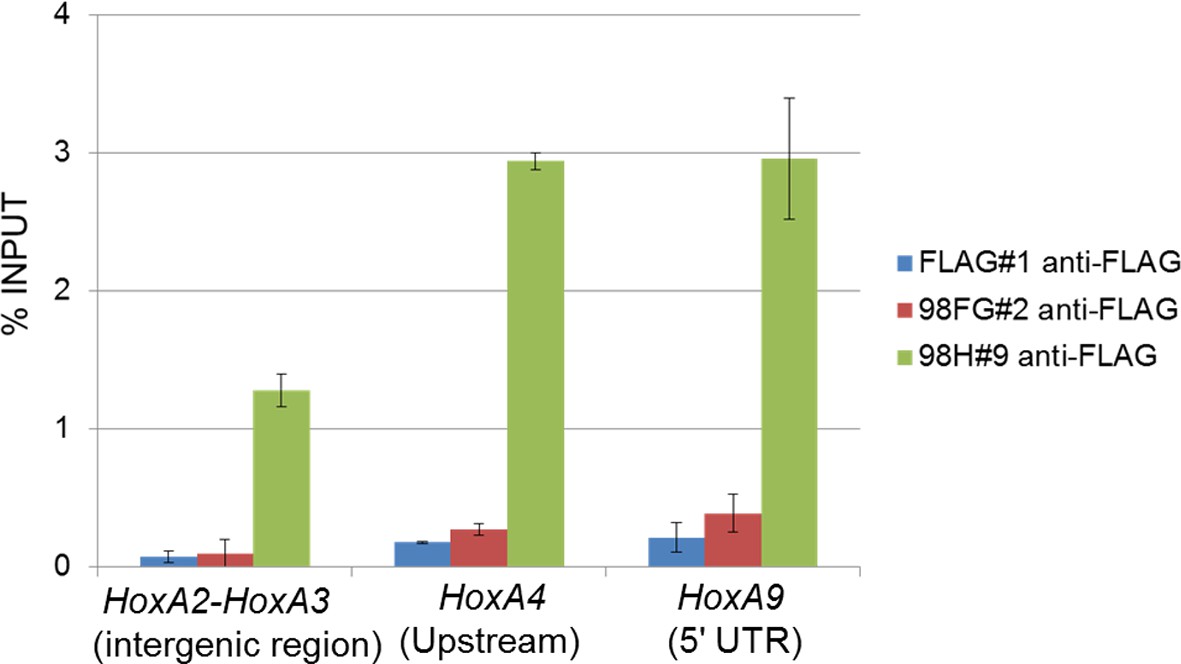
Binding of Nup98FG or Nup98HoxA9 to Hox-A cluster region.
ChIP-qPCR analysis of control (FLAG), Nup98FG (98FG), and Nup98-HoxA9 (98H) expressing ES cells. ChIP-qPCR analysis was performed using an anti-FLAG antibody. Data are mean values ± standard error of the mean of three independent experiments. ChIP-seq, ChIP-sequencing; qPCR, quantitative polymerase chain reaction.
Figure 6 with 1 supplement

Genome-wide analysis of FLAG-Nup98-HoxA9 and Crm1 binding sites.
(A) Aggregation plots of FLAG-Nup98-HoxA9 and Crm1 binding sites. FLAG-Nup98-HoxA9 binding signals in untreated, LMB-treated, and TSA-treated cells are mapped against either FLAG-Nup98-HoxA9 (top, left) or Crm1 binding sites (top, right) of untreated cells. Crm1 binding signals in control, Nup98-HoxA9 ES cells, and TSA-treated Nup98-HoxA9 ES cells were mapped against either Crm1 (bottom, left) or FLAG-Nup98-HoxA9 binding sites (bottom, right) of untreated cells. (B) Box plot showing FLAG-Nup98-HoxA9 signals (RPKM, reads per kilobase per million mapped reads) in untreated, TSA-treated, and LMB-treated cells either around FLAG-Nup98-HoxA9 binding sites (upstream 2 kb to downstream 2 kb) in untreated Nup98-HoxA9 ES cells or around Crm1 binding sites (upstream 2 kb to downstream 2 kb) in control ES cells, or Crm1 signals (RPKM) in control ES, Nup98-HoxA9 ES, and TSA-treated Nup98-HoxA9 ES cells around Crm1 binding sites (upstream 2 kb to downstream 2kb) in control ES cells, or around FLAG-Nup98-HoxA9 binding sites in untreated Nup98-HoxA9 ES cells. (C) Venn diagrams showing the overlap between genes associated with FLAG-Nup98-HoxA9, Crm1 in control ES, and Crm1 in Nup98-HoxA9 ES. Genes that contained FLAG-Nup98-HoxA9 or Crm1 binding site(s) within 5000 bp upstream and 1000 bp downstream of the TSS were analyzed. The numbers indicate the number of genes in each category. ES, embryonic stem; LMB, leptomycin B; TSA, trichostatin A; TSS, transcription start site.
Figure 6—figure supplement 1
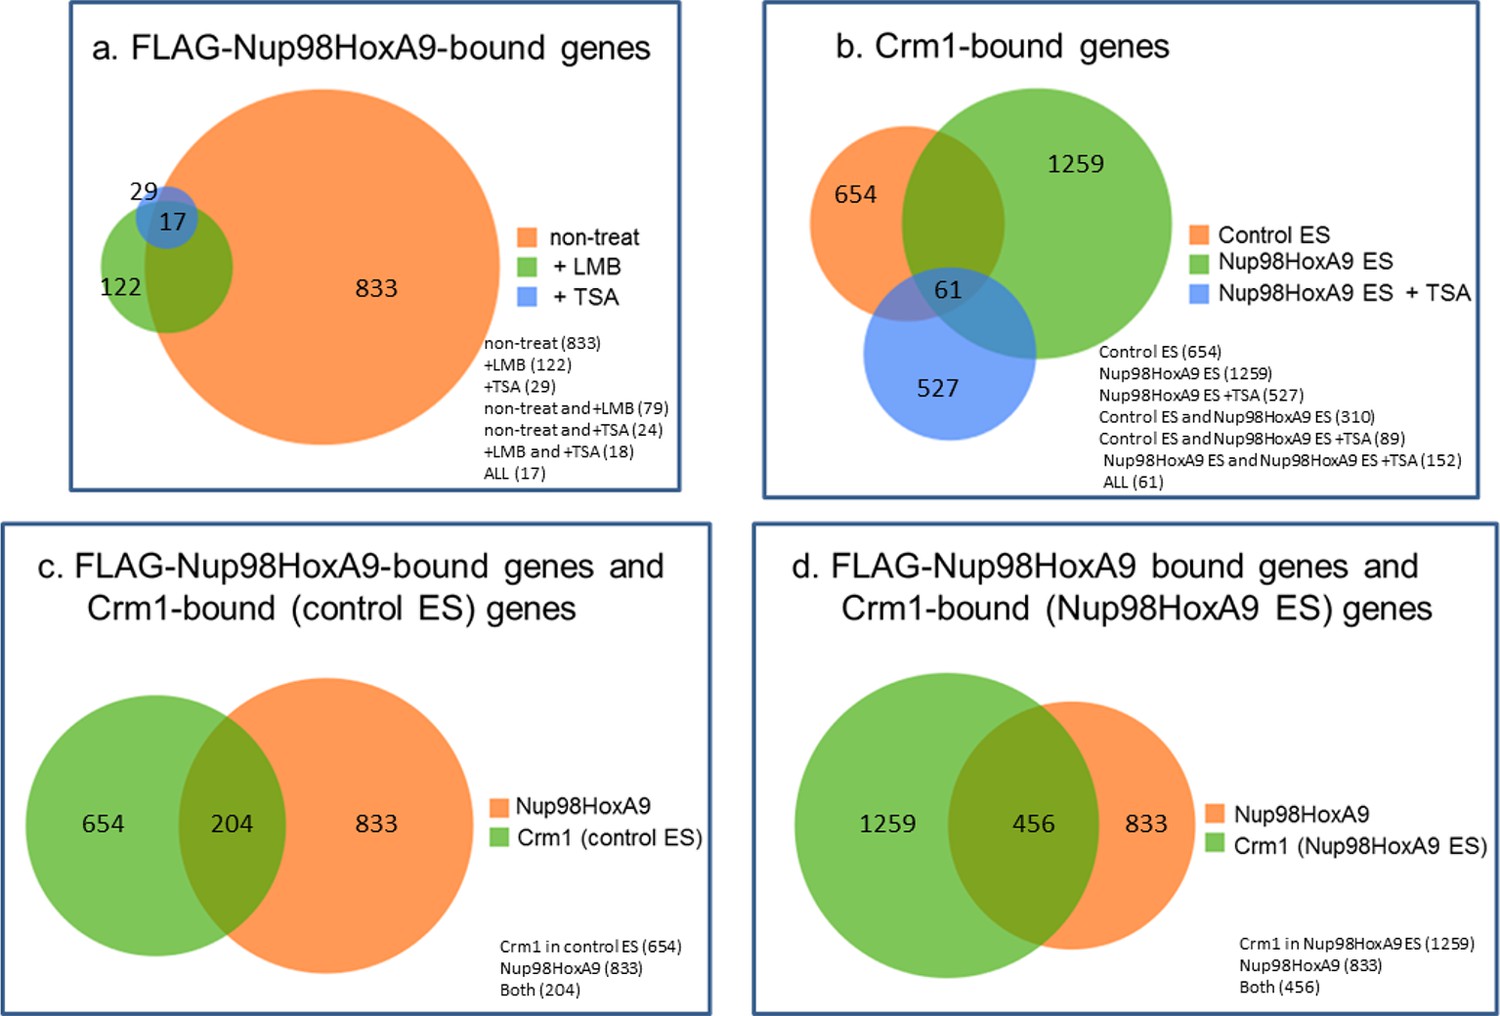
Venn diagrams showing the overlap between genes associated with FLAG-Nup98-HoxA9 and/or Crm1 in various cell lines or at different culture conditions.
Genes that contained FLAG-Nup98-HoxA9 or Crm1 binding site(s) within 5000 bp upstream and 1000 bp downstream of the TSS were analyzed. (a) Overlap of FLAG-Nup98-HoxA9-bound genes in untreated, LMB-, or TSA-treated cells. The number of genes for each category is indicated. (b) Overlap of Crm1-bound genes in control, Nup98-HoxA9, and TSA-treated Nup98-HoxA9 ES cells. (C and D) Overlap of FLAG-Nup98-HoxA9 and Crm1-bound genes in control (c) or Nup98-HoxA9 (d) ES cells. ES, embryonic stem; LMB, leptomycin B; TSA, trichostatin A; TSS, transcription start site.
Figure 7 with 4 supplements
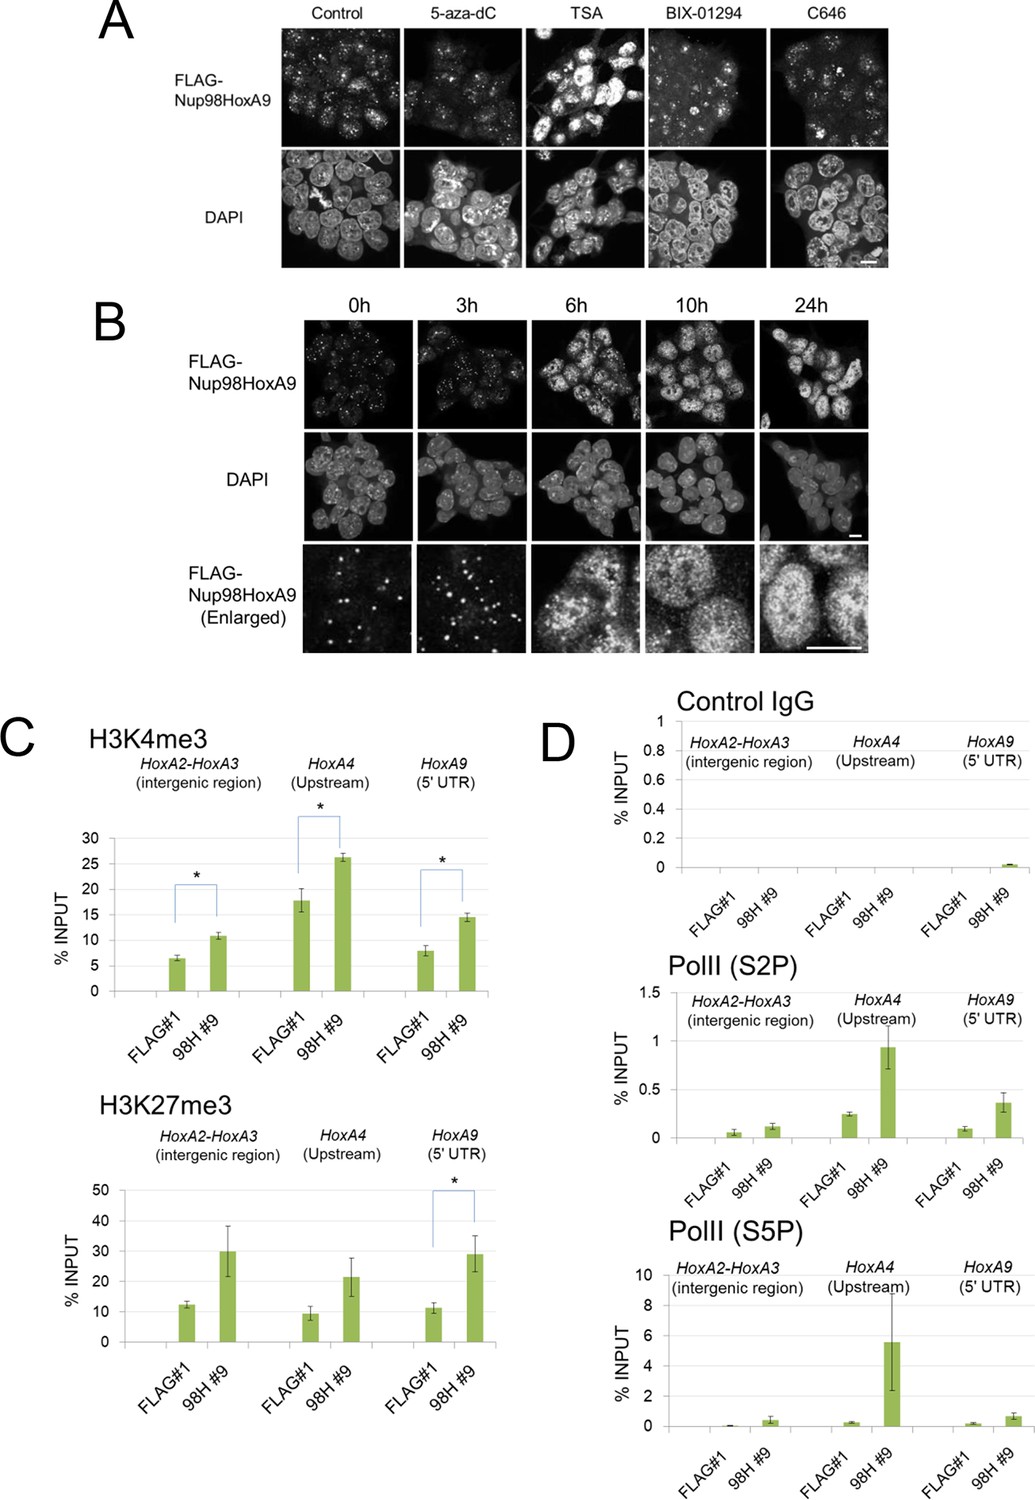
Epigenetic status and chromatin binding of Nup98-HoxA9/Crm1.
(A) Effect of various epigenetic inhibitors on the localization of Nup98-HoxA9. Epigenetic effectors; 5-aza-dC (an inhibitor of DNA methyltransferase), TSA (an inhibitor of histone deacetylases), BIX-1294 (an inhibitor of the G9a histone methyltransferase), and C646 (an inhibitor of the histone acetyltransferase p300). Immunostaining of FLAG-Nup98-HoxA9 ES cells was performed upon treatment with either 5-aza-dC (2 μM), TSA (100 nM), BIX-01294 (10 μM) or C646 (25 μM) for 24 hr. Nuclei were stained with DAPI. Bar, 10 μm. (B) Time-course of the Nup98-HoxA9 localization upon TSA (50 nM) treatment. Nuclei were stained with DAPI. Bar, 10 μm. (C) The effect of Nup98-HoxA9 expression on the histone modification of the Hox-A cluster region. ChIP-qPCR analysis was performed using an anti-H3K4me3 or an anti-H3K27me3 antibody. Data are mean values ± standard error of the mean of three independent experiments. Statistical significance was evaluated with the Student t test. ∗p < 0.05. (D) RNAPII recruitment at Hox cluster region. ChIP-qPCR analysis was performed using anti-PolII (S2P) or anti-PolII (S5P) antibody. Data are mean values ± standard error of the mean of three independent experiments. 5-aza-dC, 5-Aza-2'-deoxycytidine; ChIP, chromatin immunoprecipitation; DAPI, 4',6-diamidino-2-phenylindole; qPCR, quantitative polymerase chain reaction; TSA, trichostatin A.
Figure 7—figure supplement 1
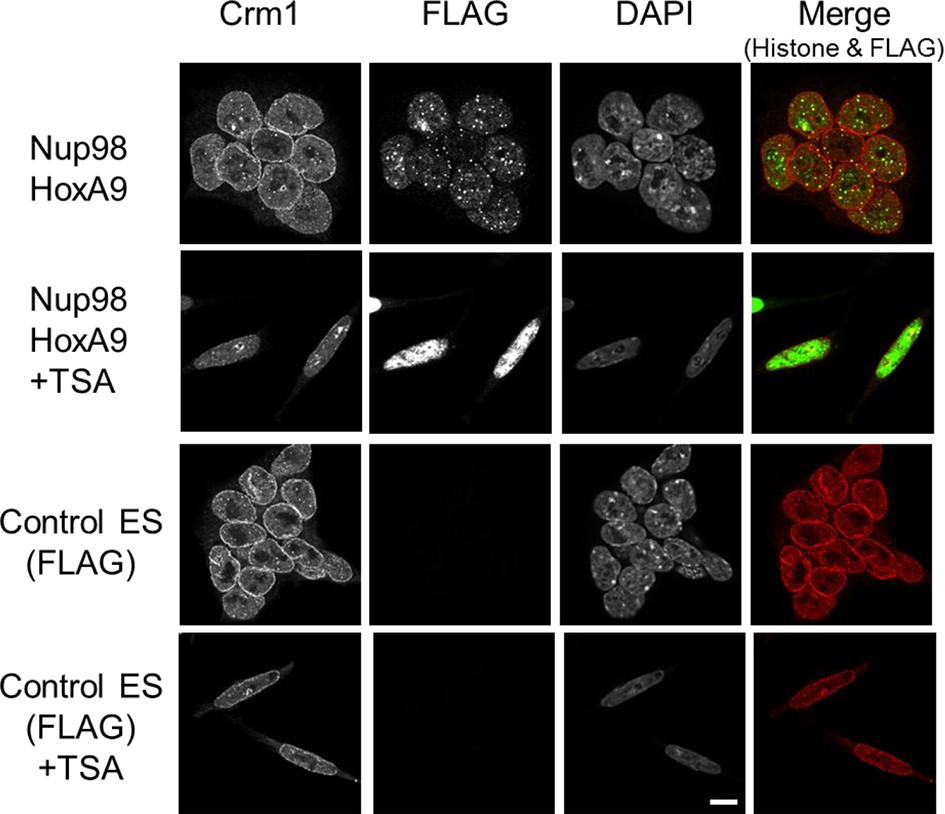
Effect of TSA treatment on the subcellular localization of Crm1.
Control ES or Nup98-HoxA9 expressing ES cells were cultured in the presence or absence of 50 nM TSA for 24 hr. Then, the cells were fixed and stained with antibodies against FLAG (M2) and Crm1. Merged images of FLAG (green) and Crm1 (red) are shown. Nuclei were stained with DAPI. Bar, 10 μm. DAPI, 4',6-diamidino-2-phenylindole; ES, embryonic stem; TSA, trichostatin A.
Figure 7—figure supplement 2
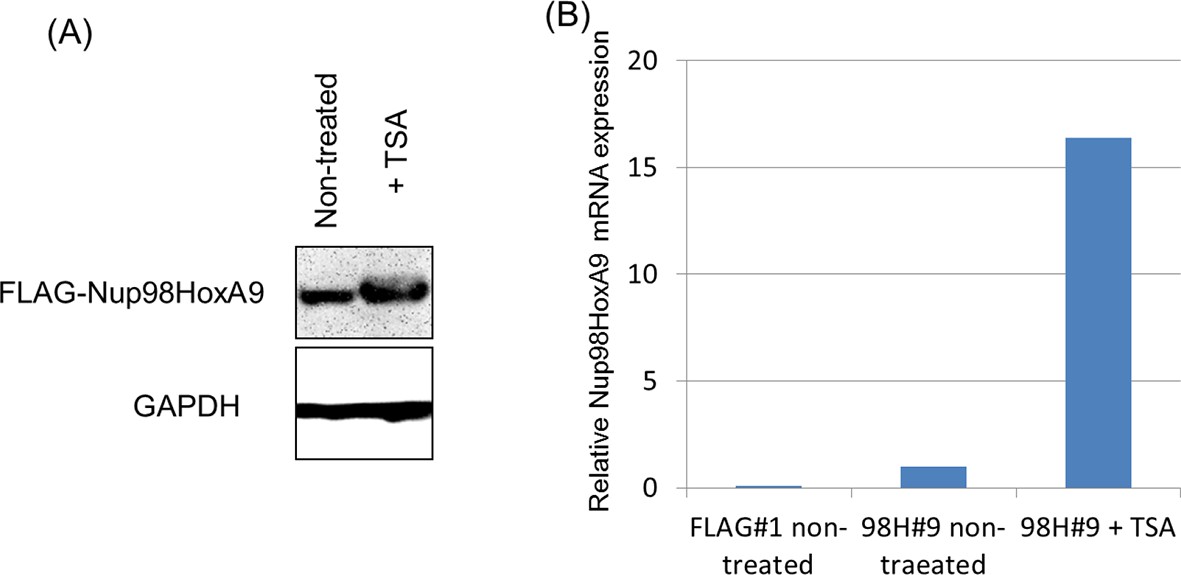
Effect of TSA treatment on the expression of FLAG-Nup98-HoxA9.
Immunoblotting (A) or qPCR (B) indicated upregulation of FLAG-Nup98-HoxA9 by TSA treatment at a low dose. (A) Cell extracts of untreated or TSA-treated (50 nM, 24 hr) Nup98-HoxA9 ES cells (equivalent of 105 cells) were loaded into corresponding lanes. Immunoblotting was performed using an anti-FLAG or an anti-GAPDH antibody. (B) qPCR analysis of Nup98-HoxA9 mRNA expression levels. The values were normalized to GAPDH mRNA expression levels. mRNA, messenger RNA; qPCR, quantitative polymerase chain reaction; TSA, trichostatin A.
Figure 7—figure supplement 3
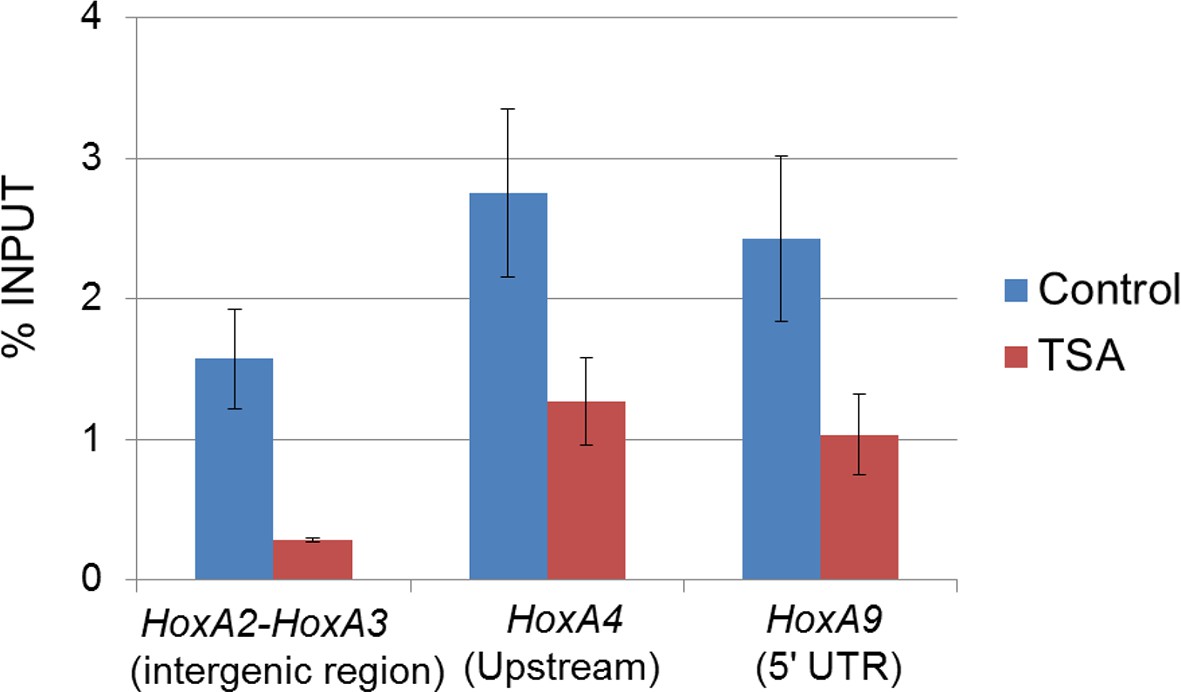
Effect of TSA treatment on Crm1 binding to the Hox-A cluster region in control ES cells.
Control ES cells (FLAG #1) were cultured in the presence or absence of 50 nM TSA for 24 hr. ChIP-qPCR analysis was performed using an anti-Crm1 antibody. Data are mean values ± standard error of the mean of three independent experiments. ChIP, chromatin immunoprecipitation; ES, embryonic stem; qPCR, quantitative polymerase chain reaction; TSA, trichostatin A.
Figure 7—figure supplement 4
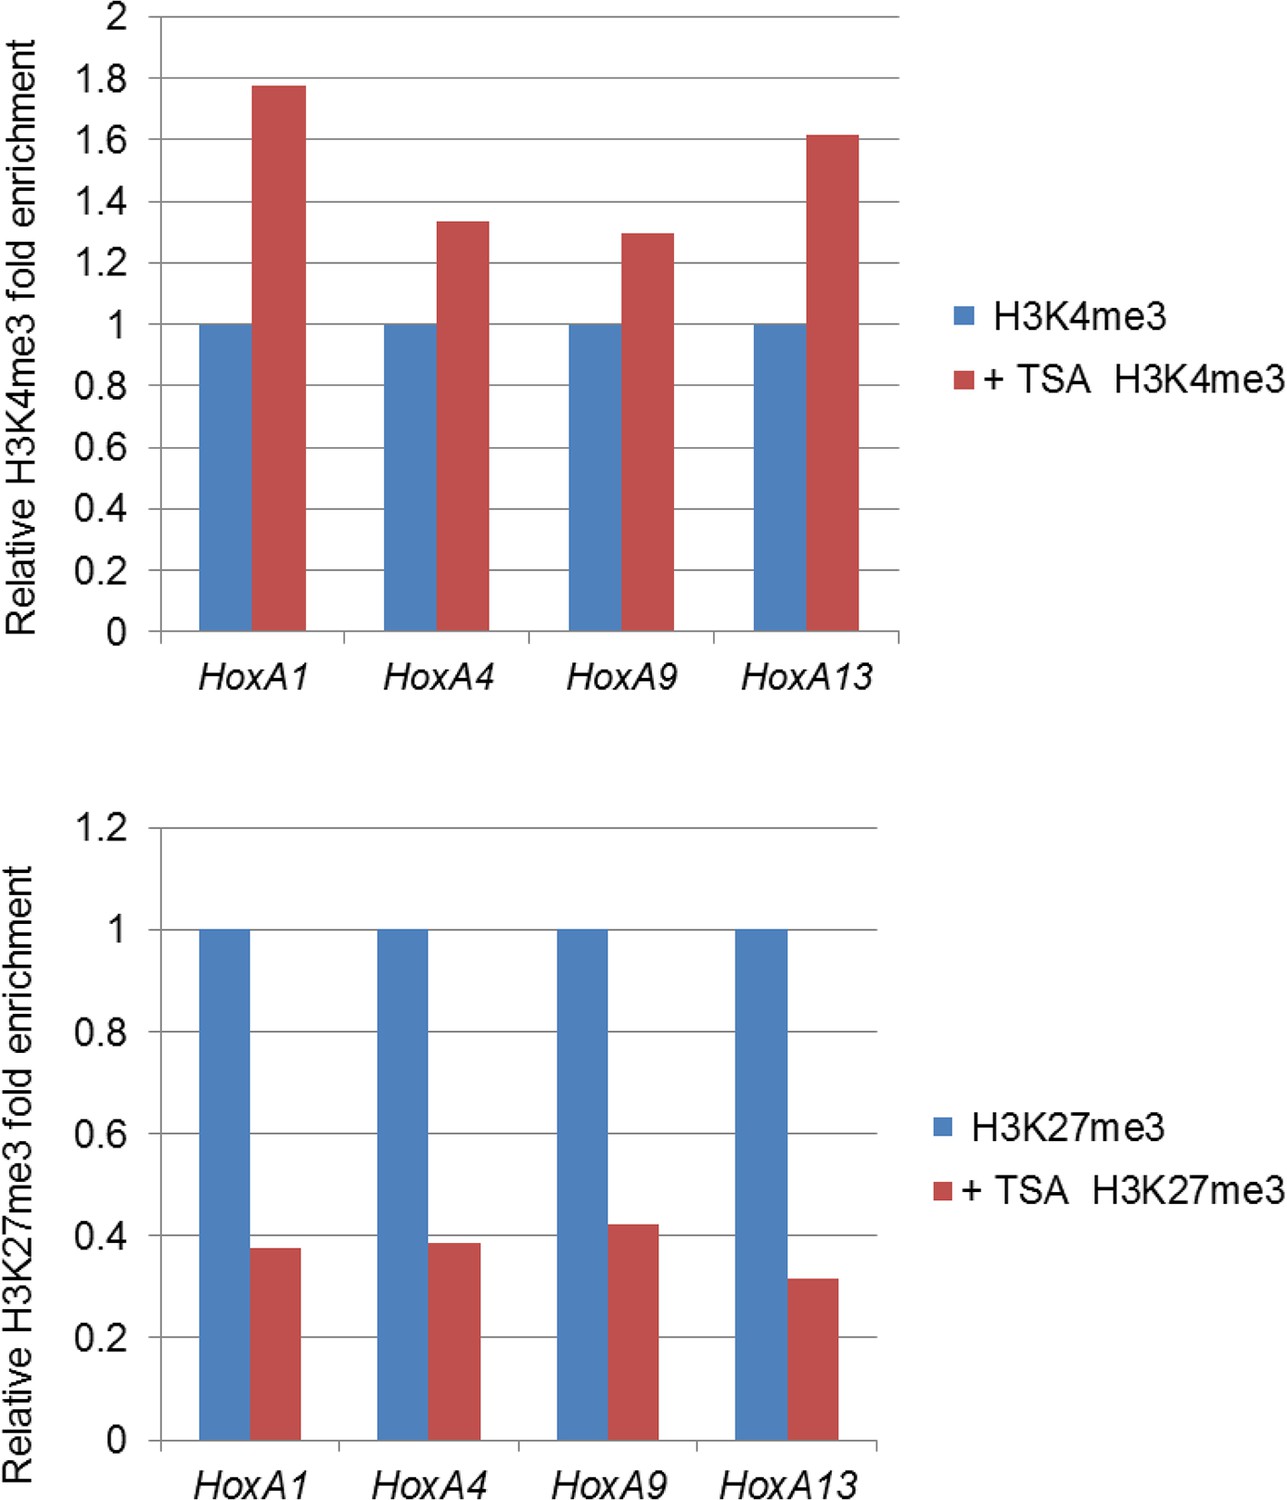
Effect of TSA treatment on histone modifications of the Hox-A cluster region.
Control ES cells (FLAG #1) were cultured either in the absence or presence of 50 nM TSA for 24 hr. ChIP-qPCR analysis was performed using an anti-H3K4me3 or an anti-H3K27me3 antibody. ChIP, chromatin immunoprecipitation; ES, embryonic stem; qPCR, quantitative polymerase chain reaction; TSA, trichostatin A
Tables
Table 1
List of the top 32 genes that were upregulated both in Nup98-HoxA9 clone #1 and Nup98-HoxA9 clone#9.
| Fold change (log2) | |||
|---|---|---|---|
| Description | 98H#1 /EB3 | 98H#9 /EB3 | HoxA9-Ct#22/EB3 |
| Mus musculus homeobox A3 (Hoxa3), mRNA [NM_010452] | 9.15 | 9.37 | 0.05 |
| Mus musculus homeobox A10 (Hoxa10), transcript variant 1, mRNA [NM_008263] | 8.17 | 7.61 | 0.05 |
| Mus musculus 2 days pregnant adult female oviduct cDNA, RIKEN full-length enriched library, clone:E230011F24 [AK053996] | 7.60 | 7.71 | 0.08 |
| Mus musculus homeobox A7 (Hoxa7), mRNA [NM_010455] | 7.69 | 7.44 | 0.32 |
| Mus musculus homeobox A11 (Hoxa11), mRNA [NM_010450] | 7.87 | 6.95 | 0.06 |
| Mus musculus homeobox C6 (Hoxc6), mRNA [NM_010465] | 8.46 | 5.99 | 0.05 |
| Mus musculus homeobox A5 (Hoxa5), mRNA [NM_010453] | 7.08 | 7.11 | 0.06 |
| Mus musculus blastocyst blastocyst cDNA, RIKEN full-length enriched library, clone:I1C0031F10 product [AK145700] | 6.16 | 7.10 | 1.26 |
| Mus musculus homeobox A9 (Hoxa9), mRNA [NM_010456] | 6.60 | 6.64 | 0.09 |
| predicted gene 3395 [Source:MGI Symbol;Acc:MGI:3781573] [ENSMUST00000172100] | 5.95 | 6.77 | 1.45 |
| Mus musculus blastocyst blastocyst cDNA, RIKEN full-length enriched library, clone:I1C0015F22 product [AK145555] | 5.87 | 6.76 | 0.51 |
| Mus musculus HOXA11 antisense RNA (non-protein coding) (Hoxa11as), non-coding RNA [NR_015348] | 6.59 | 5.78 | -0.34 |
| Mus musculus blastocyst blastocyst cDNA, RIKEN full-length enriched library, clone:I1C0027E24 product [AK167004] | 5.54 | 6.46 | 0.75 |
| Mus musculus homeobox B8 (Hoxb8), mRNA [NM_010461] | 6.56 | 5.38 | 0.06 |
| Mus musculus blastocyst blastocyst cDNA, RIKEN full-length enriched library, clone:I1C0015H22 product [AK166824] | 5.53 | 6.36 | 1.07 |
| Mus musculus RCB-0559 K-1. F1 cDNA, RIKEN full-length enriched library, clone:G430049J08 product [AK144159] | 5.19 | 6.19 | 0.37 |
| Mus musculus homeobox A4 (Hoxa4), mRNA [NM_008265] | 5.24 | 5.49 | 0.29 |
| Mus musculus blastocyst blastocyst cDNA, RIKEN full-length enriched library, clone:I1C0037K09 product [AK145750] | 4.93 | 5.72 | 0.83 |
| Mus musculus homeobox C4 (Hoxc4), mRNA [NM_013553] | 6.19 | 4.29 | 1.28 |
| Mus musculus homeobox B4 (Hoxb4), mRNA [NM_010459] | 5.27 | 4.61 | -0.33 |
| Mus musculus homeobox A6 (Hoxa6), mRNA [NM_010454] | 4.95 | 4.82 | -1.14 |
| Mus musculus homeobox B7 (Hoxb7), mRNA [NM_010460] | 5.40 | 4.16 | -0.75 |
| Mus musculus homeobox B2 (Hoxb2), mRNA [NM_134032] | 4.77 | 4.30 | 0.44 |
| Mus musculus cystatin 13 (Cst13), mRNA [NM_027024] | 3.72 | 5.31 | 2.99 |
| Mus musculus brain and acute leukemia, cytoplasmic (Baalc), mRNA [NM_080640] | 3.57 | 5.44 | 1.17 |
| Mus musculus homeobox A2 (Hoxa2), mRNA [NM_010451] | 4.47 | 4.37 | 0.16 |
| Mus musculus CAP, adenylate cyclase-associated protein, 2 (yeast) (Cap2), mRNA [NM_026056] | 4.48 | 4.30 | 1.16 |
| RIKEN cDNA 5730446D14 gene [Source:MGI Symbol;Acc:MGI:1913890] [ENSMUST00000155922] | 4.30 | 4.44 | 0.06 |
| Mus musculus olfactory receptor 161 (Olfr161), mRNA [NM_146860] | 3.50 | 5.06 | 0.56 |
| Mus musculus carbonyl reductase 2 (Cbr2), mRNA [NM_007621] | 4.25 | 3.97 | 0.06 |
| Mus musculus homeobox A1 (Hoxa1), mRNA [NM_010449] | 3.86 | 4.13 | -0.11 |
| Mus musculus Scm-like with four mbt domains 2 (Sfmbt2), transcript variant 3, mRNA [NM_001198809] | 3.58 | 3.65 | 2.69 |
-
cDNA, complementary DNA; mRNA, messenger RNA.
Additional files
-
Supplementary file 1
List of primers used in this study.
- https://doi.org/10.7554/eLife.09540.024
Download links
A two-part list of links to download the article, or parts of the article, in various formats.
Downloads (link to download the article as PDF)
Open citations (links to open the citations from this article in various online reference manager services)
Cite this article (links to download the citations from this article in formats compatible with various reference manager tools)
Chromatin-prebound Crm1 recruits Nup98-HoxA9 fusion to induce aberrant expression of Hox cluster genes
eLife 5:e09540.
https://doi.org/10.7554/eLife.09540


