Determining composition of micron-scale protein deposits in neurodegenerative disease by spatially targeted optical microproteomics
- University of Toronto, Canada
- Stanford University, United States
- University Health Network, Canada
Figures
Figure 1
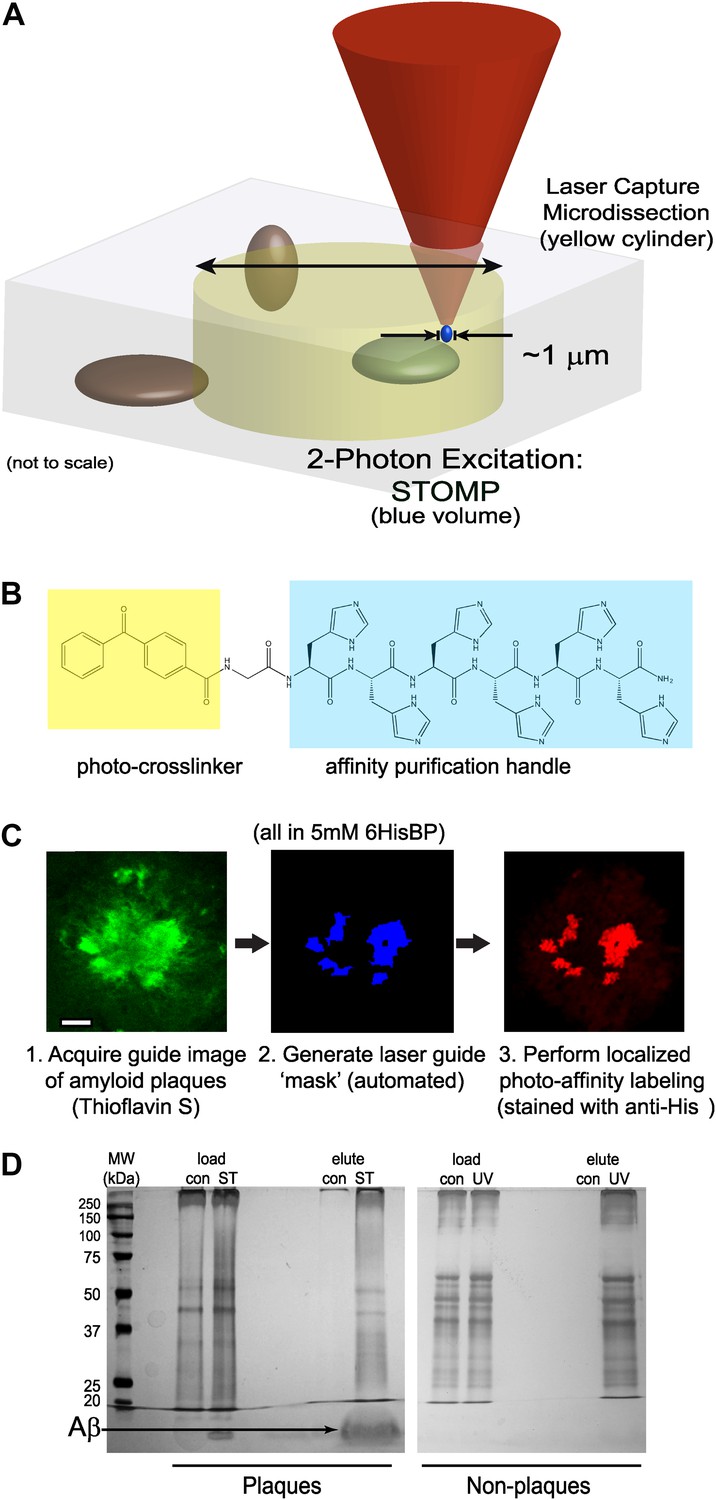
Overview of STOMP technology.
(A) Schematic diagram comparing volumes selected for excision by laser capture microdissection (LCM) (yellow cylinder) and spatially targeted optical microproteomics (STOMP) (blue volume). The STOMP excitation volume is limited approximately to the point spread function of a high numerical aperture lens (<1 µm in the xy plane, ∼1.0 µm axially) compared to ∼10 µm for LCM. (B) Structure of the bifunctional photocrosslinker used in this study; the affinity purification hexahistidine peptide is highlighted in blue, the photocrosslinker benzophenone group is highlighted in yellow. (C) Overview of the STOMP protocol. Tissue sections or cells are first fixed in cold methanol and stained using specific dyes or antibodies. (1) A guide image is acquired at a wavelength that does not activate the photocrosslinker. (2) The guide image is converted to a digital mask that directs the two-photon laser. (3) Two-photon laser selectively illuminates region of interest. The final image shown is anti-His tag immunofluorescence corresponding to areas of photo-tag crosslinking. (D) Silver stain of SDS-PAGE of material retrieved from selective STOMP of CRND8 mouse plaques (left panel) or non-plaque regions of an adjacent brain section (right panel). In each case the control (‘con’) is non-specific binding to Ni2+-NTA agarose beads. Load is 1% of total protein after solubilization of tissue. Note that the predominant protein photo-tagged in the STOMP sample is Aβ (arrow), which is not visible in the non-plaque experiment because of its low overall abundance.
Figure 2 with 2 supplements
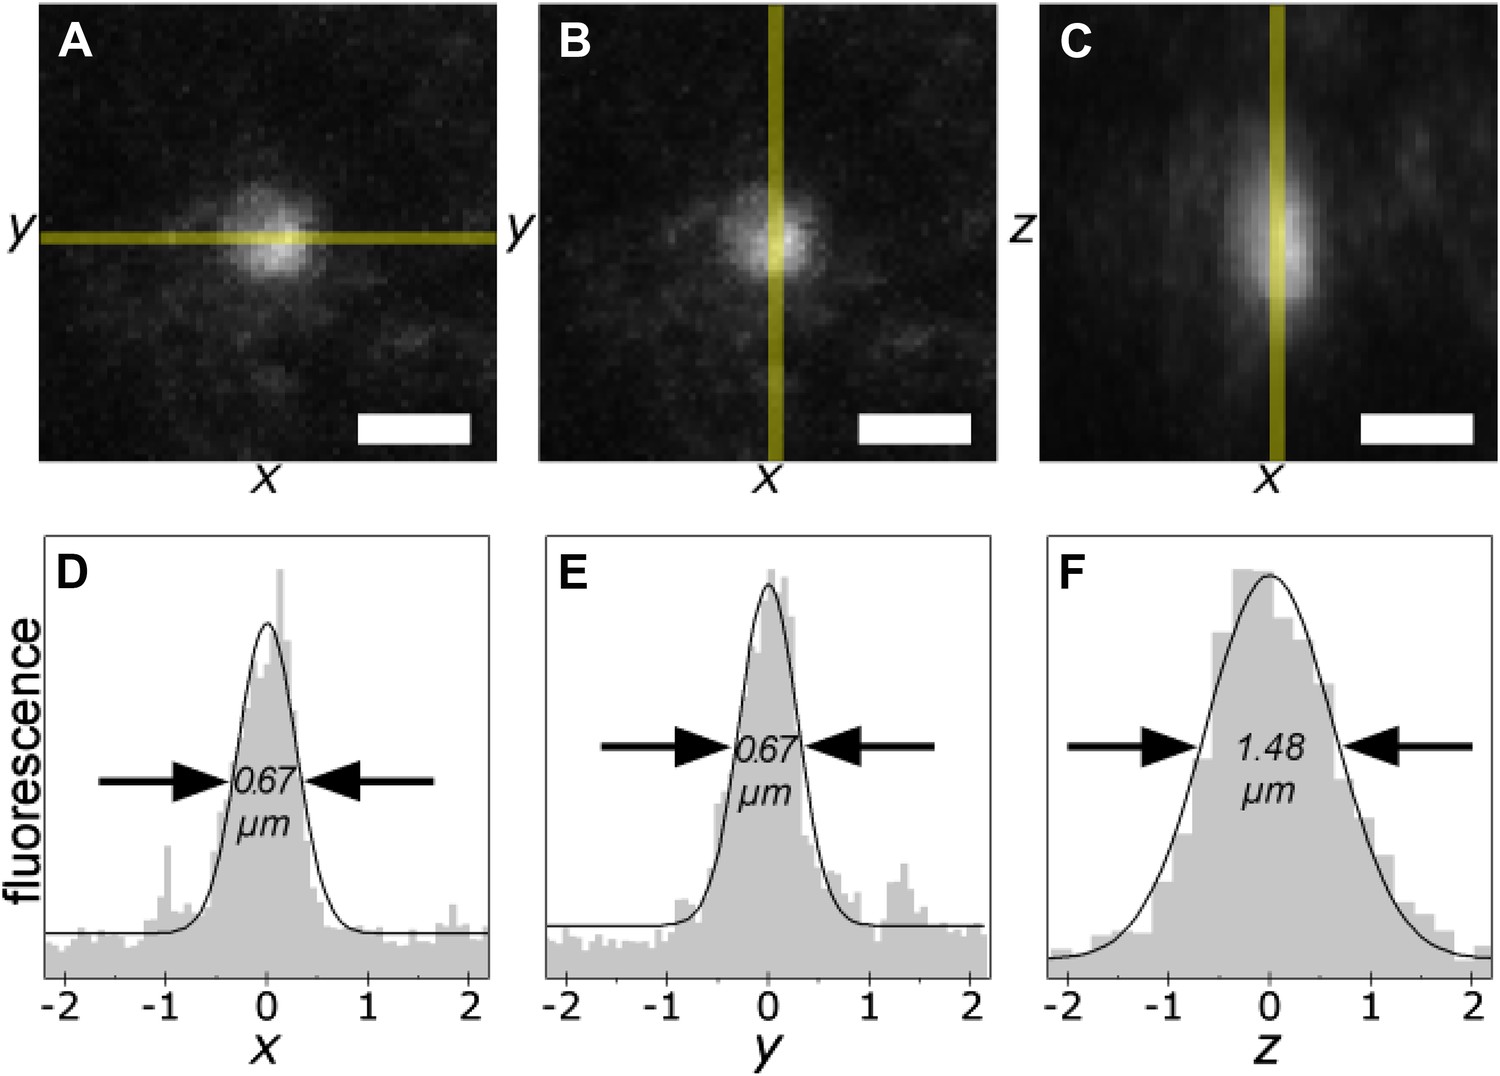
The smallest photo-tagging volume is less than 0.5 µm3.
A single voxel in a TgCRND8 tissue section was photo-tagged. The volume of photo-excitation was measured by confocal fluorescence imaging of the resulting photo-tagged spot. Maximum-intensity projections of the xy- (A, B) and xz- (C) planes are shown. Scale bar 1 µm. Fluorescence profiles of the indicated regions (shaded yellow) are shown (D–F). The width of the peaks is 0.67 µm in x and y, and 1.48 µm along the z axis, corresponding to an ellipsoidal excited volume of 0.38 µm3.
Figure 2—figure supplement 1

Cross correlation of technical replicates.
Cross correlation of spectral counts for all protein identifications are shown for duplicate runs of STOMP analysis on human amyloid plaque material.
Figure 2—figure supplement 2

Correlation of biological replicates.
Biological replicates of STOMP analysis of amyloid plaque material from TgCRND8 mice show good repeatability. Using our thresholding criteria (at least three spectral counts for each identified protein, at least threefold excess over corresponding dark control) one sample run (P1) identified fewer total proteins than the other (P2), however most proteins identified in P1 were also detected in P2.
Figure 3

Immunofluorescent confirmation of synaptic proteins in amyloid plaques of TgCRND8 mice.
Colocalization of ThS-stained plaques with beta-amyloid positive control (A, G, M) and the synaptic proteins ATP6V1B2 (B, H, N), SNAP25 (C, I, O), VAMP2 (D, J, P), synapsin 1 (E, K, Q), and ApoE (F, L, R). ATP6V1B2, SNAP25, and VAMP2 (N–P) all show a halo of elevated protein concentration in the region surrounding the dense core of the plaque. Scale bar 50 µm, 20 µm in the ApoE panels.
Figure 4
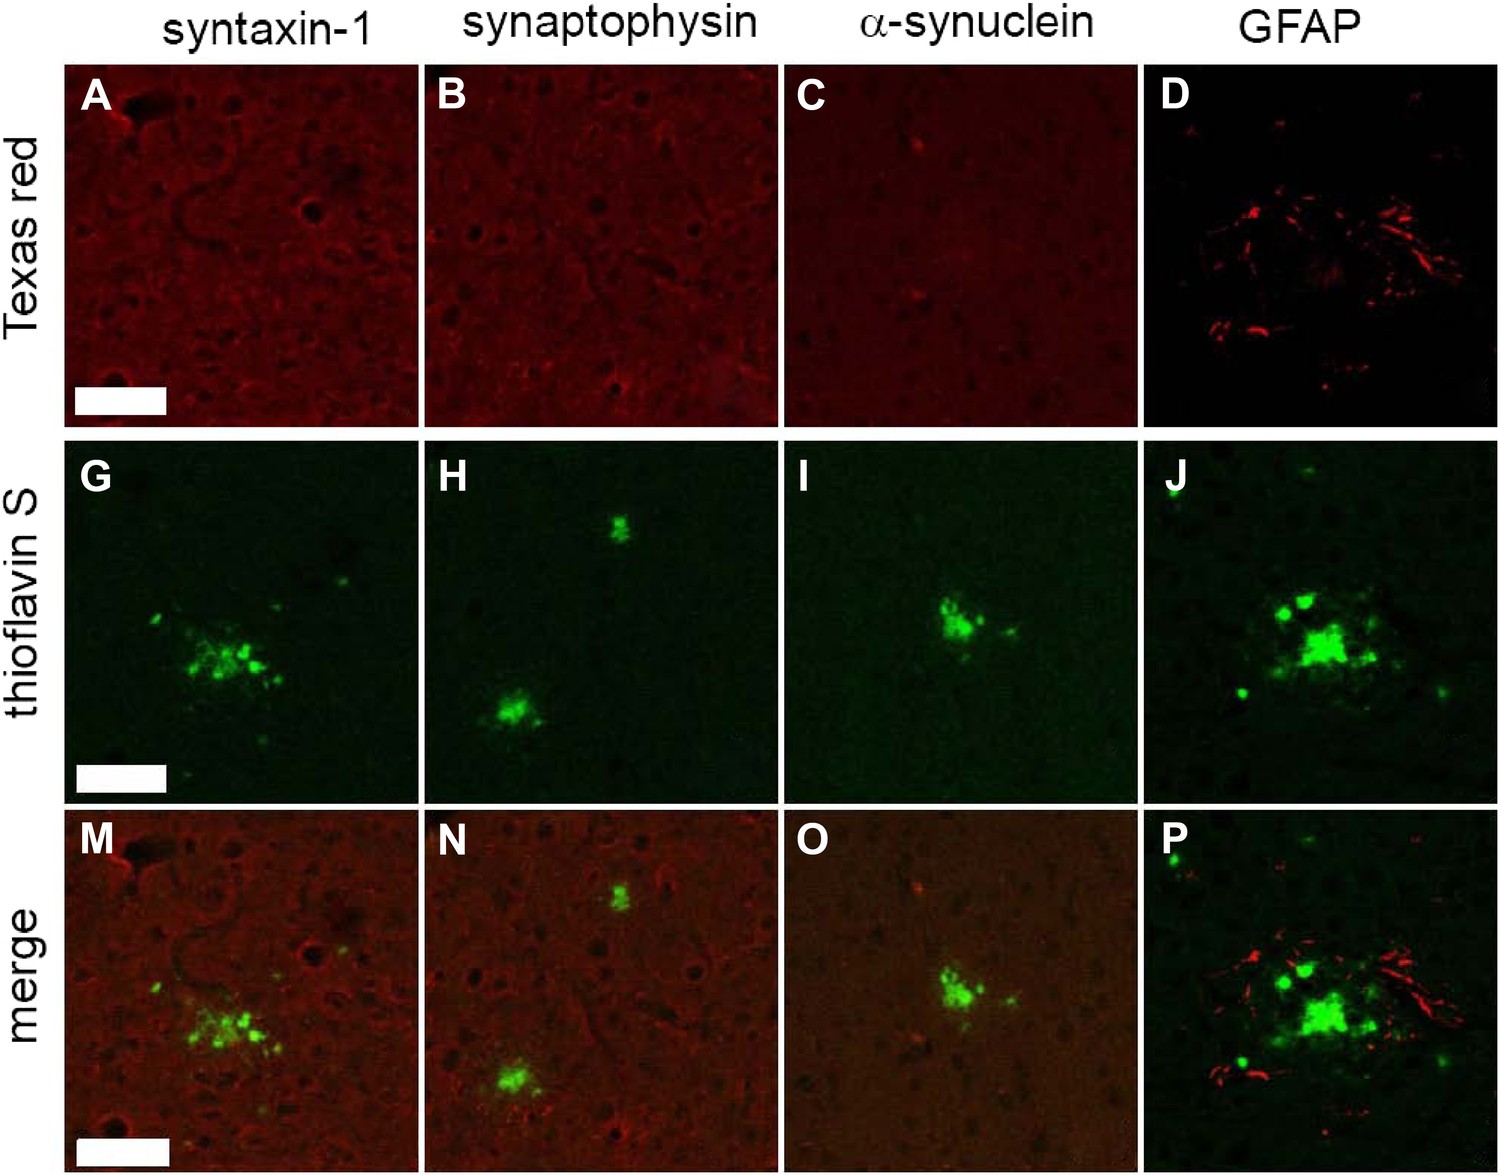
Common synaptic or disease-associated proteins in plaques of TgCRND8 mice not detected by STOMP are also absent by immunofluorescence.
The SNARE protein syntaxin-1 (A), synaptic marker synaptophysin (B), the neuronal protein alpha-synuclein (C) are absent from ThS-positive plaques (G, H, I, M, N, O). Staining of the glial protein GFAP (D) surrounds the ThS-positive plaques but does not infiltrate the plaque core (J, P). Scale bar 50 µm.
Figure 5

Immunofluorescent confirmation of results of STOMP analysis of senile plaques in a case of AD.
Immunofluorescent confirmation of results of STOMP analysis of senile plaques in a case of AD. GFAP (A), a marker of glial cells, surrounds the ThS-positive plaques and partially infiltrates the plaque core (E, I). Tau in dystrophic neurites (B) surrounds the ThS-positive plaques but does not infiltrate the plaque core (F, J). α-synuclein (C) is absent from ThS-positive plaques (G, K). SNAP25 colocalizes with ThS-positive plaques in thiscase of AD (D, H, L). Scale bar is 20 μm.
Figure 6

Microphotographs of Synaptophysin (A), VAMP2 (B) and SNAP25 (C) immunohistochemistry on the brain of human Alzheimer's disease cases.
The amyloid plaques (arrow) are positive for VAMP2 and SNAP25, whereas synaptophysin does not stain the core of the plaques and punctate lobular profiles decorating the plaque are positive for synaptophysin. Scale bar is 30 µm.
Tables
Table 1
Proteins statistically significantly enriched in the amyloid plaques of TgCRND8 mouse brain identified and retrieved by STOMP
| Protein | Uniprot ID | STOMP counts | SAINT score | Previous reports of enrichment in plaques (Söderberg et al., 2006) |
|---|---|---|---|---|
| Amyloid beta A4 protein | P12023 | 378 | 0.83 | Detected, enriched |
| Synaptosomal-associated protein 25 | P60879 | 88 | 1.00 | Detected, not enriched |
| Cytochrome c1 | Q9D0M3 | 70 | 0.98 | Detected, not enriched |
| Excitatory amino acid transporter 2 | P43006 | 64 | 1.00 | Detected, not enriched |
| V-type proton ATPase subunit B | P62814 | 56 | 0.80 | Detected, enriched |
| Vesicle-associated membrane protein 2 | P63044 | 52 | 0.87 | Detected, not enriched |
| Pyruvate kinase isozymes M1/M2 | P52480 | 49 | 0.98 | Detected, not enriched |
| Fructose-bisphosphate aldolase A | P05064 | 47 | 1.00 | Previously unreported |
| Cytochrome b-c1 complex subunit 1 | Q9CZ13 | 47 | 0.92 | Previously unreported |
| Guanine nucleotide-binding protein G(o) subunit alpha | P18872 | 41 | 0.98 | Previously unreported |
| Cytochrome c oxidase subunit 2 | P00405 | 40 | 0.97 | Detected, not enriched |
| Tubulin alpha-1B chain | P05213 | 39 | 0.98 | Detected, not enriched |
| 4-aminobutyrate aminotransferase | P61922 | 39 | 0.81 | Previously unreported |
| Tubulin beta-3 chain | Q9ERD7 | 38 | 1.00 | Detected, not enriched |
| V-type proton ATPase catalytic subunit A | P50516 | 37 | 0.99 | Detected, enriched |
| Aralar 1 | Q8BH59 | 37 | 1.00 | Previously unreported |
| Citrate synthase, mitochondrial | Q9CZU6 | 37 | 1.00 | Detected, not enriched |
| Clathrin heavy chain 1 | Q68FD5 | 35 | 1.00 | Detected, enriched |
| Alpha-internexin | P46660 | 30 | 0.98 | Previously unreported |
| NADH dehydrogenase 1 alpha subcomplex subunit 9, mitochondrial | Q9DC69 | 30 | 0.98 | Detected, not enriched |
| Fructose-bisphosphate aldolase C | P05063 | 28 | 0.91 | Detected, not enriched |
| Synapsin-2 | Q64332 | 27 | 0.89 | Detected, not enriched |
| Dynamin-1 | P39053 | 26 | 0.99 | Detected, not enriched |
| NADH dehydrogenase 1 alpha subcomplex subunit 10, mitochondrial | Q99LC3 | 24 | 0.89 | Detected, not enriched |
| Spectrin alpha chain, brain | P16546 | 22 | 1.00 | Detected, not enriched |
| Succinate dehydrogenase flavoprotein subunit, mitochondrial | Q8K2B3 | 21 | 0.99 | Detected, not enriched |
| Synapsin-1 | O88935 | 20 | 0.97 | Detected, not enriched |
| Rab GDP dissociation inhibitor alpha | P50396 | 20 | 0.94 | Detected, not enriched |
| V-type proton ATPase 116 kDa subunit a | Q9Z1G4 | 19 | 0.98 | Detected, enriched |
| Hexokinase-1 | P17710 | 18 | 1.00 | Detected, not enriched |
| Heat shock protein HSP 90-alpha | P07901 | 18 | 0.93 | Detected, enriched |
| Ubiquitin thioesterase OTUB1 | Q7TQI3 | 18 | 0.85 | Previously unreported |
| Vesicle-fusing ATPase | P46460 | 17 | 0.88 | Previously unreported |
| Spectrin beta chain, brain 1 | Q62261 | 17 | 1.00 | Detected, not enriched |
| NADH-ubiquinone oxidoreductase 75 kDa subunit, mitochondrial | Q91VD9 | 16 | 0.95 | Detected, not enriched |
| Neurofilament light polypeptide | P08551 | 15 | 0.85 | Detected, not enriched |
| Neurochondrin | Q9Z0E0 | 15 | 0.97 | Detected, not enriched |
| Heat shock protein HSP 90-beta | P11499 | 14 | 0.98 | Detected, enriched |
| Na/K-transporting ATPase subunit alpha-2 | Q6PIE5 | 14 | 0.95 | Detected, not enriched |
| Excitatory amino acid transporter 1 | P56564 | 14 | 0.93 | Detected, not enriched |
| Microtubule-associated protein 6 | Q7TSJ2 | 13 | 0.87 | Detected, not enriched |
| Serine/threonine-protein phosphatase 2A 65 kDa regulatory subunit A alpha isoform | Q76MZ3 | 11 | 0.80 | Detected, not enriched |
| Catenin beta-1 | Q02248 | 11 | 0.83 | Detected, not enriched |
| Tenascin-R | Q8BYI9 | 10 | 0.85 | Detected, not enriched |
| Alpha-actinin-1 | Q7TPR4 | 10 | 0.98 | Detected, not enriched |
| Ubiquitin-like modifier-activating enzyme 1 | Q02053 | 9 | 0.93 | Detected, not enriched |
| Pyruvate carboxylase, mitochondrial | Q05920 | 9 | 0.92 | Previously unreported |
| Ankyrin-2 | Q8C8R3 | 2 | 0.85 | Detected, not enriched |
-
Table is sorted in descending order of abundance, by normalized spectral counts.
Table 2
Proteins statistically significantly enriched in senile plaques from a patient with AD identified and retrieved by STOMP
| Protein | Uniprot ID | STOMP counts | Dark counts | Previous reports of enrichment in plaques (Söderberg et al., 2006) |
|---|---|---|---|---|
| Amyloid beta A4 protein | P05067 | 898 | 0.00 | Detected, enriched |
| Tubulin alpha-1A chain | Q71U36 | 39.4 | 1.99 | Detected, not enriched |
| Tubulin beta-2A chain | Q13885 | 23.0 | 3.51 | Detected, not enriched |
| Actin, cytoplasmic 1 | P60709 | 13.8 | 0.00 | Detected, not enriched |
| Glial fibrillary acidic protein | P14136 | 11.0 | 0.00 | Detected, enriched |
| Alpha-internexin | Q16352 | 10.8 | 0.90 | Previously unreported |
| Synaptosomal-associated protein 25 | P60880 | 9.65 | 0.00 | Detected, not enriched |
| Carbonyl reductase [NADPH] 1 | P16152 | 9.05 | 0.00 | Detected, not enriched |
| ATP synthase subunit beta, mitochondrial | P06576 | 9.28 | 0.00 | Detected, enriched |
| Tubulin polymerization-promoting protein | O94811 | 6.33 | 0.00 | Previously unreported |
| Tubulin beta-3 chain | Q13509 | 5.95 | 0.00 | Previously unreported |
| Cytochrome b-c1 complex subunit 8 | O14949 | 5.05 | 0.00 | Previously unreported |
| Calcium/calmodulin-dependent protein kinase type I | Q9UQM7 | 5.08 | 0.00 | Previously unreported |
| Immunoglobulin superfamily member | Q969P0 | 4.23 | 0.00 | Previously unreported |
| V-type proton ATPase subunit B, kidney isoform | P15313 | 3.96 | 0.00 | Detected, enriched |
| Vesicle-associated membrane protein 2 | P63027 | 3.95 | 0.00 | Detected, not enriched |
| Pyruvate dehydrogenase E1 component subunit beta | P11177 | 3.82 | 0.00 | Detected, not enriched |
| Fructose-bisphosphate aldolase C | P09972 | 3.80 | 0.00 | Detected, not enriched |
| Ferritin light chain | P02792 | 3.75 | 0.00 | Detected, not enriched |
| Neurofilament heavy polypeptide | P12036 | 3.33 | 0.89 | Detected, not enriched |
| Cytochrome c1, heme protein, mitochondrial | P08574 | 2.82 | 0.00 | Detected, not enriched |
| Peptidyl-prolyl cis-trans isomerase | Q13526 | 2.74 | 0.00 | Detected, not enriched |
| Phosphoglycerate mutase 1 | P18669 | 2.60 | 0.00 | Detected, not enriched |
| Beta-actin-like protein 2 | Q562R1 | 2.38 | 0.00 | Detected, not enriched |
| Creatine kinase B-type | P12277 | 2.34 | 0.00 | Detected, not enriched |
| Transketolase | P29401 | 2.21 | 0.00 | Detected, not enriched |
| Alpha-enolase | P06733 | 2.12 | 0.00 | Detected, not enriched |
| Excitatory amino acid transporter 1 | P43003 | 2.10 | 0.00 | Previously unreported |
| 40S ribosomal protein S8 | P62241 | 2.07 | 0.00 | Previously unreported |
| 60 kDa heat shock protein, mitochondrial | P10809 | 2.05 | 0.00 | Detected, not enriched |
| Stress-70 protein, mitochondrial | P38646 | 2.04 | 0.00 | Detected, not enriched |
| Protein SERCA1 | Q96JX3 | 2.02 | 0.00 | Previously unreported |
| Spectrin beta chain, brain 1 | Q01082 | 1.82 | 0.00 | Detected, enriched |
| Fascin | Q16658 | 1.83 | 0.00 | Detected, not enriched |
| 6-phosphogluconolactonase | O95336 | 1.82 | 0.00 | Previously unreported |
| Thioredoxin-dependent peroxide reductase | P30048 | 1.81 | 0.00 | Detected, not enriched |
| Glutamine synthetase | P15104 | 1.78 | 0.00 | Previously unreported |
| Clathrin heavy chain 1 | Q00610 | 1.70 | 0.00 | Detected, not enriched |
| Elongation factor Tu, mitochondrial | P49411 | 1.51 | 0.00 | Detected, not enriched |
| Tubulin alpha-4A chain | P68366 | 1.50 | 0.00 | Detected, not enriched |
| Methionine adenosyltransferase 2 subunit beta | Q9NZL9 | 1.33 | 0.00 | Previously unreported |
| Dihydropyrimidinase-related protein 4 i | O14531 | 1.21 | 0.00 | Previously unreported |
| Tenascin-R | Q92752 | 1.17 | 0.00 | Detected, not enriched |
| Microtubule-associated protein 6 | Q96JE9 | 1.16 | 0.29 | Detected, not enriched |
| Prelamin-A/C | P02545 | 1.01 | 0.00 | Previously unreported |
| Neurofascin | O94856 | 1.00 | 0.00 | Detected, not enriched |
| Protein kinase C and casein kinase substrate | Q9BY111 | 0.98 | 0.00 | Detected, not enriched |
| Hexokinase-1 | P19367 | 0.98 | 0.00 | Detected, not enriched |
| NADH-ubiquinone oxidoreductase 75 kDa subunit | P283311 | 0.94 | 0.00 | Detected, not enriched |
| Coronin-1C | Q9ULV4 | 0.94 | 0.00 | Detected, enriched |
| Fumarate hydratase, mitochondrial | P07954 | 0.91 | 0.00 | Previously unreported |
| Serine/threonine-protein kinase PAK 1 | Q13153 | 0.82 | 0.00 | Previously unreported |
| V-type proton ATPase 116 kDa subunit a isoform 1 | Q93050 | 0.78 | 0.00 | Detected, enriched |
| Contactin-associated protein 1 | P78357 | 0.64 | 0.00 | Detected, not enriched |
| Ubiquitin-like modifier-activating enzyme 1 | P22314 | 0.64 | 0.00 | Previously unreported |
| ATP-citrate synthase | P53396 | 0.62 | 0.00 | Detected, not enriched |
| Heat shock protein HSP 90-alpha | P07900 | 0.59 | 0.00 | Detected, enriched |
| Aconitate hydratase, mitochondrial | Q99798 | 0.58 | 0.00 | Detected, not enriched |
| Spectrin alpha chain, brain | Q13813 | 0.44 | 0.00 | Detected, not enriched |
| Microtubule-associated protein 1B | P46821 | 0.37 | 0.00 | Detected, not enriched |
-
Table is sorted in descending order of abundance, by normalized spectral counts.
Additional files
-
Supplementary file 1
All proteins identified by STOMP from TgCRND8 mouse plaques.
- https://doi.org/10.7554/eLife.09579.013
-
Supplementary file 2
High-abundance proteins in non-plaque regions of the TgCRND8 mouse brain identified and retrieved by STOMP.
Table is sorted in descending order of abundance, by normalized spectral counts.
- https://doi.org/10.7554/eLife.09579.014
-
Supplementary file 3
26 enriched proteins enriched in senile plaques relative to non-plaque regions detected by Liao et al. (2004) and Söderberg et al. (2006).
- https://doi.org/10.7554/eLife.09579.015
-
Supplementary file 4
Antibodies used for immunofluorescence and immunohistochemistry.
- https://doi.org/10.7554/eLife.09579.016
-
Source code 1
Custom STOMP macro.
- https://doi.org/10.7554/eLife.09579.020
Download links
A two-part list of links to download the article, or parts of the article, in various formats.
Downloads (link to download the article as PDF)
Open citations (links to open the citations from this article in various online reference manager services)
Cite this article (links to download the citations from this article in formats compatible with various reference manager tools)
Determining composition of micron-scale protein deposits in neurodegenerative disease by spatially targeted optical microproteomics
eLife 4:e09579.
https://doi.org/10.7554/eLife.09579


