The REST remodeling complex protects genomic integrity during embryonic neurogenesis
- Howard Hughes Medical Institute, Oregon Health and Science University, United States
- University of Texas Southwestern Medical Center, United States
- Helmholtz Zentrum München, Germany
- Technische Universität München, Germany
- German Center for Neurodegenerative Diseases (DZNE), Germany
- Ludwig-Maximilians-Universität, Germany
Figures
Figure 1
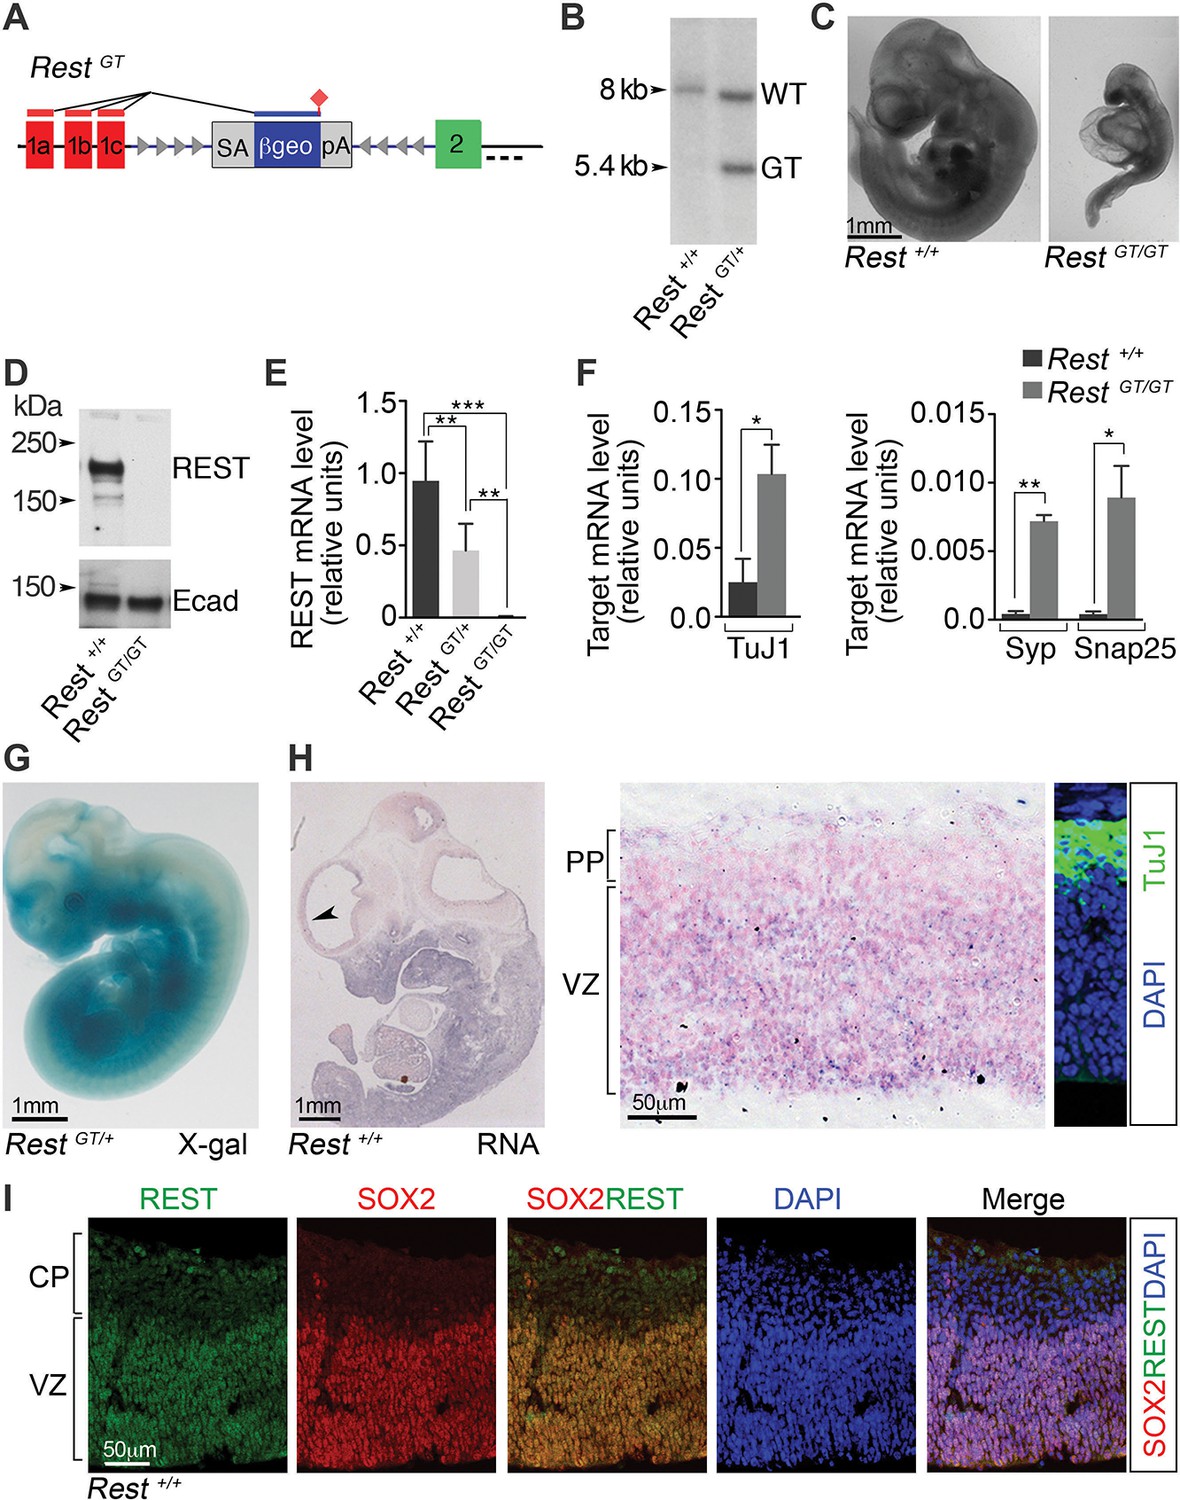
A GT in the Rest gene (RestGT) causes REST deficiency and embryonic lethality.
(A) Schematic showing the GT in the first Rest intron. Red and green boxes indicate alternative 5’ untranslated exons (1a–c) and first coding exon (2), respectively. The GT cassette contains an SA site, a reporter gene encoding a β-galactosidase neomycin fusion gene (β-geo), and a pA sequence. Arrowheads depict target sites for Flpe and Cre recombinases. Dashed line indicates probe location for Southern blot in B. (B) Southern blot of genomic DNA from indicated genotypes. (C) E10.5 wild type (Rest+/+) and mutant (RestGT/GT) embryos. (D) Western blot analysis of REST protein in E10.5 embryos. Ecad (E-cadherin), loading control. (E) qRT-PCR analyses of Rest mRNA levels, normalized to 18S RNA, in E9.5 embryos, n=6 mice/genotype. Means and SD are shown. (F) qRT-PCR analysis, normalized to 18S RNA, for Rest targets, n=3 mice/genotype. Means and SD are shown. Syp and Snap25 values in Rest+/+ are 4.3×10⁻⁴ ± 2.0×10⁻⁴ and 4.1×10⁻⁴ ± 2.0×10⁻⁴, correspondingly. Statistical significance was determined by ANOVA with Tukey posthoc (E) and by unpaired t-test with Welch correction. (F) (G) Whole mount X-gal staining of E11.5 embryo. (H) Left, in situ hybridization analysis for Rest transcripts in E12.5 embryo. Arrowhead indicates region magnified in adjacent image. Counterstain (pink) is nuclear fast red. Right panel, Immuno-labeling showing location of TuJ1+ neurons used to determine PP and VZ boundaries. (I) Immuno-labeling of cortical section from E13.5 embryo using indicated antibodies and DAPI stain for nuclei. *, p<0.05, **, p<0.01, ***, p<0.001. ANOVA, analysis of variance; GT, gene trap; mRNA, messenger RNA; PP, preplate; qRT-PCR, quantitative real-time polymerase chain reaction; SA splice acceptor; SD, standard deviations; VZ, ventricular zone.
Figure 2

A conditional RestGT allele results in REST-deficiency in Nestin+ progenitors.
(A) KO strategy. Top, mice bearing an inverted GT cassette (RestGTinv), resulting in normal splicing, were generated by mating RestGT mice (Figure 1A) to mice containing the Flpe transgene. Bottom, conditional mutants, resulting in splicing of exon 1 to the GT cassette (Cre+, RestGTi), were generated by mating RestGTi mice (top) to mice bearing the Nestin Cre transgene. It is noteworthy that β-geo expression was still under the control of Rest regulatory elements. (B) Whole-mount X-gal staining of E11.5 RestGTi/+ (left) and Cre+, RestGTi/+ (right) embryos. (C) X-gal staining of a coronal section of E13.5 cortex from Cre+, RestGTi/+ mice. (D) Western blot of nuclear extracts from neuroepithelia of E13.5 mice. HDAC, histone deacetylase 2, loading control. (E) qRT-PCR analysis of Rest transcripts, normalized to 18S RNA, in E13.5 brain (n=6 mice/genotype) and NPCs grown as neurospheres for 5 days (n=3 mice/genotype). (F) Quantitative chromatin immunoprecipitation analysis of REST enrichment at RE1 sites in the glycine receptor (Glra; +275 bp from TSS) and Snap25 genes (+867 bp from TSS) (n=4 mice/genotype). Amplicons were designed within 100 bp of RE1 binding sites. Snap25 CDS and Myf5 transcriptional start site lack RE1 sites. Means and SD are shown in (E) and (F). Statistical significance was determined by Mann–Whitney test in E and by unpaired t-test with Welch correction in F. (G) Immuno-labeling of E13.5 telencephalon using indicated antibodies. Boxes indicate regions of higher magnification in images at right. White arrowheads indicate DAPI+ cells that express both proteins. *, p<0.05, **, p<0.01, ***, p<0.001. CDS, coding sequence; CP, cortical plate; GT, gene trap; KO, knockout; MZ, marginal zone; NPC, neural progenitor cells; qRT-PCR, quantitative real-time polymerase chain reaction; SD, standard deviation; VZ, Ventricular zone.
Figure 3
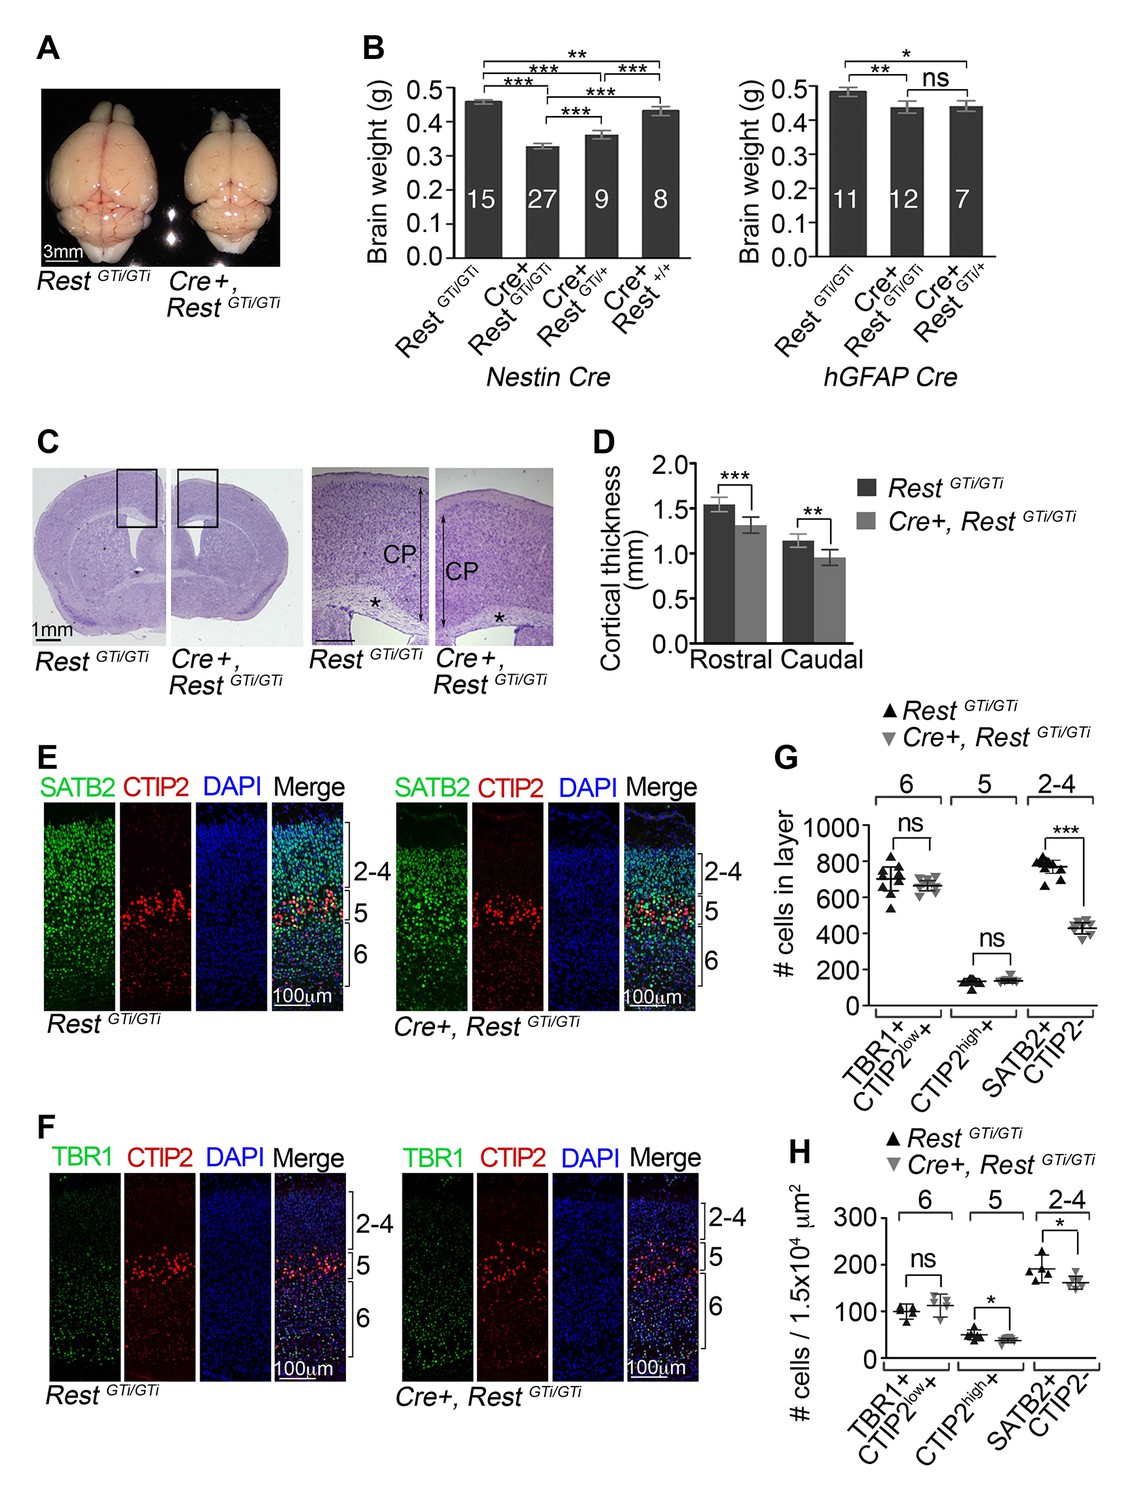
Reduced brain size, thinner cortex, and reduced numbers of upper layer neurons in Nestin Cre+, RestGTi/GTi mice.
(A) Representative P45 brains from control and Cre+, RestGTi/GTi littermates. (B) Comparison of brain mass in P45 mice deleted for REST using Nestin (left panel) and hGFAP (right panel) promoter driven Cre recombinases. The numbers of mice analyzed for each genotype are shown. Statistical significance determined by ANOVA with Tukey posthoc (left) and Kruskal–Wallis ANOVA test with Dunn posthoc (right). (C) Nissl-stained P45 coronal brain sections. Boxes denote higher magnification views in right hand panels. *, corpus collosum. Scale bar for right panel, 0.5mm. (D) Measurements of cortical thickness in P45 brain (n=8–11 mice/genotype). Statistical significance determined by ANOVA with Tukey posthoc. (E) and (F) Representative immuno-labeling of P1 cortical sections with indicated antibodies revealing cortical layering in control and Cre+, RestGTi/GTi mice. The presence of both low and high expressing CTIP2 cells in layers 6 and 5, respectively, is noteworthy. (G) Quantification of (E) and (F) numbers over brackets denote cortical layers where the cells were counted. Cells were counted in 400 μm of cortical thickness (n=8–10 mice/genotype). Note that only 200 μm images are shown in E, F. Low (layer 6) and high (layer 5) CTIP2-expressing cells were used to differentiate between Tbr1+, CTIP2low+ cells of layer 5 and CTIPhigh+ cells in layer 5. SATB2+ CTIP2- cells were counted above layer of CTIPhigh+ cells. (H) Mean cell densities from three areas (100×150 μm2) in each cortical section, n=5–8 mice/genotype. Statistical significance was determined by Mann–Whitney t-test for (G) and (H). Means and 95% CI are shown in B, D, F and G. *, p<0.05; **, p<0.01; ***, p<0.001. ANOVA, analysis of variance; ns, non-significant.
Figure 4
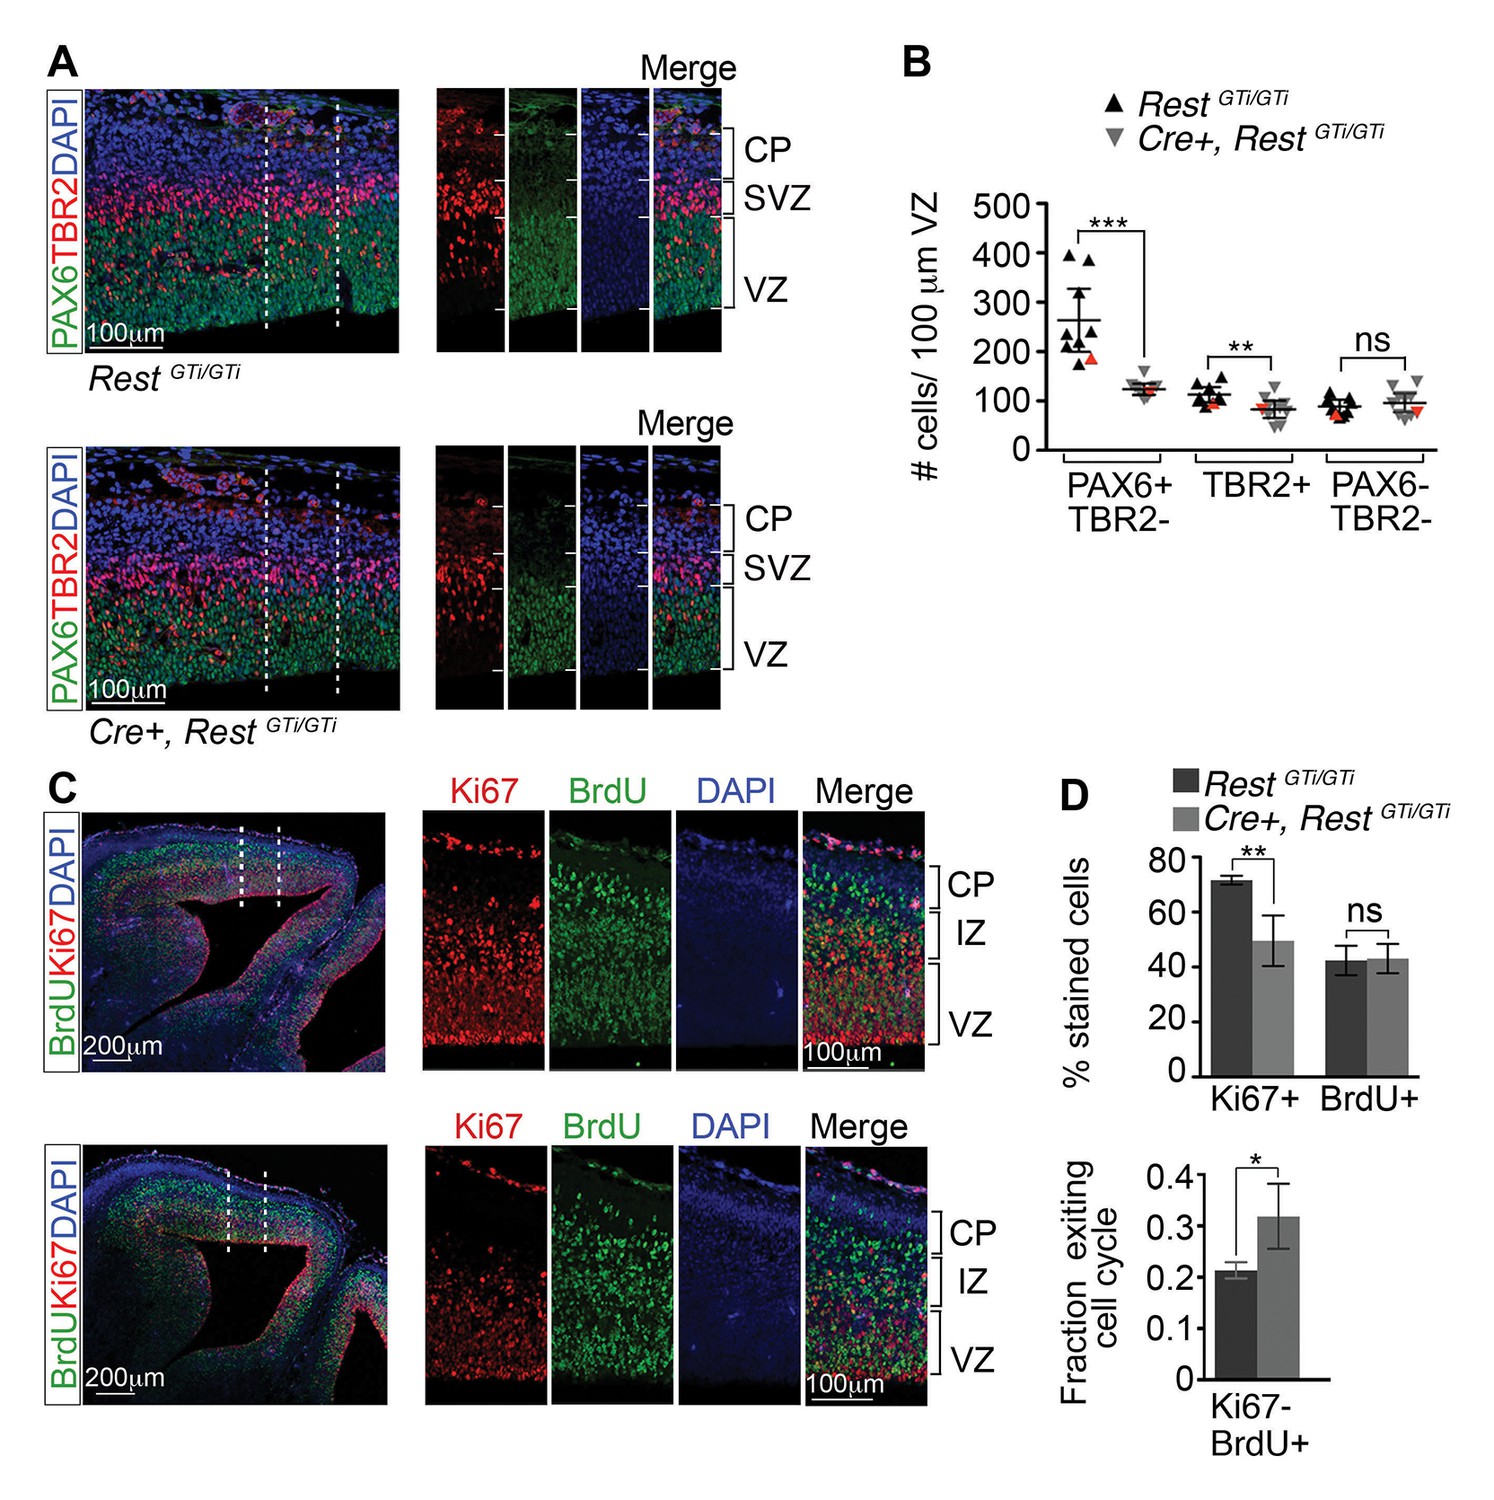
Depletion of apical progenitors and premature cell cycle exit in Cre+, RestGTi/GTi mice.
(A) Representative immuno-labeling distinguishing apical (PAX6+/TBR2−) and basal (TBR2+) progenitors in E13.5 cortices. Area outlined by dotted lines is shown in images at right. (B) Quantification of A. Measurements from 100 μm cortical width extending from the VZ to pial surface, n=9 mice /genotype. Statistical significance was determined by Mann–Whitney t-test. Red triangles show quantification of the images shown in A. (C) Representative immuno-labeling for Ki67 and BrdU in the cortical section of E14.5 mouse brain pulsed with BrdU for 24 h. The area outlined by dotted lines is magnified in the adjacent images. (D) Top, histogram showing percent stained cells relative to the number of DAPI+ nuclei. Bottom, fraction of cells exiting the cell cycle defined as fraction of Ki67-BrdU+ cells in total BrdU+ cell population. Measurements were made in 200 μm cortical width areas extending from ventricular to pial surface, n=7 mice/genotype. Statistical significance was determined by Mann–Whitney t-test. Means and 95% CI are shown in B and D. *, p<0.05; **, p<0.01; ***p<0.001. IZ, intermediate zone; SVZ, subventricular zone.
Figure 5 with 3 supplements
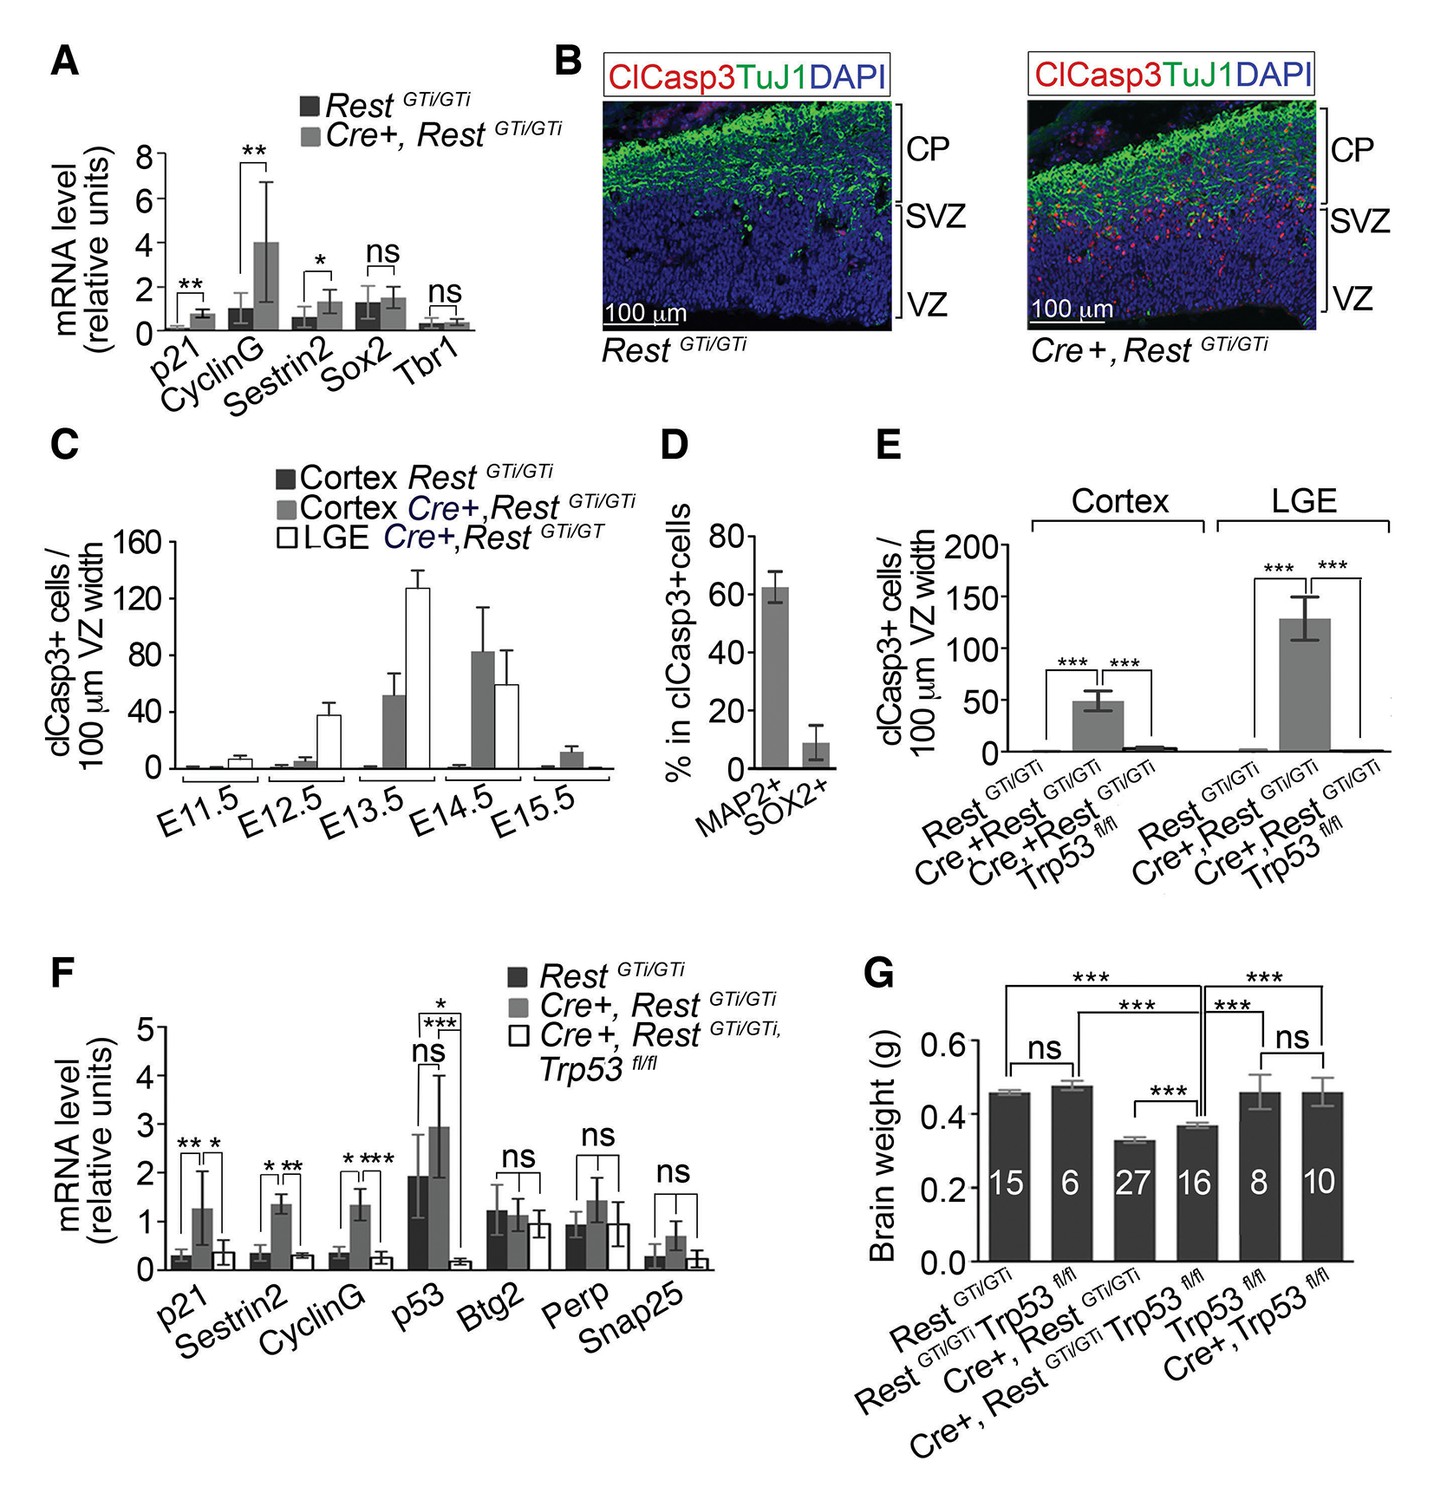
Progenitors and neurons in cortex of Cre+, RestGTi/GTi mice undergo apoptosis that is rescued by deletion of p53.
(A) qRT-PCR analyses normalized to 18S RNA, of p53 pro-apoptotic target mRNAs (p21, Sestrin2 and CyclinG), progenitor mRNAs (Sox2) and neuronal mRNAs (Tbr1) in LeX+ purified progenitors isolated from E13.5 brain. RestGTi/GTi, n=4 mice, Cre+, RestGTi/GTi, n=6 mice. (B) Representative immuno-labeling for apoptotic cells with clCasp3 and neuronal marker TuJ1 in coronal telencephalic sections from E13.5 mice. (C) Temporal profiles of apoptosis in cortex and LGE of Cre+, RestGTi/GTi mice and cortex of RestGTi/GTi mice, in areas of 100 μm ventricular width extending from VZ to the pial surface (n=6–9 mice/time point). Means and SDs are shown. (D) Percentage of MAP2+ and SOX2+ cells in all apoptotic cells in E13.5 Cortex of Cre+, RestGTi/GTi mice in 100μm ventricular width. n=5 mice. (E) Quantification of apoptosis in E13.5 cortex and LGE (n=5–9 mice/genotype/100μmVZ). Note: The same data for Cre+, RestGTi/GTi cortex and LGE from 5C is re-plotted for comparison. (F) qRT-PCR analysis of mRNA levels, relative to 18S RNA, of p53 pro-apoptotic (p21, CyclinG, Sestrin2, Perp), non-apoptotic (Btg2) and non p53 (Snap25) targets in E12.5 brain (n=7–8 mice/genotype). (G) Measurements of brain mass in P45 mice. Numbers of mice are indicated in the histogram. Note: the same data from Cre+, RestGTi/GTiand RestGTi/GTiin Figure 3B is re-plotted for comparison. Means and 95% CI are shown in A, D, E, F, G. Statistical significance was determined by Mann–Whitney t-test (A), ANOVA test with Tukey posthoc (E and G) and Kruskal–Wallis ANOVA test with Dunn posthoc (F). *, p<0.05, **, p<0.01, ***, p<0.001, ns, non-significant. ANOVA, analysis of variance; clCasp3, cleaved caspase3; CI, confidence interval; LGE, lateral ganglionic eminence; mRNA, messenger RNA; qRT-PCR, quantitative real-time polymerase chain reaction; SD, standard deviation
Figure 5—figure supplement 1
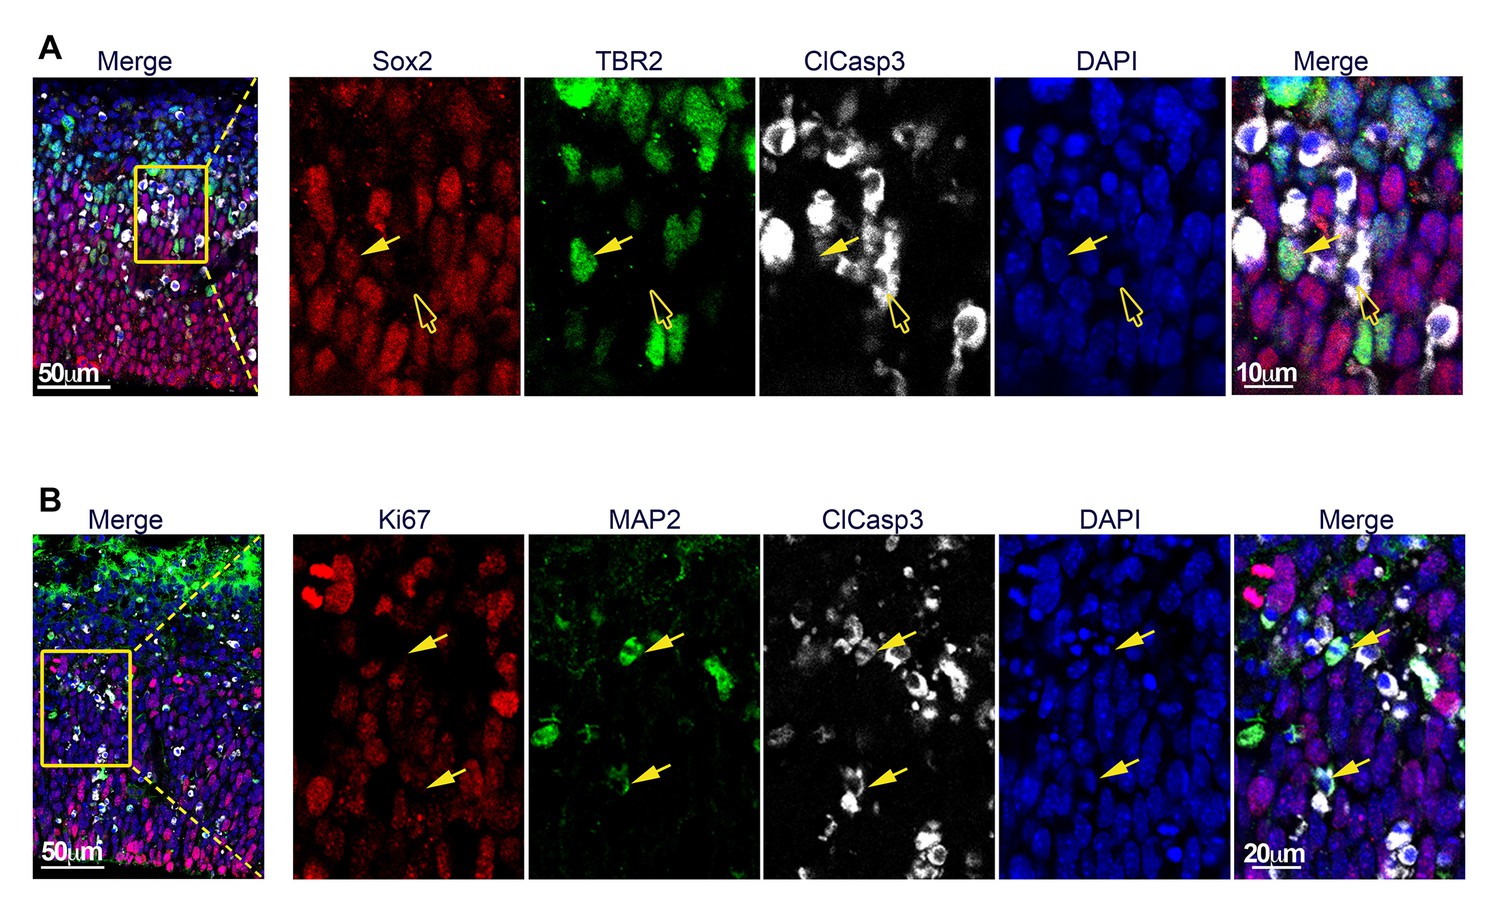
Apoptotic cells are TBR2− and primarily post-mitotic, MAP2+ cells.
(A) and (B) Representative E13.5 cortical brain sections from Cre+, RestGTi/GTi mice stained with the indicated antibodies. Insets on left are magnified in right hand images. (A) Filled arrow points to Sox2+ TBR2+ ClCasp3− cell and empty arrow points to Sox2− TBR2− ClCasp3+ cells. (B) Arrows point to MAP2+ClCasp3+Ki67− cells.
Figure 5—figure supplement 2
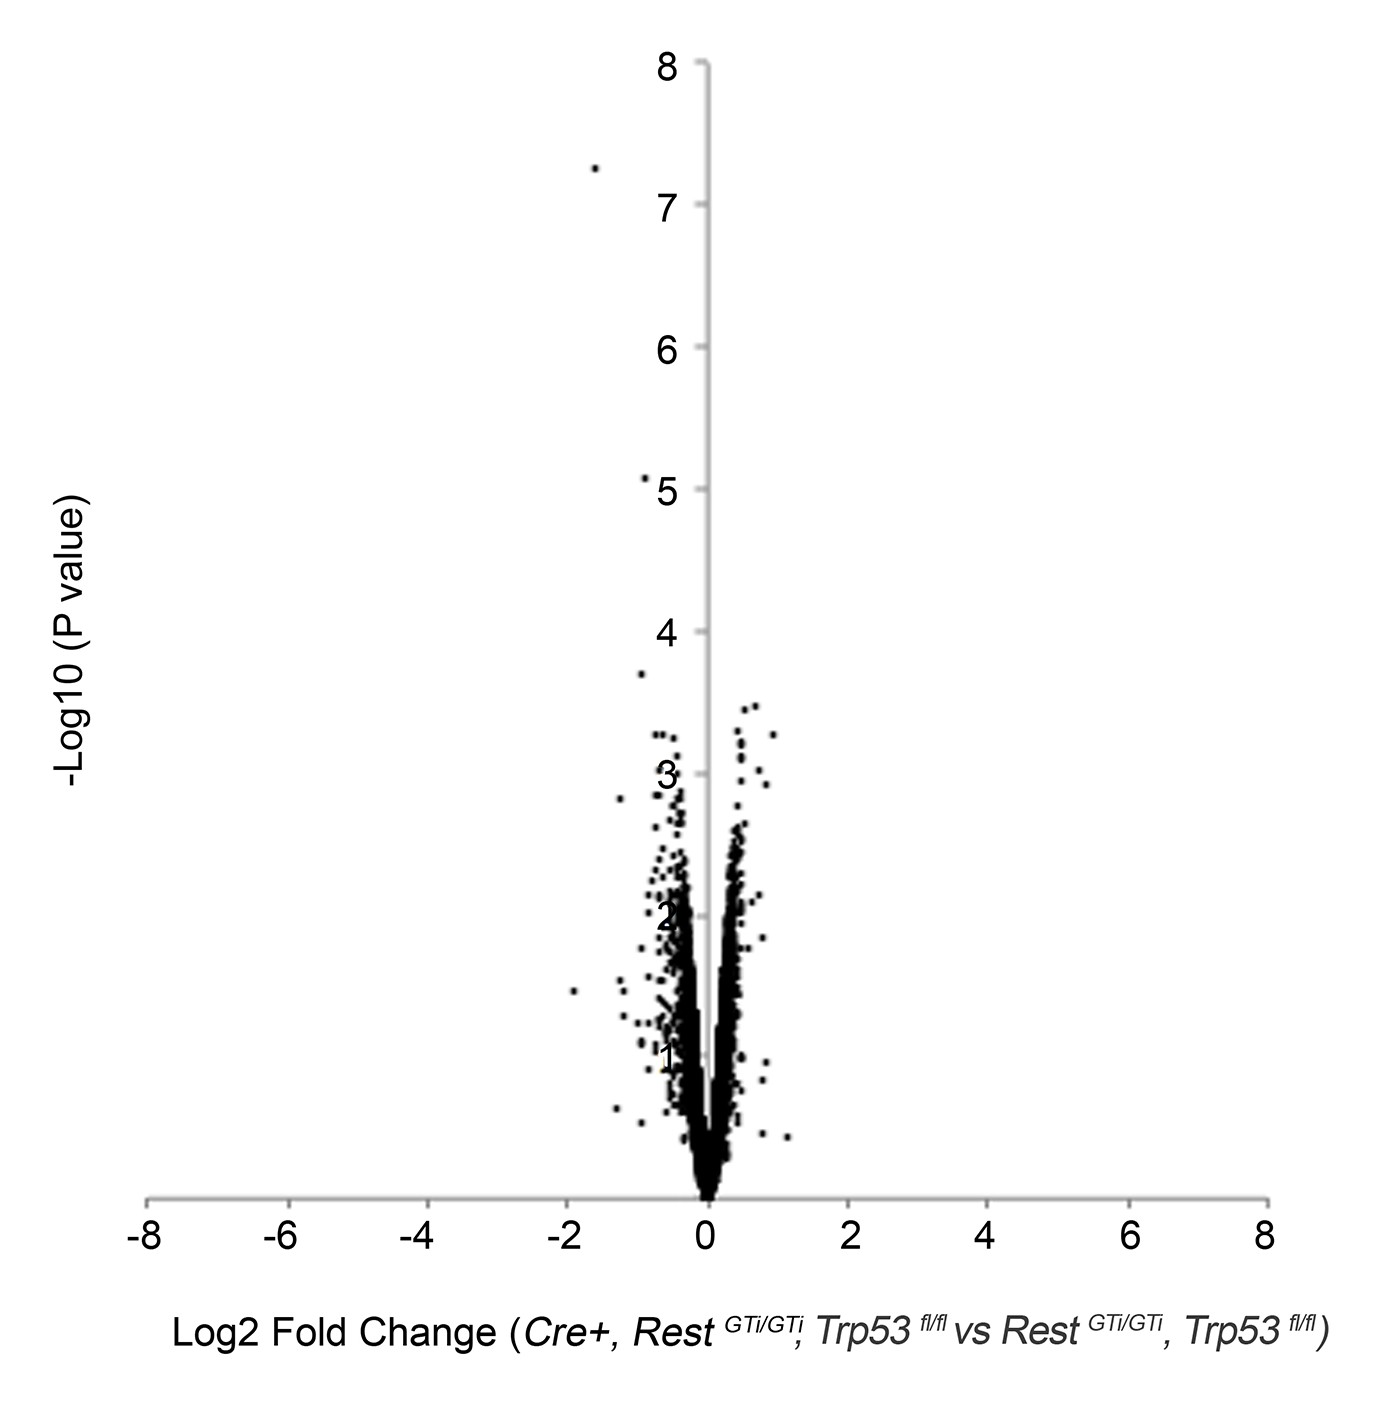
Volcano plot of microarray analysis comparing transcriptome of E12.5 brains of control, RestGTi/GTi, Trp53fl/fl, and Cre+, RestGTi/GTi, Trp53fl/fl mice (Supplementary file 2).
The log2 transformed fold changes in gene expression on the x-axis are plotted against negative log10-transformed p-values of the t- test on the y-axis. Fold changes are determined for each probe as an average ratio of normalized value from Cre+, RestGTi/GTi, Trp53fl/fl mice relative to normalized value in control, RestGTi/GTi, Trp53fl/fl mice. n=4 embryos/genotype.
Figure 5—figure supplement 3
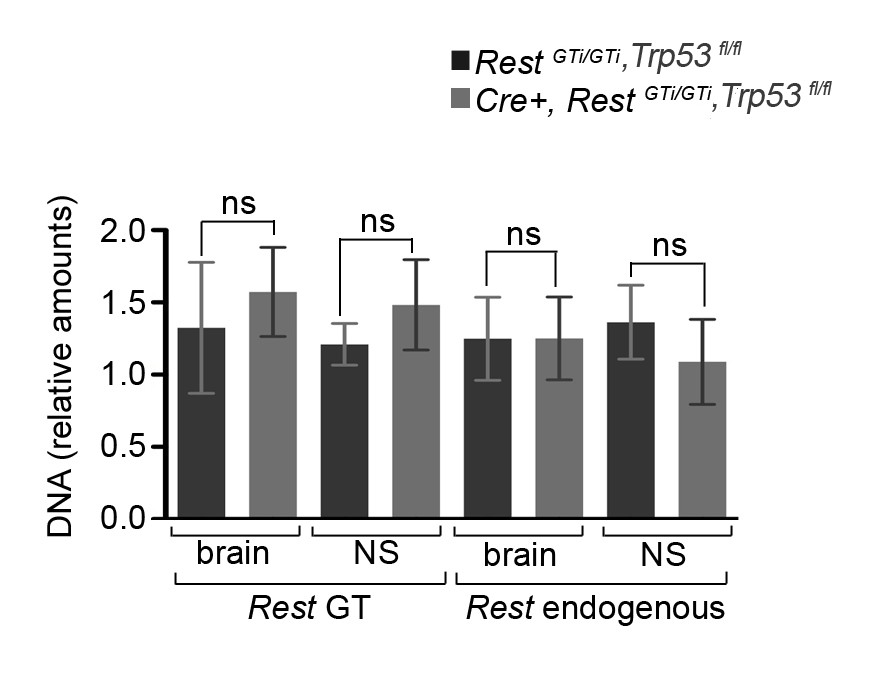
qPCR analyses of DNA in the Rest GT genomic locus normalized to Gapdh DNA.
A RestGT primer set amplifies β-geo sequences within the GT cassette (Rest GT), while a Rest endogenous primer pair amplifies DNA sequences located 1760 bp upstream from the GT insertion site. n= 6 (Cre+, RestGTi/GTi, Trp53fl/fl), n=4 (RestGTi/GTi, Trp53fl/fl). Means and 95% CI are shown. Statistical significance measured by Mann–Whitney t-test. CI, confidence interval; GT, gene trap; ns, non-significant; qPCR, quantative polymerase chain reaction.
Figure 6
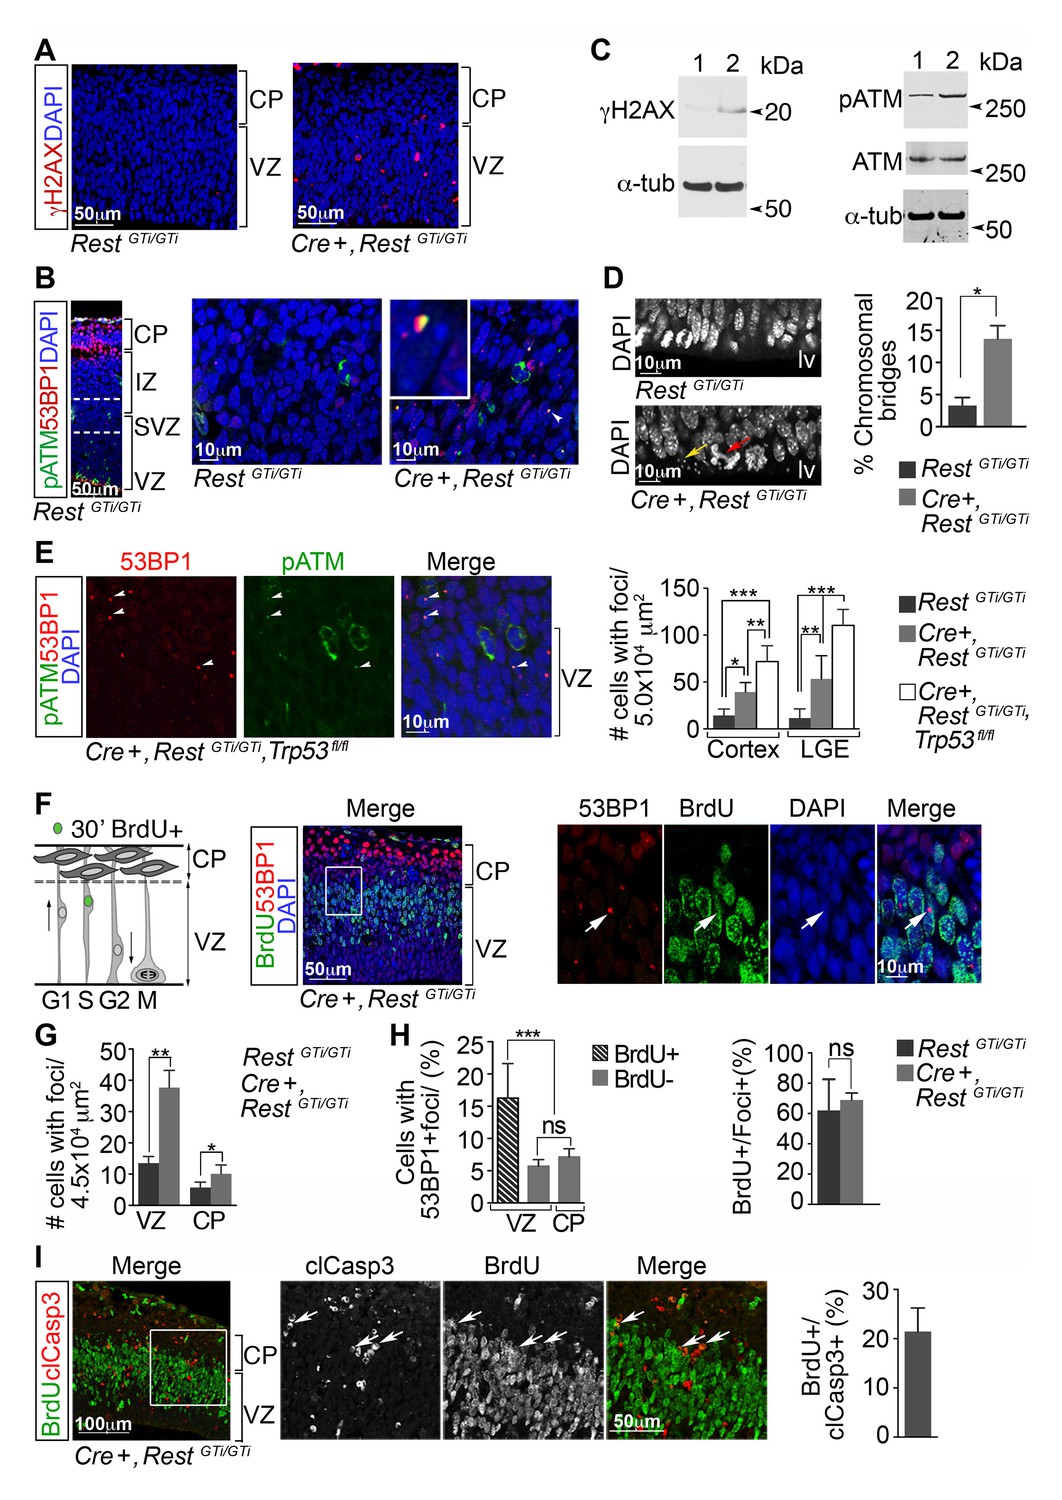
DNA damage in neural progenitors is due to loss of REST and persists in progenitors with loss of REST and p53.
(A) Representative immuno-labeling of E13.5 cortex for phosphorylated histone protein H2AX (γH2AX). (B) Representative immuno-labeling for pATM and p53 binding protein 1 (53BP1) from cortex of E14.5 RestGTi/GTi mice. The region between the dotted lines is shown at higher magnification in the right panels. Arrowhead indicates the nuclear foci magnified in inset. (C) Western blot analysis of E13.5 brain protein lysates. Lane 1, RestGTi/GTi; Lane 2, Cre+, RestGTi/GTi. α-tub (tubulin), loading control. (D) Left, Representative image of nuclei in cells in E13.5 ventricular surface. Red arrow points to abnormal bridge-like structures in mutant mice. Yellow arrow points to micronuclei. Right, quantification from E13.5 cortex. n=4 mice/genotype/100 mitoses. (E) Left, immuno-labeling of VZ cells in E13.5 cortex. Right, quantification from cortex and LGE dual labeled for 53BP1 and pATM, n=5 mice/genotype, 3–5 sections/mouse. (F) Left, schematic showing nuclear positions of neural progenitors in S phase labeled by 30 m pulse of BrdU. Right, representative images from E13.5 cortical section after 30 m BrdU pulse. Cells in inset are shown at higher magnification. Arrowheads indicate DNA damage foci in cells that incorporated BrdU in the S phase. (G) Quantification of 53BP1 data represented in F. n=6 mice, 3–4 sections/mouse. (H) Quantification of cells with 53BP1 foci in E13.5 Cre+, RestGTi/GTi brain sections (I) Left, representative images of immunostained E13.5 cortical section. Cells in inset are shown at higher magnification. Right, quantification, n=6 mice, 3–4 sections/mouse/200μmVZ. Means and SD are shown. Statistical significance in D and G was determined by Mann-Whitney t-test and by ANOVA test with Tukey posthoc in E and H. *p<0.05; **p<0.01; ***p <0.001. ANOVA, analysis of variance; pATM, phosphorylated ataxia telangiectasia mutated; SD, standard deviation; VZ, ventricular zone.
Figure 7 with 2 supplements
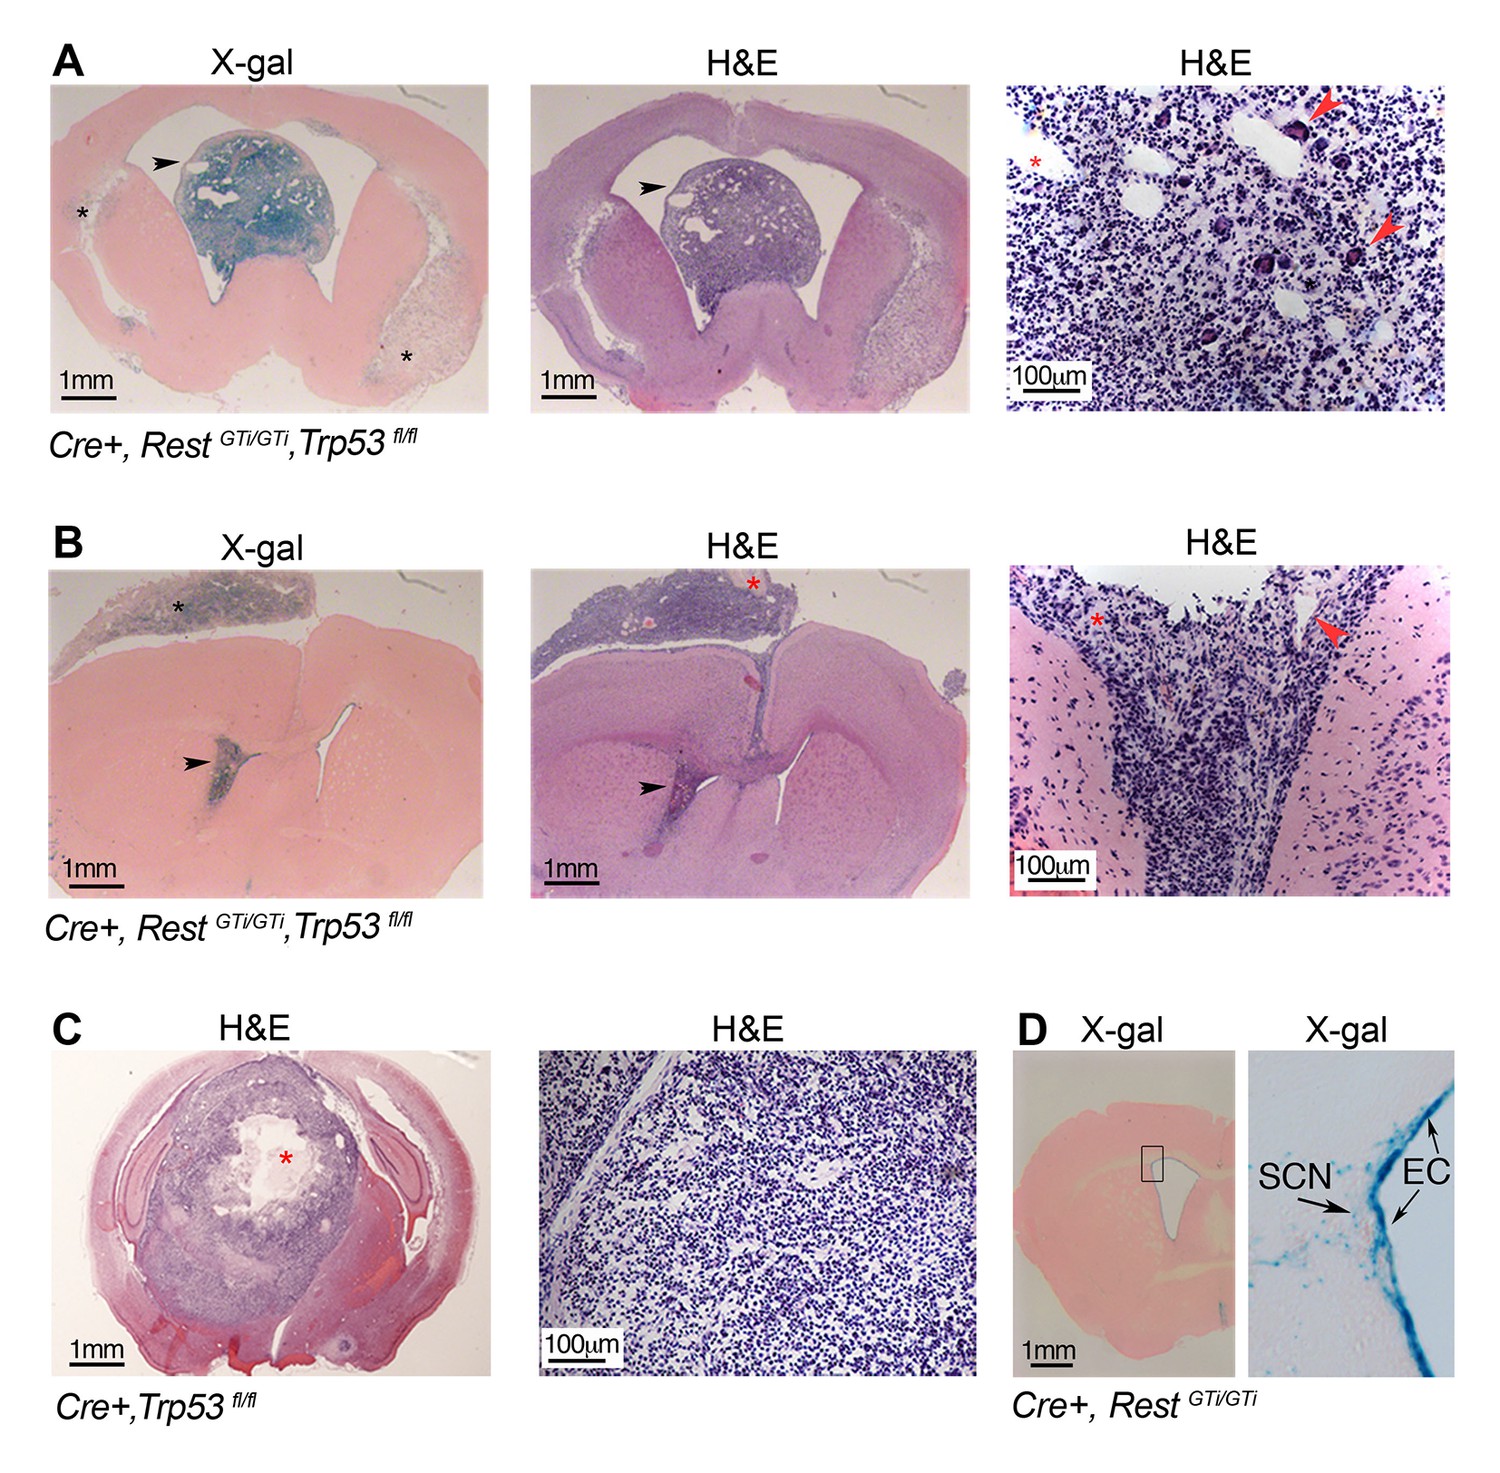
Persistent DNA damage due to loss of REST, in the context of loss of p53, promotes GBMs in adult.
(A) and (B). Left panels, X gal staining of sections from Cre+, RestGTi/GTi Trp53fl/fl mice at 7.5 months (A) and 10.5 months (B) of age. Arrowheads point to intraventricular tumors. Black asterisks indicate secondary tumor formation with subpial spread (B). Middle and right panels, H&E staining reveals abnormally increased cellular densities. Higher magnifications reveal atypical morphology of the densely packed cells, with little cytoplasm and multiple areas of new blood vessel formation (red arrowheads). Red asterisks indicate pseudopallisading necrosis. (C) Left panel, section from 11-month-old p53-deficient mouse brain showing a rare GBM, higher magnification image on right. Red asterisk, necrotic area. (D) Section from 9.5-month-old Cre+, RestGTi/GTi mouse brain. Boxed area is enlarged at right. Arrows point to EC and SCN. EC, ependymal cells; GBM, glioblastoma; H&E, hematoxylin and eosin; SCN, stem cell niche.
Figure 7—figure supplement 1
Immunostaining analysis defining grade IV (GBM) gliomas according to WHO classification.
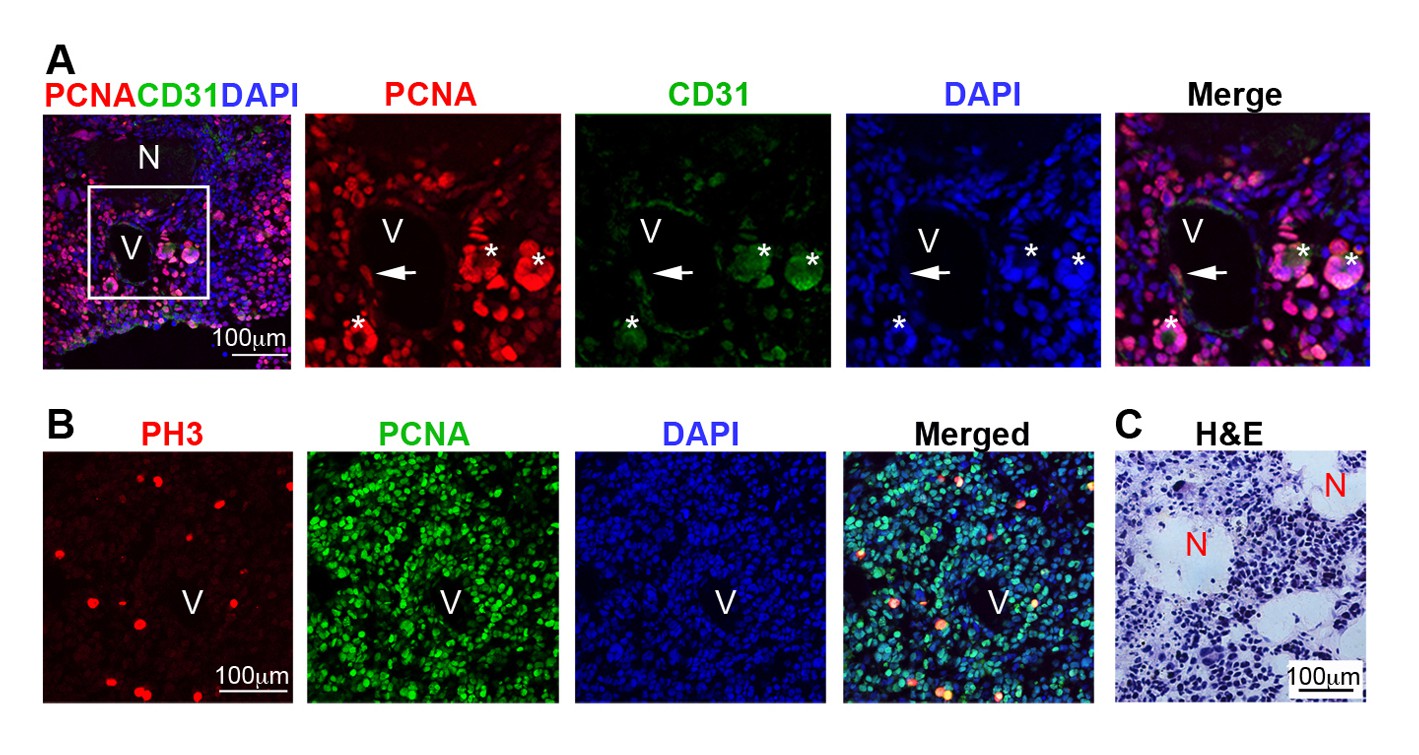
(A) Representative immuno-labeling of a GBM in 9-month-old mouse brain from Cre+, RestGTi/GTi, Trp53fl/fl mice, using antibodies to indicated proteins and DAPI to demarcate nuclei. Panels on the right are high magnification images in inset. Newly forming blood vessel (asterisk) entirely consisting of hypertrophic and hyperplastic endothelial cells (PCNA+CD31+). (B) Representative immuno-labeling of GBM from Cre+, RestGTi/GTi, Trp53fl/fl 11-month-old mouse brain. PH3 is a mitotic marker. (C) Representative GBM section stained with H&E to reveal necrotic areas (N). PCNA, proliferation marker, CD31, endothelial cell marker. V, blood vessel. Arrows, PCNA+ cells within blood vessels. GBM, glioblastoma; PH3, phospho-histone 3; H&E, hematoxylin and eosin.
Figure 7—figure supplement 2

GBM from Cre+, RestGTi/GTi, Trp53 fl/fl mice show high proliferation indices and expression of progenitor and NSC molecular markers.
(A–G) Representative immuno-labeling of a GBM from Cre+, RestGTi/GTi, Trp53fl/fl mouse using markers of astrocytes (GFAP), proliferation (Ki67, PCNA), oligodendrocyte and oligodendrocyte precursors (OLIG2), neural progenitors and stem cells, (SOX2, RC2, CD133 and NESTIN), immature neurons (DCX, TuJ1) and mature neurons (NeuN, Synaptophysin). Normal brain tissue adjacent to tumor is on the left of the dashed line. GBM, glioblastoma; NSC, neural stem cell.
Figure 8
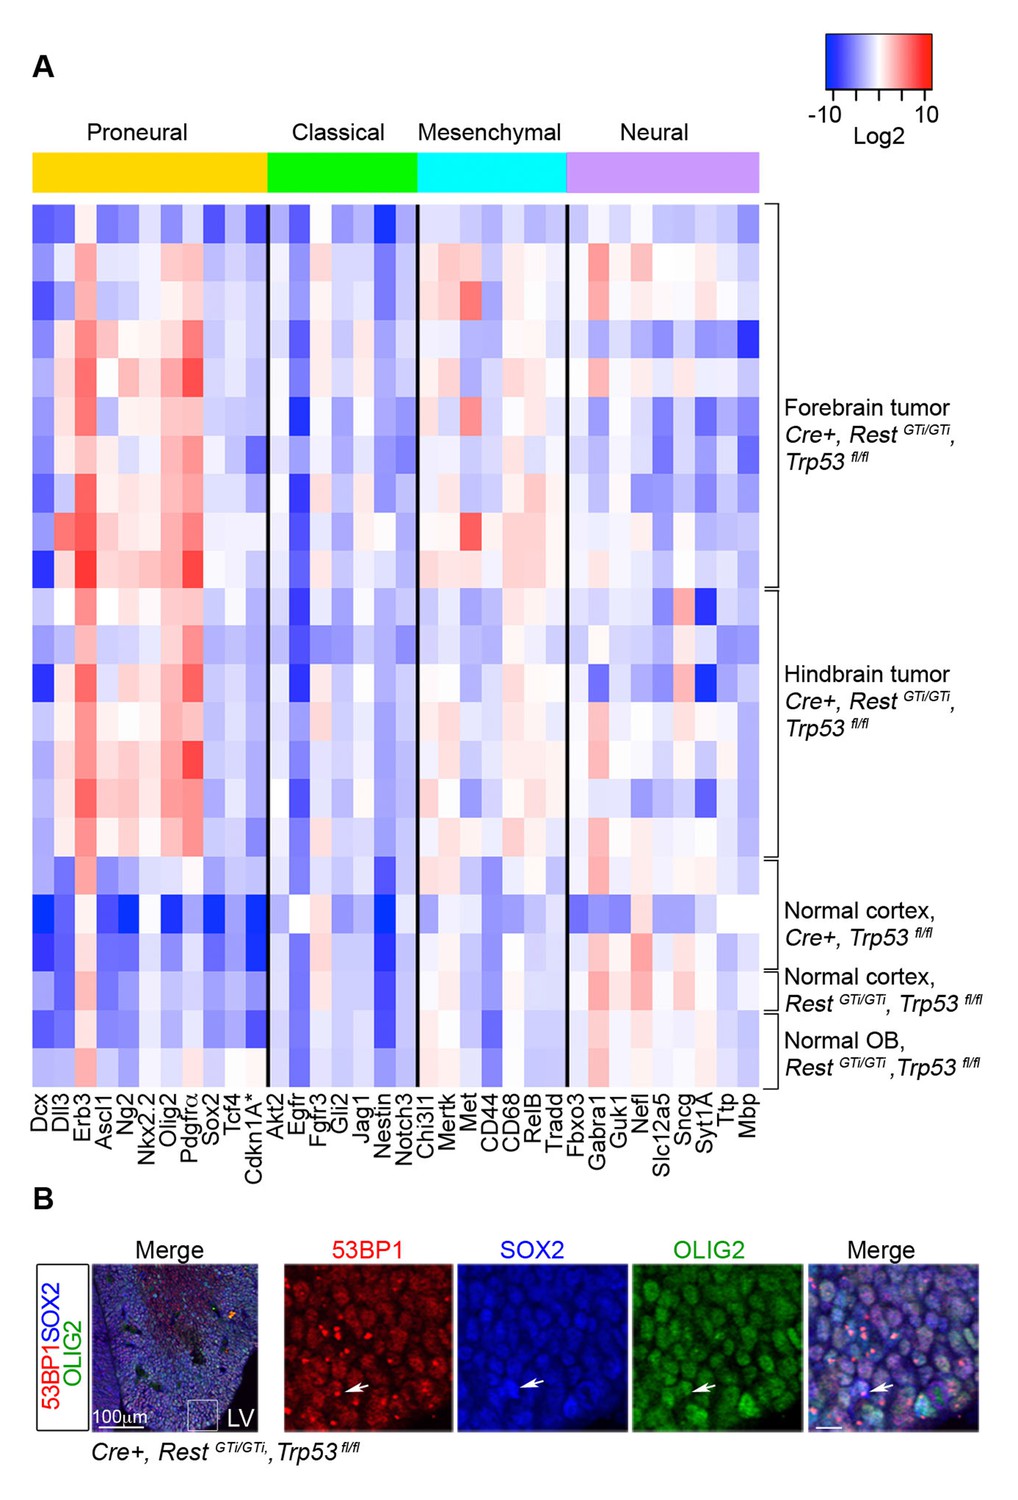
RNA analysis points to proneural type tumors.
(A) Heat map representing qRT-PCR analysis of mRNA levels, normalized to 18S, of selected genes enriched in human proneural, classical, mesenchymal, and neural subtypes of GBMs. The values are color coded and plotted on Log2 scale. (B) Representative immuno-labeling of LGE from E13.5 Cre+, RestGTi/GTi, Trp53fl/fl mice showing 53BP1 foci in progenitor cells. Boxed area on the left image is enlarged on right images (scale bar, 10μm). Arrow points to cell with foci. GBM, glioblastoma; LGE, lateral ganglionic eminence; LV, lateral ventricle; qRT-PCR, quantitative real-time polymerase chain reaction.
Figure 9
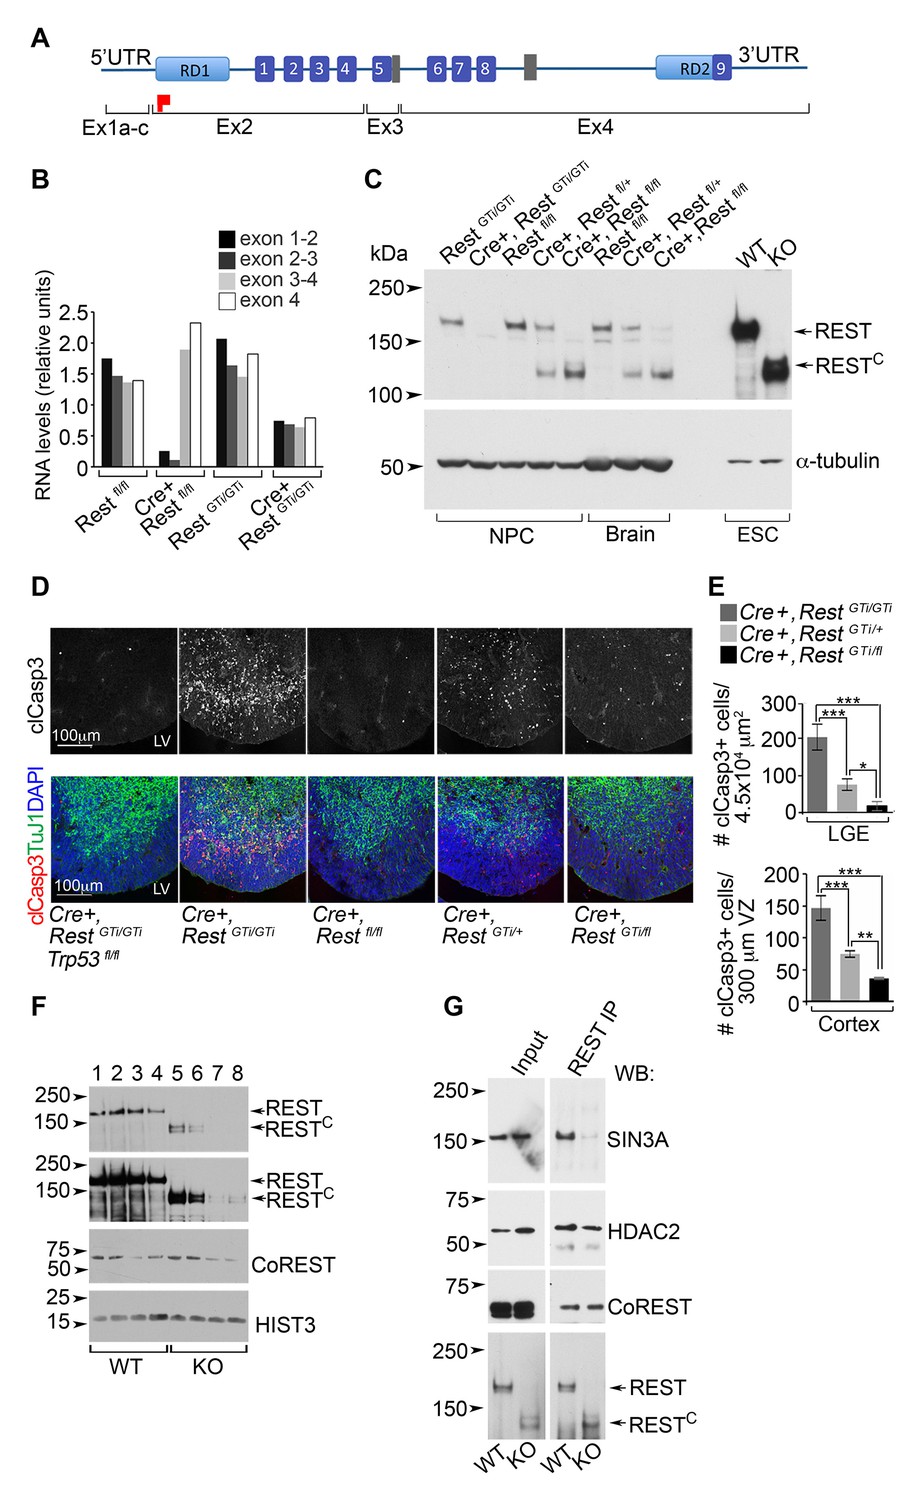
A C-terminal REST peptide, translated in conventional Rest KO mice, recruits co-repressors and protects against apoptosis.
(A) Schematic of REST functional domains (top) and exons (Ex, bottom). (B) qRT-PCR analysis, relative to 18S RNA, spanning indicated exons from E13.5 brain. (C) Western blot analysis of neurospheres (NPC), E13.5 brain, and ESC lysates in indicated genotypes using antibody raised against the C-terminus of REST6. Full length REST protein migrates at ~200kDa6; 130 kDa peptide represents peptide containing the RESTC. α-tubulin, loading control. (D) Representative immunostained images in cortical sections from indicated genotypes. (E) Quantification of apoptotic cells, n=5–6 mice/genotype, 6–10 sections/mouse. Mean values and 95% CI are shown. Statistical significance was determined using Kruskal ANOVA with Dunn posthoc, (F) Representative Western blot from ESC nuclear extracts, n=3 independent experiments. Chromatin extracts were performed with increasing NaCl concentrations; 0 (lanes 1, 5); 100 mM (lanes 2, 6); 200 mM (lanes 3, 7); 500 mM (lanes 4 and 8). Top two panels represent different exposures of the same Western blot. (G) Representative Western blot analyses of REST and RESTC immuno-complexes from ESC nuclear extracts. Extracts from ESC were immunoprecipitated with REST antibody and probed with antibodies indicated at right, n=3 independent experiments. *p< 0.05; **p<0.01; ***p< 0.001. RD, repressor domain; gray rectangle, nuclear localization signal; purple box, zinc finger motif; red flag, initiator methionine. ANOVA, analysis of variance; ESC, embryonic stem cell; qRT-PCR; RESTC, C terminal peptide of REST.
Tables
Table 1
Glioma incidence and grade according to Rest and Trp53 genotypes
| Cre+, Rest GTi/GTi, Trp53 +/+ | Cre+, RestGTi/GTi, Trp53fl/fl | Cre+, RestGTi/+, Trp53fl/fl | Cre+, Rest+/+, Trp53fl/fl | |
|---|---|---|---|---|
| Incidence | 0(30)* | 66%(131) | 53%(34) | 19%(68) |
| Grade I-–III | - | 46% | 94% | 77% |
| Grade IV (GBM) | - | 54% | 6% | 23% |
-
* Number in parenthesis indicates number of animals used in analyses.
Additional files
-
Supplementary file 1
Genes significantly upregulated in E12.5 Cre+, RestGTi/GTi brain vs RestGTi/GTi brain revealed by microarray analyses.
- https://doi.org/10.7554/eLife.09584.018
-
Supplementary file 2
Genes significantly upregulated in brains of E12.5 Cre+, RestGTi/GTi, Trp53fl/fl mice vs RestGTi/GTi, Trp53fl/flrevealed by microarray analyses.
- https://doi.org/10.7554/eLife.09584.019
-
Supplementary file 3
Primer sequences used in the study.
- https://doi.org/10.7554/eLife.09584.020
Download links
A two-part list of links to download the article, or parts of the article, in various formats.
Downloads (link to download the article as PDF)
Open citations (links to open the citations from this article in various online reference manager services)
Cite this article (links to download the citations from this article in formats compatible with various reference manager tools)
The REST remodeling complex protects genomic integrity during embryonic neurogenesis
eLife 5:e09584.
https://doi.org/10.7554/eLife.09584


