Coverage and system efficiencies of insecticide-treated nets in Africa from 2000 to 2017
- University of Oxford, United Kingdom
- Sanaria Institute of Global Health and Tropical Medicine, United States
- National Institutes of Health, United States
- Flowminder Foundation, Sweden
- University of Southampton, United Kingdom
- World Health Organization, Switzerland
- Tulane University School of Public Health and Tropical Medicine, United States
- University of California, San Francisco, United States
- The Global Fund to Fight AIDS, Tuberculosis and Malaria, Switzerland
- University of Washington, United States
Figures
Figure 1
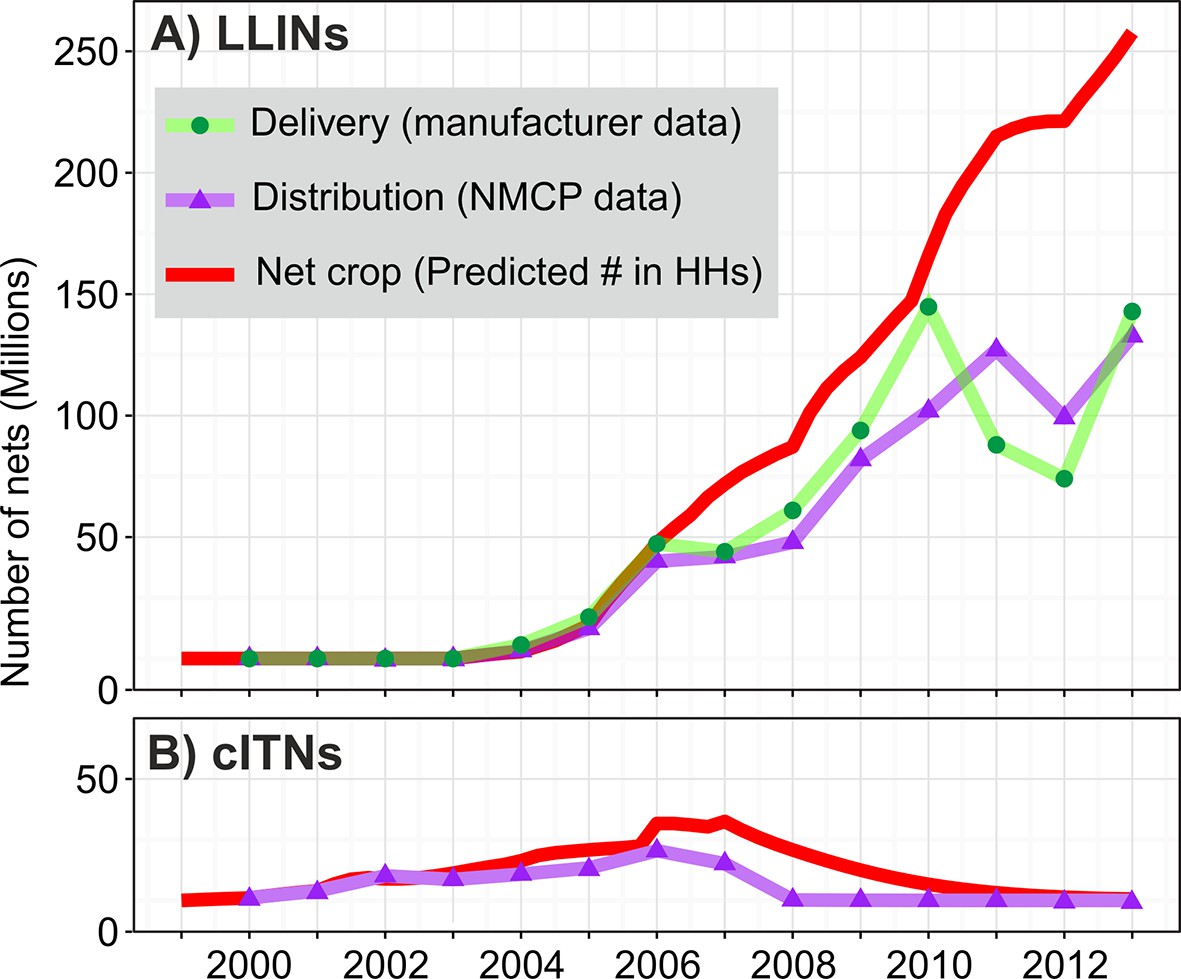
Time series of ITN delivery, distribution, and estimated net crop in sub-Saharan households 2000–2013 for (A) LLINs and (B) cITNs.
Manufacturer data on deliveries were available for LLINs only. cITNs, conventional insecticide-treated nets; HHs, households; ITNs, insecticide-treated nets; LLINs, long-lasting insecticidal nets; NMCP, National Malaria Control Programme.
Figure 2
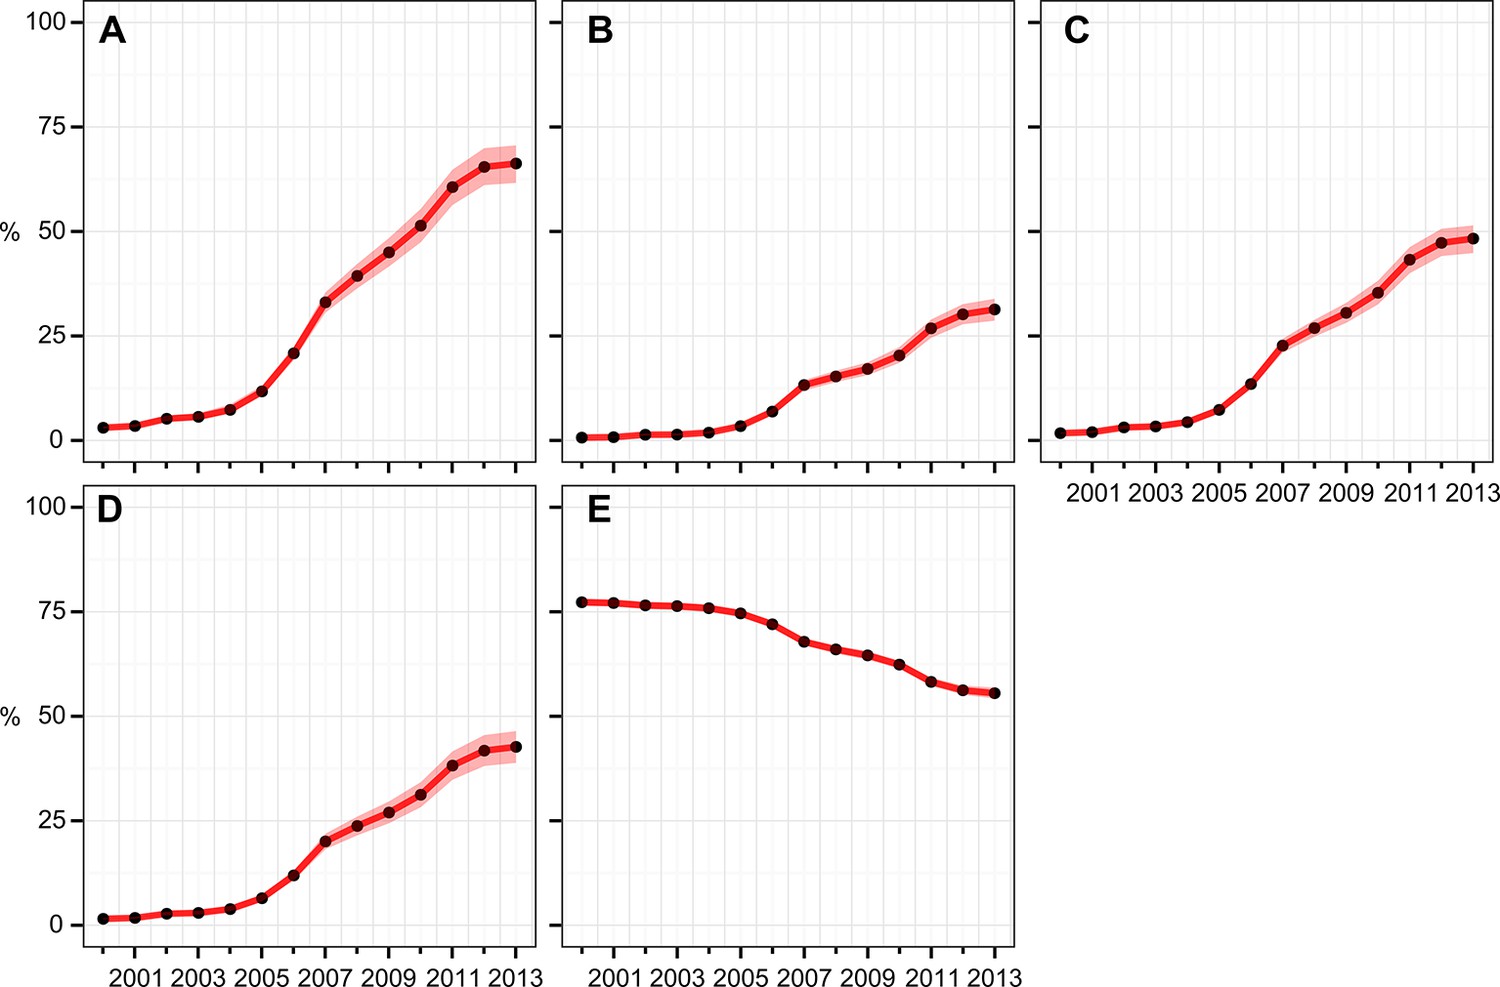
Continental-level time series of estimated ITN coverage indicators for the years 2000–2013.
(A) % households with at least one ITN; (B) % households with at least one ITN for every two people; (C) % population with access to an ITN within their household; (D) % population who slept under an ITN the previous night; (E) 'ownership gap', the % of ITN-owning households with insufficient ITNs for one-between-two. Black circles are the annual estimates; pink envelopes denote the 95% posterior credible interval. ITNs, insecticide-treated nets.
Figure 3
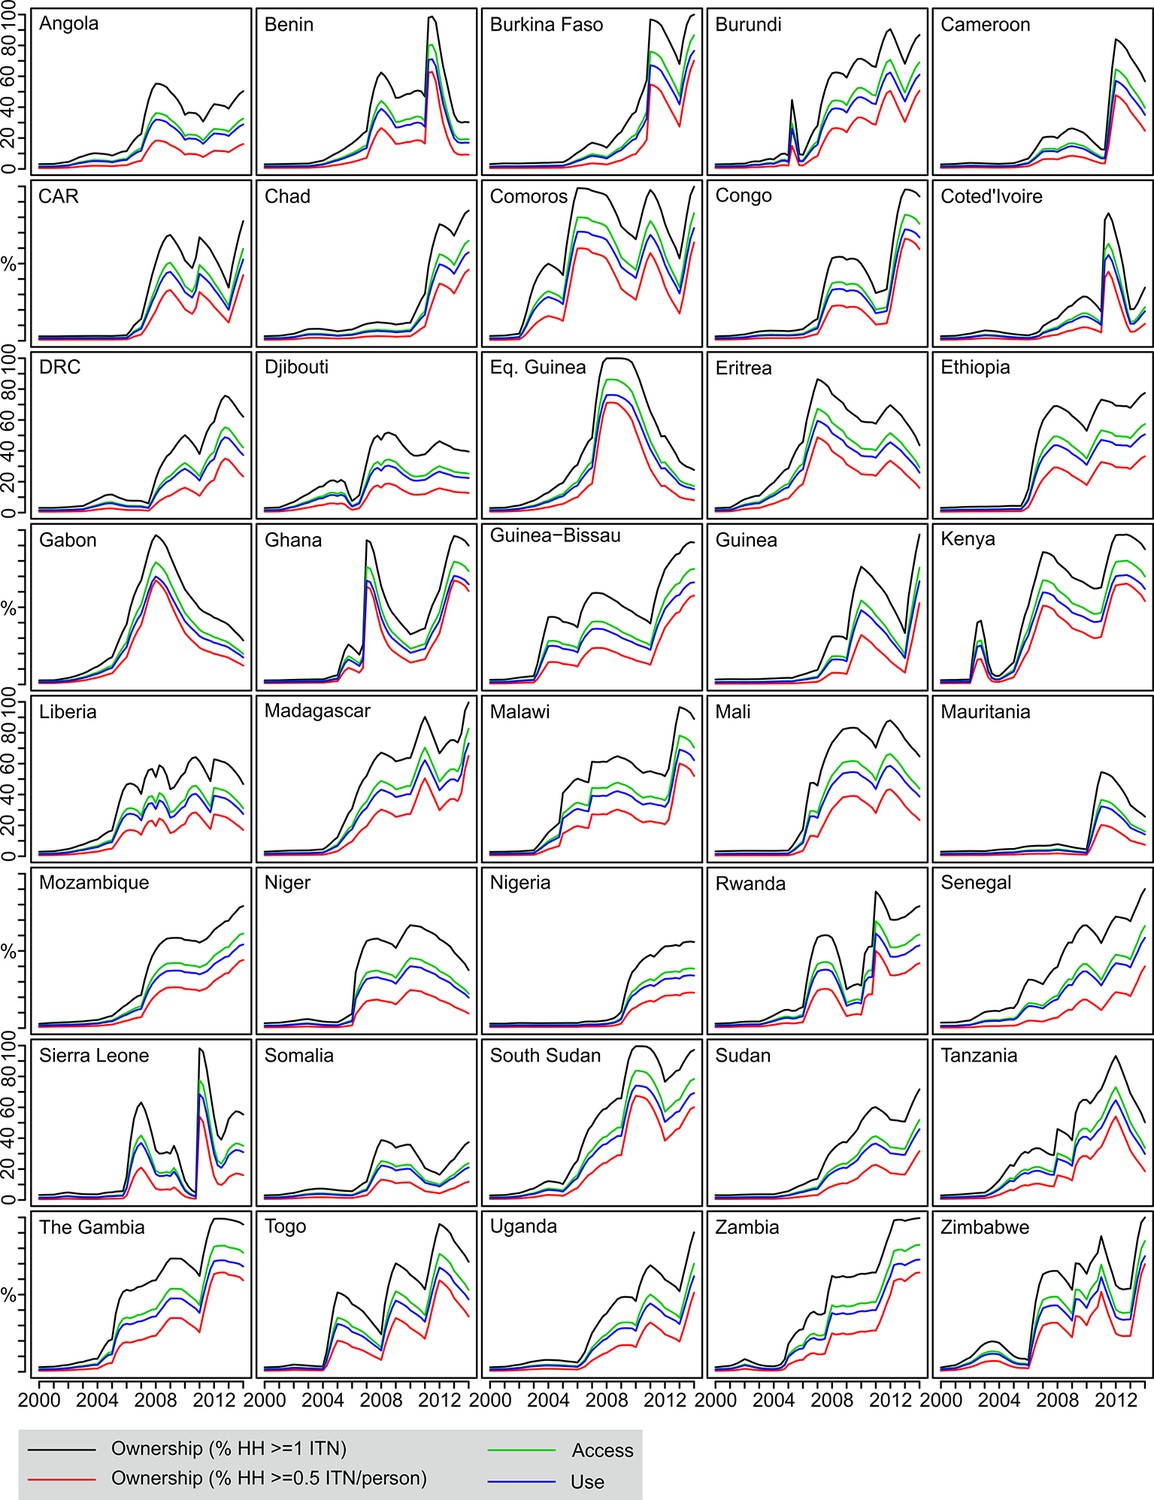
Country-level time series of estimated ITN coverage indicators 2000–2013.
Each plot shows the four ITN coverage indicators: % households with at least one ITN (black); % households with at least one ITN for every two people (red); % population with access to an ITN within their household (green); % population who slept under an ITN the previous night (blue). CAR = Central African Republic; DRC = Democratic Republic of Congo; ITNs, insecticide-treated nets; HH = household.
Figure 4
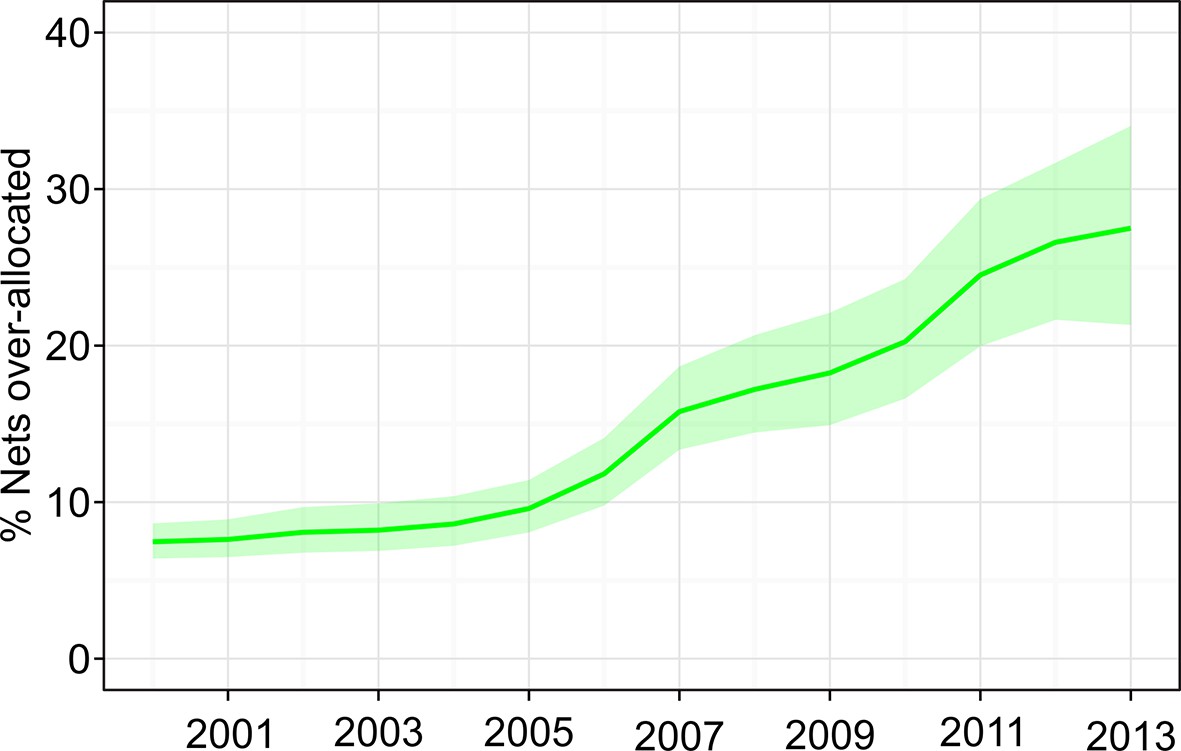
Time series of over-allocation for the combined set of 40 sub-Saharan endemic countries, 2000–2013.
Over-allocation refers to insecticide-treated nets distributed to households already owning enough nets for one-between-two, measured as the percentage of over-allocated nets among all nets in households.
Figure 5
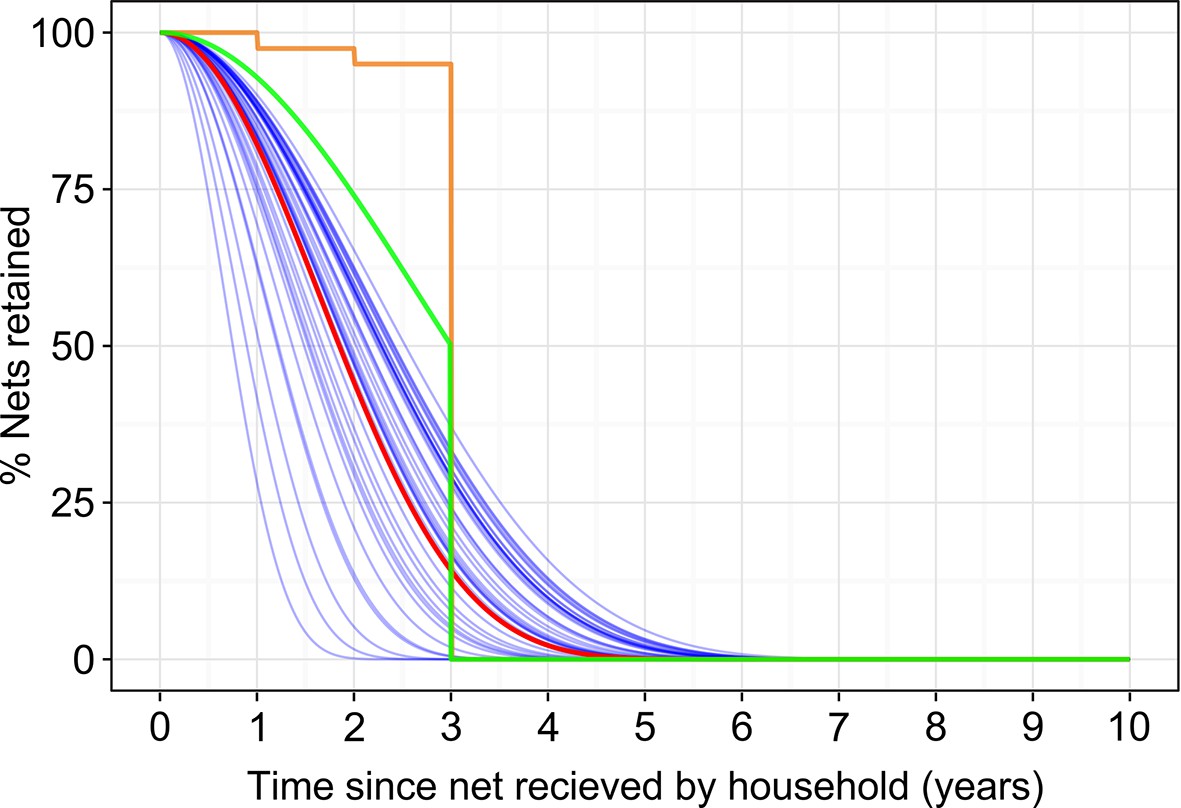
Insecticide treated netretention.
Estimated long-lasting insecticidal net retention curves for each country individually (blue lines) and combined (red line), in both cases relating to the average of the most recent 3 years, 2011–2013. Also shown for reference are the rate of loss recommended in the Roll Back Malaria Harmonization Working Group needs assessment exercise (green line) and the loss rate fitted by Flaxman et al. (orange line).
Figure 6

Projected 2017 coverage for sub-Saharan Africa in relation to number of LLINs delivered over 2014–2017 period.
(A) % households owning at least one ITN; (B) % households owning enough ITN for one between two; (C) % population with access to ITN within the household; (D) % population sleeping under an ITN the previous night; (E) 'ownership gap', the % of ITN-owning households with insufficient ITNs for one-between-two. For each indicator, we project likely coverage under four scenarios: current levels of over-allocation and net loss (i.e. 'business as usual'); with minimised over-allocation; with longer average net retention (3-yr median); and with both minimised over-allocation and longer net retention. The vertical dashed lines indicate the number of LLINs calculated as required over the period under the country programmatic needs assessment supported by Roll Back Malaria Harmonization Working Group. LLINs, long-lasting insecticidal nets; ITNs, insecticide-treated nets.
Figure 7
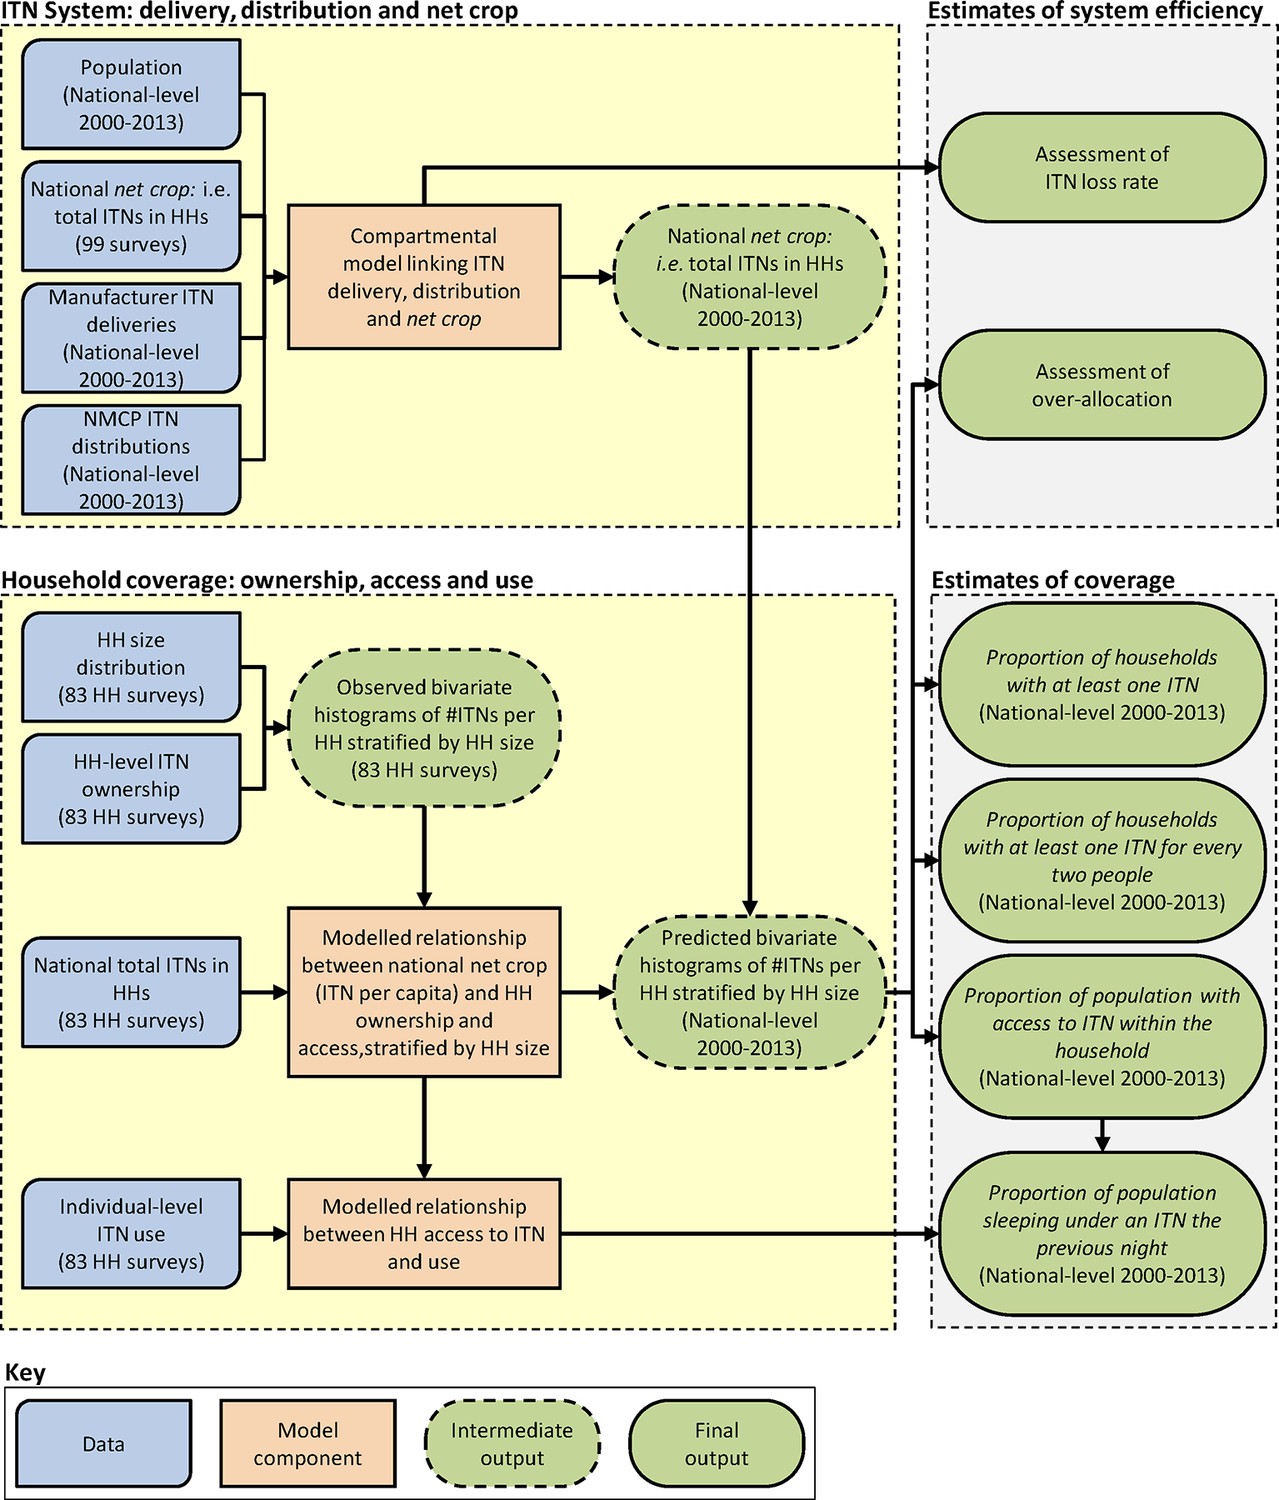
Schematic showing overall analytical framework linking data, model components, and outputs.
HH = household; ITN, insecticide-treated net; NMCP = National Malaria Control Programme.
Figure 8
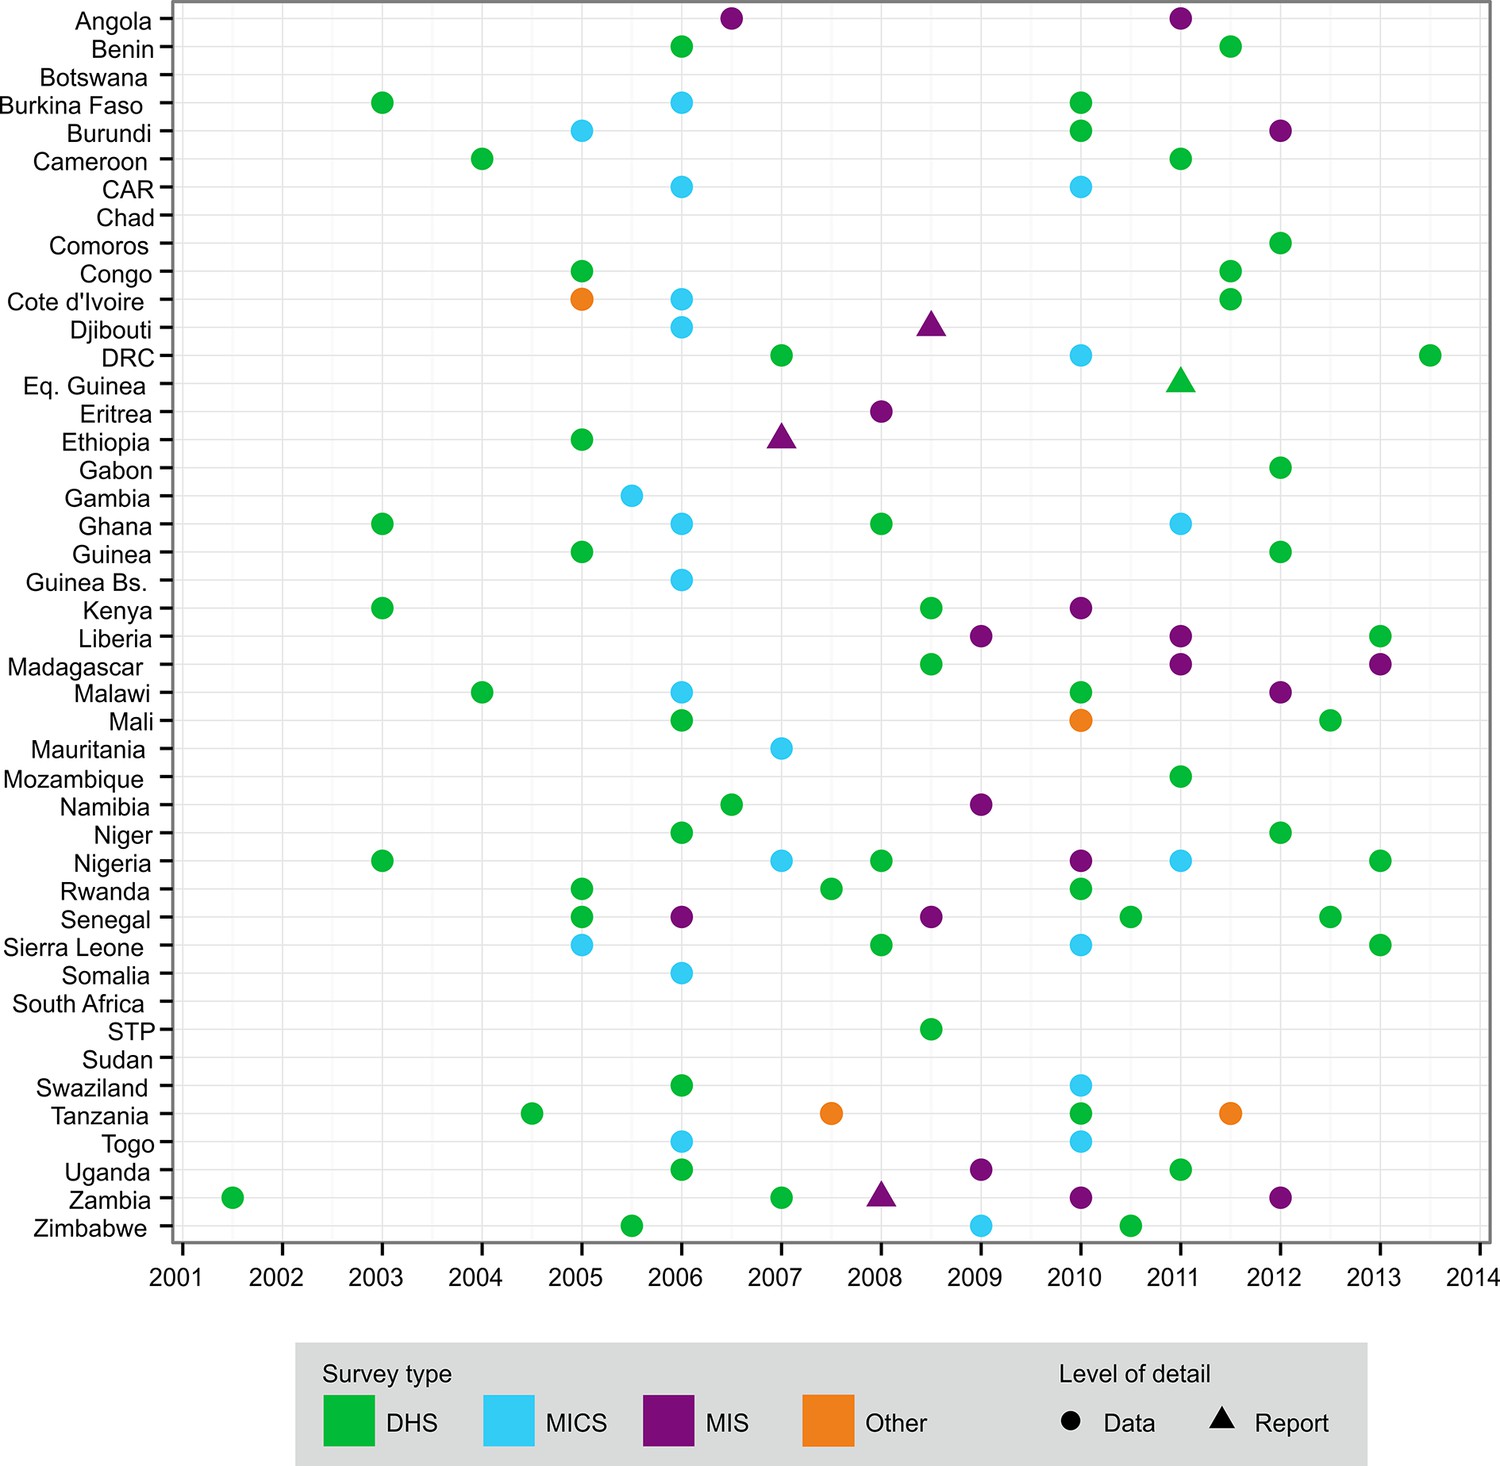
Distribution of national survey data on ITN net crop and household ownership, access and use used in this study, by country and year.
The different types of survey are shown in the key: CAR = Central African Republic; DHS = Demographic and Health Survey; DRC = Democratic Republic of Congo; ITN, insecticide-treated net; MICS = Multiple Indicator Cluster Survey; MIS = Malaria Indicator Survey; STP = São Tomé and Príncipe.
Appendix figure 1
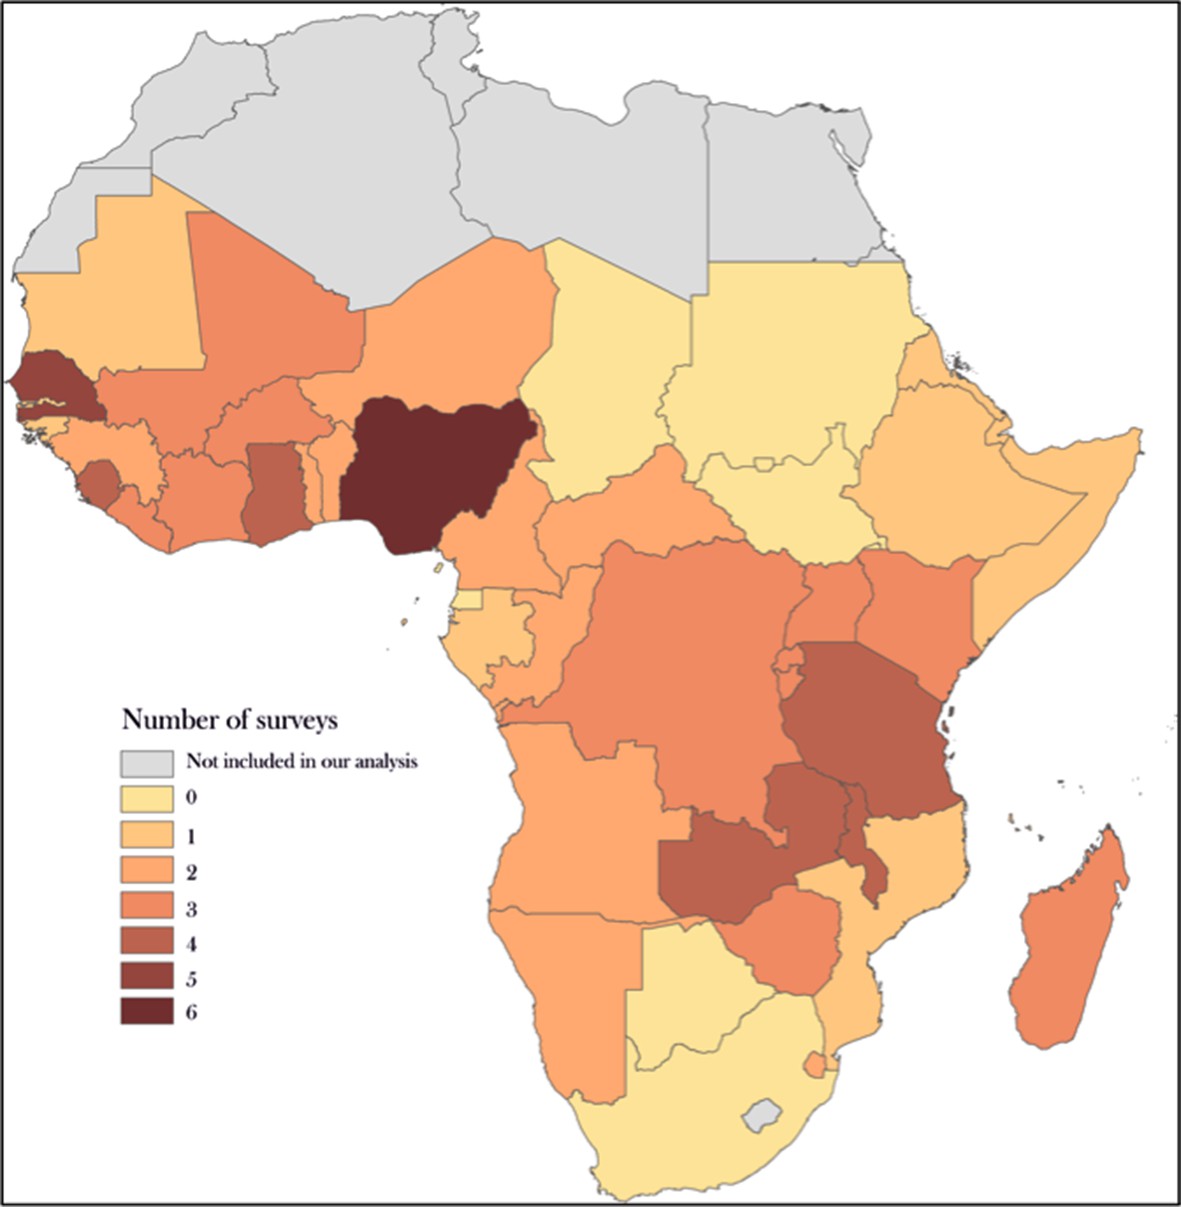
Number of household surveys by country: Each country is shaded to represent the number of household surveys datasets and reports acquired with data on insecticide-treated net ownership and use.
https://doi.org/10.7554/eLife.09672.012
Appendix figure 2

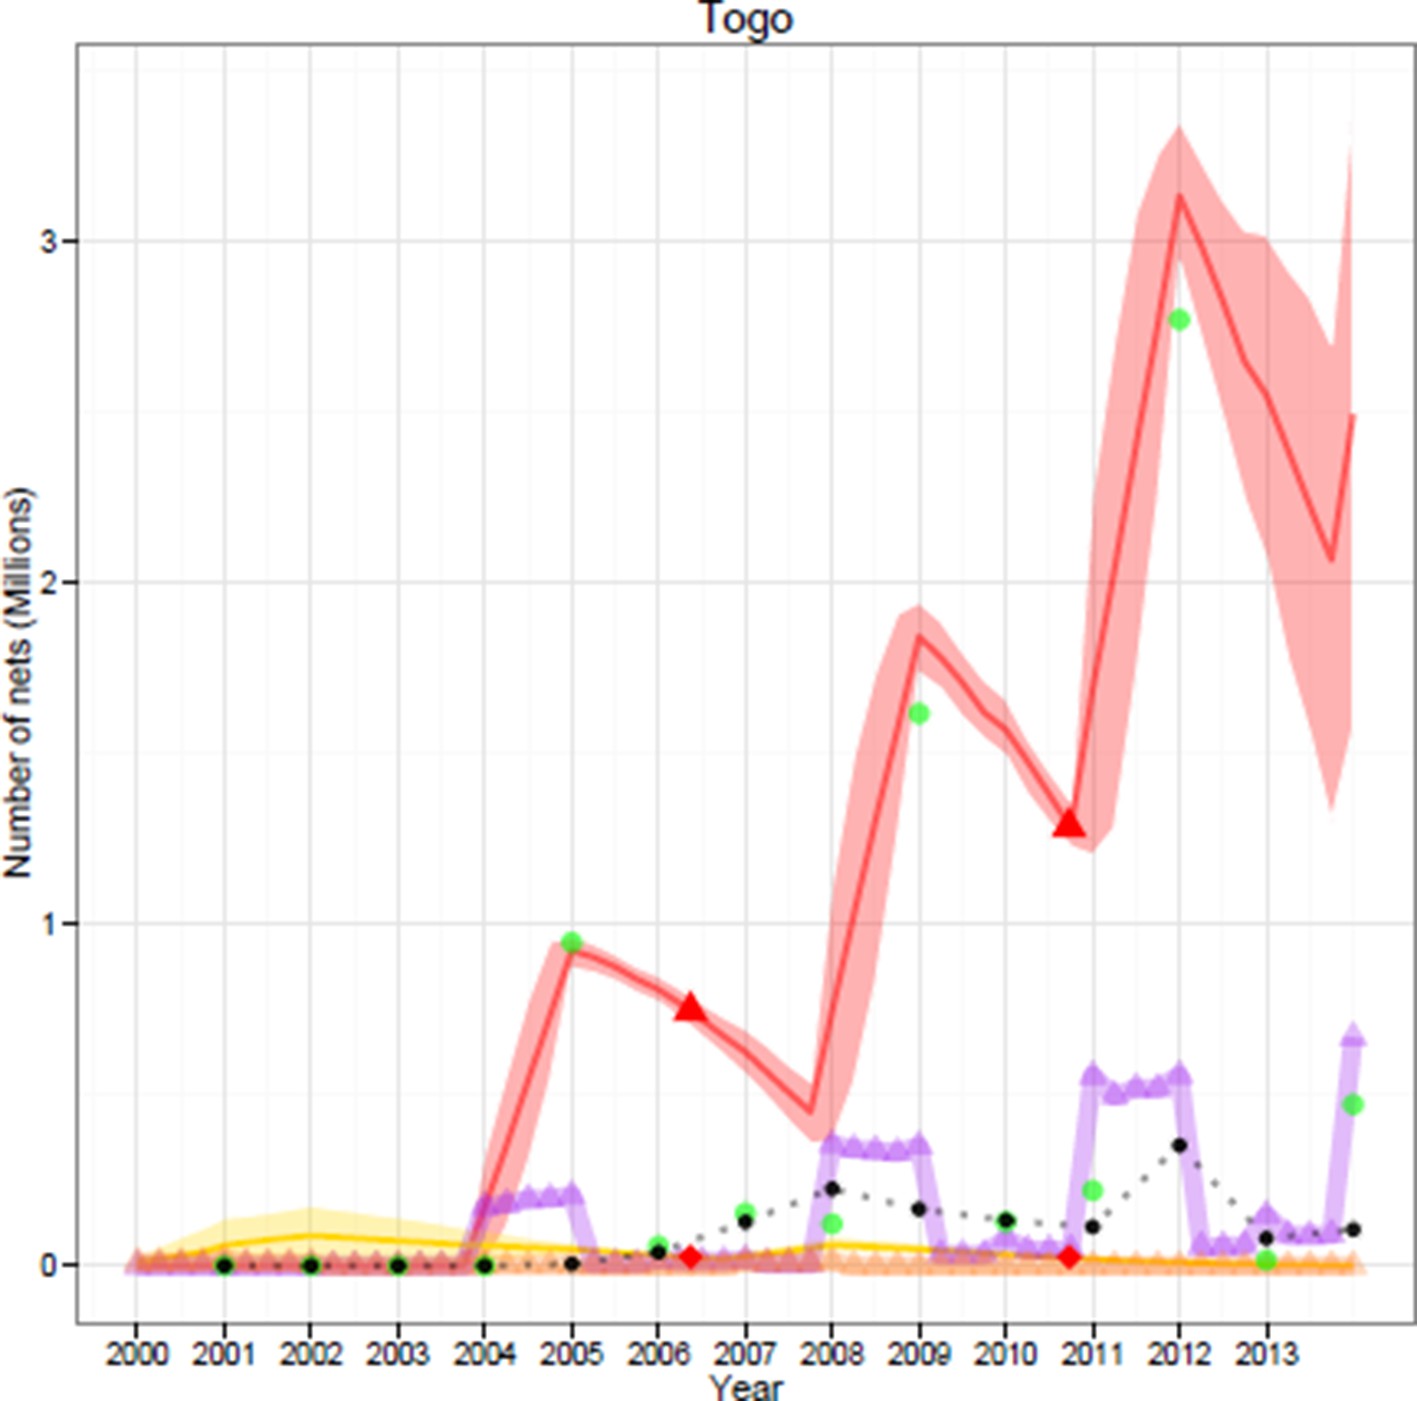
Compartment model dynamics for LLINs.
The compartment model predicts the total number of nets in a country (thick purple line). For a given country at given years there will be LLINs delivered to the country from manufacturers (green arrows), and LLINs distributed at some point in that or subsequent years within the country (blue arrows). Country-wide survey reports give a cross-sectional measure of the total number of nets in households (red line). Evidence synthesis of three data sources can then be inferred by estimating a rate of loss (via a loss function). LLINs, long-lasting insecticidal nets.
Appendix figure 3
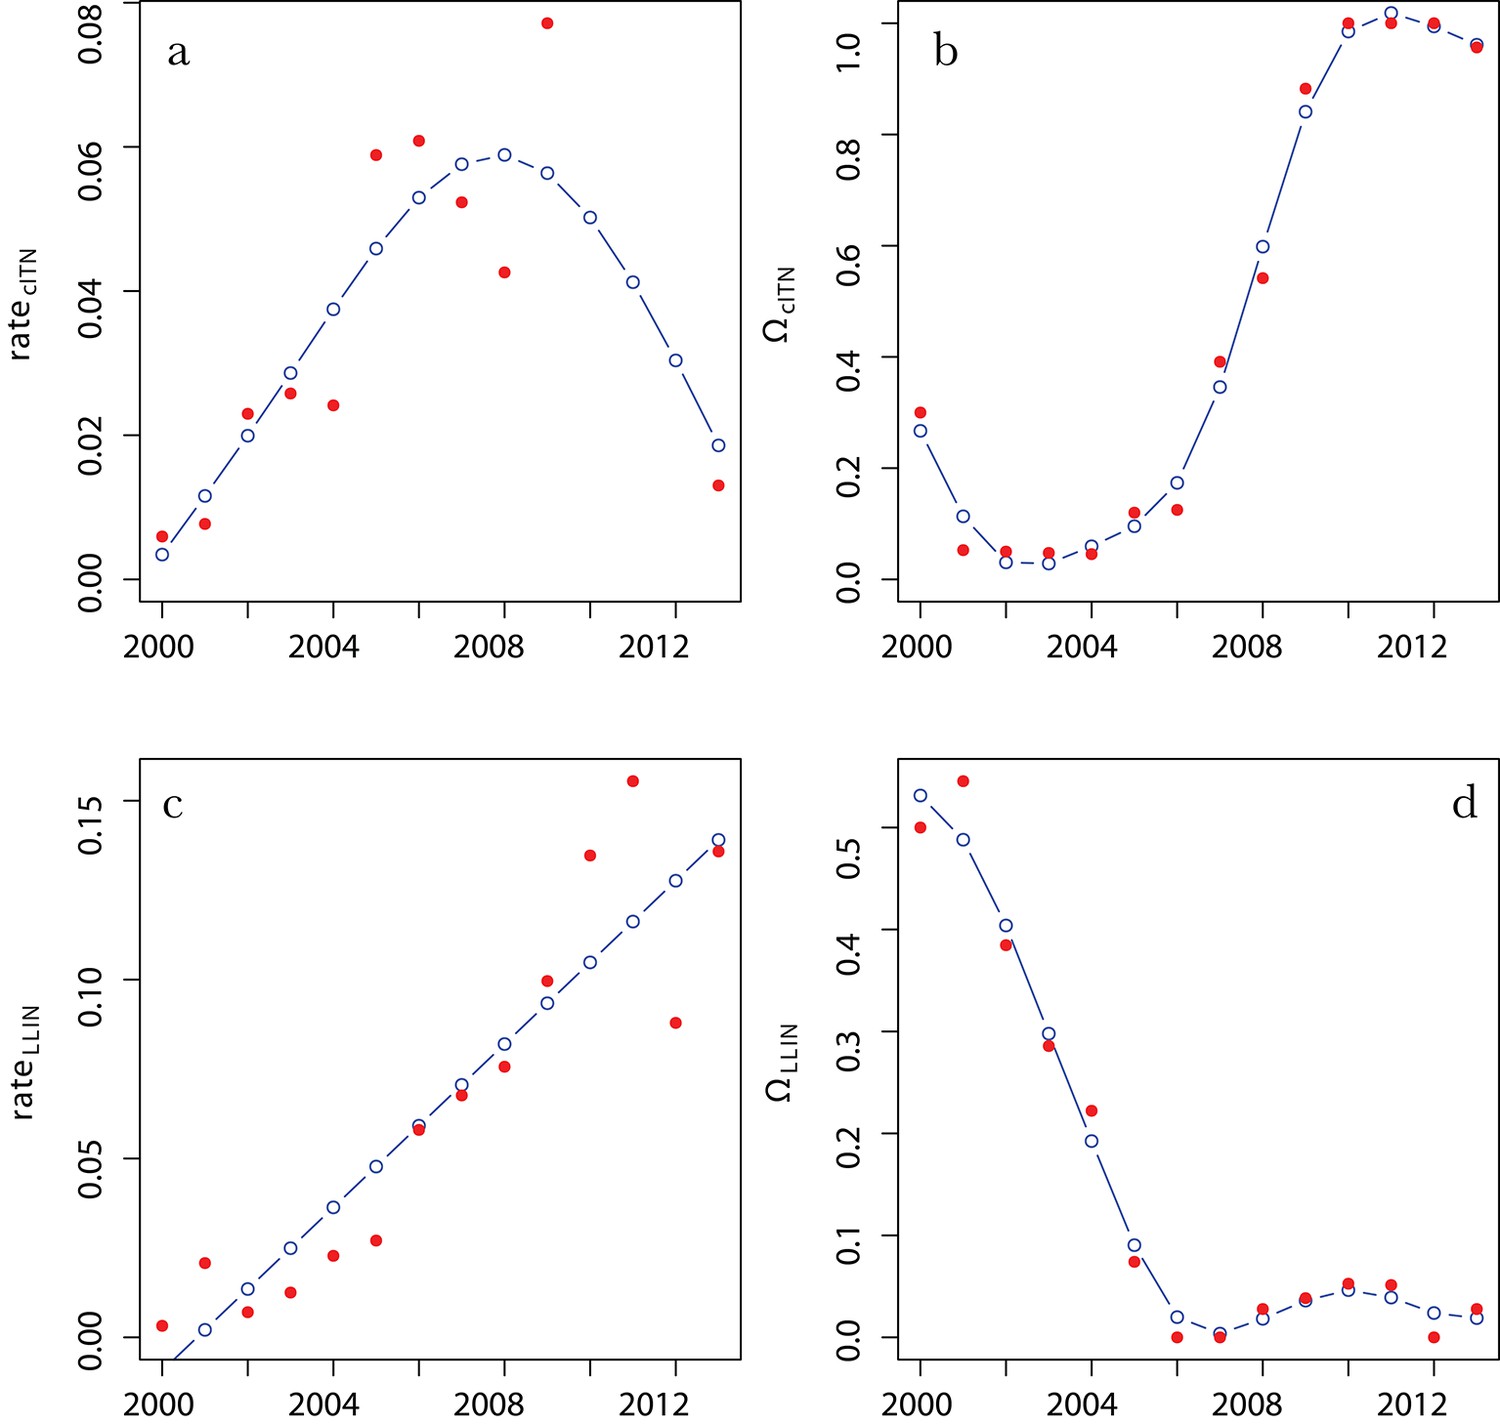
Parameter fits for the hurdle exponential NMCP prior.
(A,C) are the exponential rate priors on the per capita rates of cITN (A) and LLIN (C) distributions in a given year (see Equations 10 and 11). (B,D) are the Bernoulli hurdle probabilities that zero cITNs (B) or LLINs (D) are distributed in a given year (see Equations 12 and 13). Red points are the data, and blue line are optimised spline fits. cITNs, conventional insecticide-treated nets; LLINs, long-lasting insecticidal nets; NMCP, National Malaria Control Programme.
Appendix figure 4
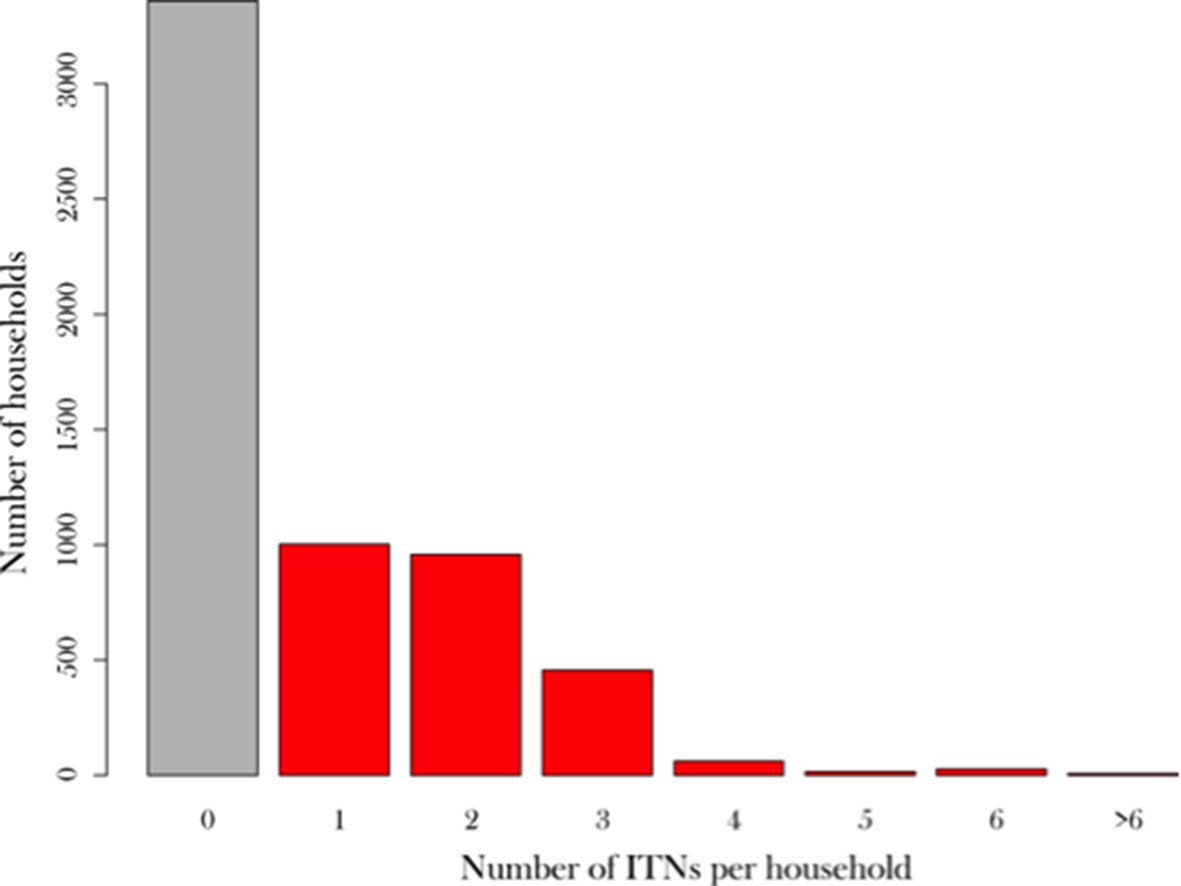
Histogram of #ITNs per household as observed in the Nigeria 2010 Malaria Indicator Survey.
Red bars represent the number of households with one or more nets, and the grey bar represents households with no nets. ITNs, insecticide-treated nets.
Appendix figure 5
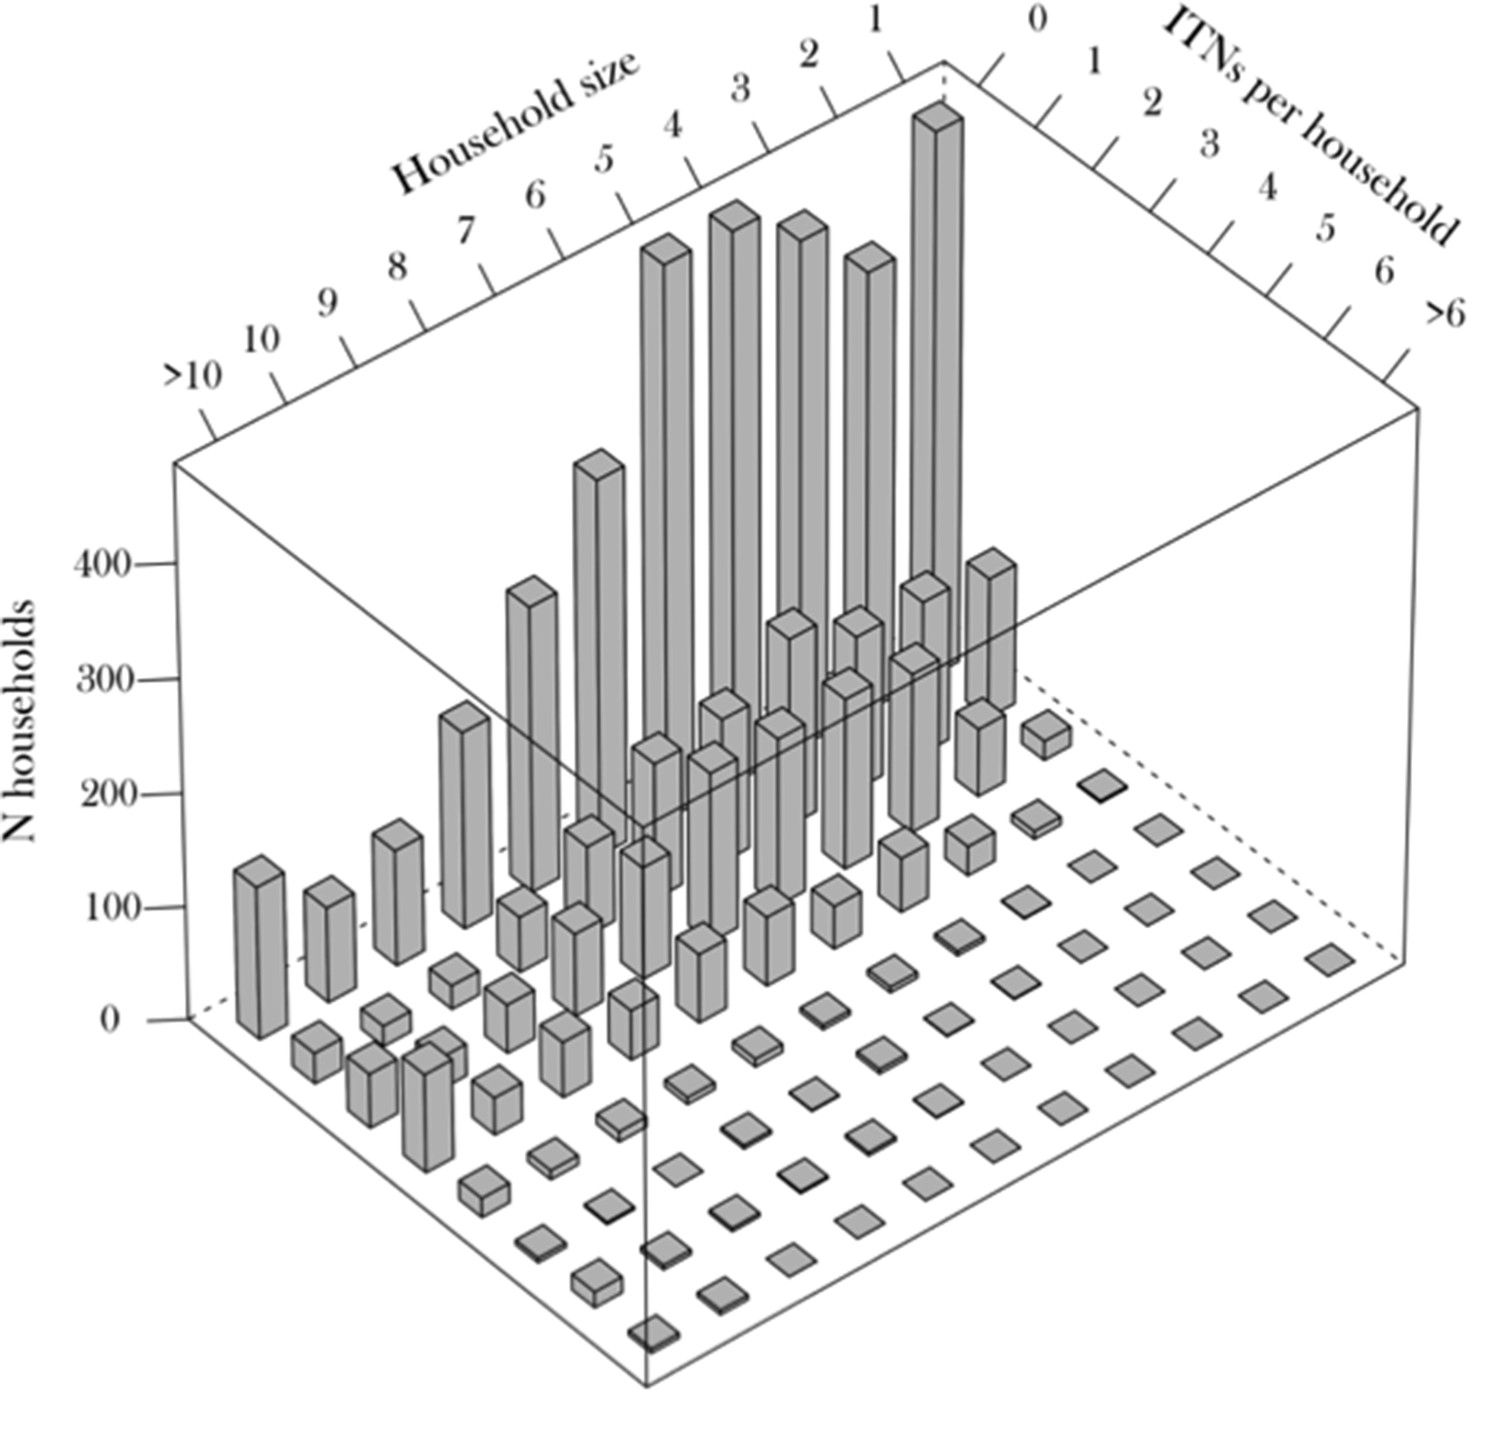
Nigeria 2010 Malaria Indicator Survey household survey summary stratified by household size.
ITNs, insecticide-treated nets.
Appendix figure 6
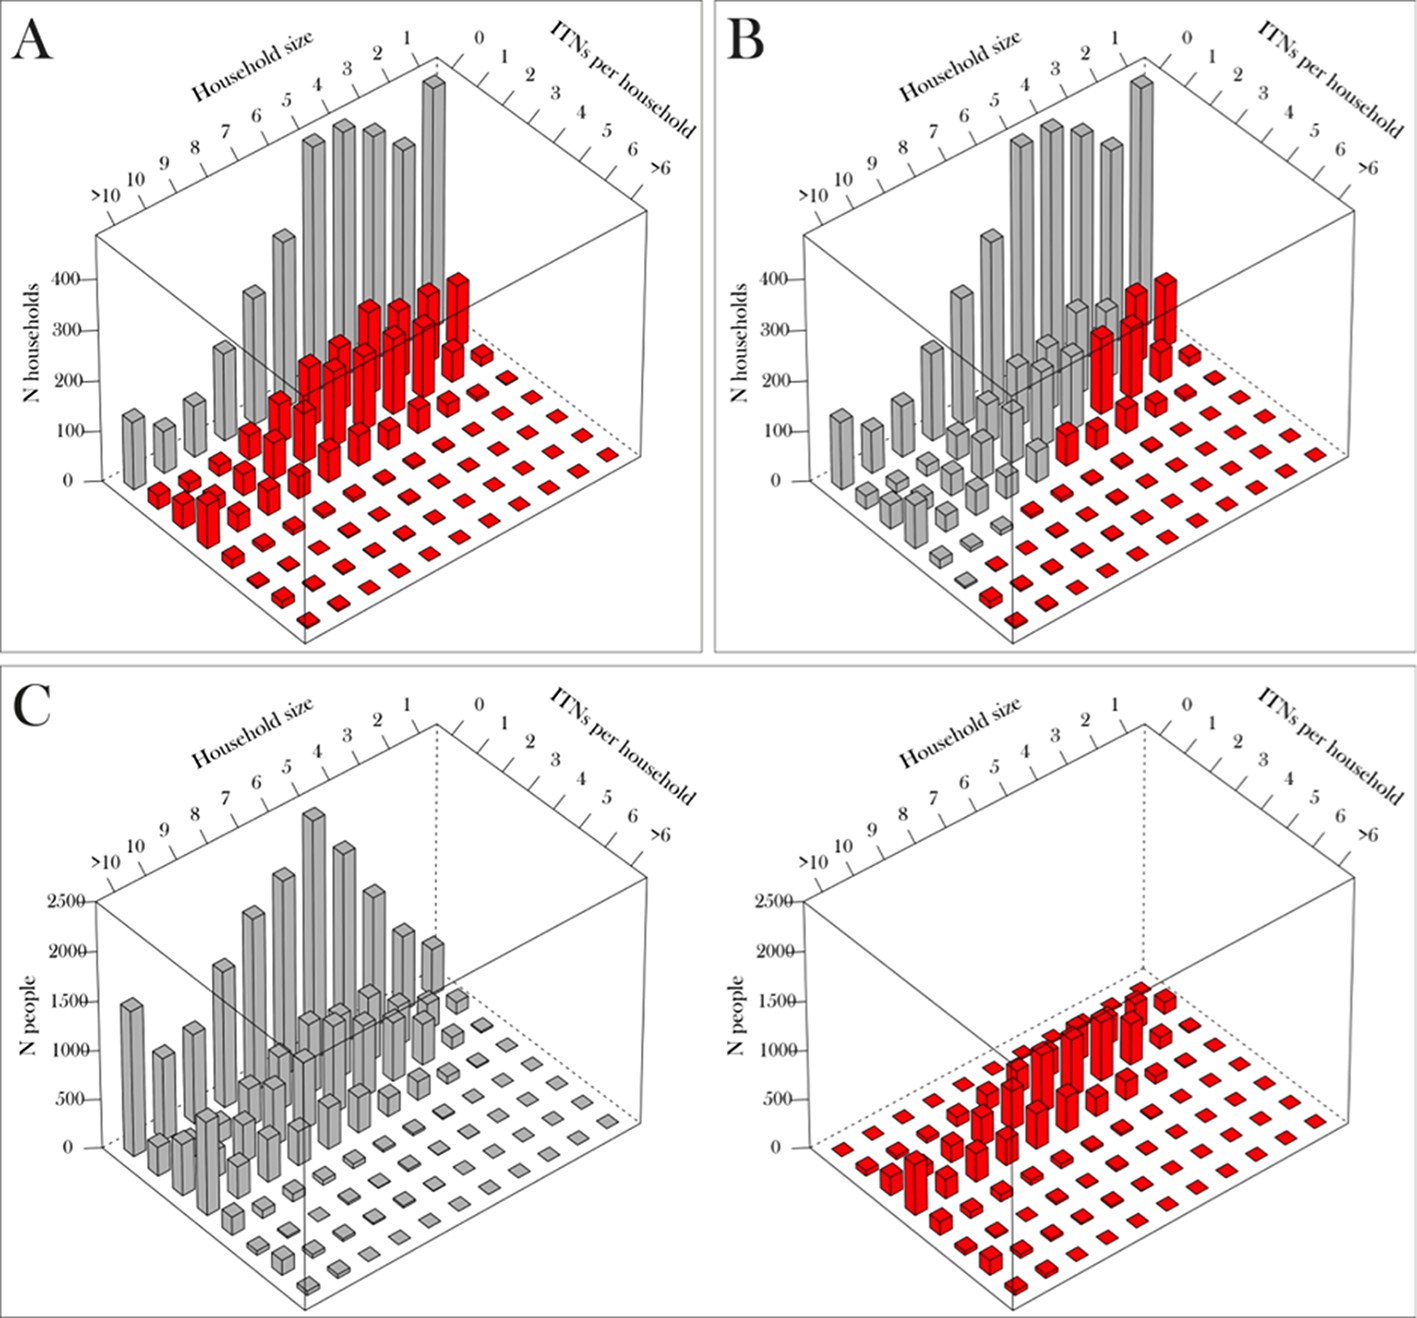
Calculation of indicators 1–3 from two-dimensional histograms for Nigeria 2010 Malaria Indicator Survey.
(A) % HHs with one or more net, obtained by dividing the sum of red bars (HHs with one or more ITN) by the sum of all bars. (B) % HHs owning enough nets for one-between-two, obtained by dividing sum of red bars (i.e. those HHs meeting or exceeding the one-between-two criteria) by the sum of all bars. (C) % population with access to ITN in the HH, obtained by first converting bars to represent people rather than HHs, then dividing sum of individuals that would be able to access an ITN sharing with one other (red bars in right-hand histogram) with the sum of all individuals (grey bars in left-hand histogram). HHs, households; ITNs, insecticide-treated nets.
Appendix figure 7
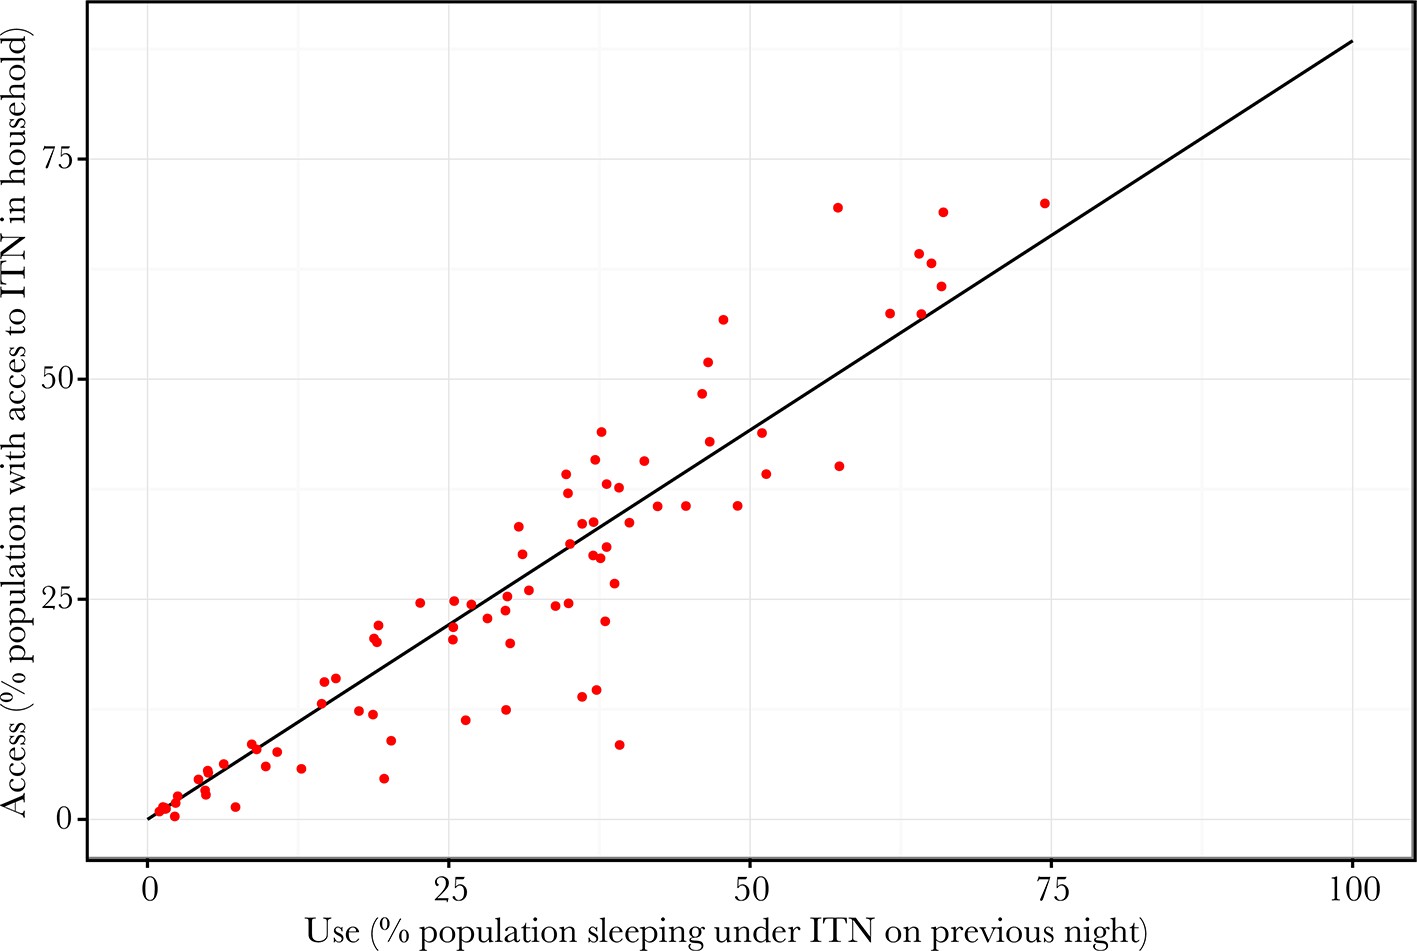
The regression relationship between the proportion of people who slept under an ITN and the proportion of people with access to an ITN.
ITN, insecticide-treated net.
Author response image 1
Author response image 2
Additional files
-
Supplementary file 1
Surveys used in model fitting, including type of data available.
HH = households; CAR = Central African Republic; DRC = Democratic Republic of Congo; STP = São Tomé and Príncipe.
- https://doi.org/10.7554/eLife.09672.011
Download links
A two-part list of links to download the article, or parts of the article, in various formats.
Downloads (link to download the article as PDF)
Open citations (links to open the citations from this article in various online reference manager services)
Cite this article (links to download the citations from this article in formats compatible with various reference manager tools)
Coverage and system efficiencies of insecticide-treated nets in Africa from 2000 to 2017
eLife 4:e09672.
https://doi.org/10.7554/eLife.09672


