Greatwall promotes cell transformation by hyperactivating AKT in human malignancies
- Université de Montpellier, France
- Institut Bergonié, Institut National de la Santé et de la Recherche Medicale, Université Bordeaux Segalen, France
- Institut de Recherche en Cancérologie de Montpellier, Université de Montpellier, France
Figures
Figure 1 with 2 supplements
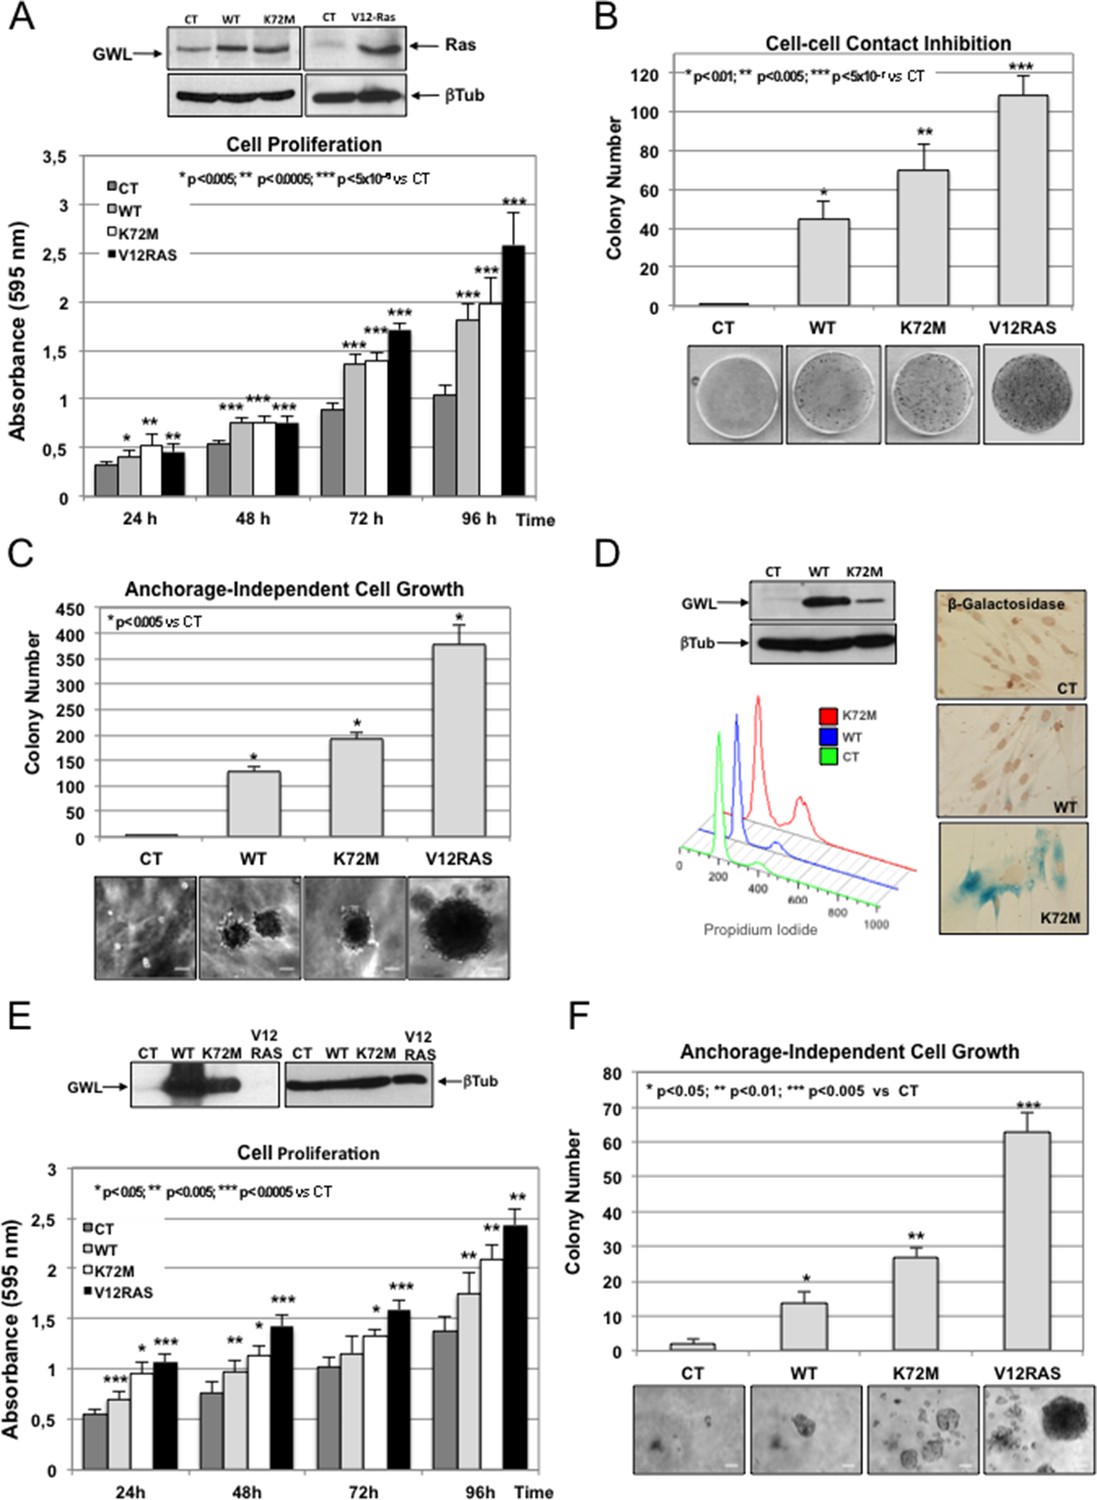
GWL overexpression promotes cell transformation in immortalised mammary gland cells and in primary human fibroblasts.
(A-C) MCF10A cells were stably infected with either empty pMXs vector (CT) or plasmids coding for wild type (WT) or hyperactive (K72M) GWL. A MCF10A stable clone overexpressing the V12RAS oncogene was used as a positive control. Cell proliferation (A), cell—cell contact inhibition (B) and anchorage-independent cell growth (C) were assayed in these cells. Colonies stained by crystal violet in normal seeded plates (cell—cell contact inhibition) or in soft-agar plates (anchorage-independent cell growth) were counted and results presented in a graph. Results are shown as the mean of three different experiments ± SD. Two-tailed unpaired Student t tests were performed to determine statistical relevance; significant p values are shown. Scale bars, 60 μm. (D) Primary human fibroblasts were infected with empty pMXs vector (CT) or with plasmids coding for the indicated GWL proteins. FACS profile and β-Galactosidase staining (blue) of these cells are shown. (E,F) Human fibroblasts expressing hTERT and SV40 T large antigen were infected with an empty vector (CT) or with plasmids encoding WT or K72M GWL. An hTERT-SV40-V12Ras cell line was used as a positive control. Cell proliferation (E) and anchorage-independent cell growth (F) are shown. Results are the mean ± SD of three different experiments. Two-tailed unpaired Student’s t tests were performed to determine the statistical relevance; significant p values are shown. Scale bars, 100 μm. SD, standard deviation.
Figure 1—figure supplement 1
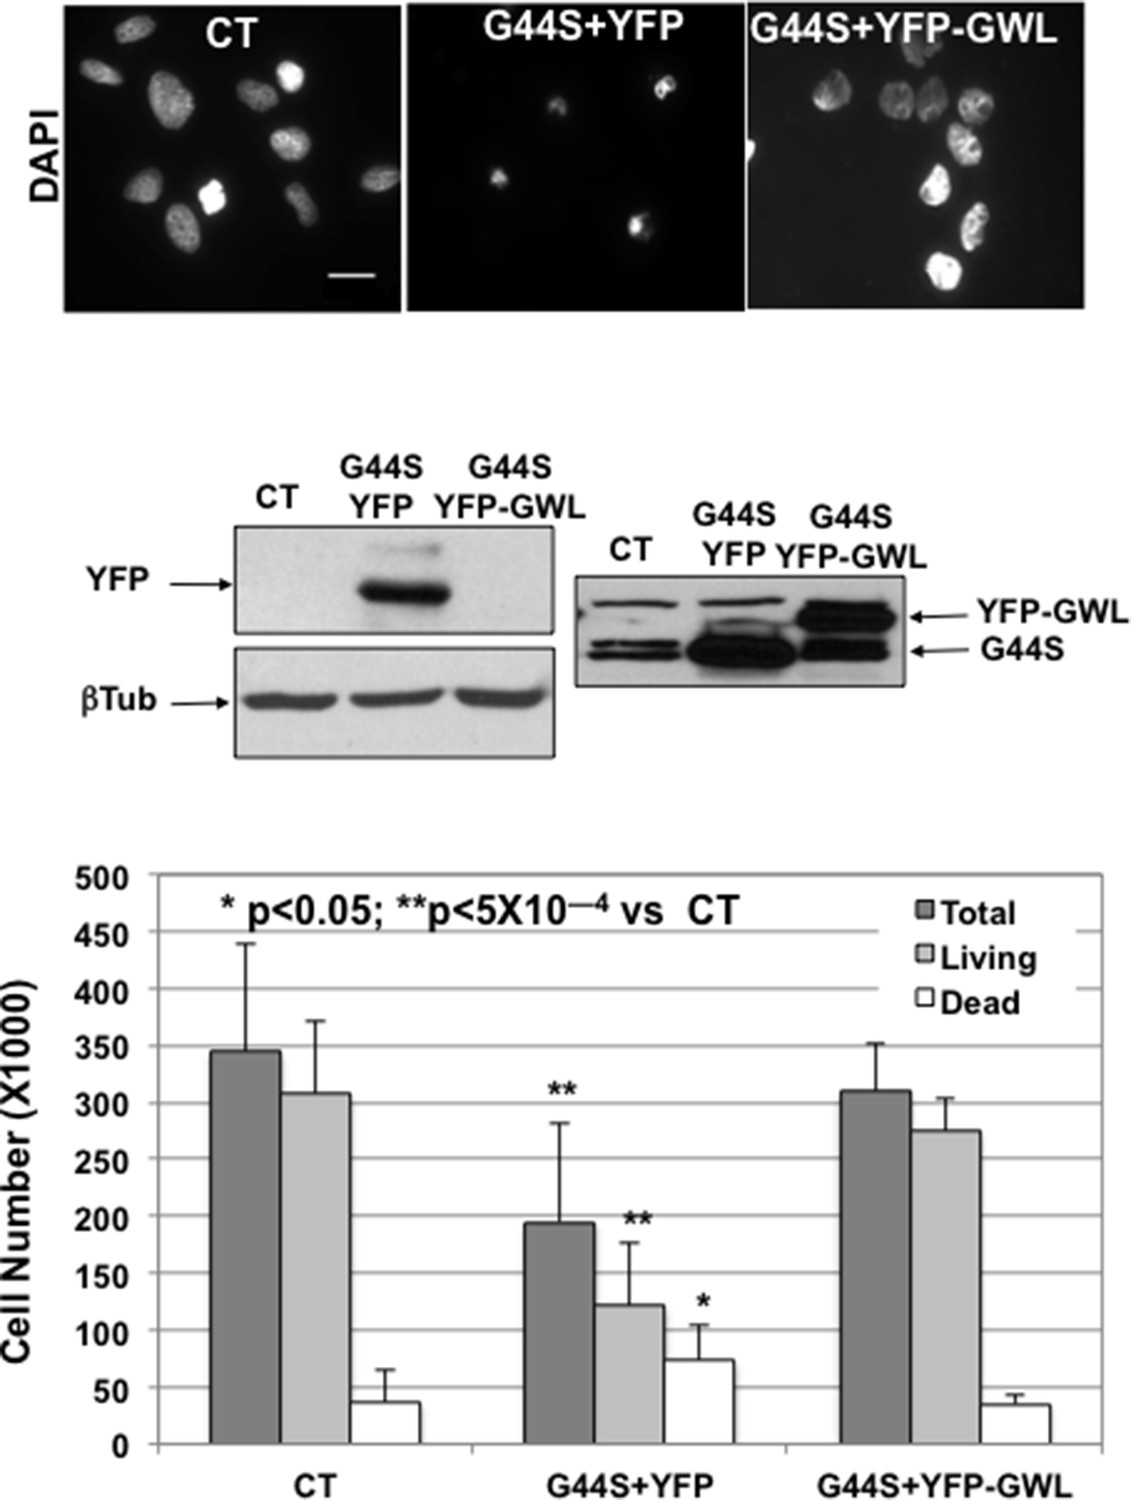
G44S kinase dead form of GWL in MCF10A cell lines could act as dominant-negative of endogenous GWL.
MCF10A cells were co-transfected with a pCS2-HA-G44S plasmid and with either an empty pCS2-YFP plasmid or a plasmid pCS2-YFP encoding the WT GWL kinase and the effect on cell viability was analysed by counting the number of total, dead, and living cells 24 hr after transfection. DAPI staining is also shown. The expression levels of the different GWL forms and of YFP analysed by Western blot are represented. Scale Bar 10 μm. GW, Greatwall.
Figure 1—figure supplement 2
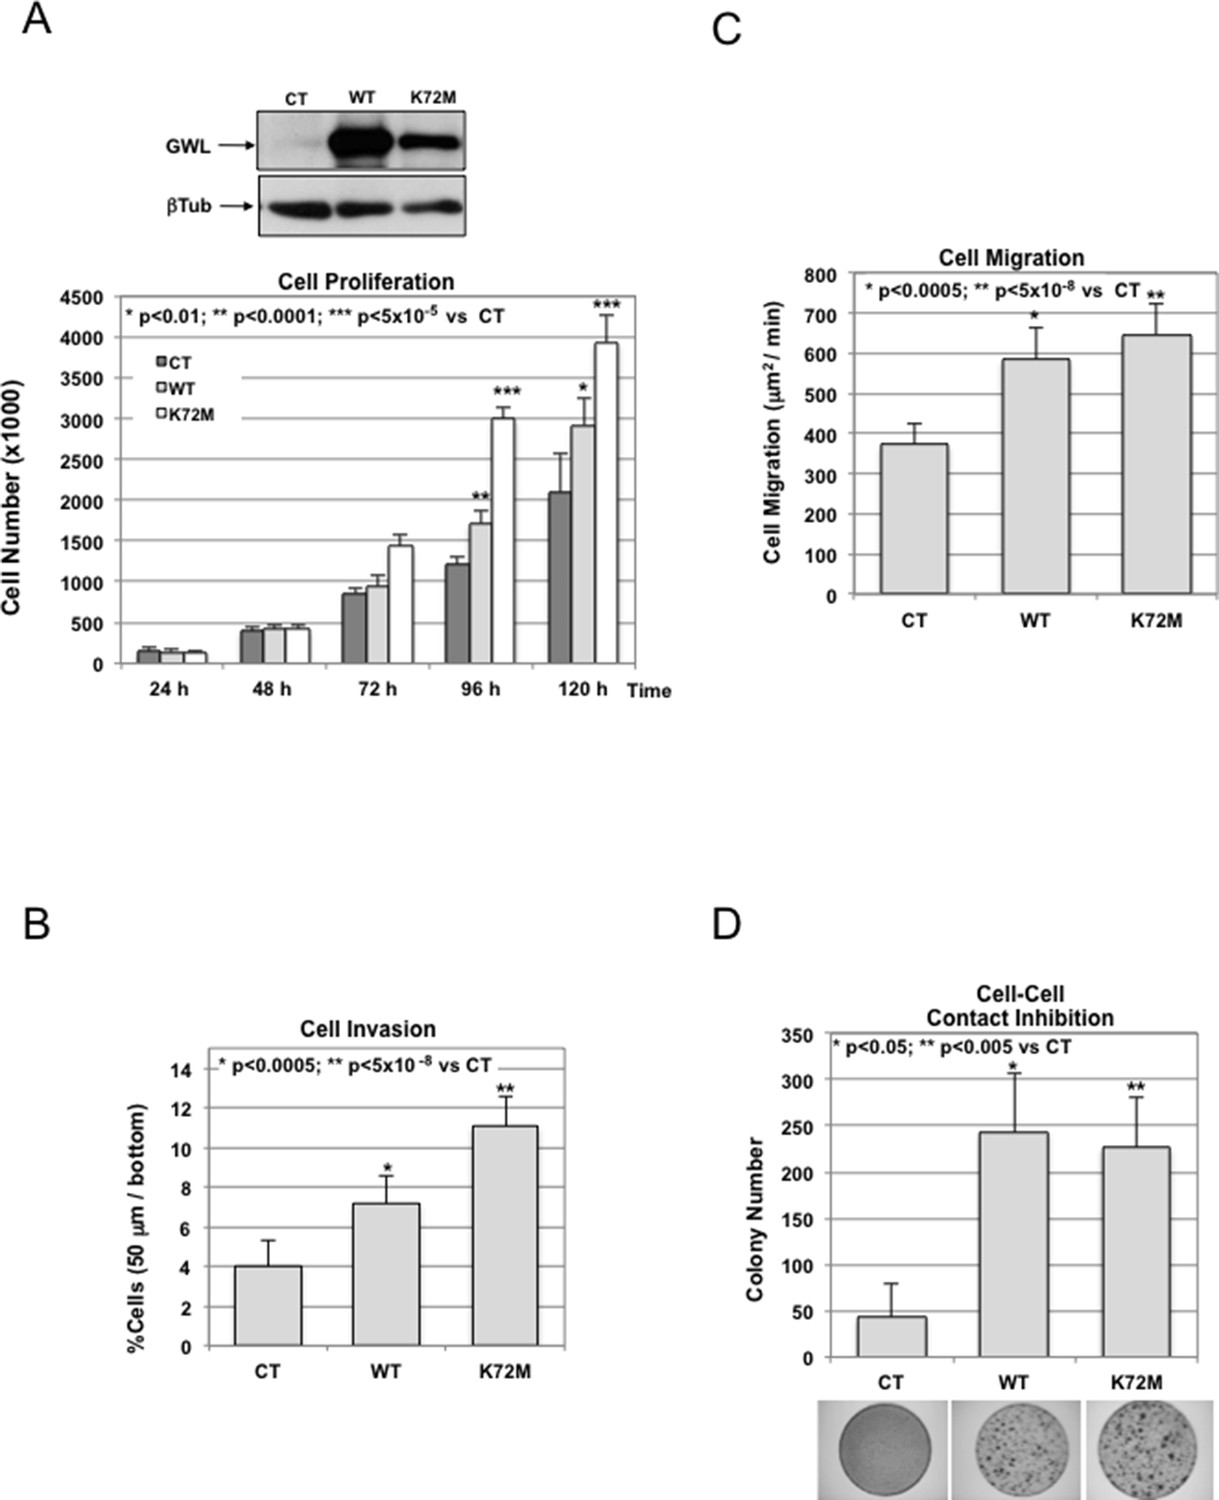
NIH3T3 cells were stably infected with either the pMXs empty vector (CT) or the GWL wild type (WT) or hyperactive mutant form (K72M).
These cell lines were assayed for cell proliferation (A), collagen I invasion (B), and cell migration (C). Cell—cell contact inhibition was also analysed by crystal violet staining, and the number of colonies for each cell line were represented (D). Results are shown as the mean of three different experiments+/- standard deviation (SD). Two-tailed unpaired Student t tests were performed to determine statistical relevance; significant p values are shown. GWL, Greatwall.
Figure 2 with 3 supplements
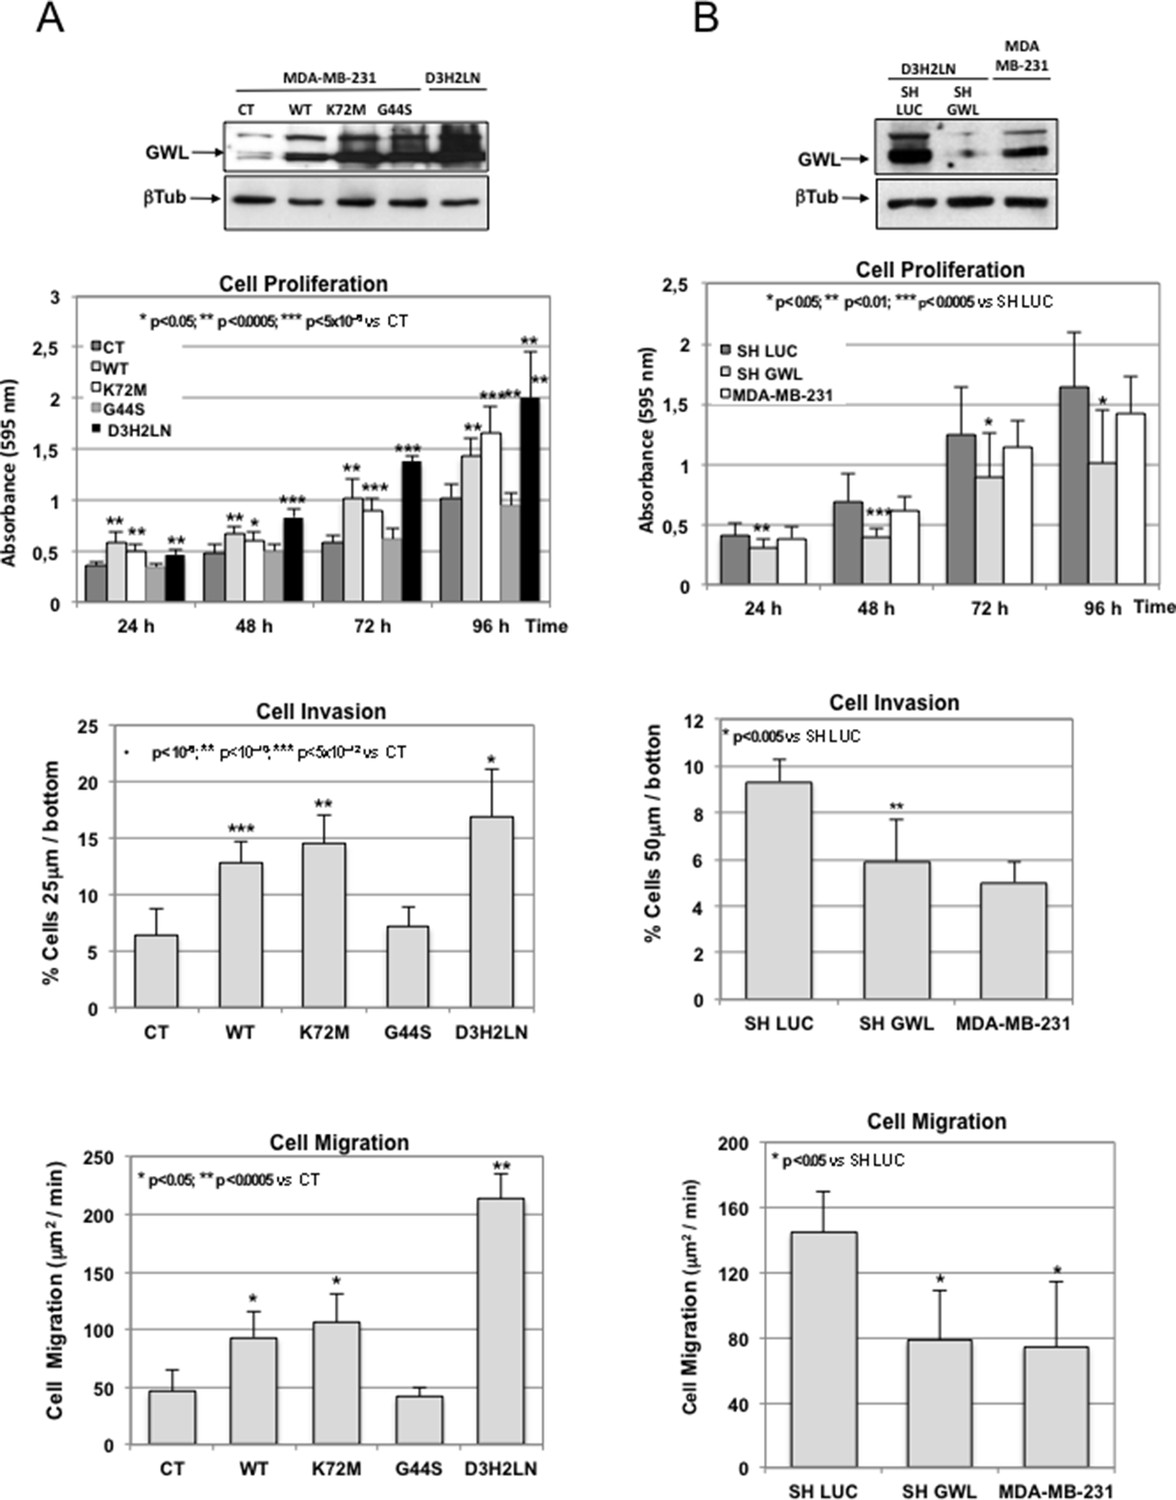
GWL overexpression is involved in the invasive behaviour of mammary tumour cell lines.
(A) MDA-MB-231 cells were infected with empty pMXs vector (CT) or with plasmids coding for the indicated GWL proteins. Cell proliferation, invasion, and migration were measured in these cells and in D3H2LN cells and represented as mean ± SD. Two-tailed unpaired Student’s t tests were performed to determine the statistical relevance; significant p values are shown. (B) D3H2LN cells were stably infected with control (SH LUC) or anti-GWL shRNAs. Cell proliferation, invasion, and migration were then measured in these cells, compared to those of MDA-MB-231 cells and represented as mean ± SD. Two-tailed unpaired Student’s t tests were performed to determine the statistical relevance; significant p values are shown. GWL,Greatwall; SD, standard deviation.
Figure 2—figure supplement 1
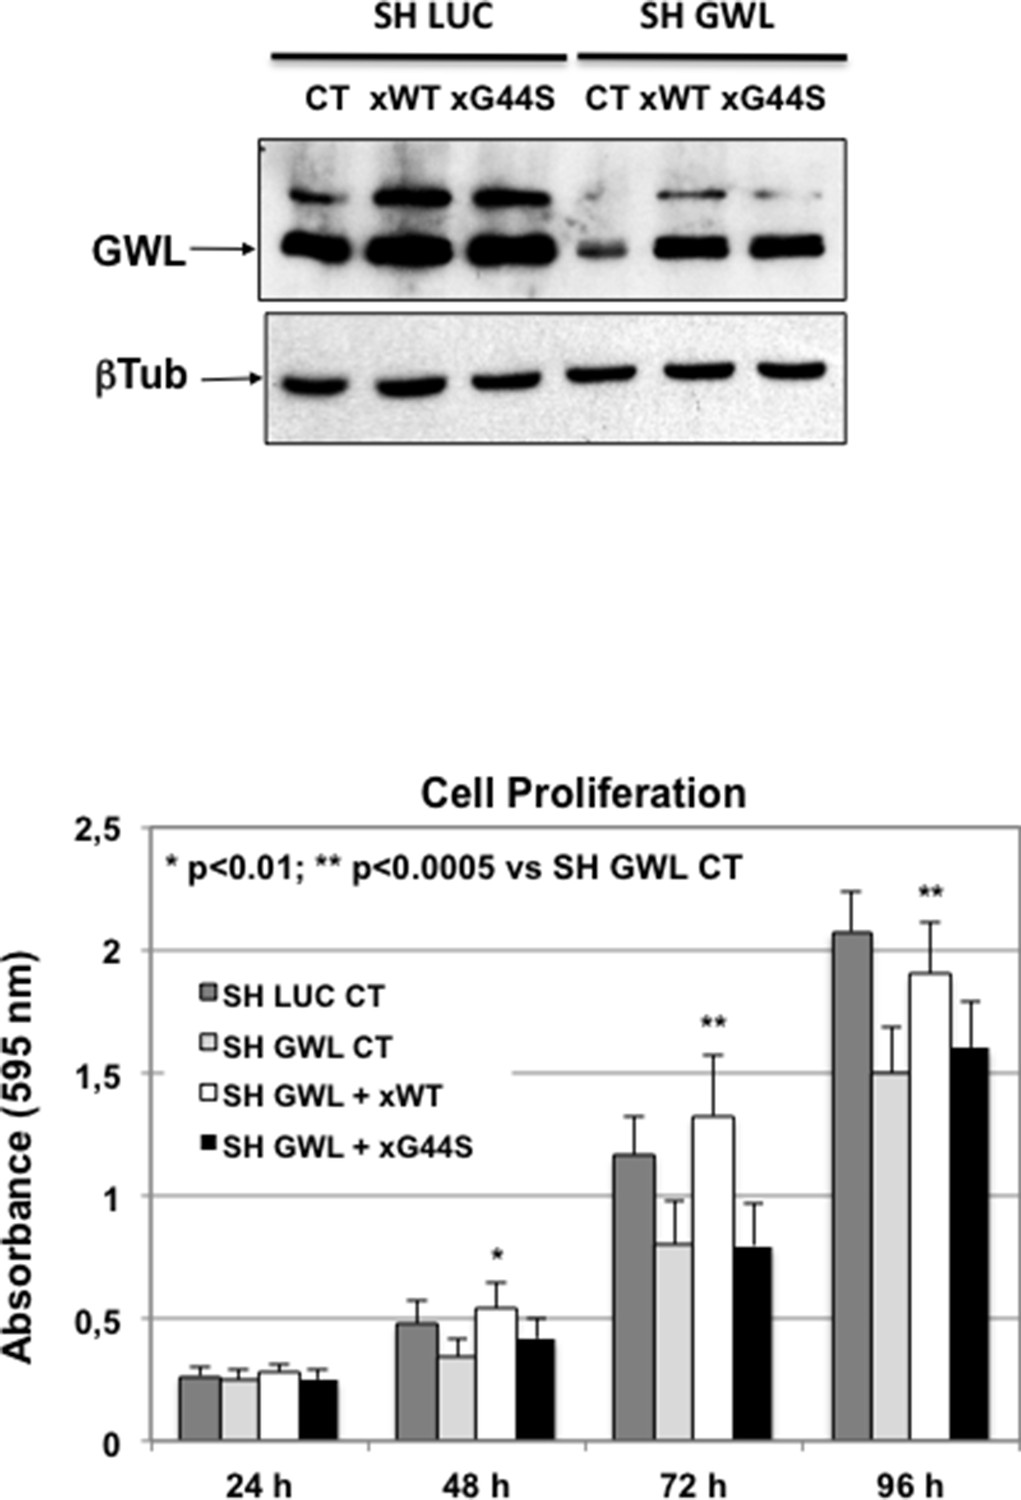
Decrease of oncogenic properties induced in D3H2LN cells by GWL shRNA was rescued by co-transfection with an shRNA-resistant WT GWL but not with the GWL kinase dead form.
D3H2LN SH LUC or SH GWL stable cell lines were transfected or not (CT) with the plasmids encoding an SH-resistant wild type (xWT) or kinase dead (xG44S) forms of Xenopus GWL and 24 hr later cell proliferation was measured at the indicated times. The levels of overexpressed xWT and xG44S are shown. Two-tailed unpaired Student’s t tests were performed to determine the statistical relevance; significant p values are shown. GWL, Greatwall.
Figure 2—figure supplement 2
GWL overexpression is involved in the invasive behaviour of colon tumour cell lines.
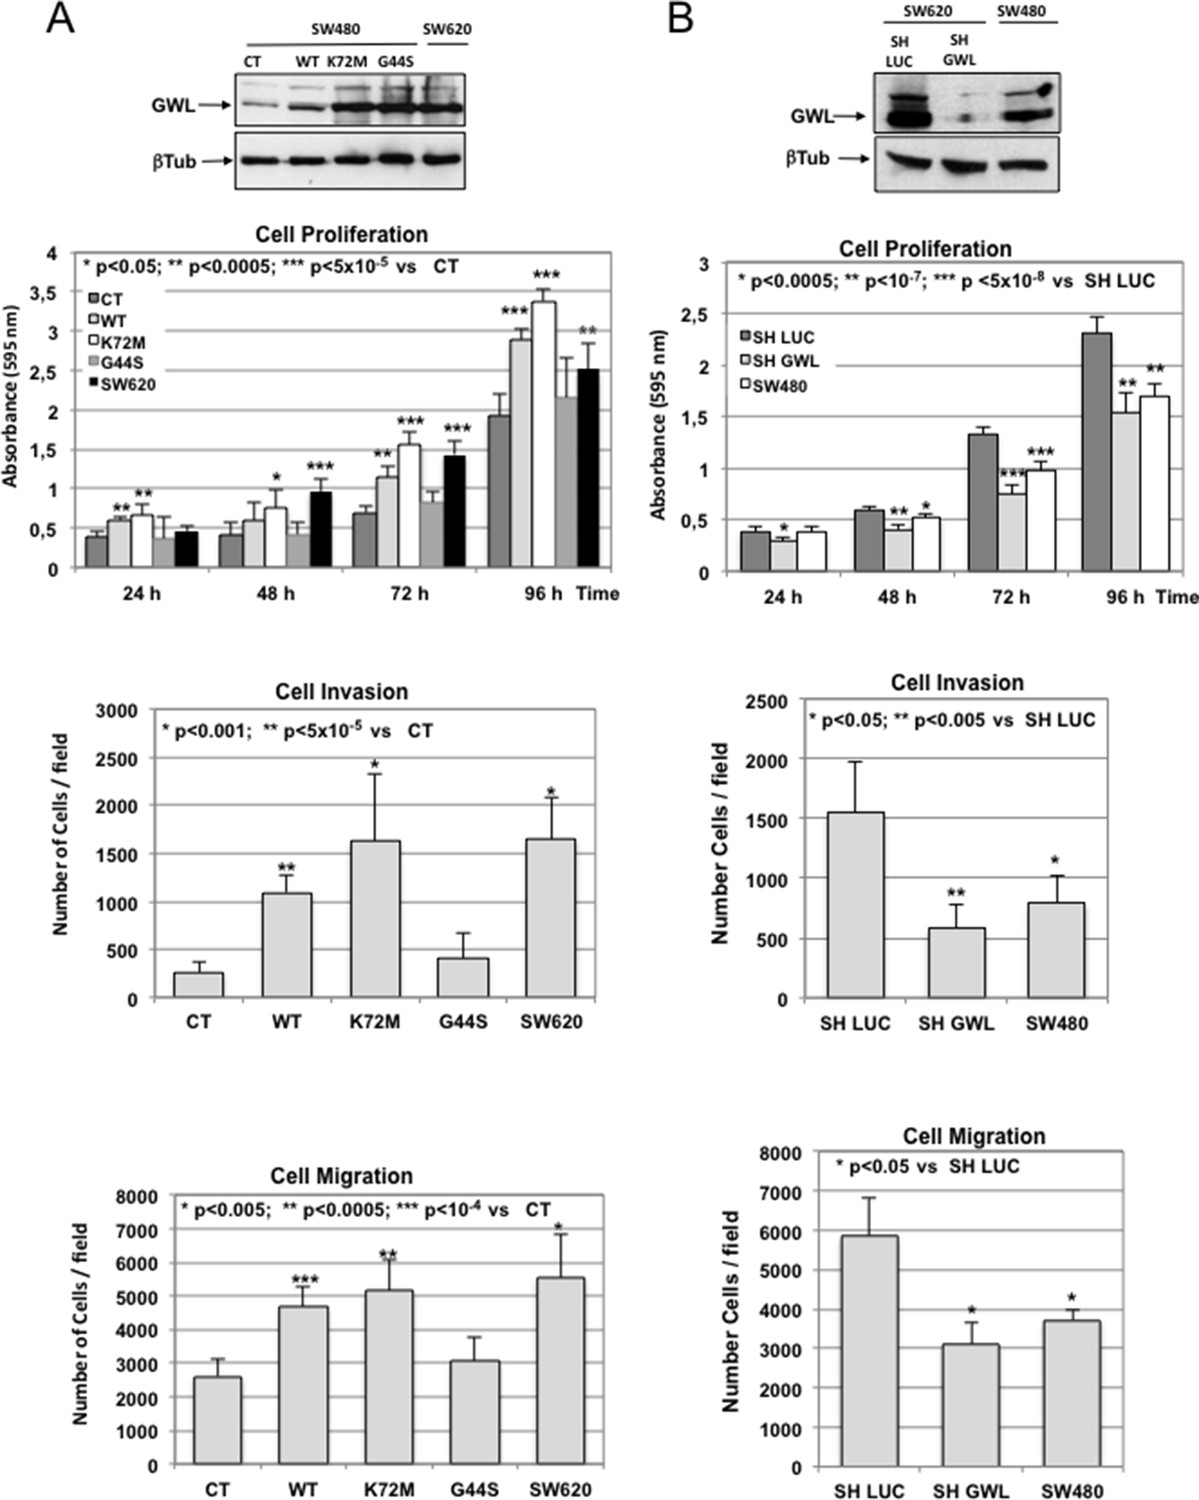
(A) SW480 cells were infected with empty pMXs vector (CT) or with plasmids coding for the indicated GWL proteins. Cell proliferation, invasion, and migration were measured in these cells and in SW620 cells and represented as mean ± SD. Two-tailed unpaired Student’s t tests were performed to determine the statistical relevance; significant p values are shown. (B) SW620 cells were stably infected with control (SH LUC) or anti-GWL shRNAs. Cell proliferation, invasion and migration were then measured in these cells, compared to those of SW480 cells and represented as mean ± SD. Two-tailed unpaired Student’s t tests were performed to determine the statistical relevance; significant p values are shown. GWL, Greatwall; SD, standard deviation.
Figure 2—figure supplement 3
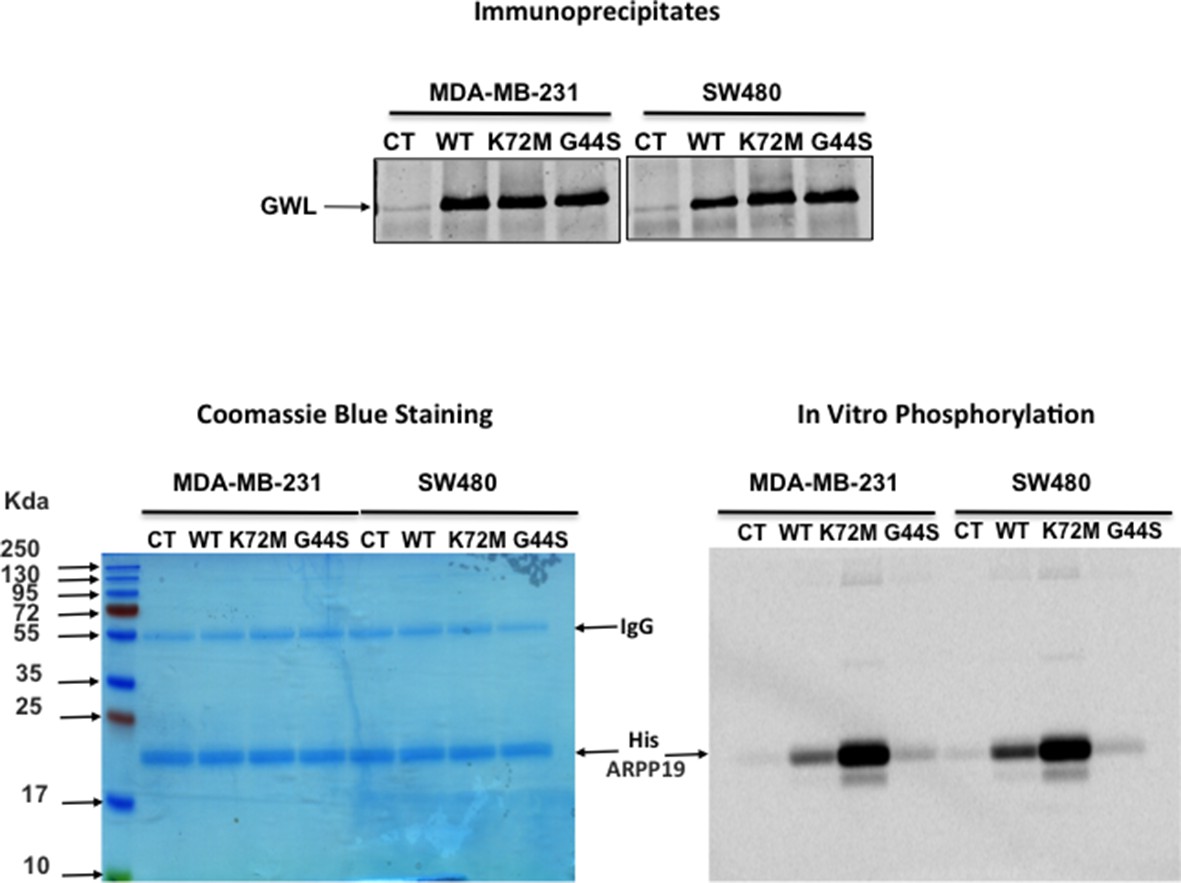
GWL activity is higher in WT and K72M GWL overexpressed cells than in control (CT) cells or in cells stably overexpressing G44S GWL.
GWL activity was measured by in vitro phosphorylation in the immunoprecipitates from MDA-MB-231 and SW480 CT cells or stably overexpressing a WT, a K72M GWL, or a G44S form using His-ARPP19 as a substrate. The levels of the endogenous and overexpressed GWL proteins are shown. GW, Greatwall; WT, wild type.
Figure 3 with 2 supplements
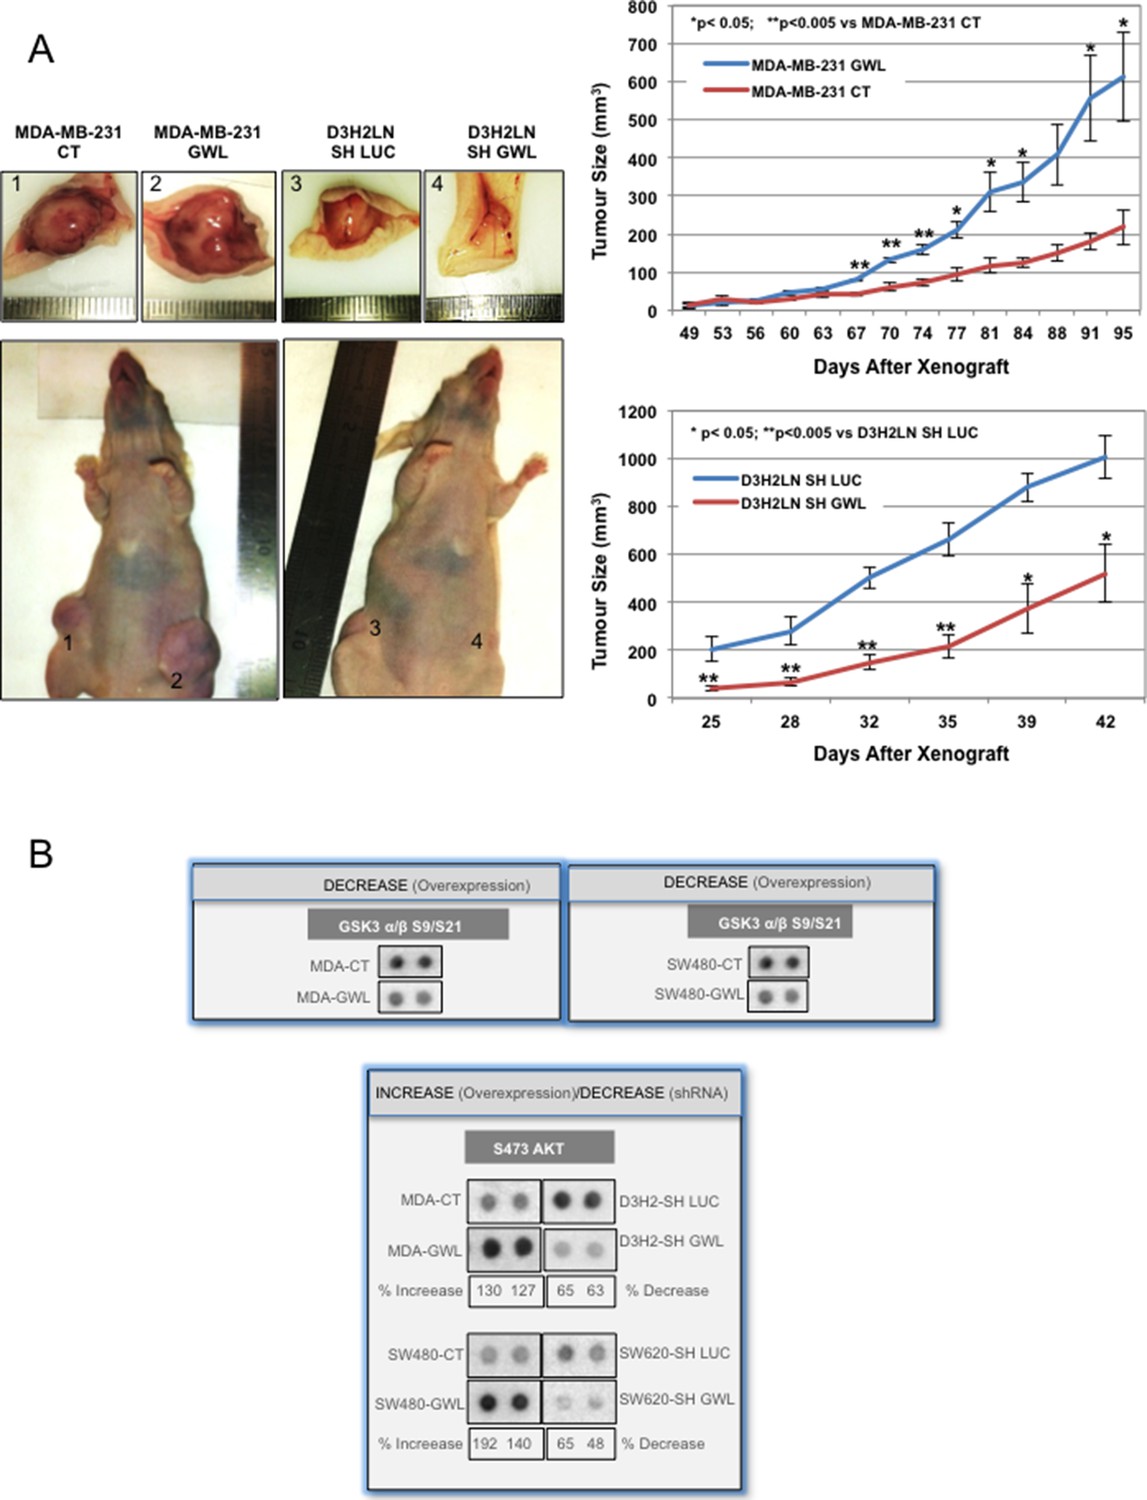
GWL overexpression promotes tumour growth in vivo and increases AKT phosphorylation on S473.
(A) Two representative animals with tumours induced by subcutaneous injection of MDA-MB-231 cells stably infected with the pMXs empty vector (CT) or this plasmid encoding wild type GWL (GWL) (left animal, tumours 1 and 2, respectively) or D3H2LN cells that stably express SH LUC or SH GWL (right animal, tumours 3 and 4, respectively). Photographs show animals and tumours at the end of the experiment. Tumour size (mean ± SEM) was measured at different time points after xenograft in both groups of animals (n=4). Two-tailed unpaired Student’s t tests were performed to determine the statistical relevance; significant p values are shown. (B) The indicated cell clones were lysed and equal amounts of total proteins were incubated with the human phospho-kinase array. GSK3 α/β phosphorylation at S9/S21 in the different cell lines are shown. AKT phosphorylation at S473 correlated with the GWL expression level in all tested cell lysates. Shown is the percent of increase of S473 phosphorylation signal calculated by densitometry using the ImageJ software in GWL overexpressing cells compared to CT or in GWL knockdown cells compared SH LUC cells. GWL, Greatwall.
Figure 3—figure supplement 1
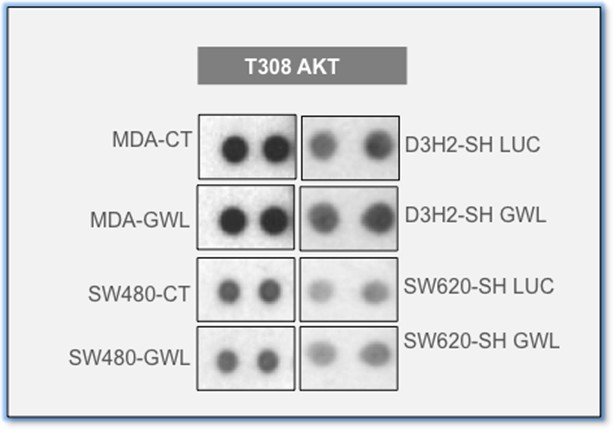
Phosphorylation of S308 of AKT is identical in the different GWL overexpressed and knockdown cells.
Extracts of control or MDA-MB-231 and SW480 overexpressing GWL and D3H2LN and SW620 submitted to GWL knockdown were assayed with the human phospho-kinase array. Phosphorylation T308 of AKT is shown. GWL, Greatwall.
Figure 3—figure supplement 2
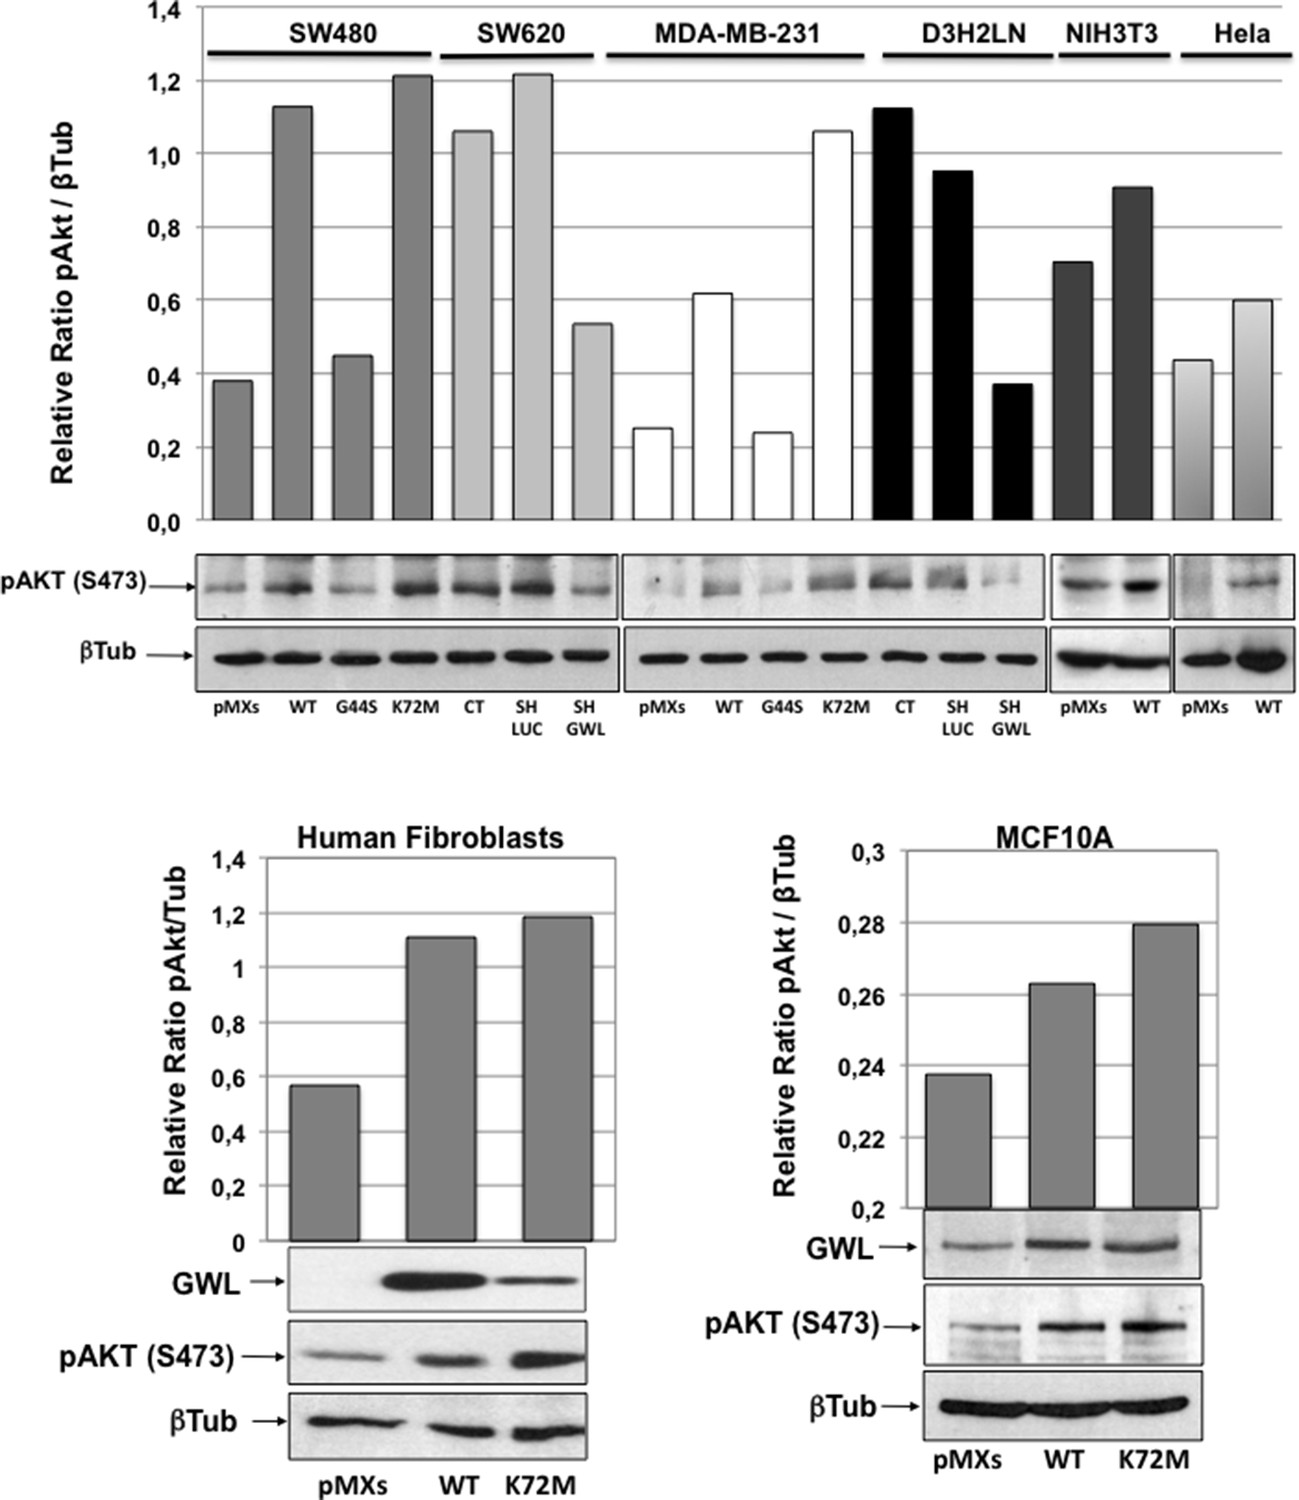
Akt phosphorylation of S473 is increased in all cell lines overexpressing active GWL.
The levels of β-tubulin and the phosphorylation on S473 of AKT were measured by Western blot in SW480, MDA-MB-231, NIH3T3, HeLa, MCF10A cells, and human fibroblasts overexpressing or not the indicated forms of GWL and in SW460 and D3H2LN cell lines knocked down of GWL or not. The pAKT S473 / β-tubulin ratios were calculated by densitometry using ImageJ software and represented as a Bar Graph. GWL: Greatwall.
Figure 4 with 4 supplements

GWL activation promotes increased cell proliferation, migration, and invasion through AKT phosphorylation at S473.
(A-C) MDA-MB-231 cells that stably overexpress GWL or not (CT) were plated and 4 hr later supplemented with a medium containing 1 μM of the AKT Inhibitor VIII. Medium containing AKT inhibitor was replaced every 2 days. Phosphorylation of AKT on S473 (24 hr after inhibitory treatment) and cell proliferation, invasion, and migration were analysed in these cells. (D) MCF10A cells that overexpress WT or K72M GWL were grown in the presence of 1 μM of the AKT Inhibitor VIII. As for (A–C) medium containing AKT inhibitor was replaced every 2 days. The capacity of these cells to grow in soft-agar was analysed by quantifying the number of colonies formed. Results are the mean ± SD of three different experiments. Two-tailed unpaired Student’s t tests were performed to determine the statistical relevance; significant p values are shown. Scale bars, 60 μm. GWL, Greatwall; SD, standard deviation.
Figure 4—figure supplement 1
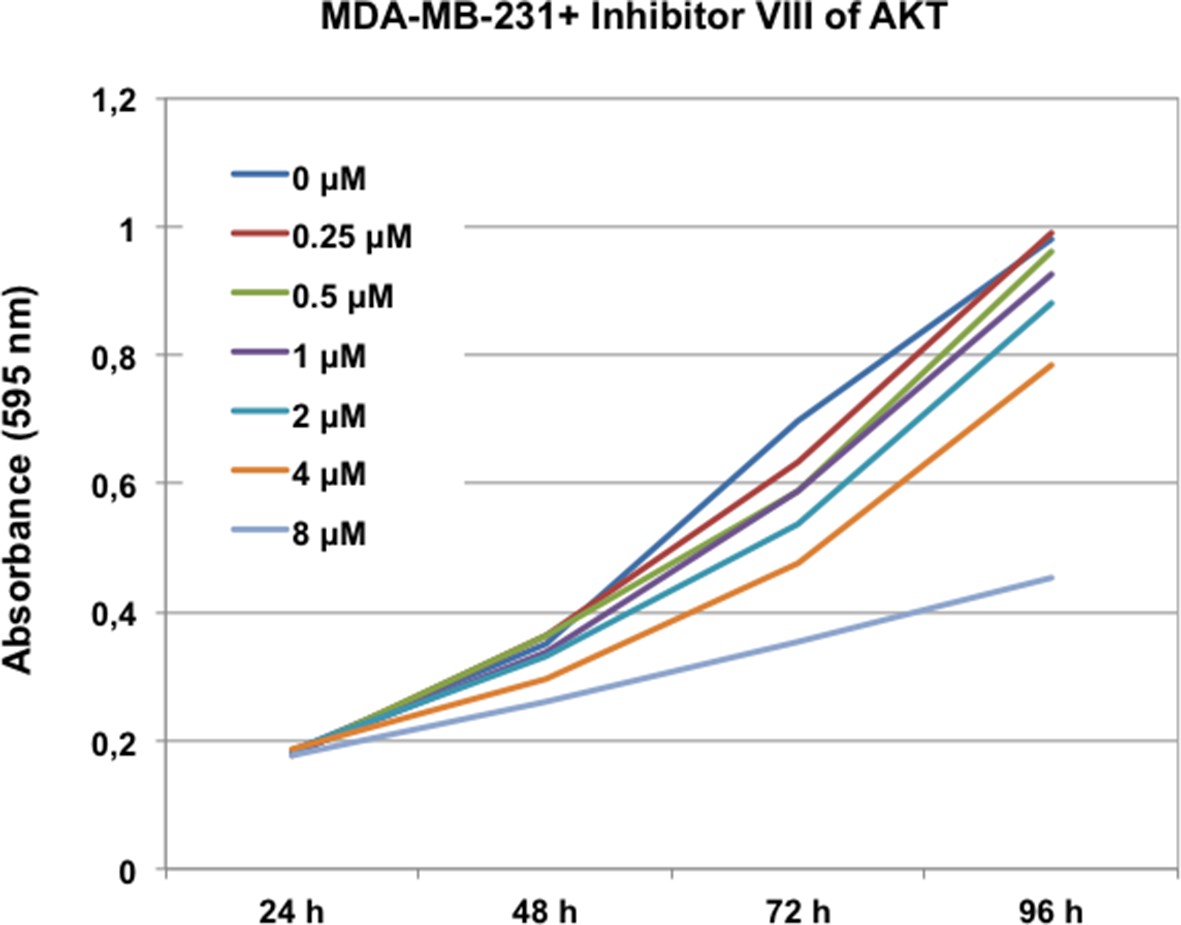
Inhibitors VIII dose response curves in MDA-MB-231. MDA-MB-231 cells were submitted to increasing doses of the AKT inhibitor VIII and cell proliferation was then measured at 24, 48, 72, and 96 hr. AKT inhibitor was replaced at 48 hr after addition.
https://doi.org/10.7554/eLife.10115.014
Figure 4—figure supplement 2
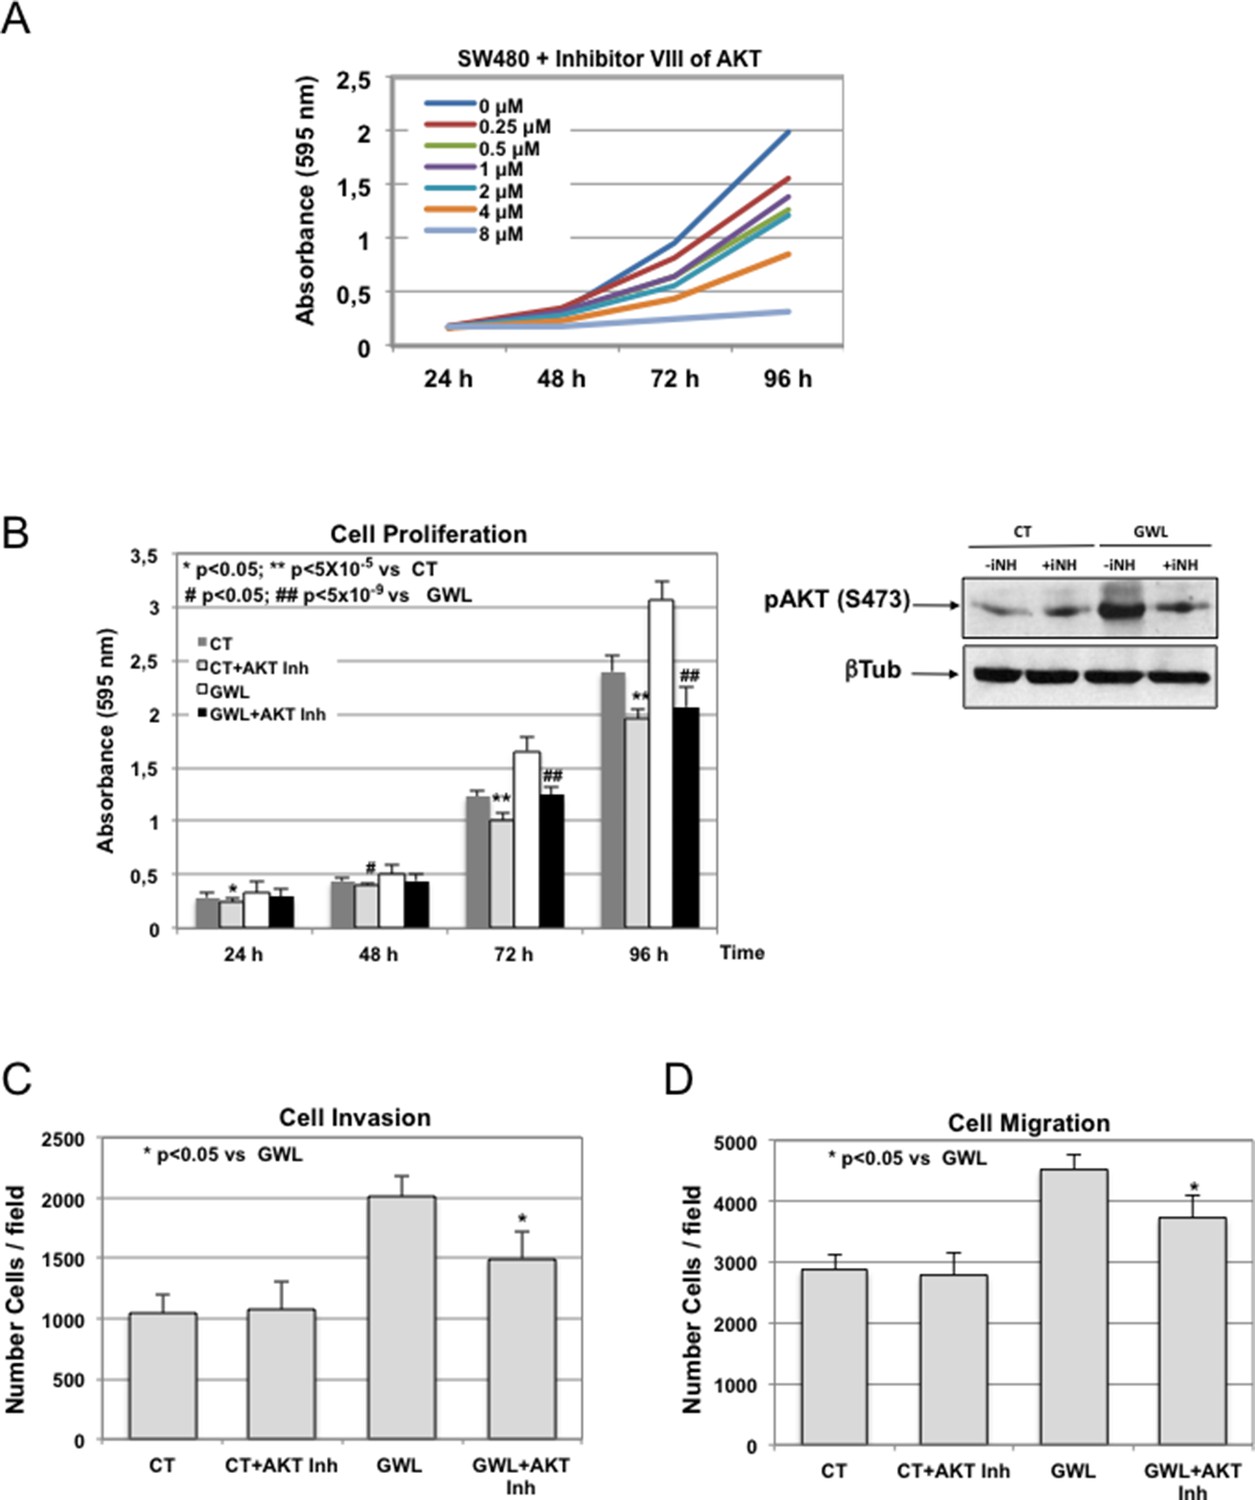
Inhibitors VIII dose response curves in SW480 control cells and effect of 1 μM of the AKT Inhibitor VIII in cell proliferation, invasion and migration.
(A) SW480 were submitted to increasing doses of the AKT inhibitor VIII and cell proliferation was then measured at 24, 48, 72 and 96 hr. Inhibitor was replaced at 48 hr after addition. (B—D) SW480 cells that stably overexpress GWL or not (CT) were continuously grown in the presence of 1 μM of the AKT Inhibitor VIII and phosphorylation of AKT on S473 (24 hr after inhibitor treatment) as well as cell proliferation (C), invasion (D), and migration (E) were analysed.
Figure 4—figure supplement 3
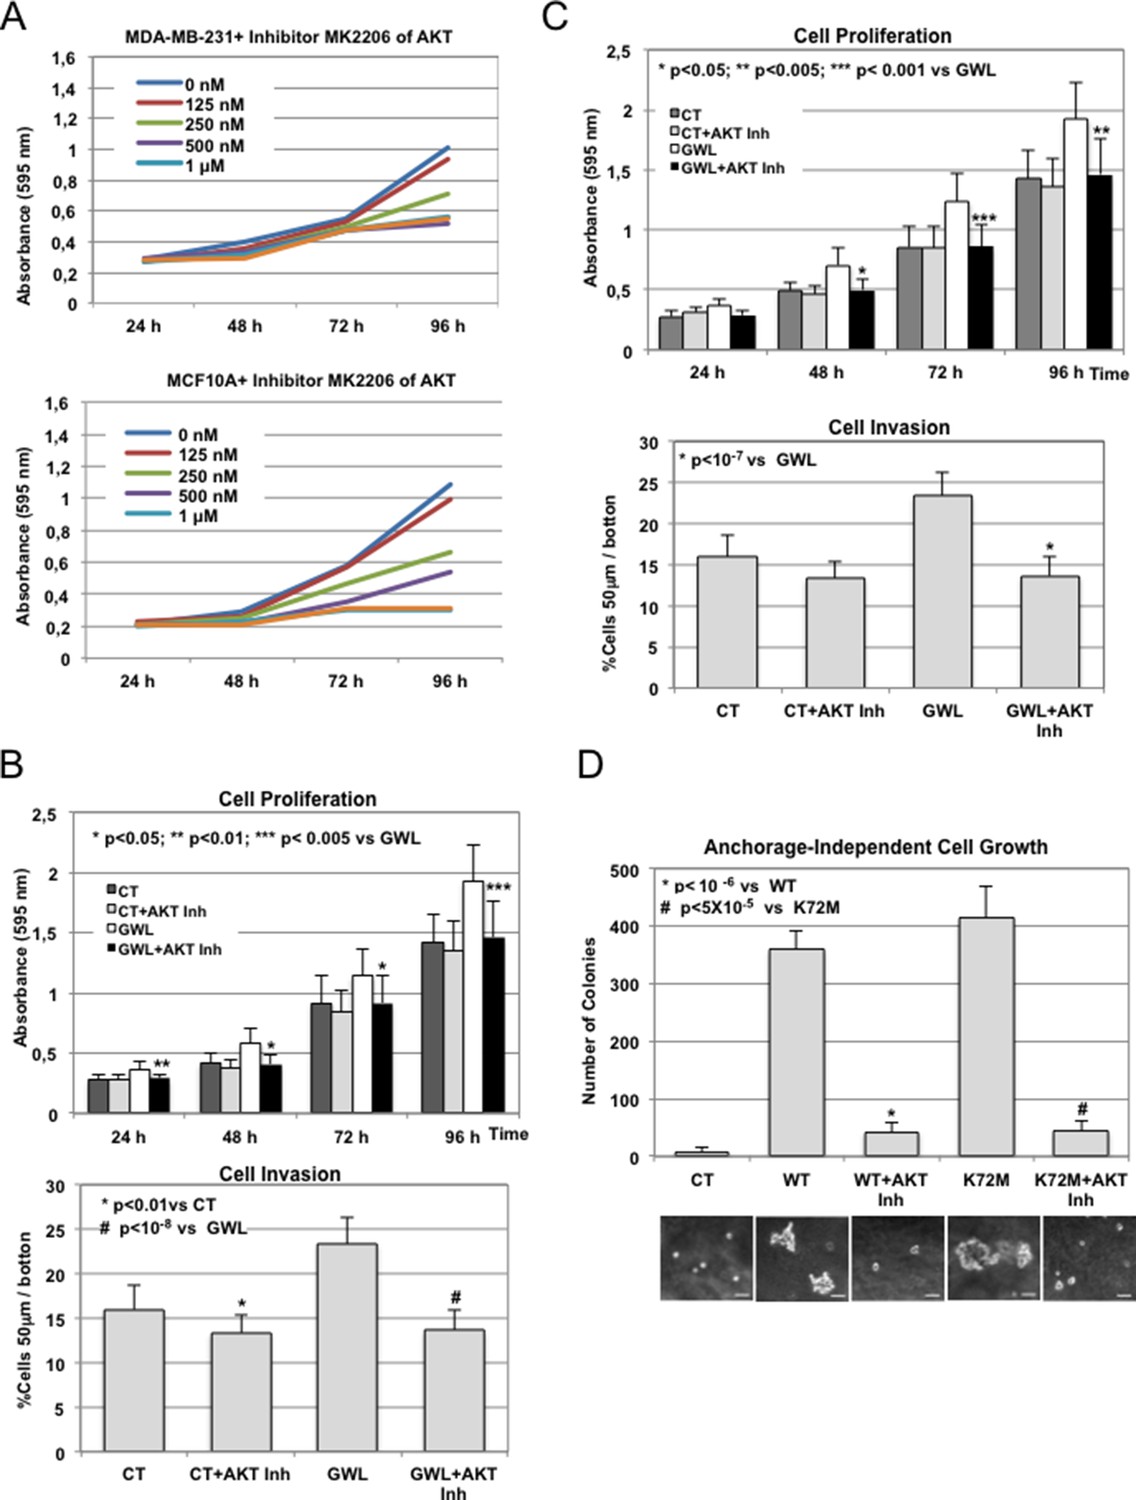
The inhibitor of AKT, MK2206, like Inhibitor VIII, rescues GWL phenotype.
(A) MDA-MB-231 and MCF10A cells were submitted to increasing doses of the AKT inhibitor MK2206 and cell proliferation was then measured at 24, 48, 72, and 96 hr. (B) MCF10A cells stably overexpressing or not GWL were continuously treated with 125 nM MK2206 inhibitor, and cell proliferation and invasion were analysed. (C) As for (B) except that MDA-MB-231 instead of MCF10A cells were used. (D) MCF10A cells were treated as for (B) and the colonies grown in soft-agar were counted in the presence and absence of MK2206 inhibitor and represented as bar graphs. AKT inhibitor was replaced each 2 days. Scale bars, 60 μm. Two-tailed unpaired Student’s t tests were performed to determine the statistical relevance; significant p values are shown. GWL, Greatwall.
Figure 4—figure supplement 4
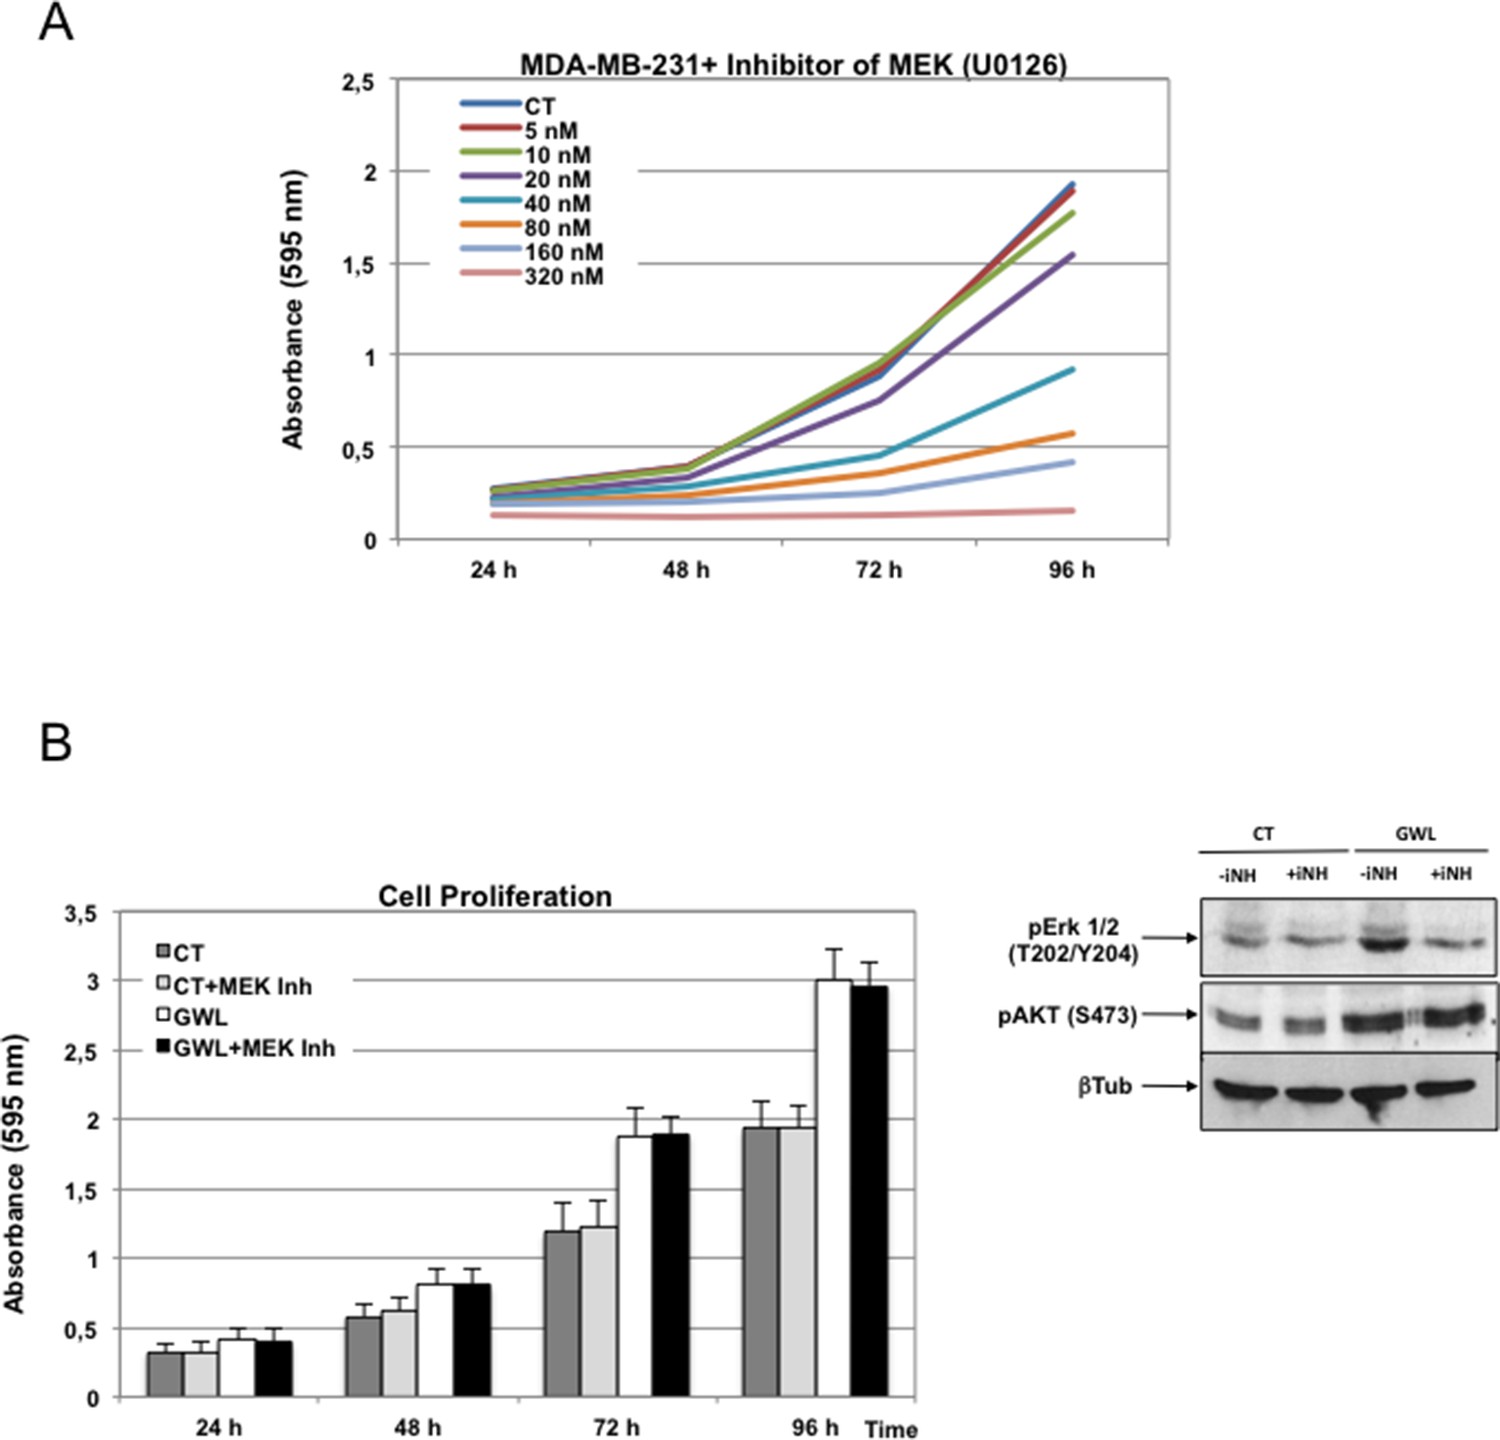
The MEK inhibitor U0126 has no effect in GWL overexpressed MDA-MB-231 cell proliferation.
(A) MDA-MB-231 cells were submitted to increasing doses of the MEK inhibitor U0126 and cell proliferation was then measured at 24, 48, 72, and 96 hr. (B) MDA-MB-231 cells that stably overexpress GWL or not (CT) were continuously grown in the presence of 10 nM U0126. Inhibition of MEK was confirmed by decreased phosphorylation of Erk1/2 on T202/Y204. Phosphorylation of AKT on S473 and cell proliferation were analysed. Two-tailed unpaired Student’s t tests were performed to determine the statistical relevance; no significant differences were observed. GWL,Greatwall.
Figure 5 with 1 supplement

AKT phosphorylation on S473 induced by GWL overexpression is neither due to increased mTORC2 activity nor to decreased PP2AB55 activity through ARPP19/ENSA phosphorylation.
(A) Control or GWL-overexpressing MDA-MB-231 cells were stably infected with control (SH GFP) or Rictor shRNAs (SH Rictor) and the levels of Rictor and AKT phosphorylation at S473 were determined by Western blotting. The Rictor / β-tubulin ratio and AKT phosphorylation at S473 / β-tubulin ratio were calculated by densitometry using the ImageJ software. Cell proliferation in these cells was also measured. (B) MCF10A cells were infected with viruses encoding the indicated proteins and the expression levels of ARPP19, ENSA, β-tubulin, and AKT phosphorylated at S473 were determined. Cell proliferation in the different cell lines was also assessed. Results are the mean ± SD of three different experiments. Two-tailed unpaired Student’s t tests were performed to determine the statistical relevance; significant p values are shown. (C) MDA-MB-231 cells that stably express GWL (GWL) or not (CT) were transfected with B55 or B56 and the levels of these two proteins and of phosphorylated AKT at S473 were analysed by Western blotting. Cell proliferation was then measured and results shown in a bar graph (mean ± SD). Two-tailed unpaired Student’s t tests were performed to determine the statistical relevance; significant p values are shown. GWL, Greatwall; SD, standard deviation.
Figure 5—figure supplement 1
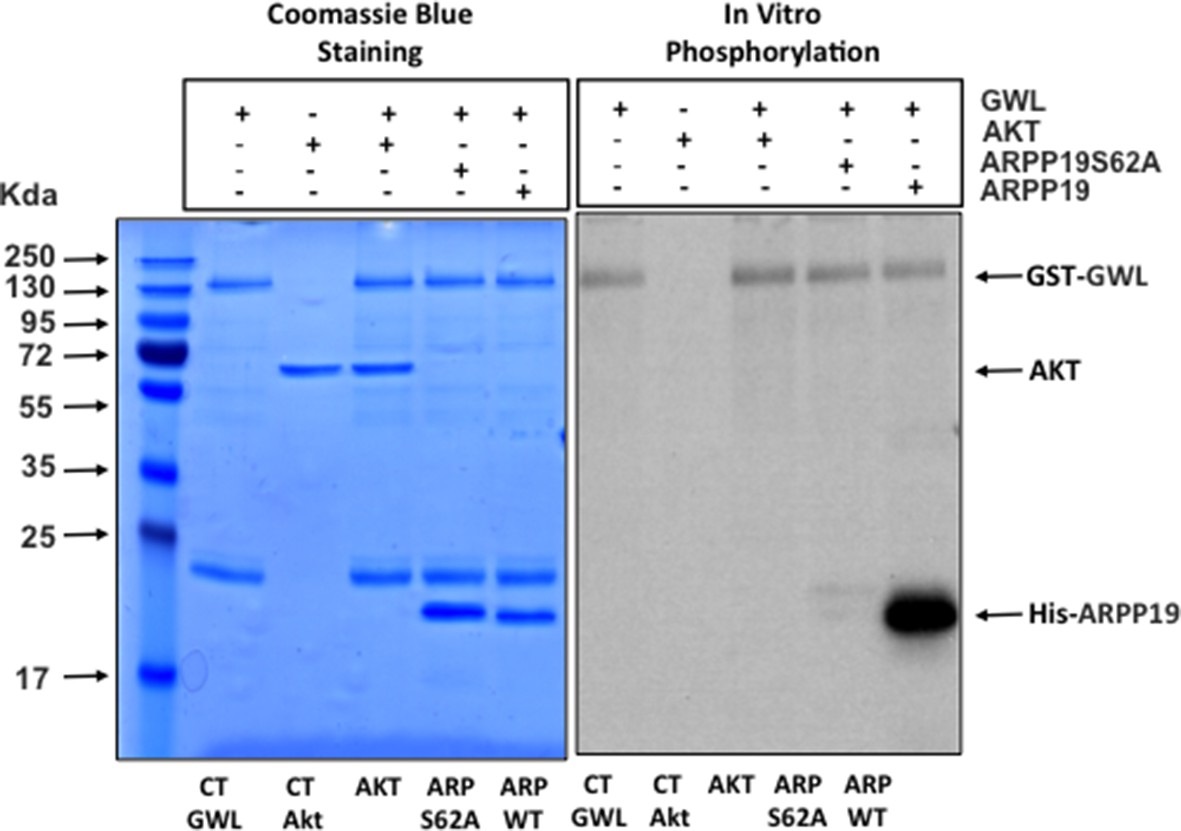
GWL does not directly phosphorylate AKT.
In vitro phosphorylation assay of AKT and ARPP19 as a control by recombinant GWL kinase. GWL, Greatwall.
Figure 6 with 1 supplement
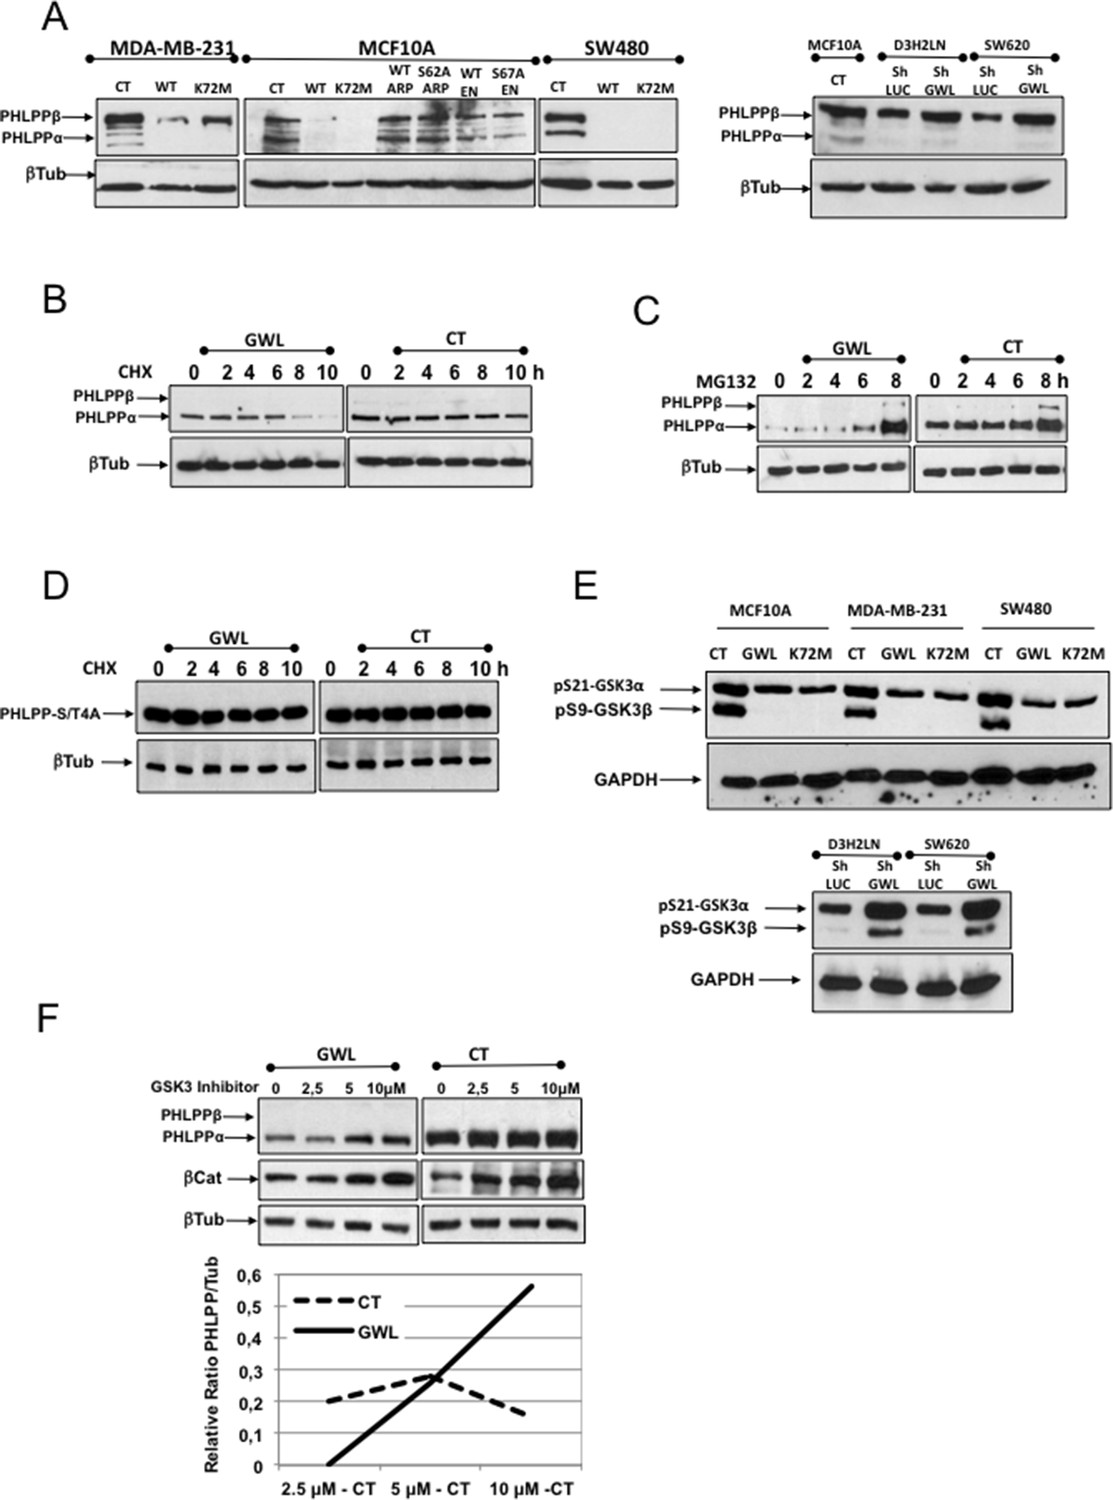
AKT phosphorylation at S473 in GWL-overexpressing cells is due to increased ubiquitin/proteasome-dependent degradation of PHLPP.
(A) The levels of endogenous PHLPP and β-tubulin (loading control) were assessed by Western blotting in the indicated cell lines overexpressing GWL (WT and K72M) or not (CT) or the WT or mutant forms of ARPP19 or ENSA and in D3H2LN and SW620 cells treated with a control or a GWL shRNA. (B) MCF10A cells that overexpress GWL or the empty vector pMXs (CT) were transiently transfected with PHLPP and 24 hr later supplemented with 40 μg/ml of cycloheximide (CHX) and recovered at 0, 2, 4, 6, 8, or 10 hr after CHX treatment to check PHLPP levels by Western blotting using anti-PHLPP antibodies. (C) As for (B) except that the proteasome inhibitor MG132 (25 μM) instead of CHX was used. (D) MCF10A cells overexpressing (GWL) or not (CT) GWL were transiently transfected with the PHLPP-S/T4A mutant. After 24 hr, cells were supplemented with CHX (40 μg/ml) and the levels of PHLPP-S4A measured at 0, 2, 4, 6, 8, or 10 hr after CHX addition by Western blot by using anti-PHLPP antibodies. (E) Phosphorylation of the inhibitory sites S21 (GSK3α) and S9 (GSK3β) was analysed by Western blotting in control and MCF10A, MDA-MB-231, and SW480 cells that overexpress WT or K72M GWL or not (CT) and in D3H2LN and SW620 treated with a control (LUC) or a GWL shRNA. (F) MCF10A cells that stably overexpress GWL or not (CT) were transiently transfected with a plasmid-encoding PHLPP and 24 hr later incubated with 2.5, 5, or 10 μM of the GSK3 inhibitor SB216763 (SIGMA) for 5 hr. Samples were then recovered to measure PHLPP, βCatenin, and β-tubulin levels by Western blotting. Represented are the differences between the PHLPP/β-tubulin ratios of non-treated (CT) and inhibitor-treated cells (at the different concentrations).
Figure 6—figure supplement 1
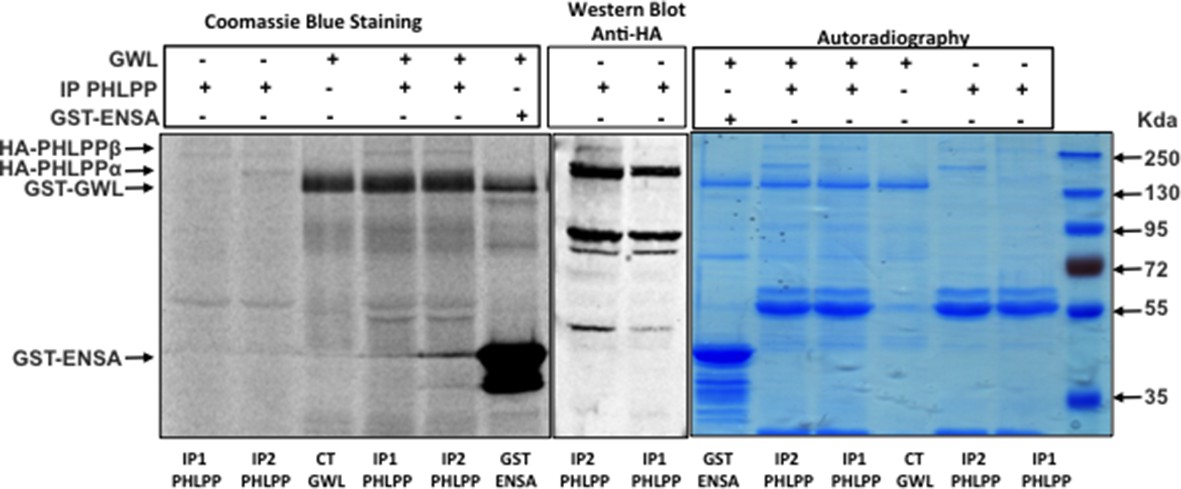
GWL does not directly phosphorylate PHLPP.
In vitro phosphorylation assay of PHLPP and GST-ENSA as a control by recombinant GWL kinase. GWL, Greatwall.
Figure 7 with 1 supplement
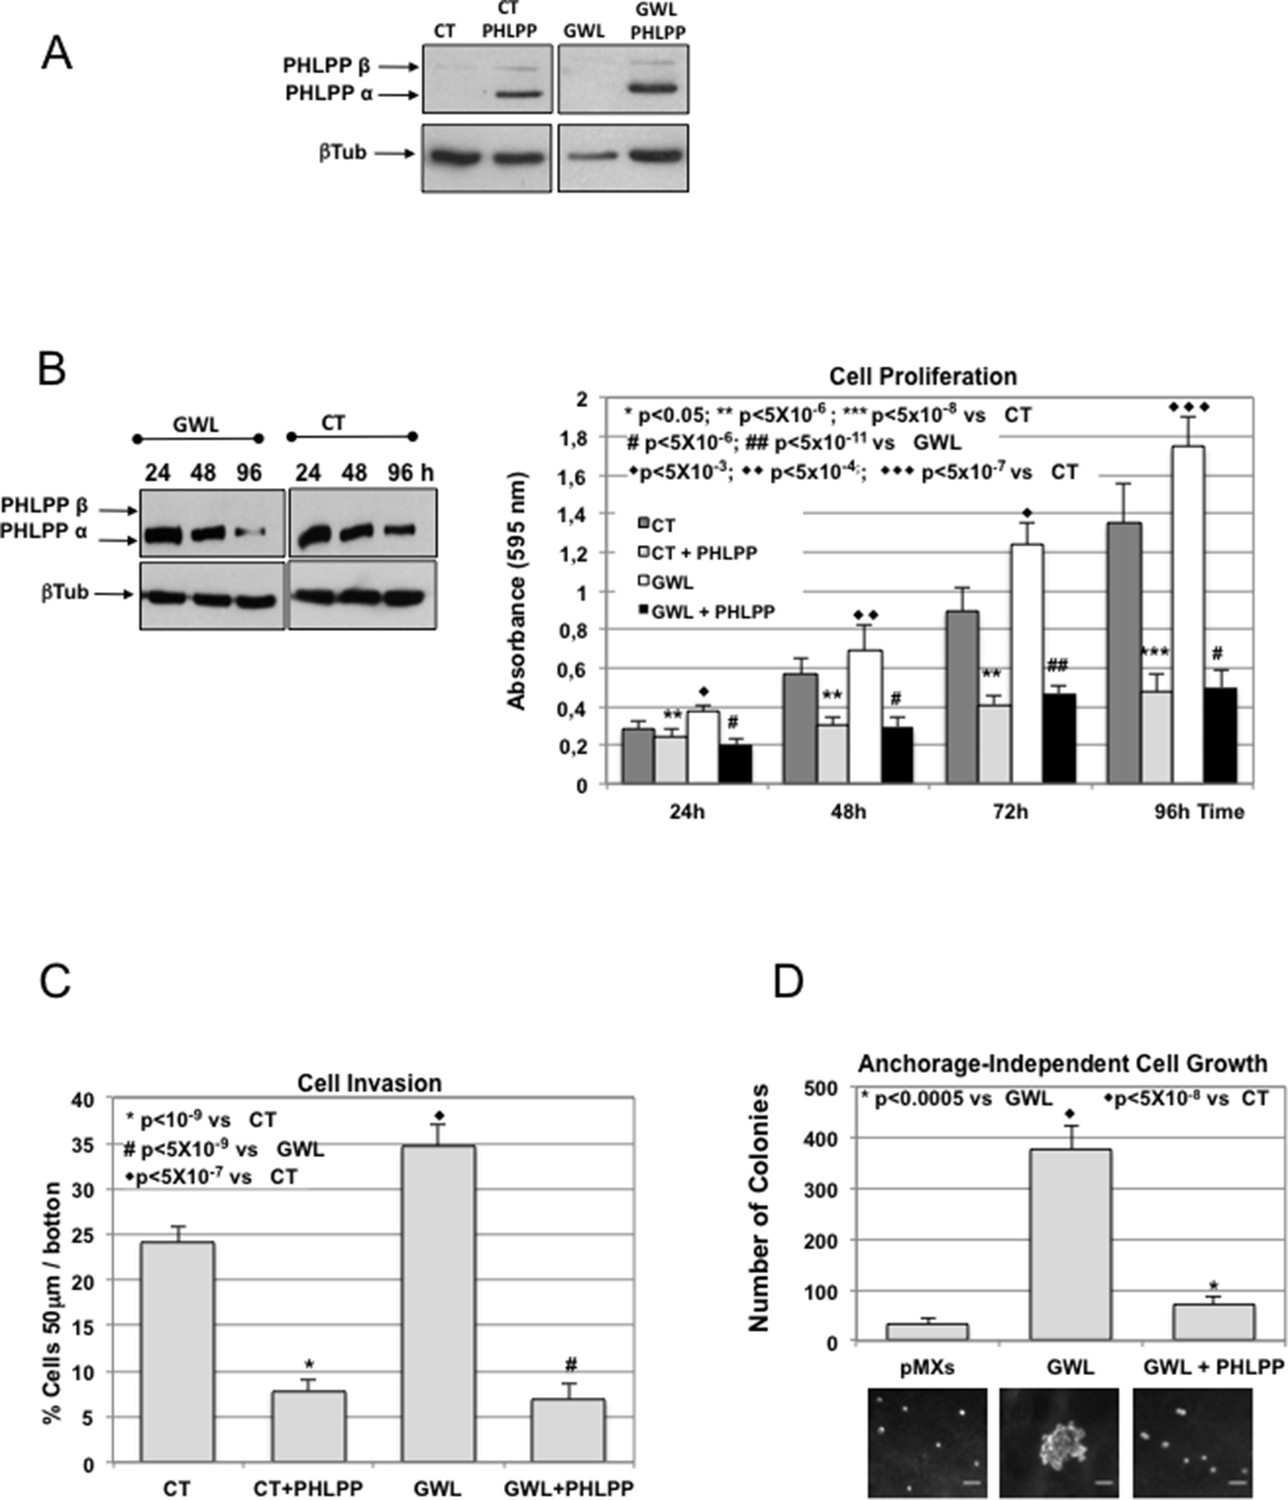
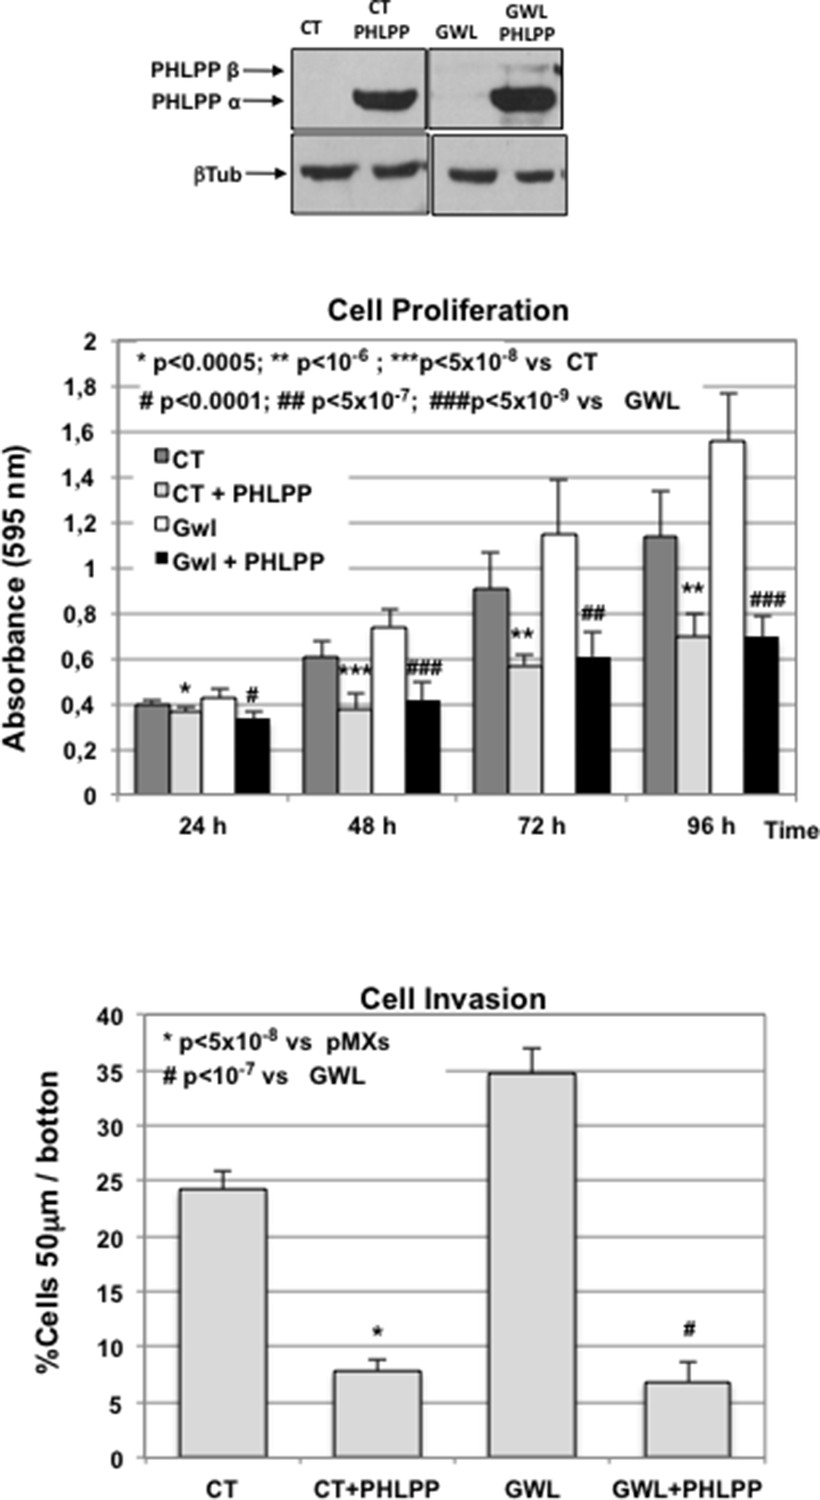
The oncogenic phenotype induced by GWL overexpression is rescued by the ectopic overexpression of PHLPP.
(A) MCF10A cells that stably express or not GWL were transfected with a plasmid encoding PHLPP, and 24 hr later, the levels of this protein were measured and compared to CT cells. (B) 24 hr after transfection cells in (A) were seeded and cell proliferation was measured 24, 48, 72, and 96 hr later. The levels of PHLPP in these cells were measured at 24, 48, and 96 hr later. Results are shown in a bar graph as the mean ± SD of three different experiments. Two-tailed unpaired Student’s t tests were performed to determine the statistical relevance; significant p values. (C,D) Cell invasion (C) and anchorage-independent cell growth (D) were measured in cells transfected in (A). Values were represented as the mean ± SD of three different experiments. Two-tailed unpaired Student’s t tests were performed to determine the statistical relevance; significant p values are shown. Scale bars, 60 μm. CT, control; GWL, Greatwall; SD, standard deviation.
Figure 7—figure supplement 1
Ectopic overexpression of PHLPP rescues GWL-induced phenotype in MDA-MB-231 cells.
Cell proliferation and invasion were measured in CT or GWL overexpressed MDA-MB-231 cells transiently transfected with a plasmid coding for PHLPP. PHLPP and β-tubulin levels in the indicated MDA-MB-231 stable cell lines were analysed by Western blot. Values were represented as the mean ± SD of three different experiments. Two-tailed unpaired Student’s t tests were performed to determine the statistical relevance; significant p values are shown. CT, control; GWL, Greatwall; SD, standard deviation.
Figure 8

GWL overexpression is a common feature in transformed cell lines and in colorectal cancer.
(A) GWL level in the indicated cell lines was assessed by Western blot analysis (lower panels) and the GWL / β-tubulin ratios shown in a bar graph (upper panel). (B) The expression levels of the GWL kinase and β-tubulin in crude extracts prepared from 13 sets of matched non-tumour (NT) and tumour (TT) samples from patients with stage IV primary colorectal adenocarcinomas were measured by Western blotting. (C) Representative images (left panels) and corresponding quantitative analysis (right panels) of GWL expression (green) in normal tissue (NT) and matching tumour (TT) after immunofluorescence staining of a colorectal TMA. The blue colour corresponds to DAPI staining. (D) Quantification of GWL expression in the NT and TT samples of (C). The median fluorescence intensity of the GWL signal was determined in the NT and TT samples of each patient and used to construct a box and whisker plot. GWL mean fluorescence intensity in each tissue is shown in the table (****p<0.0001 by paired t-test). (E) GWL median fluorescence intensity in the NT and corresponding TT of (C) according to the tumour stage (stage I/II: n=28, stage III: n=17 and stage IV: n=28 patients). ***p<0.001; *p<0.05 (paired t-test). (F) The fold change in GWL fluorescence intensity was calculated as the TT fluorescence intensity/NT fluorescence intensity ratio for each patient. The grey area represents the minimum threshold (20% increase/decrease) for considering GWL expression in TT as up-regulated or down-regulated compared to TT.
Figure 9
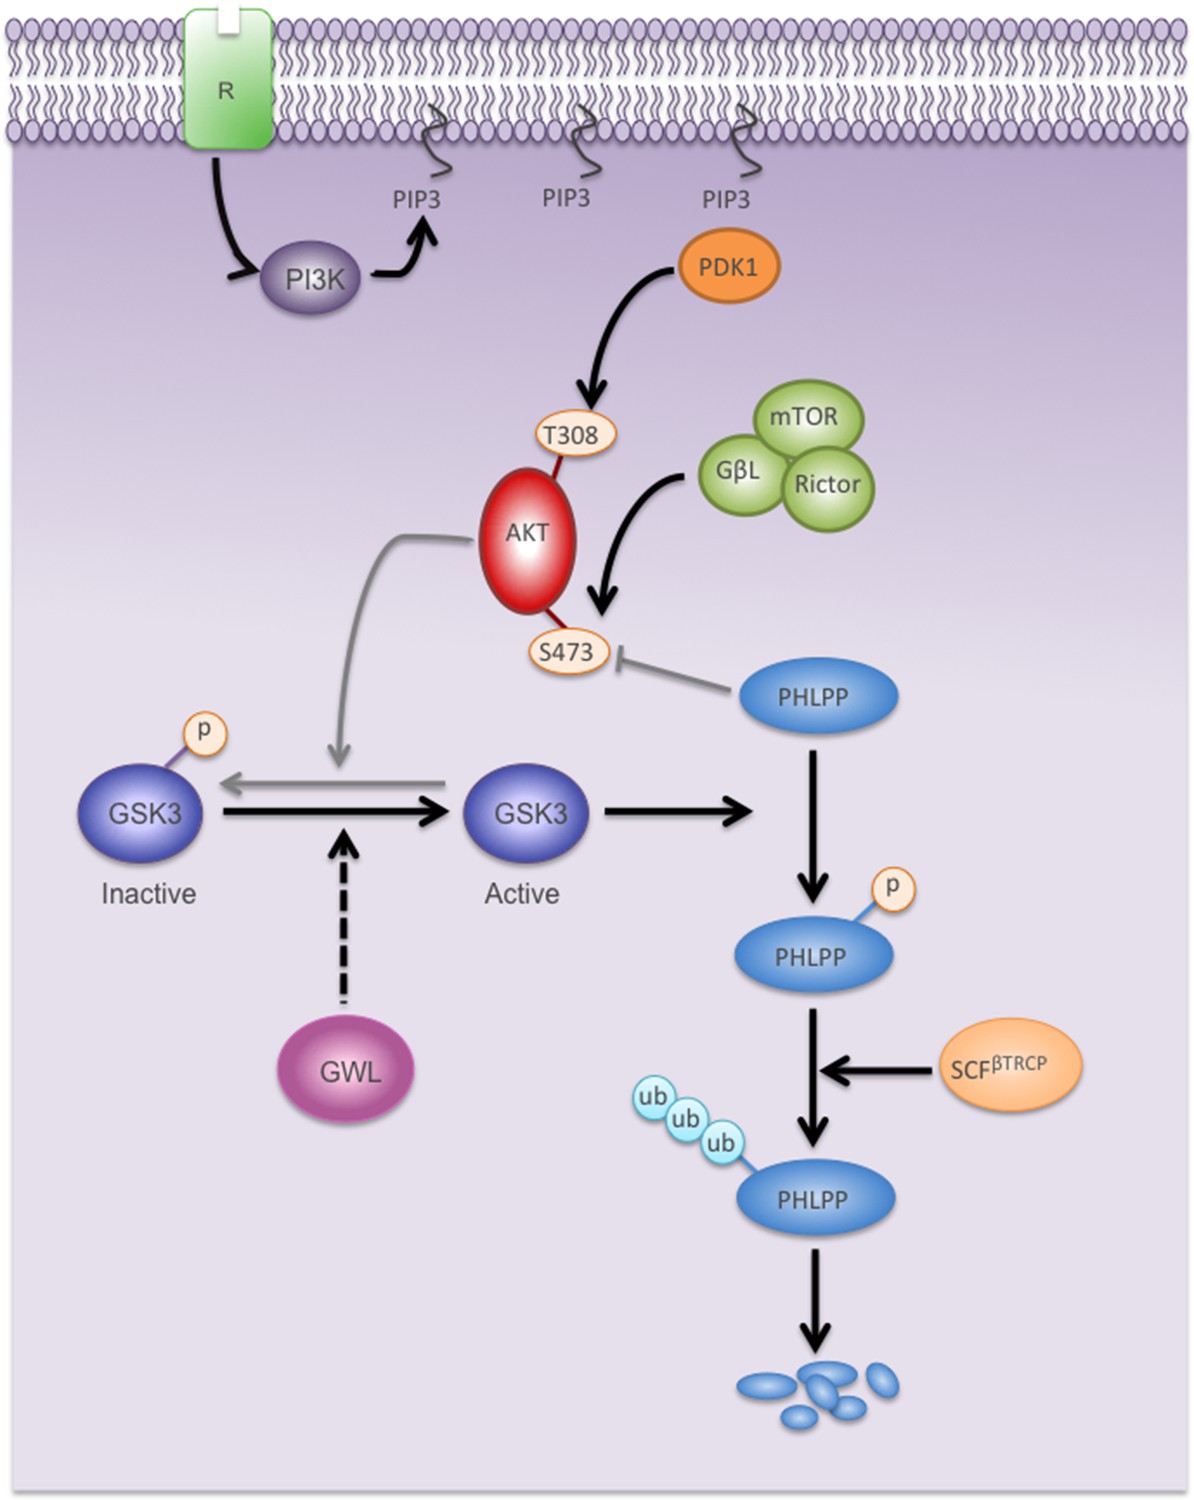
Model showing the mechanisms by which GWL overexpression promotes AKT hyperphosphorylation and hyperactivation in human cells.
Black arrows represent pathways favoured by GWL overexpression.Grey arrows represent disfavoured pathways in GWL overexpressed cells. Dashed arrows represent indirect effect of GWL on GSK3 dephosphoryaltion and reactivation. R: Membrane receptor.
Additional files
-
Supplementary file 1
Antibodies used in the study.
- https://doi.org/10.7554/eLife.10115.026
-
Supplementary file 2
Plasmids used in the study.
- https://doi.org/10.7554/eLife.10115.027
Download links
A two-part list of links to download the article, or parts of the article, in various formats.
Downloads (link to download the article as PDF)
Open citations (links to open the citations from this article in various online reference manager services)
Cite this article (links to download the citations from this article in formats compatible with various reference manager tools)
Greatwall promotes cell transformation by hyperactivating AKT in human malignancies
eLife 4:e10115.
https://doi.org/10.7554/eLife.10115


