Arf6 regulates the cycling and the readily releasable pool of synaptic vesicles at hippocampal synapse
- Istituto Italiano di Tecnologia, Italy
- University of Genova, Italy
Figures
Figure 1 with 3 supplements

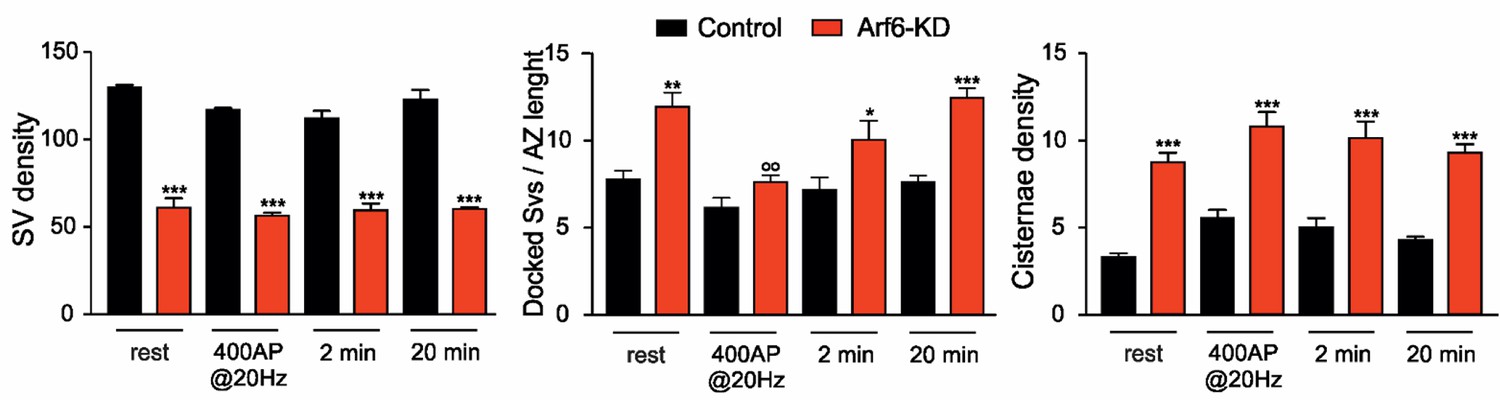
Reduced SV density and accumulation of intraterminal cisternae at Arf6 deficient synapses.
(A) Upper panels, representative electron micrographs of synaptic terminals from cultured hippocampal neurons (17 DIV) transduced with lentiviruses expressing an Arf6 shRNA (Arf6-KD) or an inactive mismatched version (Control). Scale bar, 200 nm. Lower panels, morphometric analysis of the density of SVs, docked SVs and cisternae in control (black) and Arf6-silenced (red) synapses. Data are means ± SEM from 3 independent preparations (n=134 and 162 synapses for control and Arf6-KD, respectively). (B) Upper panels, representative 3D synapse reconstructions from 60 nm-thick serial sections obtained from hippocampal neurons transduced as in A. Total SVs, docked SVs, presynaptic plasma membrane, postsynaptic density and cisternae are shown in light blue, yellow, green, blue and red respectively. Lower panels, morphometric analysis of number of SVs, docked SVs and cisternae in control (black) and Arf6-KD (red) synapses. Right panel shows the percentage of intraterminal cisternae that are connected (green) or not-connected (orange) with the plasma membrane for Arf6-KD synapses. Data are means ± SEM from 10 (Control) and 10 (Arf6-KD) reconstructed synapses. Statistical analysis was performed with the unpaired Student’s t-test. **p<0.005, ***p<0.001, versus control.
Figure 1—figure supplement 1

Synaptic localization of Arf6.
https://doi.org/10.7554/eLife.10116.004
Figure 1—figure supplement 2

Tools for silencing and rescue Arf6 expression.
https://doi.org/10.7554/eLife.10116.005
Figure 1—figure supplement 3

Rescue of the Arf6-KD ultrastructural phenotype.
https://doi.org/10.7554/eLife.10116.006
Figure 2

Increased expression of endosomal markers at Arf6-deficient synapses.
(A) Representative images of synapses from rat hippocampal neurons (17 DIV) transduced with either Arf6 shRNA (Arf6-KD) or an inactive mismatched version (Control) and immunostained with anti-Vamp2 (blue) and either anti-Rab5 or anti-Vti1A (red) antibodies. Scale bar, 5 µm. (B) Intensity values for Rab5 and Vti1A signal at VAMP2-positive puncta in control (black) and Arf6-silenced (red) synapses. Data are means ± SEM from 3 independent preparations. 500 synapses have been counted for each preparation. Statistical analysis was performed with the unpaired Student's t-test. **p<0.005 versus control.
Figure 3 with 1 supplement

SecinH3 treatment phenocopies Arf6 silencing.
(A) Upper panels, representative electron micrographs of synaptic terminals from cultured hippocampal neurons (17 DIV) treated with either SecinH3 (30 µM) or DMSO (Vehicle). Lower panels, morphometric analysis of the density of SVs, docked SVs and cisternae in control (black) and SecinH3 treated (red) synapses. Data are means ± SEM from 3 independent preparations (n=75 for experimental group). Statistical analysis was performed with the unpaired Student’s t-test. ***p<0.001, versus respective control. Scale bar, 200 nm. (B) Left panels, representative images of synapses from rat hippocampal neurons (17 DIV) treated with SecinH3 (30 µM) or DMSO (Vehicle) and immunostained with anti-Arf6 and anti-synaptophysin (p38) antibodies. Scale bar, 5 µm. Right panel, intensity values for Arf6 signal at p38-positive puncta in control (black) and SecinH3-treated (red) synapses. Data are means ± SEM from 3 independent preparations. 300 synapses have been counted for each preparation.
Figure 3—figure supplement 1
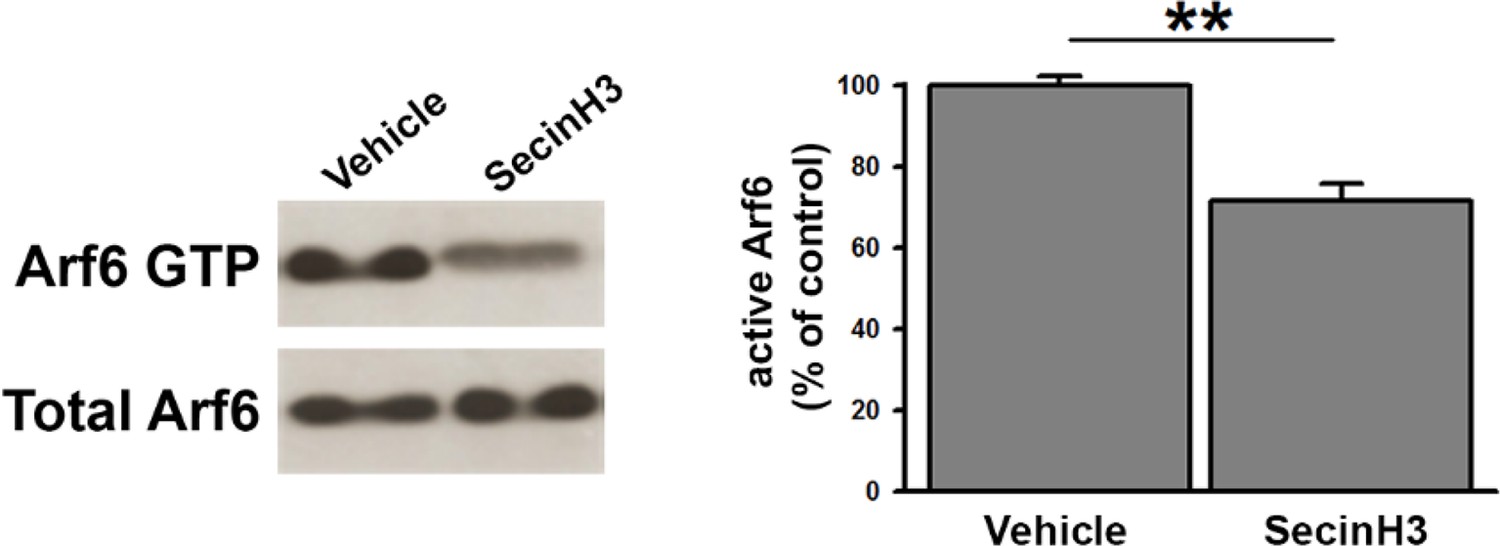
SecinH3 treatment inhibits Arf6 activation in hippocampal primary neurons.
https://doi.org/10.7554/eLife.10116.009
Figure 4

The formation of intraterminal cisternae in Arf6-deficient synapses is activity dependent.
(A) Representative electron micrographs of synaptic terminals from cultured hippocampal neurons (17 DIV) transduced with Arf6-KD or an inactive mismatched version (Control). Neurons were either left untreated or treated with 1 µM TTX for 12 or 24 hr. Scale bar, 200 nm. (B) Morphometric analysis of the density of SVs, docked SVs and cisternae in control (black) and Arf6-KD (red) synapses. Data (80 synapses/group) are means ± SEM from 3 independent preparations. Statistical analysis was performed with two-way ANOVA followed by the Bonferroni’s multiple comparison test. ***p<0.001 versus control; °°°p<0.001 versus the respective untreated sample.
Figure 5 with 2 supplements
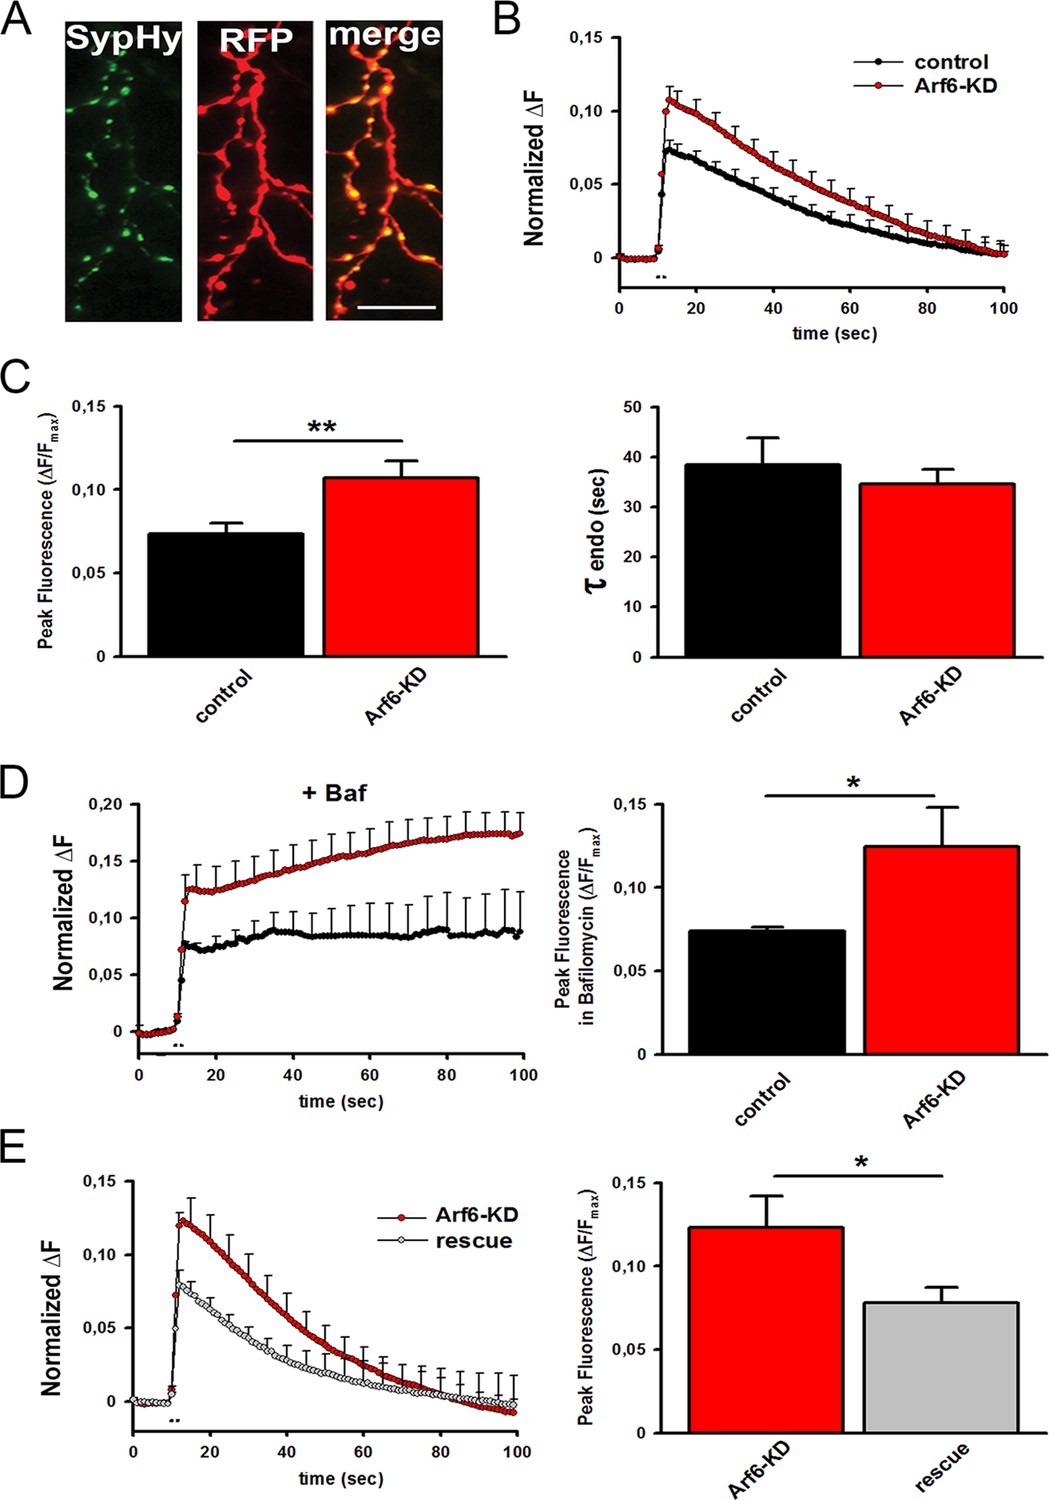
Increased readily releasable pool at Arf6-deficient synapses.
(A) Representative images from neuronal processes cotransfected with Arf6-shRNA #1 (RFP) and SypHy. The merge panel shows colocalization at synaptic puncta. Scale bar, 10 µm. (B) Ensemble average traces of SypHy fluorescence plotted for control (n=18, black trace) and Arf6-KD (n=20, red trace) neurons stimulated with 40APs@20Hz (dotted line). Data are means with SEM values shown every 5 time points. (C) Means ± SEM of the peak fluorescence at the end of the stimulus (left) and of the time constant of endocytosis (τ endo, right), evaluated by fitting the fluorescence decay after stimulation by a single exponential function, for control (black) and ARF6-KD (red) synapses. (D) Left panel, ensemble average traces of SypHy fluorescence plotted for control (n=18, black trace) and Arf6-KD (n=20, red trace) neurons stimulated with 40APs@20Hz (dotted line) in the presence of 1 µM Bafilomycin (+Baf). Data are means with SEM values shown every 5 time points. Right panel, means ± SEM of the peak fluorescence at the end of the stimulus in the presence of 1 µM Baf. (E) Left panel, ensemble average traces of SypHy fluorescence plotted for Arf6-KD (n=10, red trace) and Arf6-KD neurons cotransfected with the Arf6 shRNA#1 resistant form (rescue, n=13, gray trace) and stimulated with 40APs@20Hz (dotted line). Data are means with SEM values shown every 5 time points. Right panel, mean ± SEM of peak fluorescence at the end of the stimulus in Arf6-KD (red) or rescued (gray) synapses. Statistical analysis was performed with the unpaired Student’s t-test. *p<0.05; **p <0.01.
Figure 5—figure supplement 1
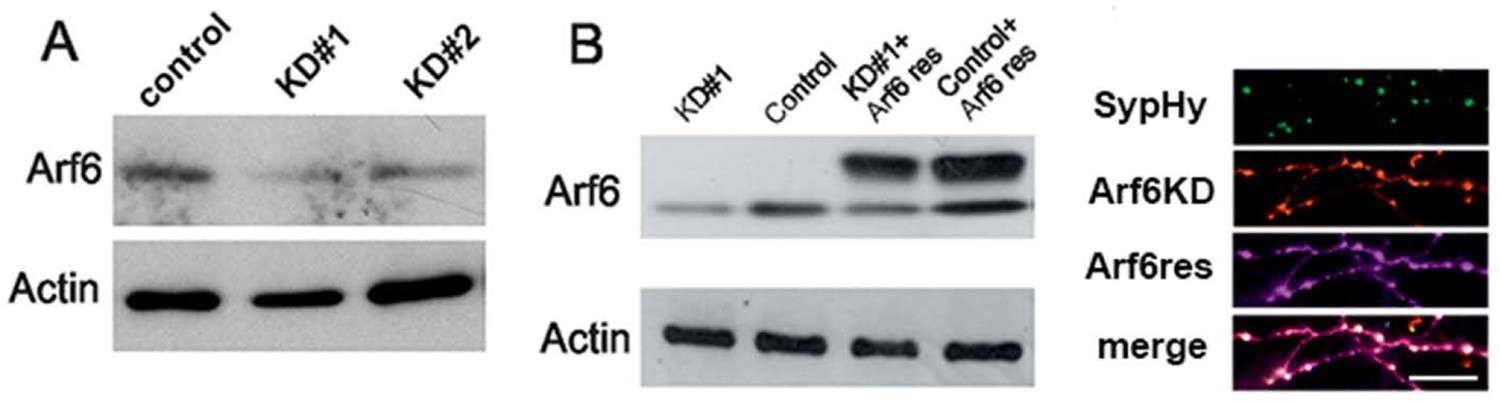
Tools for silencing and rescue Arf6 expression by transfection.
https://doi.org/10.7554/eLife.10116.012
Figure 5—figure supplement 2
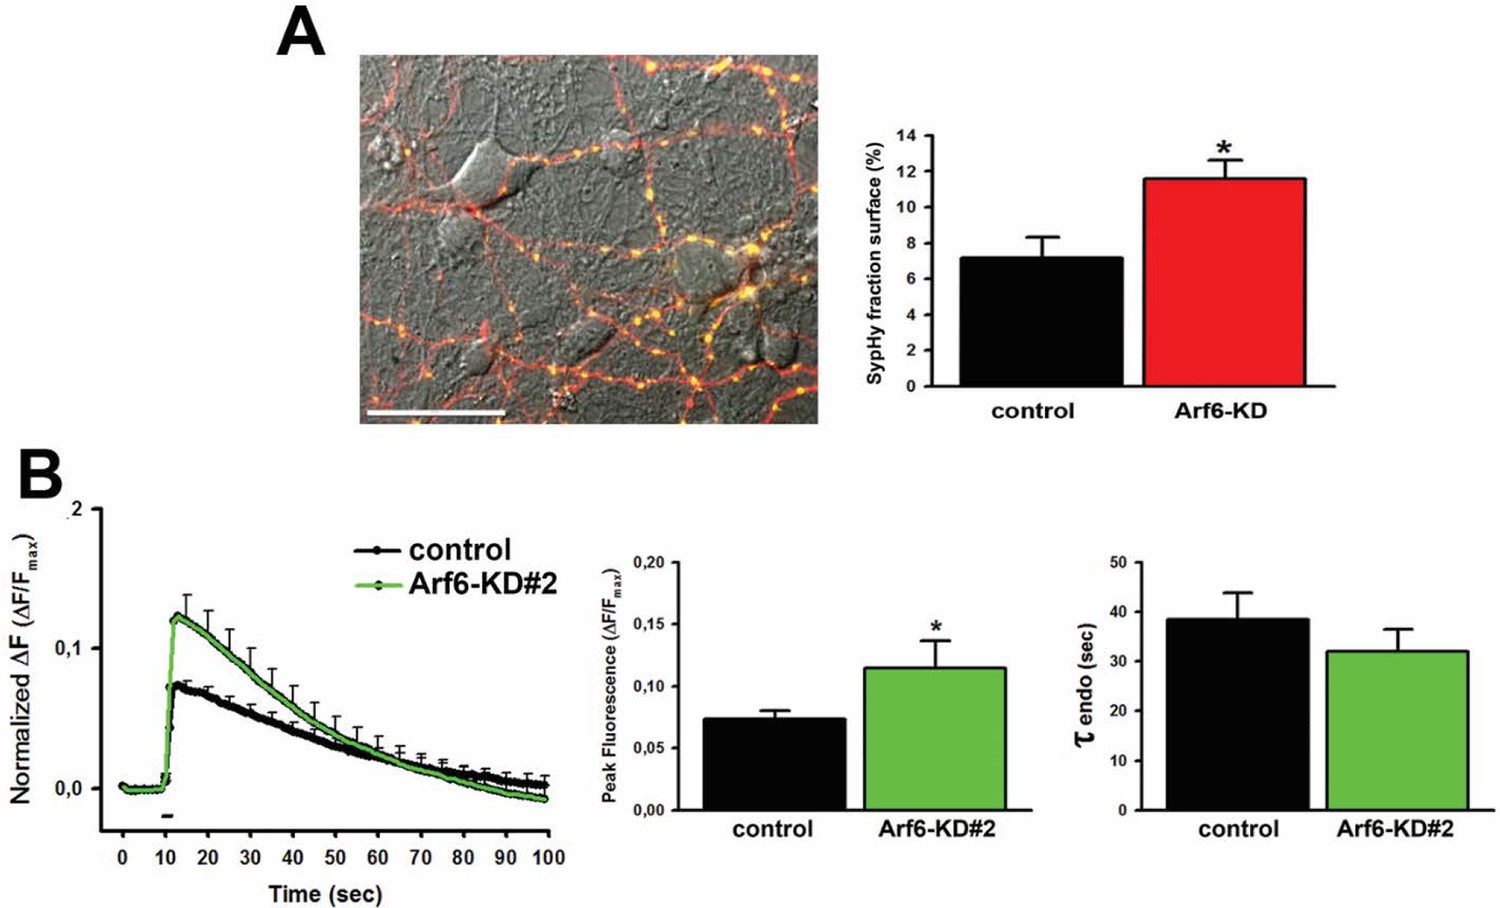
SypHy expression at Arf6-silenced synapses and effect of Arf6 shRNA#2.
https://doi.org/10.7554/eLife.10116.013
Figure 6
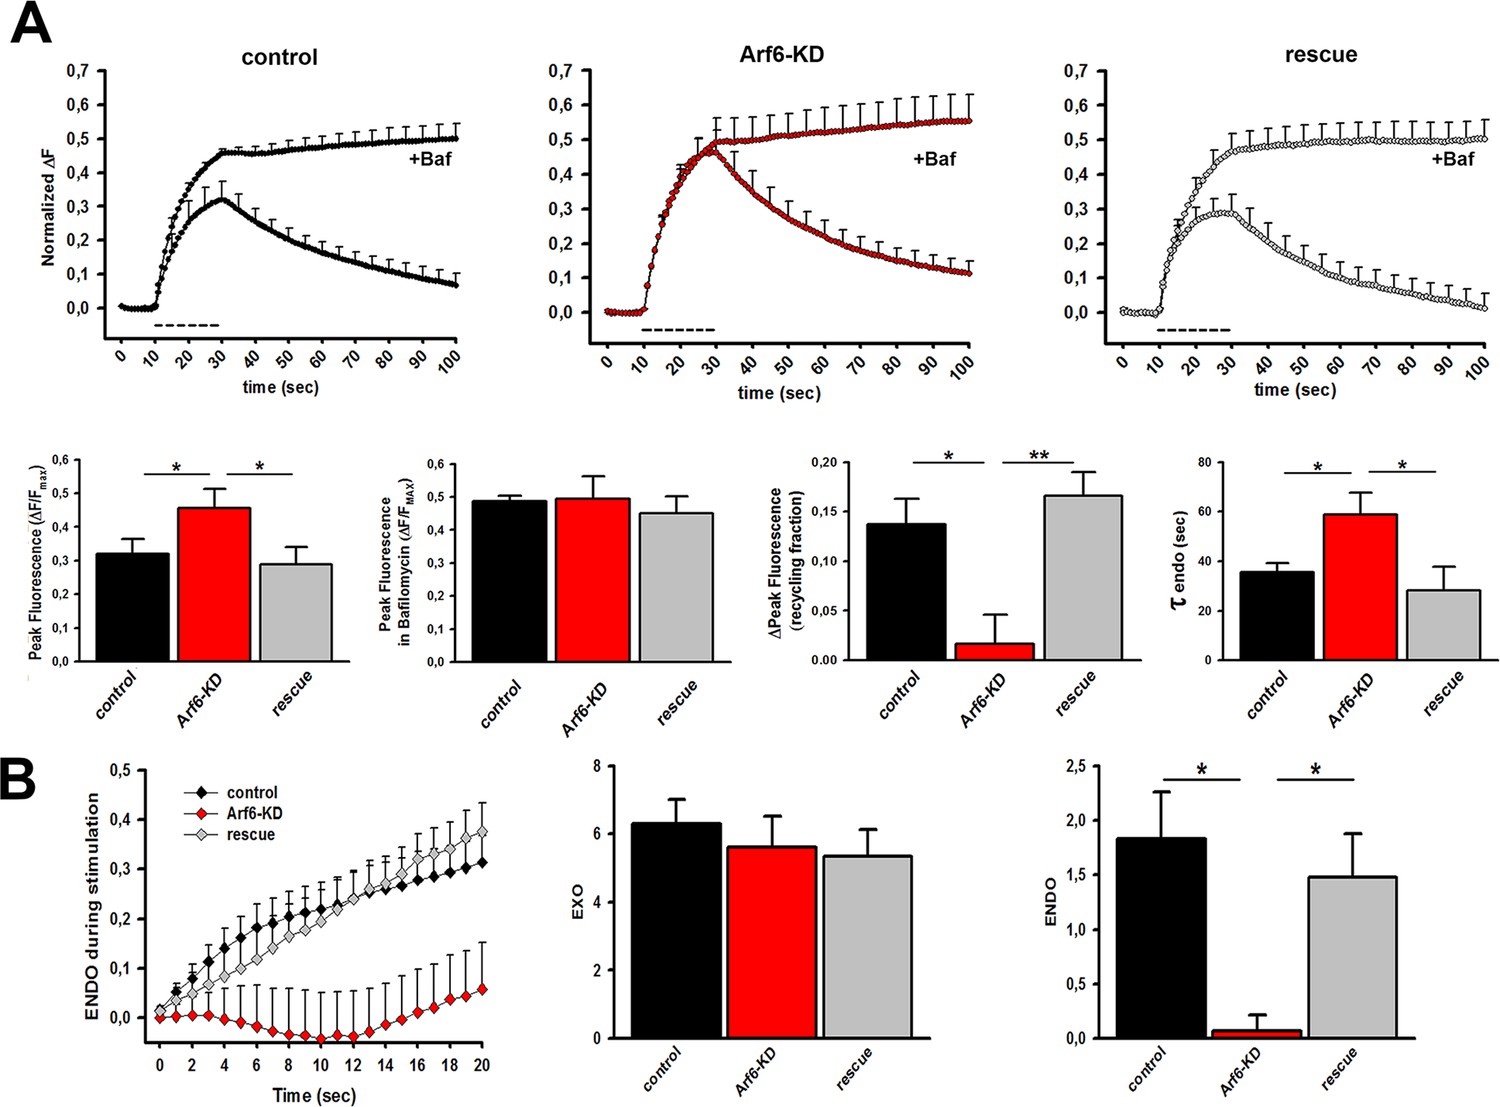
Decreased SV recycling at Arf6-deficient synapses.
(A) Upper panels, ensemble average traces of SypHy fluorescence plotted for control (n=9, left), Arf6-KD (n=8, center) and rescued (n=8, right) neurons stimulated with 400APs@20Hz (dotted line) in the absence or presence of 1 µM Bafilomycin (+ Baf.). Data are means with SEM values shown every 5 time points. Lower panels (from left to right), peak fluorescence at the end of the stimulus in the absence of Baf.; peak fluorescence at the end of the stimulus in the presence of Baf.; ‘during-stimulus’ recycling fraction calculated as the difference between the peak fluorescence in the presence and absence of Baf.; time-constants of ‘post-stimulus’ endocytosis evaluated by fitting the fluorescence decay after stimulation in the absence of Baf. by a single exponential function. Dara are means ± SEM. (B) Left panel, Time courses of endocytosis during stimulation with 400 APs at 20 Hz in control (black), Arf6-KD (red) and rescued (gray) synapses for the same experiments shown in A. Time courses were derived by subtracting the fluorescence trace in the presence of Bafilomycin (ΔFexo) from the trace in its absence (ΔFexo-ΔFendo). Middle and right panels, Rate of exocytosis (EXO) and endocytosis (ENDO) during stimulation were calculated as the area under the curves. Statistical analysis was performed with one-way ANOVA followed by the Bonferroni’s multiple comparison test. *p<0.05, **p<0.01 versus Arf6-KD.
Figure 7 with 1 supplement
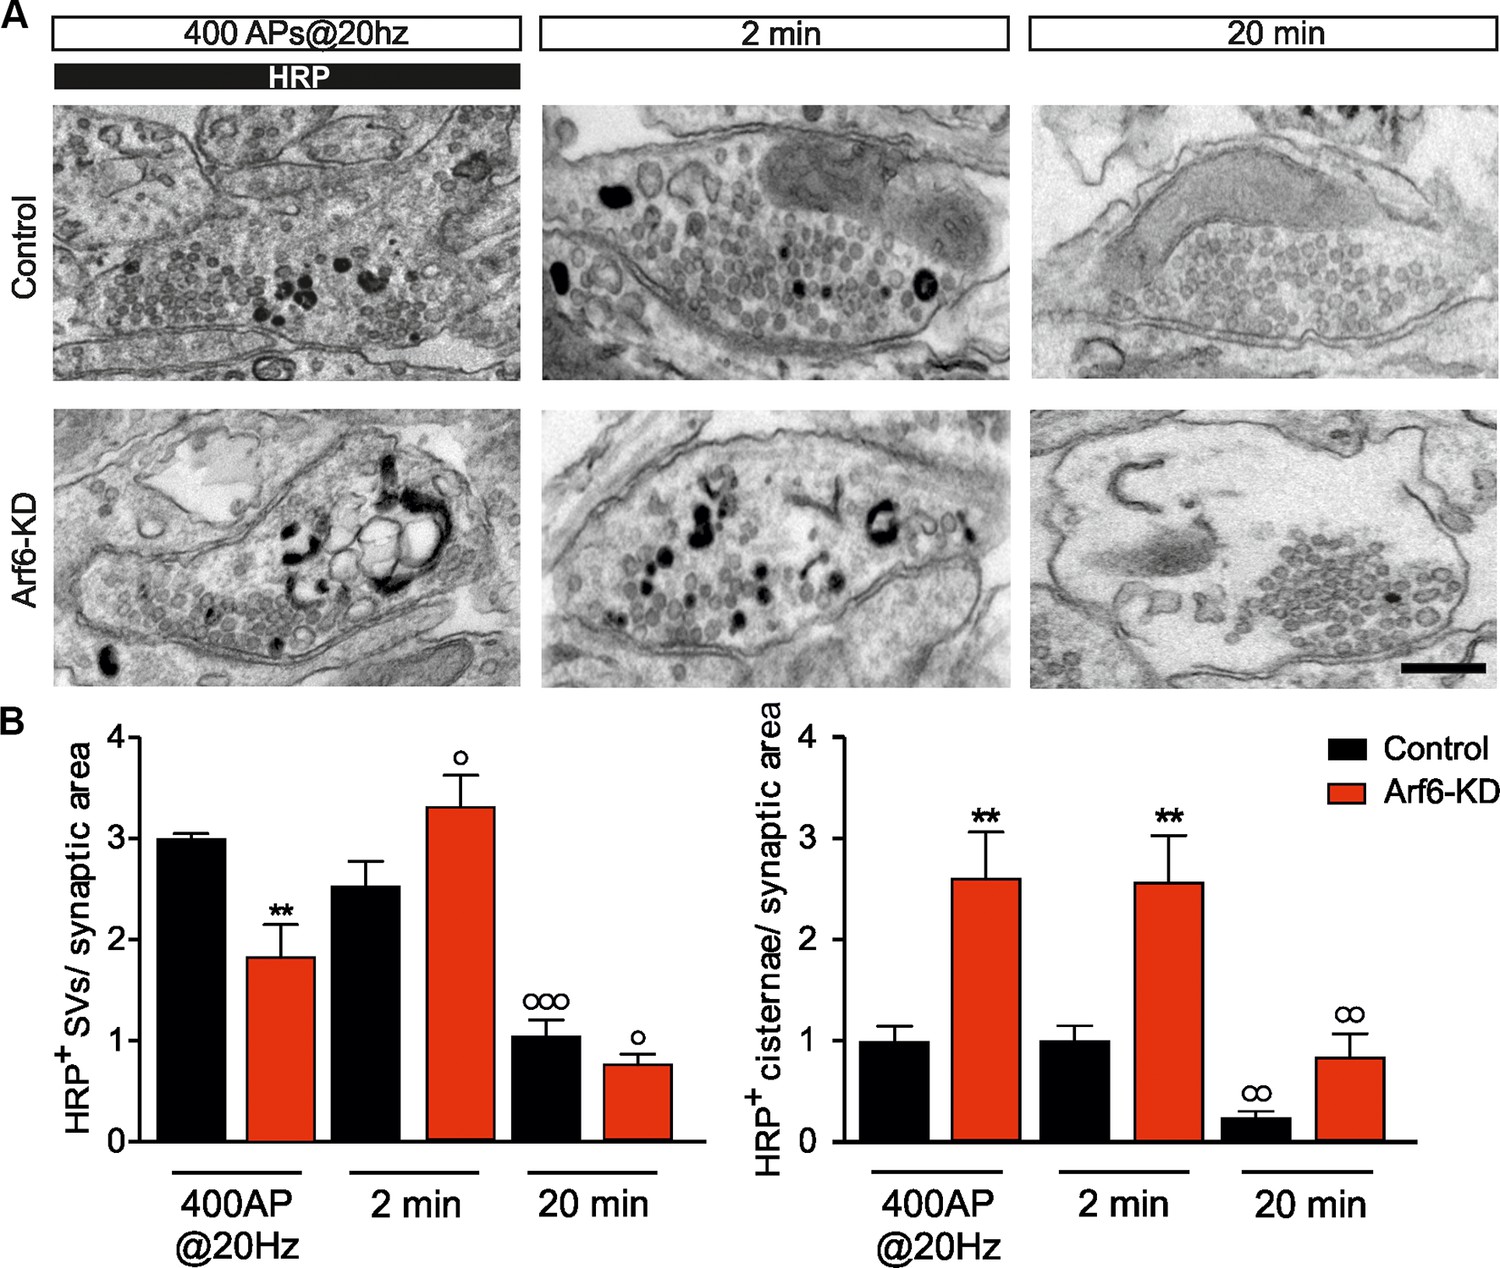
Stimulus-induced formation of intraterminal cisternae is increased at the expense of SV formation at Arf6-silenced synapses.
(A) Representative EM images for Control and Arf6-KD synapses in neurons stimulated with 400APS@20hz in the presence of HRP (10 mg/ml) and then incubated for additional 2 or 20 min, in the absence of HRP. Scale bar, 200 nM. (B) Quantitative analysis of SV and cisternae dynamics measured by HRP labelling in control and Arf6-KD synapses treated as in A. Data (120 synapses/group) are means ± SEM from 4 independent preparations. Statistical analysis was performed with two-way ANOVA followed by the Bonferroni’s multiple comparison test. **p<0.01 versus control; °p<0.05, °°p<0.01, °°°p<0.001 versus the respective HRP-loaded sample.
Figure 7—figure supplement 1
Morphometric analysis at the different time point in the HRP functional assay.
https://doi.org/10.7554/eLife.10116.016Additional files
-
Supplementary file 1
Synaptic area and AZ length in the various experimental groups.
- https://doi.org/10.7554/eLife.10116.017
Download links
A two-part list of links to download the article, or parts of the article, in various formats.
Downloads (link to download the article as PDF)
Open citations (links to open the citations from this article in various online reference manager services)
Cite this article (links to download the citations from this article in formats compatible with various reference manager tools)
Arf6 regulates the cycling and the readily releasable pool of synaptic vesicles at hippocampal synapse
eLife 5:e10116.
https://doi.org/10.7554/eLife.10116


