Tumor microenvironment derived exosomes pleiotropically modulate cancer cell metabolism
- Rice University, United States
- University of Texas MD Anderson Cancer Center, United States
- University of Texas, MD Anderson, United States
- Baylor College of Medicine, United States
- Stanford University, United States
Figures
Figure 1
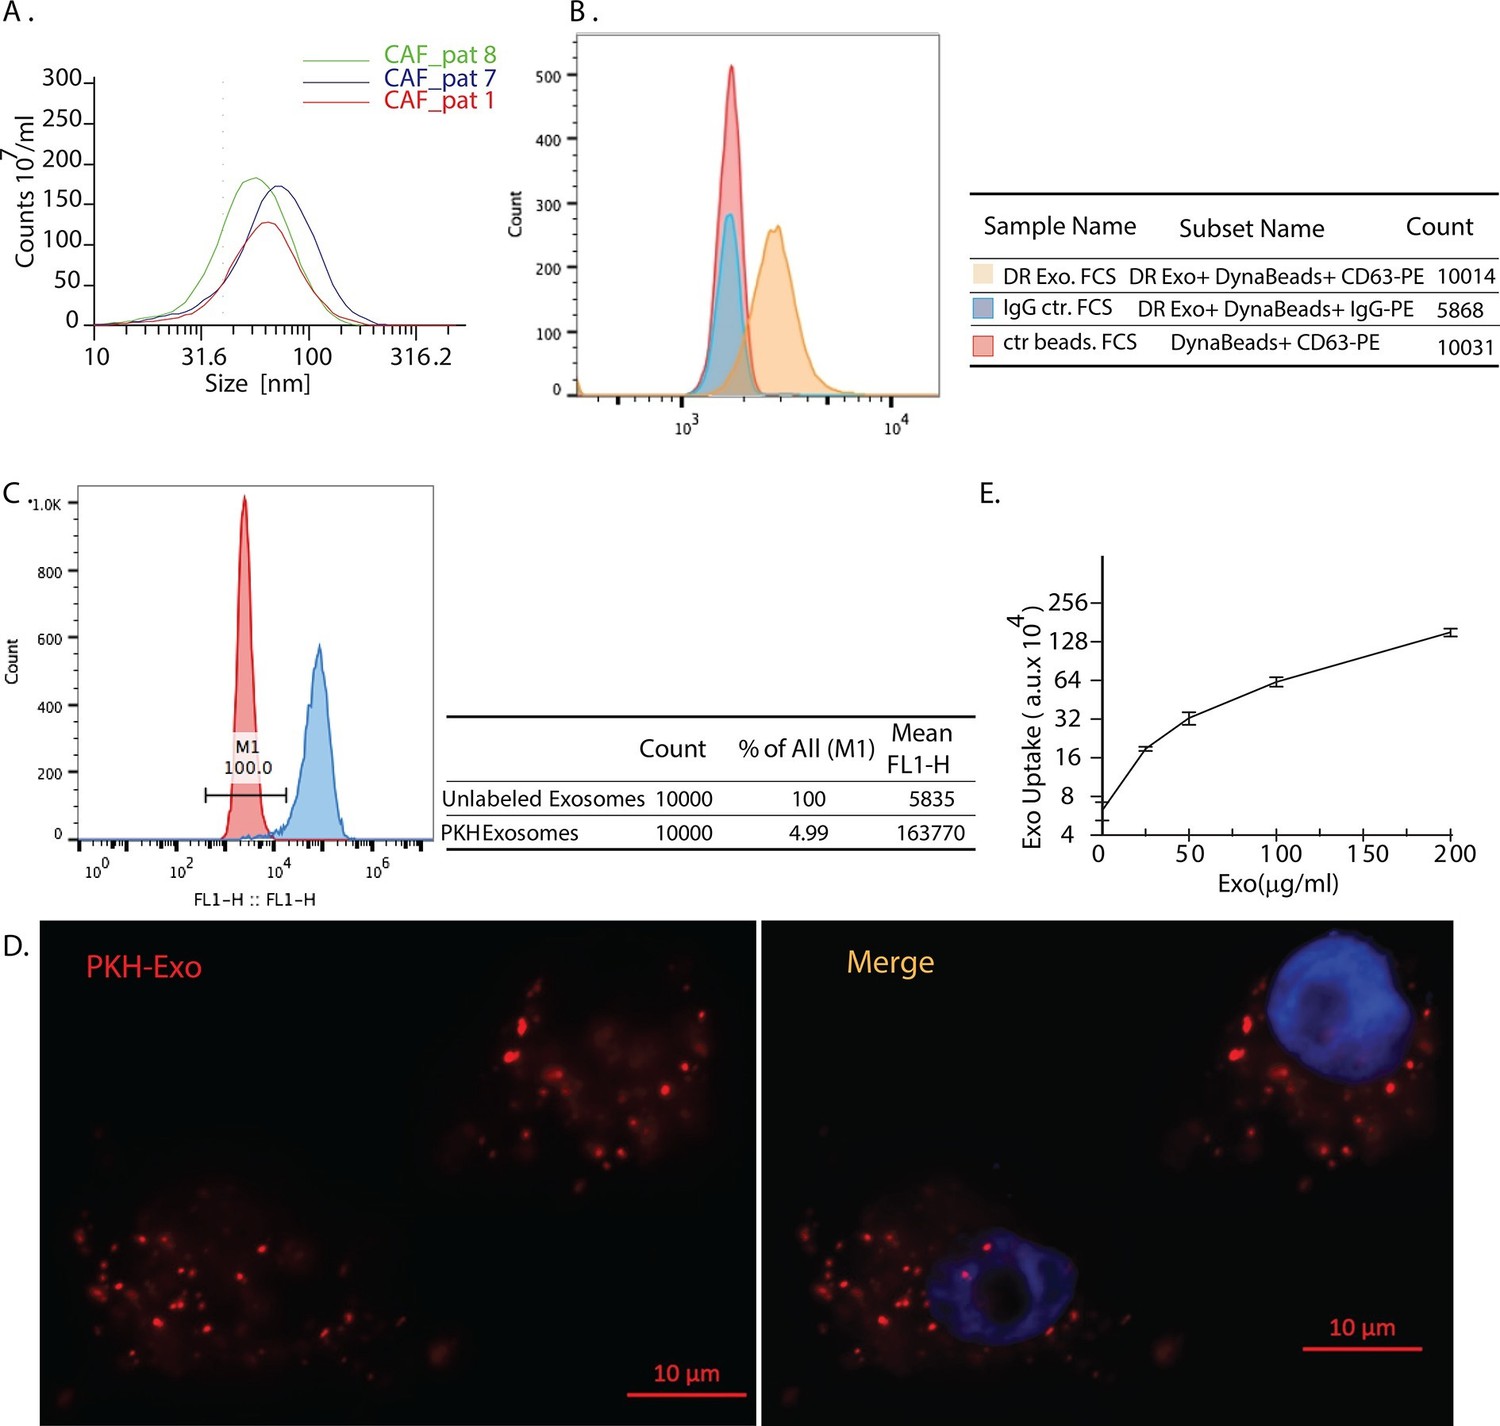
Exosomes secreted by CAF-derived from prostate cancer patients are internalized by prostate cancer cells.
(A) Size analysis of stromal exosomes. Three samples of exosomes derived from prostate cancer patient CAFs were analyzed with the Zetaview instrument. The profiles indicate that the size distribution of exosomes is within the range of 30-100 nm. For exosomes isolation, conditioned medium was obtained from CAFs cultured with exosomes-depleted FBS. (B) Flow analysis of CAF exosomes bound to Dynabeads conjugated with anti-CD63 antibody (anti-CD63) or an irrelevant control antibody (anti-Rabbit IgG antibody, Rb IgG). The graph and table show that these microvesicles express CD63, an exosome surface antigen biomarker. (C) Flow cytometry analysis shows uptake of CAF exosomes by prostate cancer cells. Prostate cancer cells were incubated with PKH67-labeled stromal exosomes for 3 hr. Freshly prepared exosomes were used in this and subsequent experiments. Exosome-depleted serum was used for cell culture. (D) Representative fluorescence image shows CAFs exosomes were uptaken by prostate cancer cells. Prostate cancer cells were incubated with PKH26-labeled CAFs exosomes for 3 hr. Blue, cell nuclei; Red, PKH-Exo. (E) Flow cytometry analysis shows saturable uptake curve of CAFs secreted exosomes in prostate cancer cells. (n=4).
Figure 2 with 2 supplements
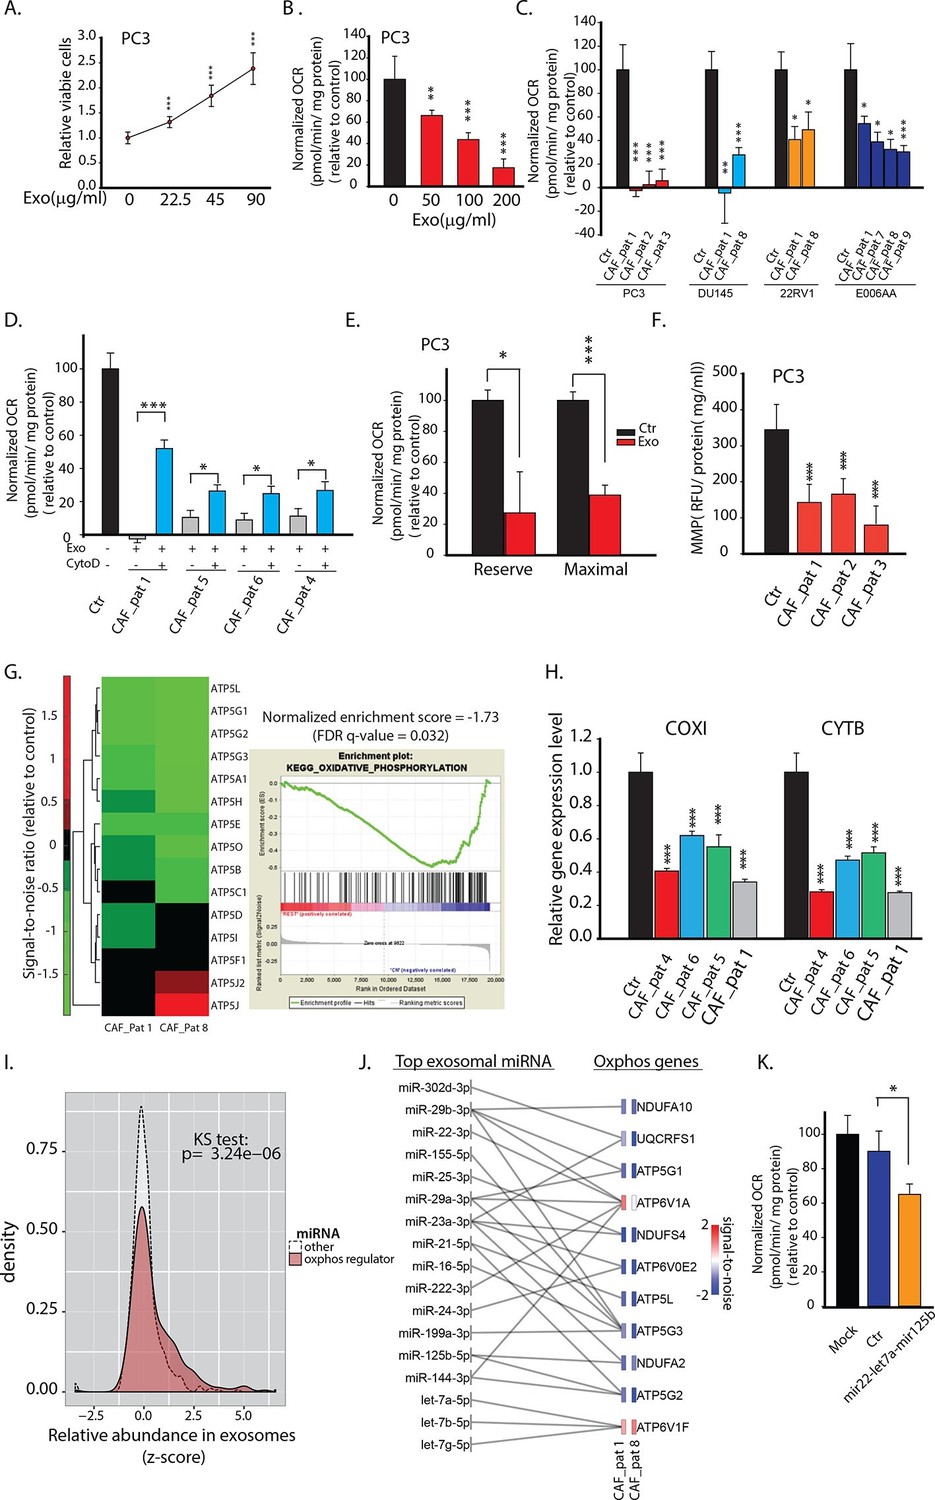
CDEs increase proliferation of prostate cancer cells but significantly downregulate their mitochondrial function.
(A) Effect of CAFs-derived exosomes on viability of prostate cancer cells, 48h culture period (PC3) (n≥9). (B) Prostate cancer cells show reduced basal mitochondrial oxygen consumption rate (OCR) when cultured with range of concentrations of CDEs for 24 hr. Basal OCR is a measure of OXPHOS activity. The OCR was normalized with protein content inside cells. PC3 cells were cultured with patient-1 derived CAFs’ exosomes (n≥9). (C) Basal OCR was measured for PC3, DU145, 22RV1, E006AA prostate cancer cell lines cultured with patient derived CDEs and control conditions. Six patient-derived CAFs were used for exosomes isolation. (n≥9). (D) OCR of prostate cancer cells were measured after 24 hr culture with and without CDEs. Cytochalasin D (CytoD), an inhibitor of exosomes uptake through actin depolymerization, rescues reduced OCR in prostate cancer cells when cultured with CAFs exosomes. CytoD disturbs actin filament inside cells, thus inhibit phagocytosis. CytoD concentration of 1.5 μg/ml was used. (n≥5). (E) Maximal and reserve mitochondrial capacities were measured using FCCP and antimycin. Maximal OCR is maximal capacity of mitochondrial OCR. (n≥9). (F) Role of CAFs secreted exosomes in regulating mitochondrial membrane potential (MMP) of prostate cancer cells. MMP is an important indicator of mitochondrial functions. (n≥5). (G) Reduced OXPHOS genes expression in cancer cells cultured with exogenous CDES. (H) qPCR results show that mitochondrial OXPHOS genes of prostate cancer cells were downregulated when cultured with CDEs. (n=3). (I) Most abundant miRNAs targeting OXPHOS genes were abundant in CAFs exosomes. (n=4). (J) miRNAs in CAFs exosomes targeting specific OXPHOS genes. Nanostring was used to measure miRNA expression levels in stromal exosomes. (n=4). (K) OCR of PC3 were measured after transfection of targeted miRNAs together into cells. (n=5). miRNAs were transfected into cells according to the manufacturer’s protocol (Lipofectamine 2000 Transfection Reagent, Thermofisher). Cells were seeded in 6-well plate for 24 hr. Transfection was performed followed by incubation for 48 hr. Cells were then reseeded onto Seahorse plates for OCR measurements after the cells were attached. Data information: data in (A), (B), (C), (F), (H) are expressed as mean ± SD, data in (D), (E), (K) are expressed as mean ± SEM;*p<0.05, **p<0.01, ***p<0.001. Figure 2—figure supplement 1–2.
Figure 2—figure supplement 1
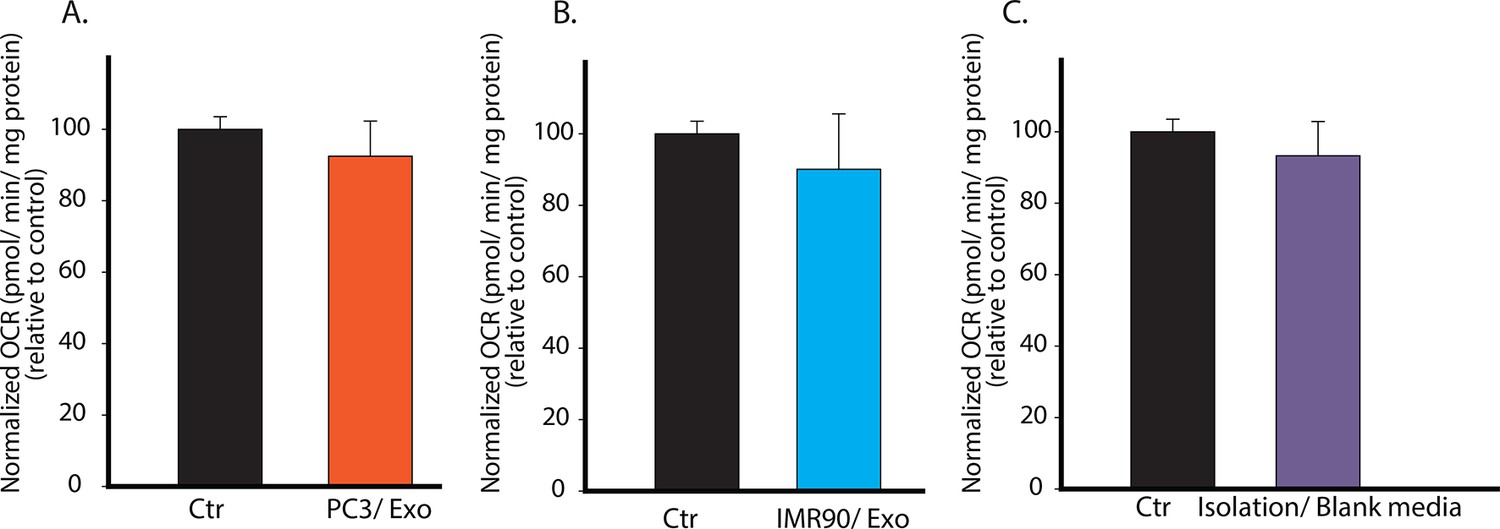
Specificity of CDEs in regulating mitochondrial respiration of cancer cells is demonstrated.
(A) PC3 secreted exosomes (100 μg/ml) were isolated according to the same procedure as used in Figure 2, and added to PC3 cells. OCR of the PC3 cells cultured with PC3 cells-derived exosomes was measured after 24 hr. (B) IMR90 secreted exosomes (100 μg/ml) were isolated and added to PC3 cells. OCR of the PC3 cells cultured with IMR-90-derived exosomes was measured after 24 hr. (C) Fresh CAF culture medium was incubated for 48 hr, and collected to perform the same steps as for isolating exosomes. Next, RPMI medium was used to dissolve any trace amount of chemicals which may be left from exosomes isolation to culture PC3 cells. OCR of the PC3 cells cultured with blank media-derived isolates was measured after 24 hr. No difference in OCR was observed between experimental and control conditions, while OCR of PC3 showed more than 50% decrease when cultured with CDEs. Data information: data in (A–C) are expressed as mean ± SD, *p<0.05, **p<0.01, ***p<0.001. (n=3).
Figure 2—figure supplement 2
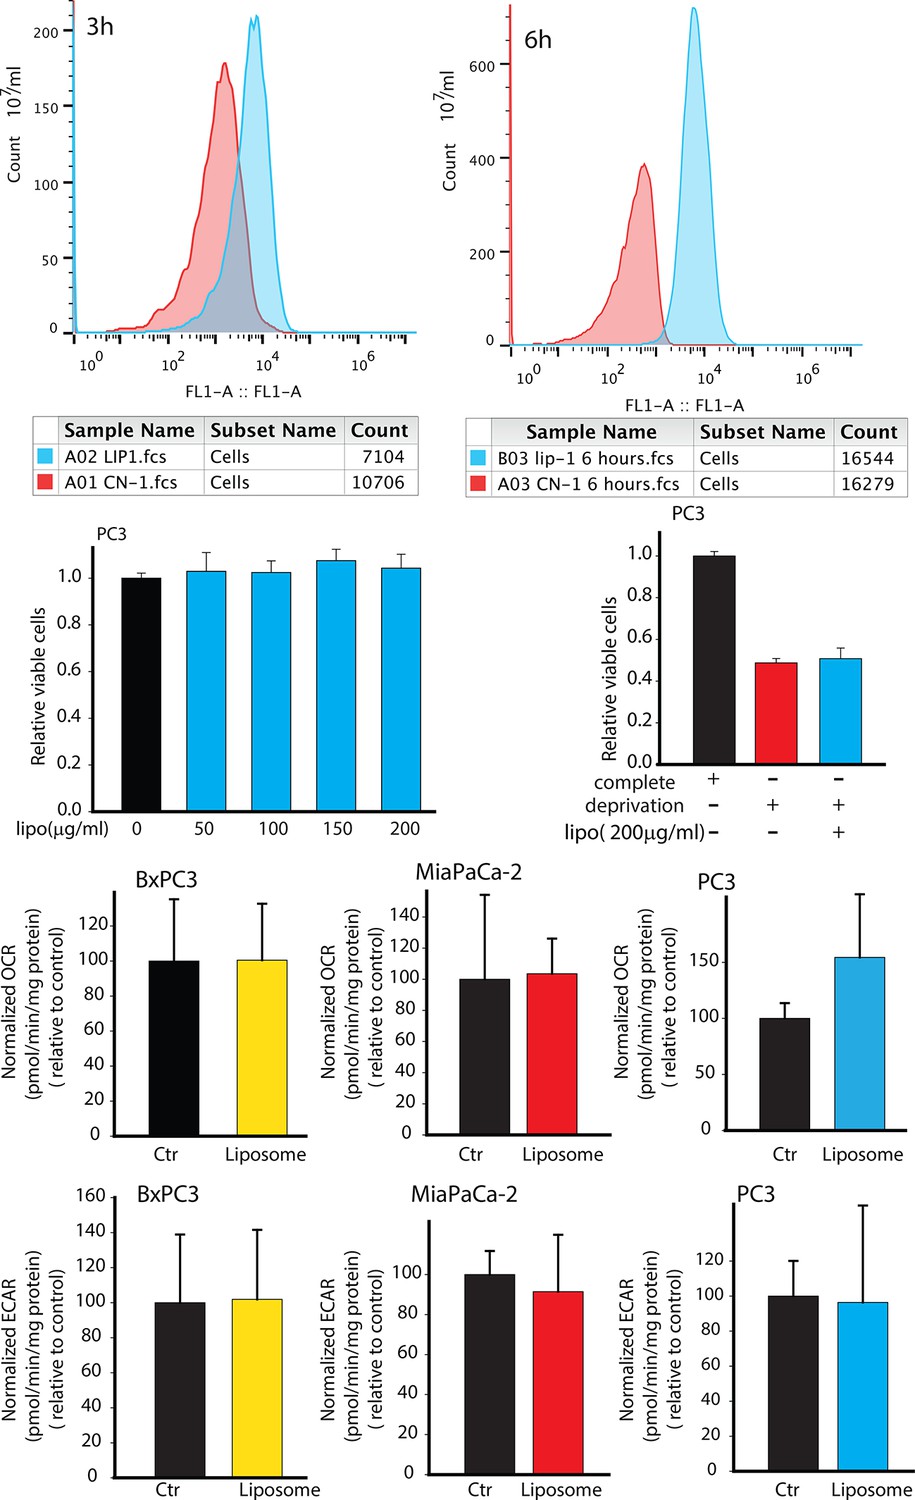
Effects of synthetic liposomes in regulating PC3 metabolism and viability.
(A,B) Synthetic liposomes were uptaken by PC3 cells. (C,D) Synthetic liposomes did not enhance PC3 cells viability in complete medium or in deprivation condition. (E-G) Synthetic liposomes did not downregulate OCR of BxPC3, MiaPaCa-2, PC3 cells. (H-J) Synthetic liposomes did not upregulate ECAR of BxPC3, MiaPaCa-2, PC3 cells. Data information: data in (C–J) are expressed as mean ± SD, *p<0.05, **p<0.01, ***p<0.001. (n≥3).
Figure 3 with 1 supplement
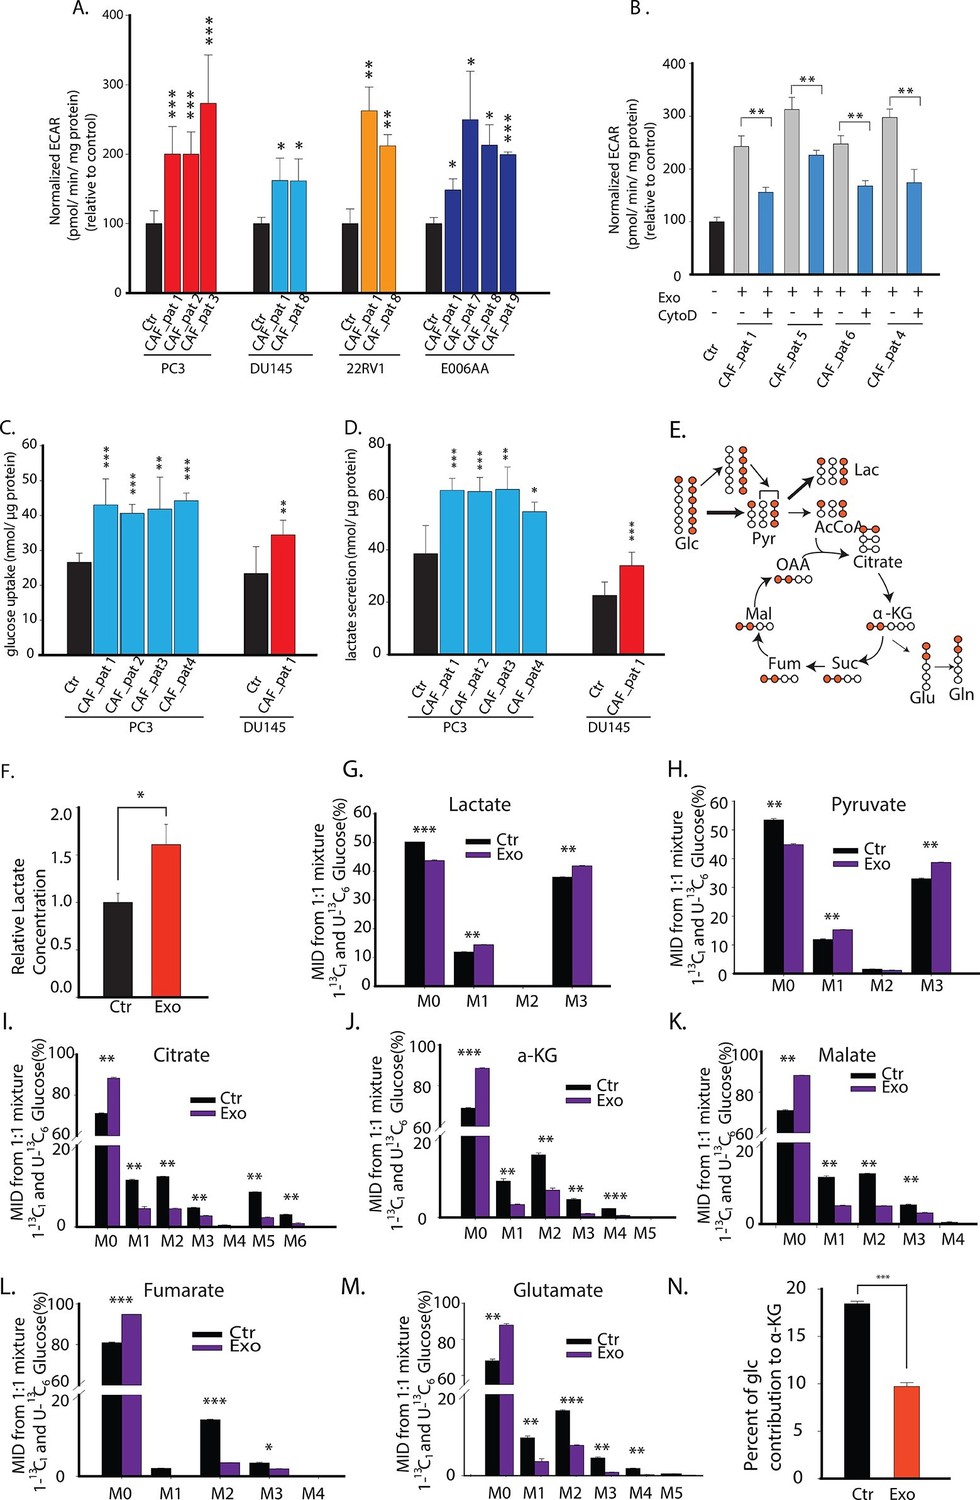
CDEs upregulate glycolysis in cancer cells.
(A) Extracellular acidification rates (ECAR) of prostate cancer cells were measured after 24 hr culture with and without CAFs exosomes. ECAR is a measure of glycolytic capacity of cells. The ECAR was normalized with protein content inside cells. Four prostate cancer cell lines: PC3, DU145, 22RV1, E006AA were used. Six patients derived CAFs were used for exosomes isolation (n≥9). (B) ECAR of prostate cancer cells was measured. CytoD increased ECAR in prostate cancer cells when cultured with CAFs exosomes. CytoD concentration of 1.5 μg/ml was used. (n≥6). (C,D) Effect of CAFs-secreted exosomes on glucose uptake (C) and lactate secretion fluxes (D) in prostate cancer cells. (n=9). (E) Schematic of carbon atom transitions using 1:1 mixture of 13C6 glucose and 1-13C1-labeled glucose. (F) Relative lactate abundances were measured using GC-MS in PC3 cells cultured with and without CAFs-secreted exosomes for 24 hr. (n=4). (G–M) Contribution of glucose towards TCA cycle metabolites and glycolysis is measured using the labeled glucose. Comparison of mass isotopologue distributions (MID) of lactate, pyruvate, citrate, α-ketoglutarate, malate, fumarate, and glutamate in PC3 cancer cells cultured with and without CAFs-secreted exosomes. (n=4). (N) Percentage of glucose contribution to α-ketoglutarate in PC3 cells with and without CAFs-secreted exosomes. (n=4). Data information: data in (A,C and D) are expressed as mean ± SD, data in (B,F–N) are expressed as mean ± SEM; *p<0.05, **p<0.01, ***p<0.001. Figure 3—figure supplement 1.
Figure 3—figure supplement 1
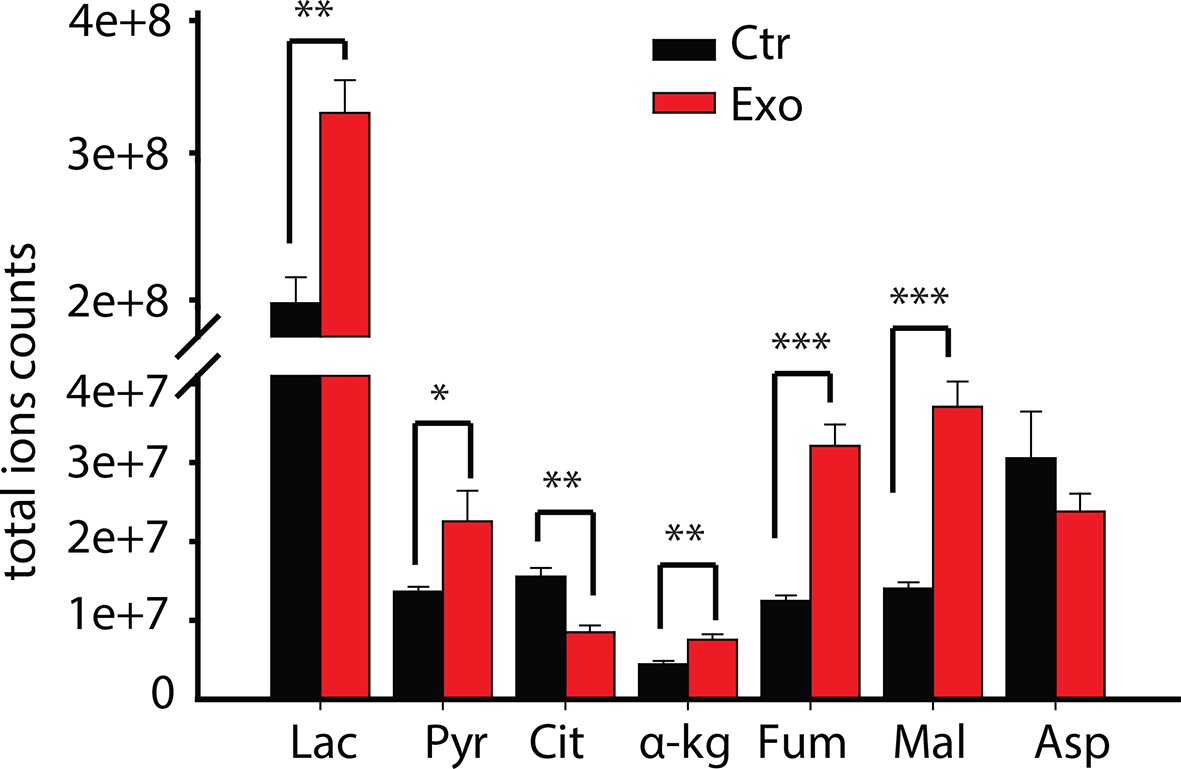
Total ion currents of metabolites in PC3 with or without coculture of CDEs.
Data information: data are expressed as mean mean ± SEM; *p<0.05, **p<0.01, ***p<0.001. (n=4).
Figure 4 with 1 supplement
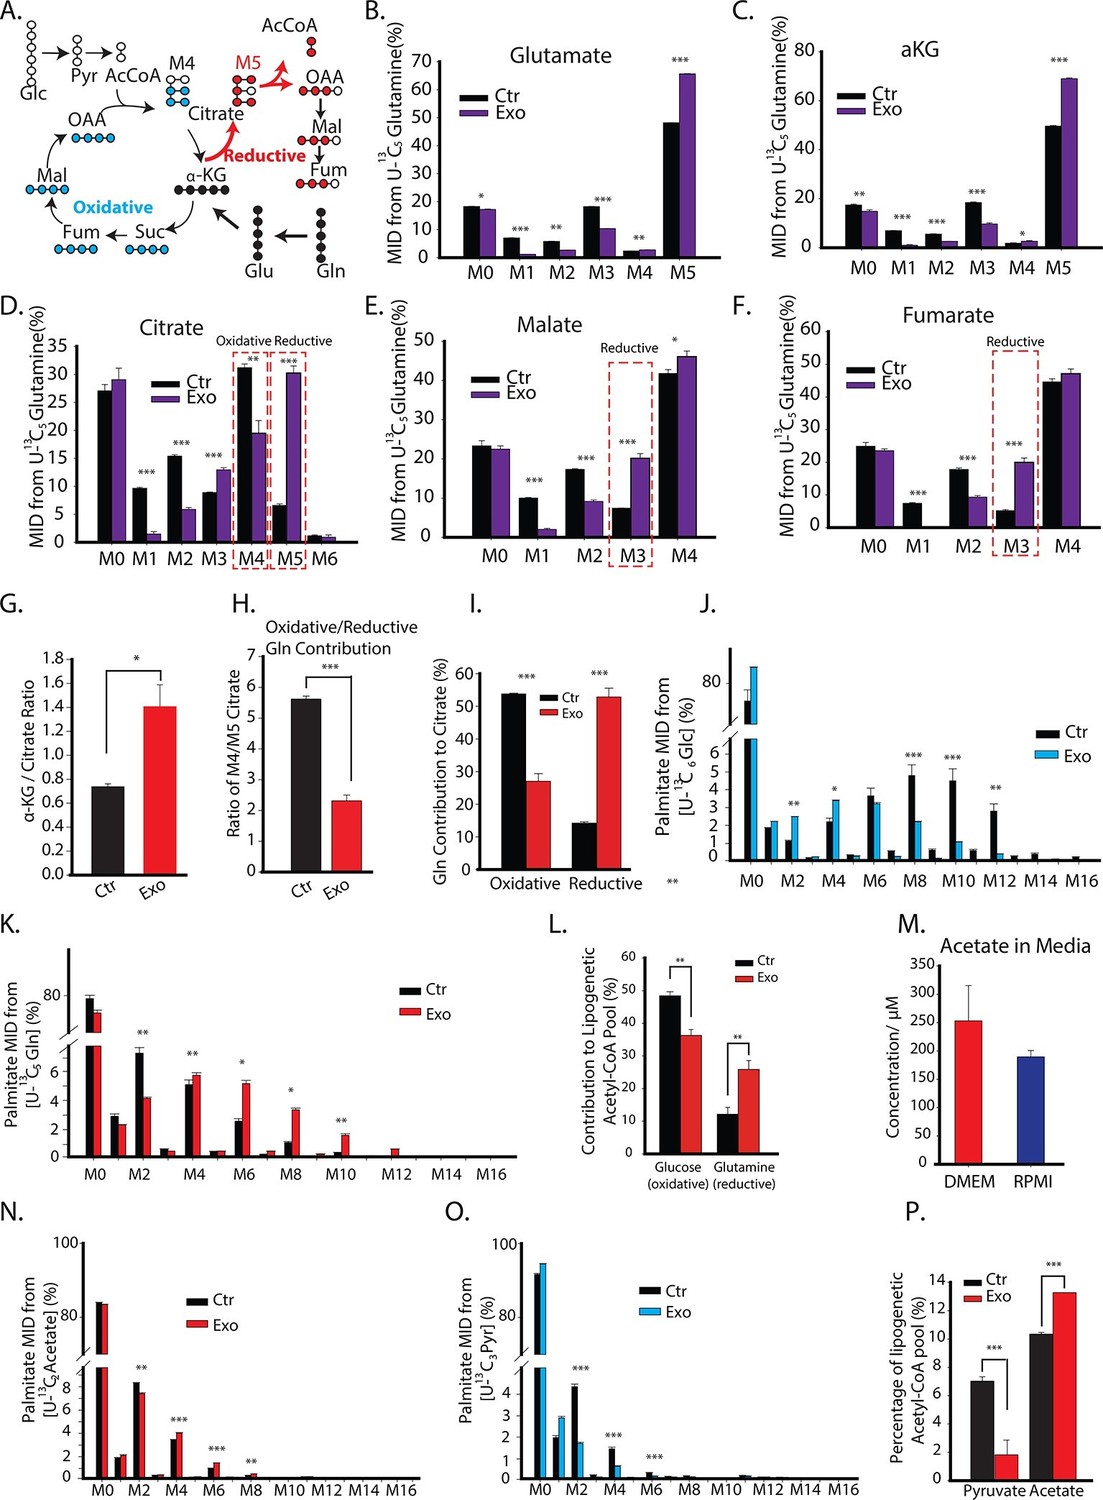
CDEs increase glutamine driven reductive carboxylation and lipogenesis in prostate cancer cells.
(A) Schematic of carbon atom transitions using 13C5 glutamine. Black color represents labeled carbon of glutamine before entering into TCA cycle. Blue color represents glutamine's direct effect on canonical TCA cycle and red color represents glutamine's effect on TCA cycle through reductive carboxylation. (B–F) Mass isotopologue distribution (MID) of glutamate, α-ketoglutarate, citrate, malate, and fumarate in PC3 cancer cells cultured with and without CDEs in U-13C5 glutamine (n=4). (G) Ratio of α-ketoglutarate and citrate pools in PC3 cancer cells cultured with and without CDEs measured using GC-MS. Higher ratio correlates with higher glutamine driven reductive carboxylation (n=4). (H–I) Ratio of glutamine contribution to citrate via oxidative and reductive pathways. Lower ratio indicates higher reductive carboxylation. CDEs increased reductive glutamine metabolism in PC3 cells (I). Oxidative contribution to citrate is determined by calculating M4 citrate percentage; reductive contribution to citrate is determined by M5 citrate percentage (n=4). (J) Glucose contribution to palmitate synthesis in PC3 cells cultured with or without CAFs exosomes for 72 hr was measured using GC-MS (n=6). (K) Glutamine contribution to palmitate synthesis in prostate cancer cells with or without CAFs exosomes measured using GC-MS (n=6). (L) Isotopologue spectral analysis (ISA) of both glucose and glutamine contribution to lipid synthesis in PC3 cells under control or CAFs exosomes culture conditions. CAFs exosomes enhance reductive carboxylation to lipid synthesis. However, total percentage of glucose and glutamine contribution to palmitate is about 60%. (M) Acetate concentration in cancer cell culture medium. (N) Acetate contribution to palmitate synthesis in PC3 cells with or without CAFs exosomes. Acetate spiked concentration was 500 μM (n=4). (O) Pyruvate contribution to palmitate synthesis in PC3 cells with or without CAFs exosomes (n=4). (P) ISA analysis of both pyruvate and acetate contribution to lipid synthesis in PC3 cancer cells under control or CAFs exosomes culture conditions. CAFs exosomes enhance acetate contribution to palmitate synthesis. Data information: data in (B–P) are expressed as mean ± SEM,*p<0.05, **p<0.01, ***p<0.001.
Figure 4—figure supplement 1
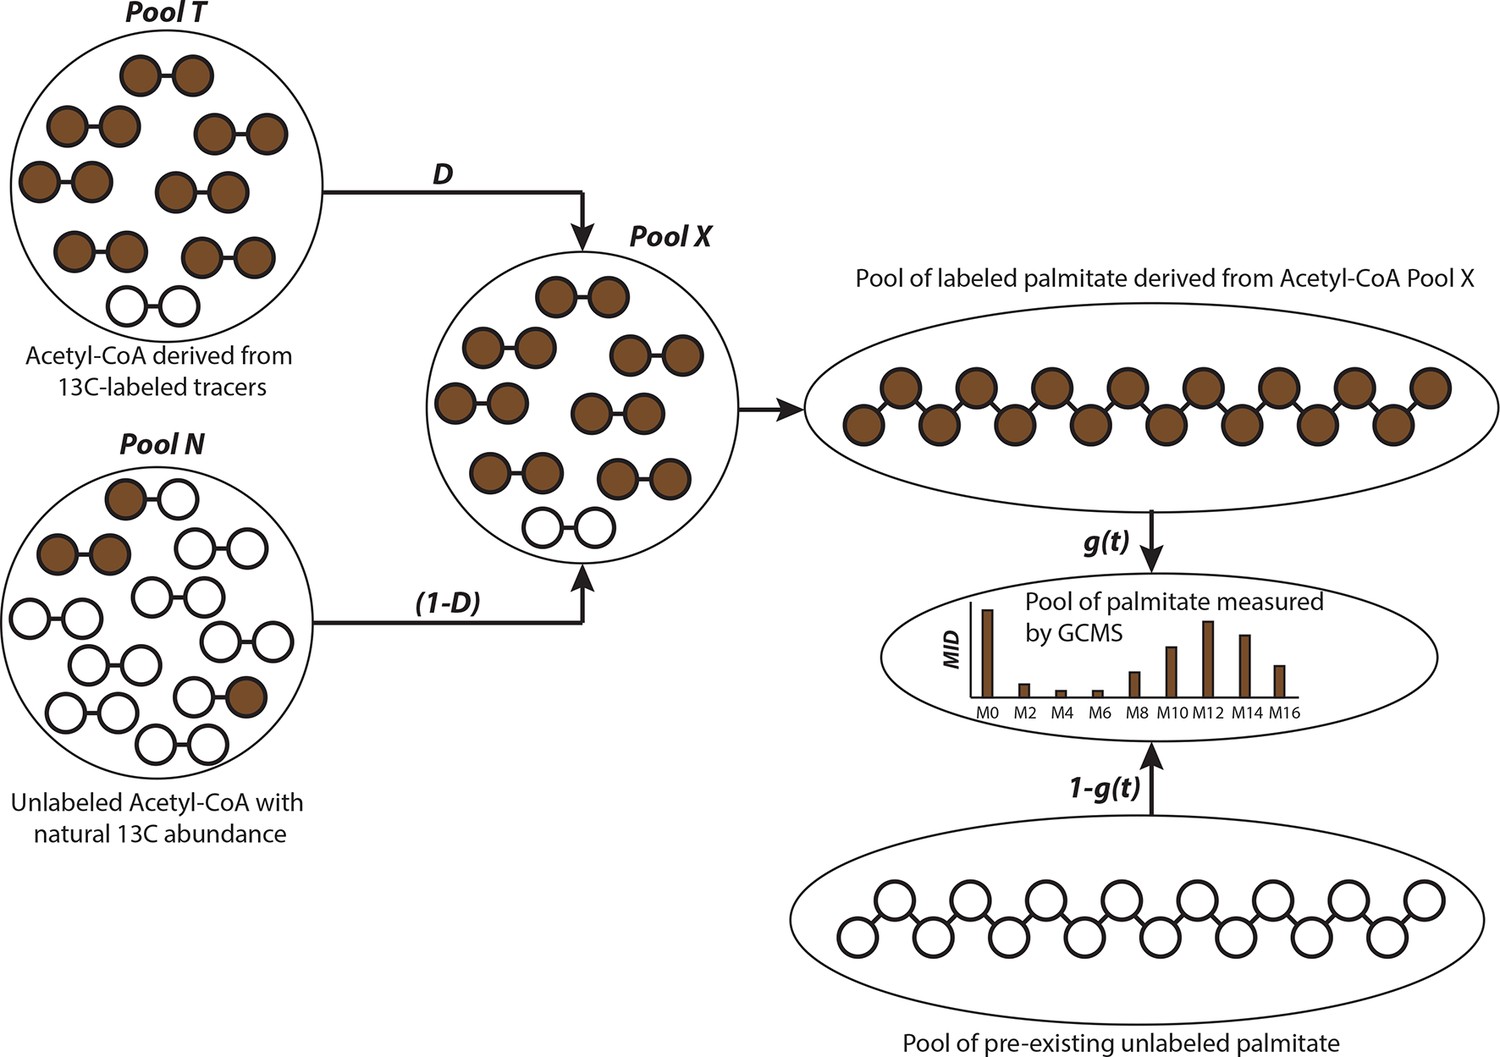
Schematic of isotopologue spectral analysis (ISA) method.
Isotopologue spectral analysis (ISA) is used to determine the contribution of 13-carbon labeled sources (e.g. U-13C6-Glucose and U-13C5-glutamine) to lipogenic Acetyl-CoA, which produces fatty acids (Kharroubi et al., 1992). Cells are cultured with 13-carbon tracers to produce labeled fatty acids of different mass isotopologues. The mass isotopologue distribution (MID) of these fatty acids depends on the rate of de novo synthesis [represented by the parameter g(t)] and fraction of Acetyl-CoA pool (represented by parameter D) enriched by tracers. The ISA method is designed to estimate the parameters D and g(t), by minimizing error between MID of fatty acids measured with GC-MS and MID generated from binomial functions based on the aforementioned parameters. The MID of Acetyl-CoA derived from tracers is denoted by vector T and the naturally labeled Acetyl-CoA pool by vector N. The MID of mixed pool X is
The vectors T and N are of size (3x1) with N0, T0 and N1, T1 and N2, T2 denoting fractions of (M+0), (M+1) and (M+2) labeled acetyl-CoA, respectively. The probability of production of individual mass isotopologues of palmitate are derived from binomial functions
where is probability function of generating (M+x) labeled palmitate from combinations of labeled acetyl-CoA in pool X or naturally labeled pool N. For e.g. the (M+3) mass isotopologue of palmitate can be derived from either 5 (M+0) molecules and 3 (M+1) molecules of acetyl-CoA; or 6 (M+0) molecules, 1 (M+1) molecule and 1 (M+2) molecule of acetyl-CoA. Therefore the probability function for (M+3) palmitate will be
Figure 5
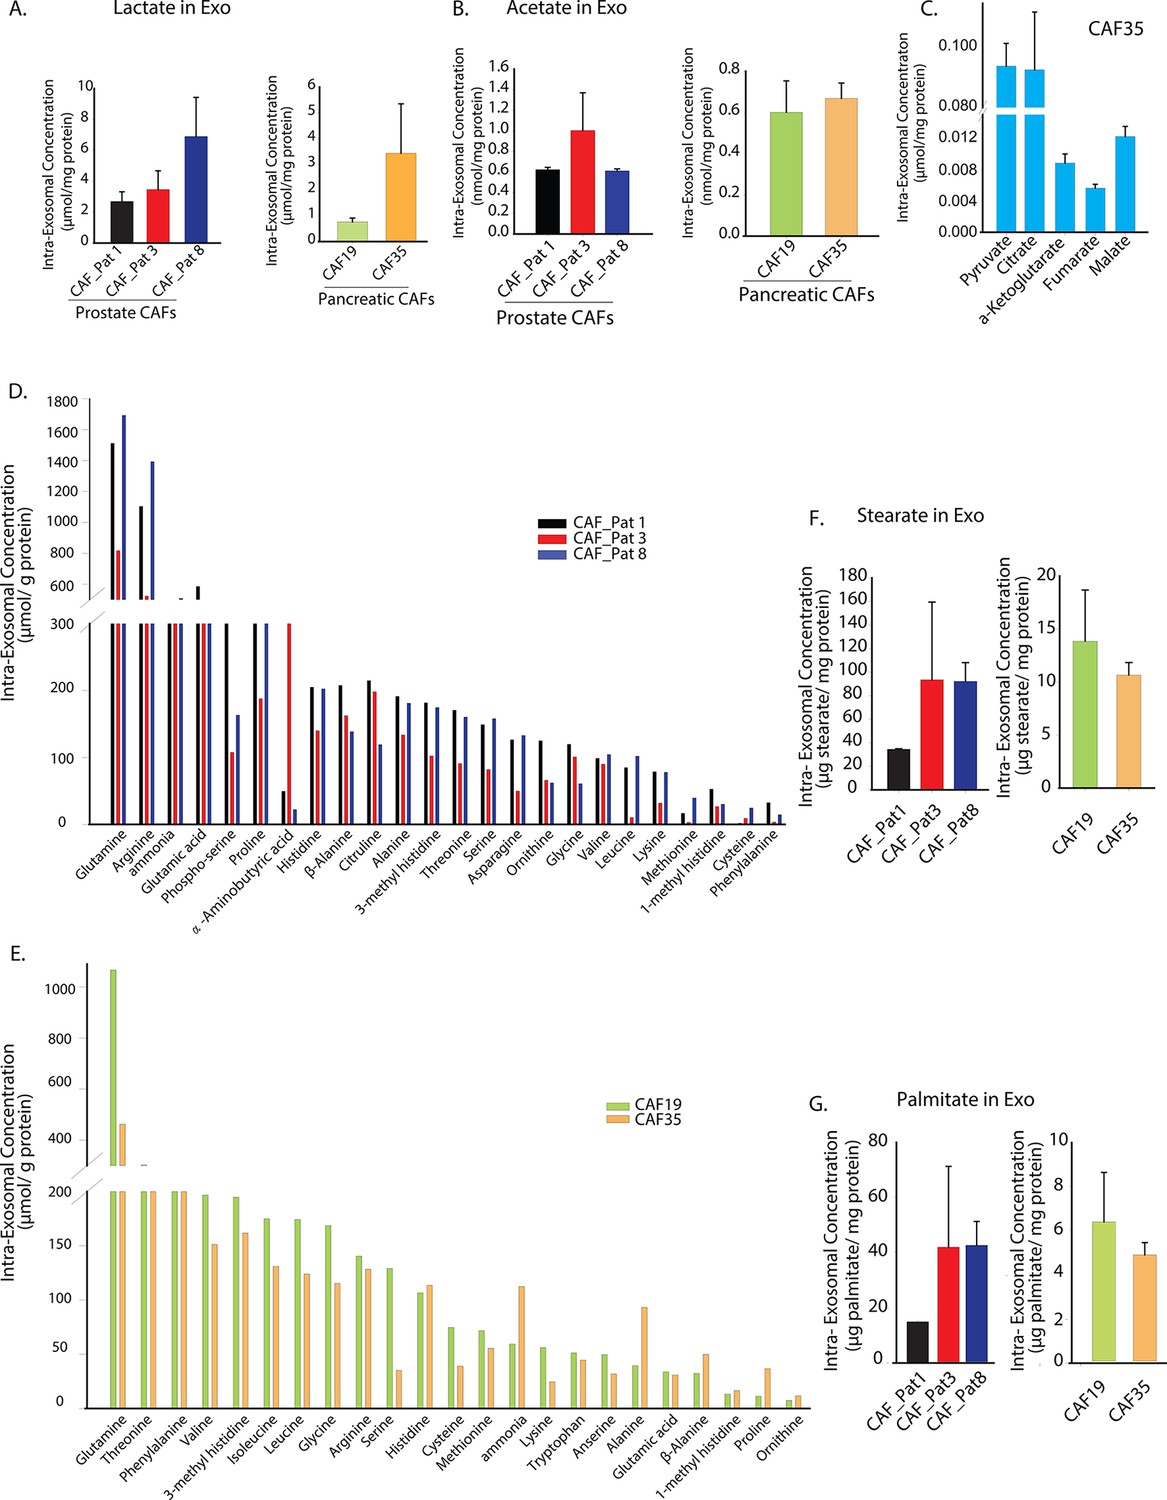
Prostate and pancreatic CAFs secreted exosomes carry metabolite cargo.
Intra-exosomal lactate (A) and acetate (B) concentrations were measured in exosomes isolated from three prostate and two pancreatic CAFs using enzymatic assays. Intra-exosomal metabolites were extracted by methanol/chloroform method and protein concentration was used for normalization. (n=3). (C) TCA cycle metabolites, including pyruvate, citrate, α-ketoglutarate, fumarate and malate were measured using GC-MS in exosomes isolated from pancreatic CAF35. (n=3). (D, E) Amino acids were measured using ultra-high performance liquid chromatography (UPLC) inside CDEs (prostate CAFs: [D]; pancreatic CAFs: [E]). Significant levels of amino acids were detected inside CDEs. (n=3). (F-G) Stearate and palmitate were detected at high levels using GC-MS inside pancreatic and prostate CDEs.(). Data information: data in (A–C), (F–G) are expressed as mean ± SEM.
Figure 6 with 1 supplement
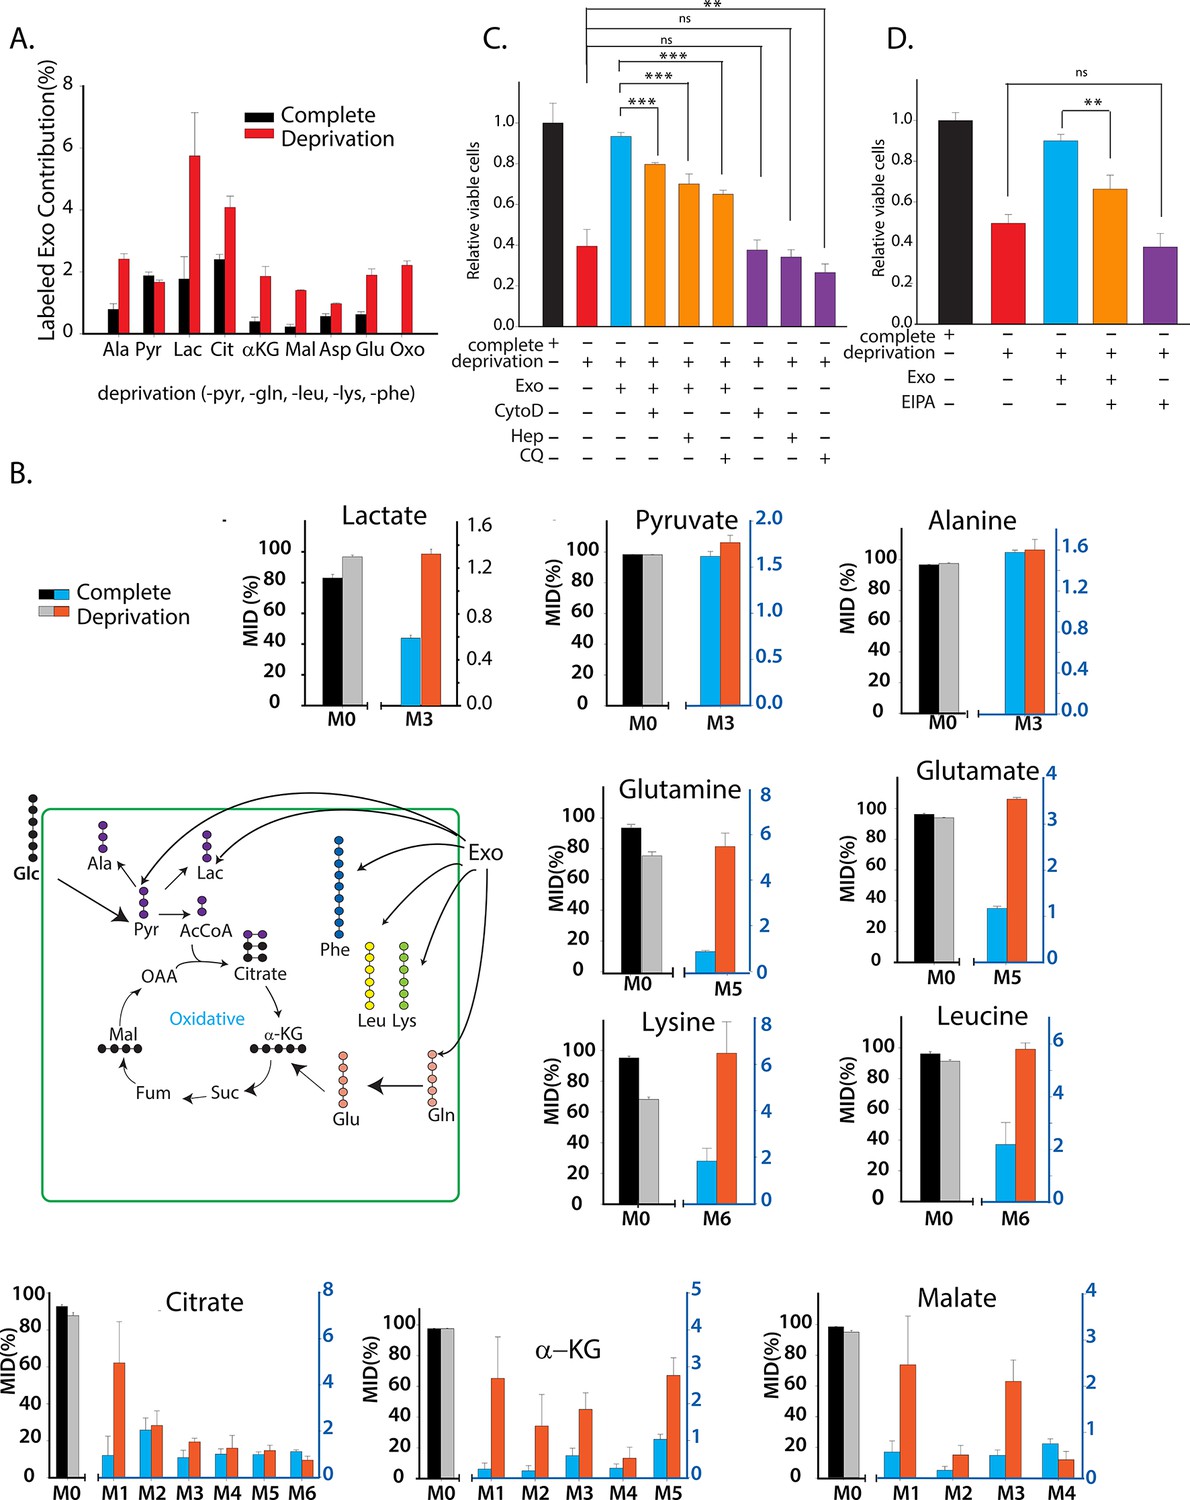
CDEs supply metabolites to cancer cells.
To label metabolites, proteins and lipids in CAFs-secreted exosomes, CAFs were cultured in RPMI with labeled 13C3 pyruvate (pyr), 13C5 glutamine (gln), 13C6 leucine (leu), 13C6 lysine (lys), 13C9-phenylalanine (phe) and U-13C6 glucose. After 72h of CAFs cultures, sufficient labeling was observed in metabolites, proteins and lipids contained in exosomes. Supply of metabolites to prostate cancer cells from labeled CDEs were measured under complete or deprivation medium cultures in culture media without labeling. (A) Percentage labeling (mean enrichment) observed in metabolites inside PC3 cells cultured with labeled CDEs. (n=4). Mean enrichment is calculated as . where is number of carbons in the metabolite and is abundance of (M+i) isotopologue (B) Mass fraction of heaviest labeled isotopologues of TCA cycle metabolites enriched by labeled CDEs, in prostate cancer cells cultured under complete or nutrient-deprived (without lys, phe, gln, pyr, leu) unlabeled medium (n=4). (C) Effect of CDEs on PC3 cell viability under deprivation (without lys, phe, gln, pyr, leu) conditions and exosome uptake inhibitors. CDEs rescue loss of PC3 cell proliferation under deprivation medium. CytoD, (1.5 μg/ml), heparin(50 μg/ml), and CQ (chloroquine, 20 μM) inhibited this rescue of viability under deprivation conditions n=10. (D) EIPA(25 μM) inhibited rescue of PC3 viability by CDEs under deprivation conditions, (n≥7). Data information: data are expressed as mean ± SEM,*p<0.05,**p<0.01, ***p<0.001.
Figure 6—figure supplement 1
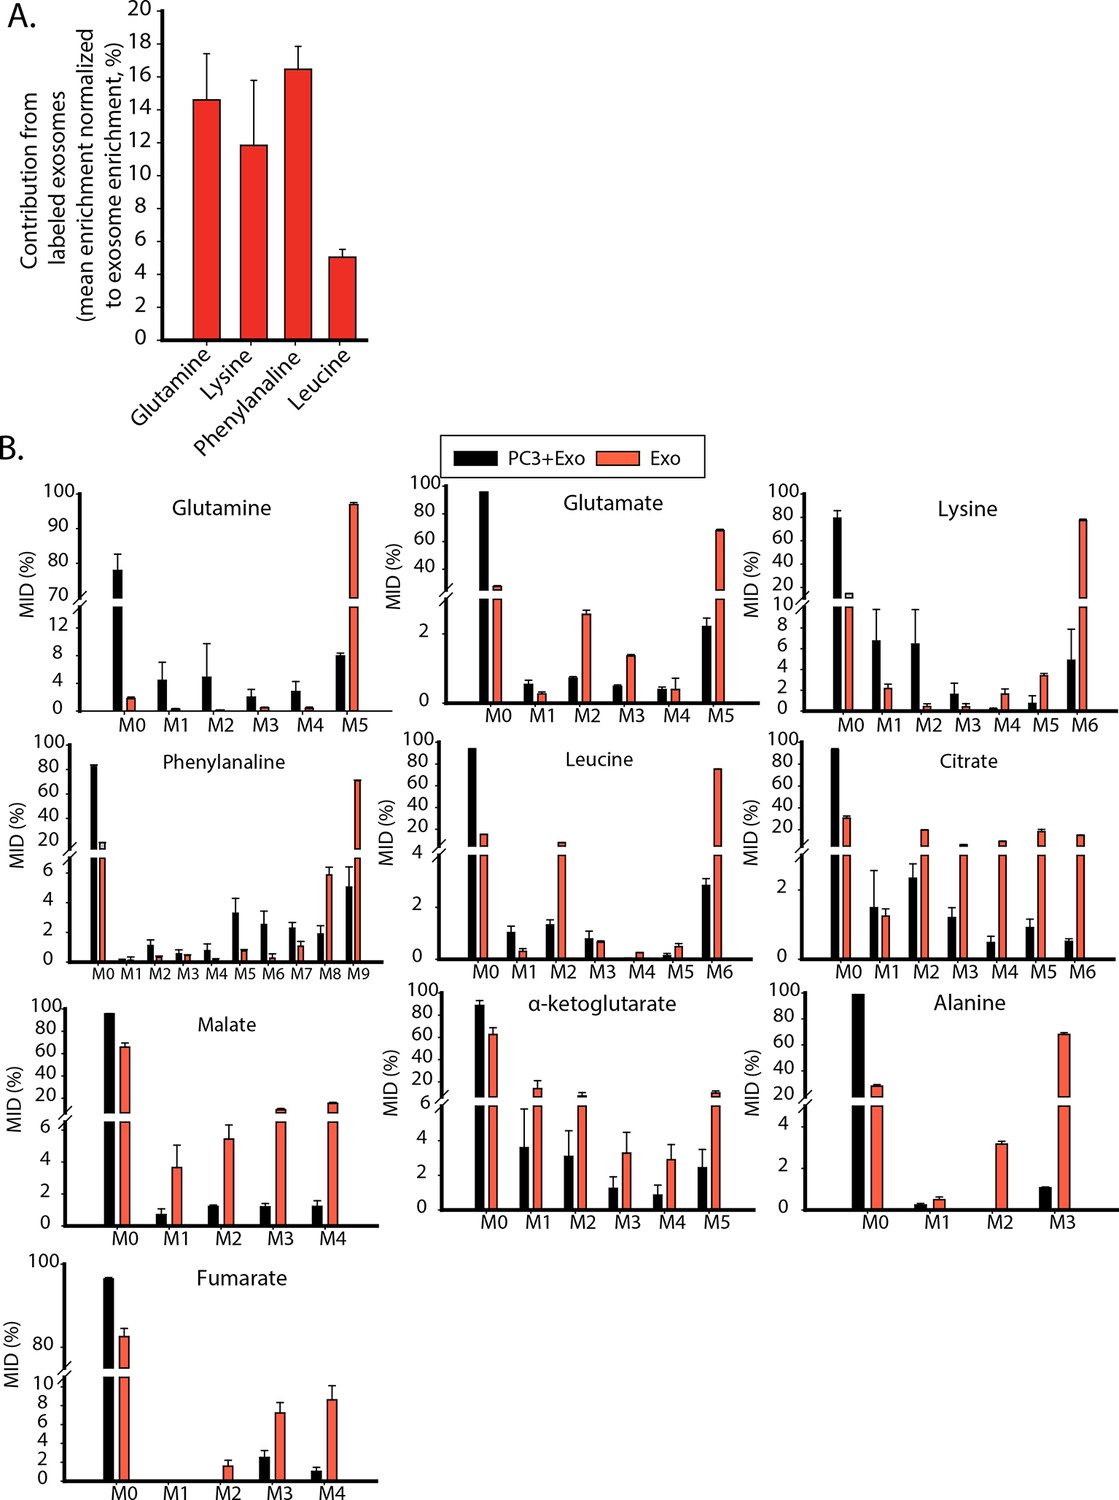
Contribution of metabolites from labeled exosomes to PC3 cells.
(A) Mean enrichment after natural abundance correction is calculated for amino acids not synthesized by PC3 cells. Contribution of these metabolites from exosomes to PC3 cells are estimated by normalizing mean enrichment in PC3 with enrichment in labeled exosomes n=4. (B) Mass isotopologue distributions of amino acids and central carbon metabolites were measured by GC-MS in labeled exosomes (Exo) and PC3 cells cultured with labeled exosomes (PC3+Exo) in deprivation condition (n=3). Data information: data are expressed as mean ± SEM,*p<0.05,**p<0.01, ***p<0.001.
Figure 7 with 4 supplements

Pancreatic CDEs' metabolic reprogramming of pancreatic cancer cells is Kras independent.
(A) Effect of pancreatic CDEs on pancreatic cancer cell viability under nutrient deprivation (without lys, phe, gln, pyr, leu) conditions. CDEs rescue loss of both wild-type and activated Kras expressing pancreatic cancer cells proliferation under deprivation conditions. Viability of cancer cells with and without exosomes in deprivation condition was measured after 48 hr (n=10). (B,C) Heparin inhibit exosomes uptake and thus inhibit the rescue of proliferation by exosomes under nutrient deprived conditions. Heparin (50μg/ml) disrupts receptor-mediated endocytosis. Before adding exosomes, heparin was added to wells for incubation for at least 0.5 hr (n=5). (D) Basal OCR were measured for BxPC3 and MiaPaCa-2, pancreatic cancer cell lines cultured with pancreatic CAFs (CAF19) exosomes. OCR of both BxPC3 and MiaPaCa-2 were downregulated by CAF19 exosomes. (n=10). Maximal OCR and reserve OCR of BxPC3 and MiaPaCa-2 were downregulated by CAF19 exosomes (n=10). (E) ECAR of both BxPC3 and MiaPaCa-2 were upregulated by CAF19 exosomes (n=10). (F) Relative lactate abundances were measured using GC-MS in BxPC3 and MiaPaCa-2 cells cultured with and without CAF19-secreted exosomes for 24 hr (n=4). (G) Percentage of glucose contribution to α-ketoglutarate in BxPC3 and MiaPaCa-2 cells with and without CAF19-secreted exosomes (n=4). (H) Pancreatic CDEs increased reductive glutamine metabolism in wild-type and activated Kras expressing pancreatic cancer cells. Oxidative contribution to citrate is determined by calculating M4 citrate percentage; reductive contribution to citrate is determined by M5 citrate percentage (n=4). (I) Ratio of oxidative to reductive glutamine contribution to citrate in wild-type and activated Kras expressing pancreatic cancer cells with CAF19-secreted exosomes (n=4). (J) Mass isotopologue distributions (MID) of glutamate, α-ketoglutarate, citrate, malate, and fumarate in BxPC3 and MiaPaCa-2 cancer cells cultured with and without CAF19-secreted exosomes in U-13C5 glutamine (n=4). Higher reductive glutamine metabolism is detected through higher M5 citrate, M3 fumarate, M3 malate, M3 aspartate in pancreatic cancer cells cultured in presence of exosomes. Reductive glutamine metabolism (n=4). Data information: data in (A) are expressed as mean ± SD, data in (B–J) are expressed as mean ± SEM, *p<0.05, **p<0.01, ***p<0.001. Figure 7—figure supplements 1–4.
Figure 7—figure supplement 1
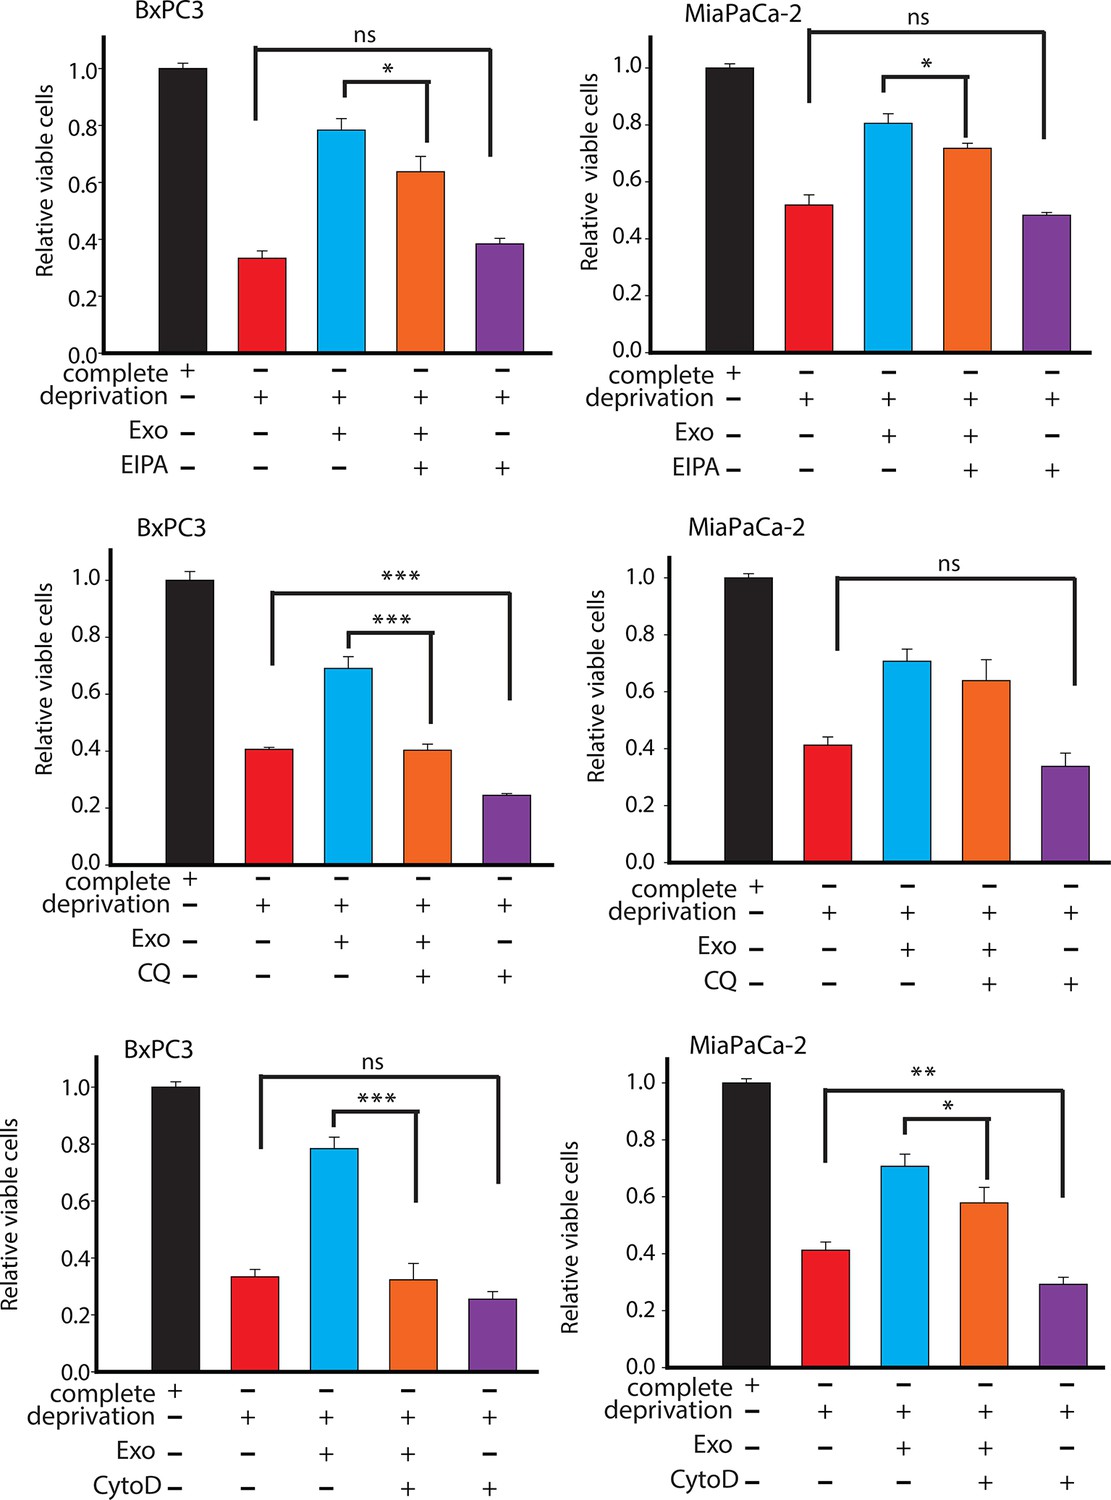
Effect of drugs inhibiting CDEs uptake and utilization on BxPC3 or MiaPaCa-2 cell proliferation under deprivation (without lys, phe, gln, pyr, leu) conditions.
EIPA, CytoD, and CQ (chloroquine) inhibited the rescue of proliferation by CDEs under deprivation conditions to different extents. Working concentrations used: EIPA (25 μM), CytoD, (1.5 μg/ml), CQ (chloroquine, 20 μΜ) (n≥7). Data information: data are expressed as mean ± SEM, *p<0.05, **p<0.01, ***p<0.001.
Figure 7—figure supplement 2

Effect of pancreatic CDEs on pancreatic cancer cell proliferation under nutrient deprivation (without lys, phe, gln, pyr, leu) conditions.
CDEs rescue loss of both Kras+ and Kras- expressing pancreatic cancer cell viability under nutrient deprivation conditions. Viability of cancer cells with and without exosomes in deprivation condition was measured after 48 hr (n=3). Data information: data are expressed as mean ± SD, *p<0.05, **p<0.01, ***p<0.001.
Figure 7—figure supplement 3
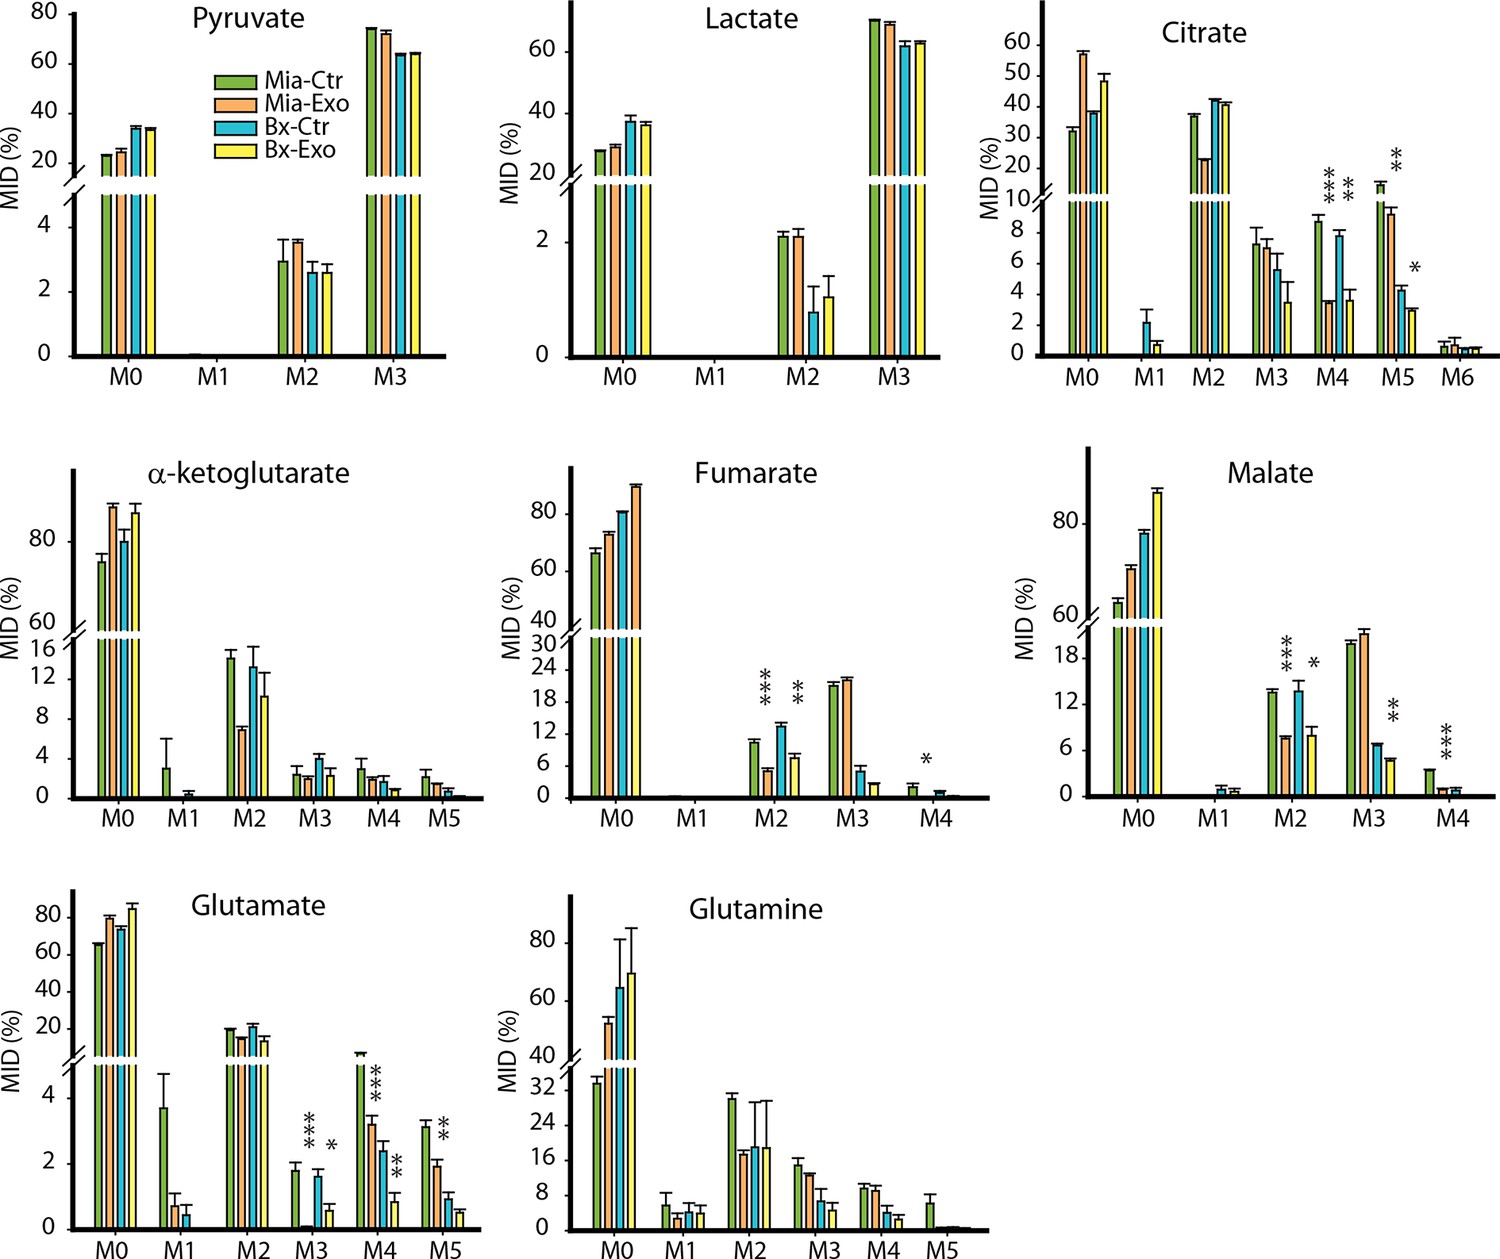
Effect of pancreatic CDEs on glycolysis in pancreatic cancer cells using labeled glucose.
Comparison of mass isotopologue distributions (MIDs) of intracellular lactate, pyruvate, citrate, α-ketoglutarate, fumarate, malate, glutamate in pancreatic cancer cells with or without pancreatic CAF19-derived exosomes. Two pancreatic cancer cell lines (BxPC3 and MiaPaCa-2) and one CAF cell line (CAF19) were used for isotope tracing experiments. CAF19 cells were cultured for 48h to obtain supernatants for exosomes isolation. Pancreatic cancer cells were cultured for 24 hr to obtain intracellular metabolites for GC-MS measurement. Data information: data are expressed as mean ± SEM, *p<0.05, **p<0.01, ***p<0.001.
Figure 7—figure supplement 4
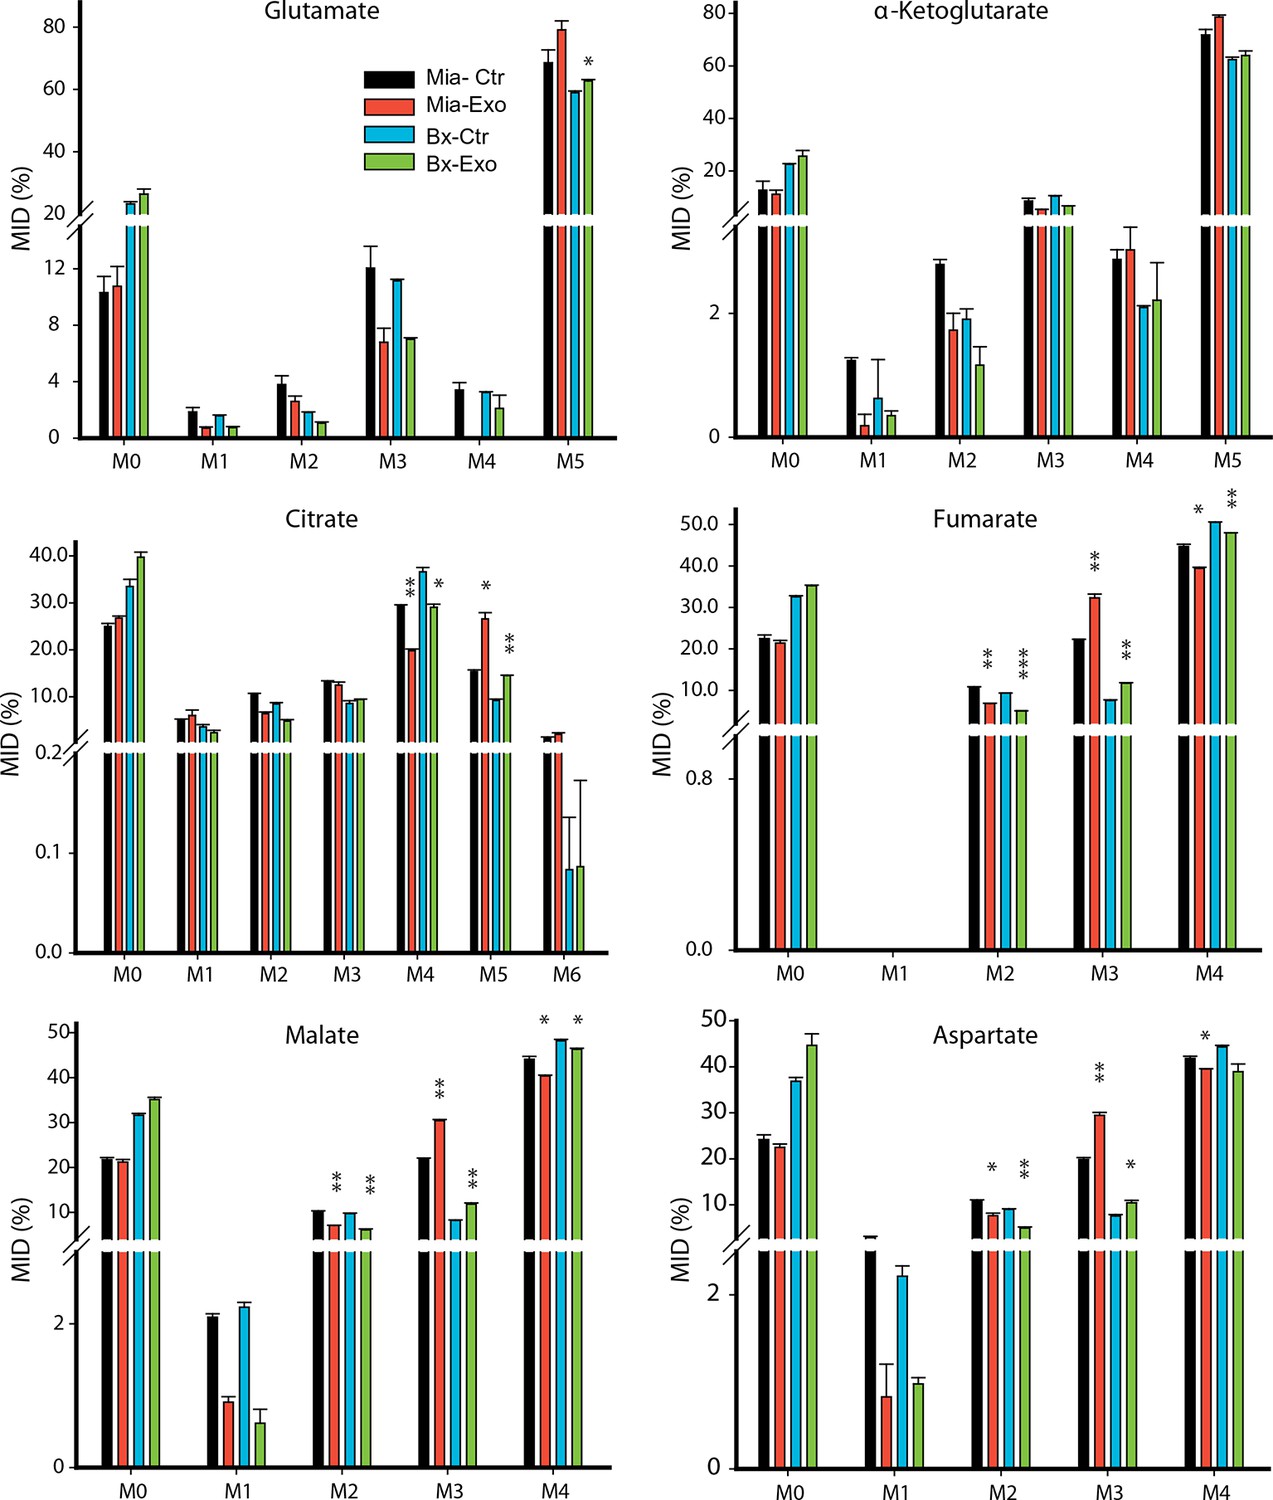
Effect of pancreatic CDEs on glutamine metabolism in pancreatic cancer cells using labeled glutamine.
Comparison of mass isotopologue distributions (MIDs) of intracellular citrate, α-ketoglutarate, fumarate, malate, glutamate and aspartate in pancreatic cancer cells with or without pancreatic CAF19-derived exosomes. Two pancreatic cancer cell lines (BxPC3 and MiaPaCa-2) and one CAF cell line (CAF19) were used for isotope tracing experiments. CAF19 cells were cultured for 48 hr to obtain supernatants for exosomes isolation. Pancreatic cancer cells were cultured for 24 hr to obtain intracellular metabolites for GC-MS measurement. Data information: data are expressed as mean ± SEM, *p<0.05, **p<0.01, ***p<0.001.
Figure 8
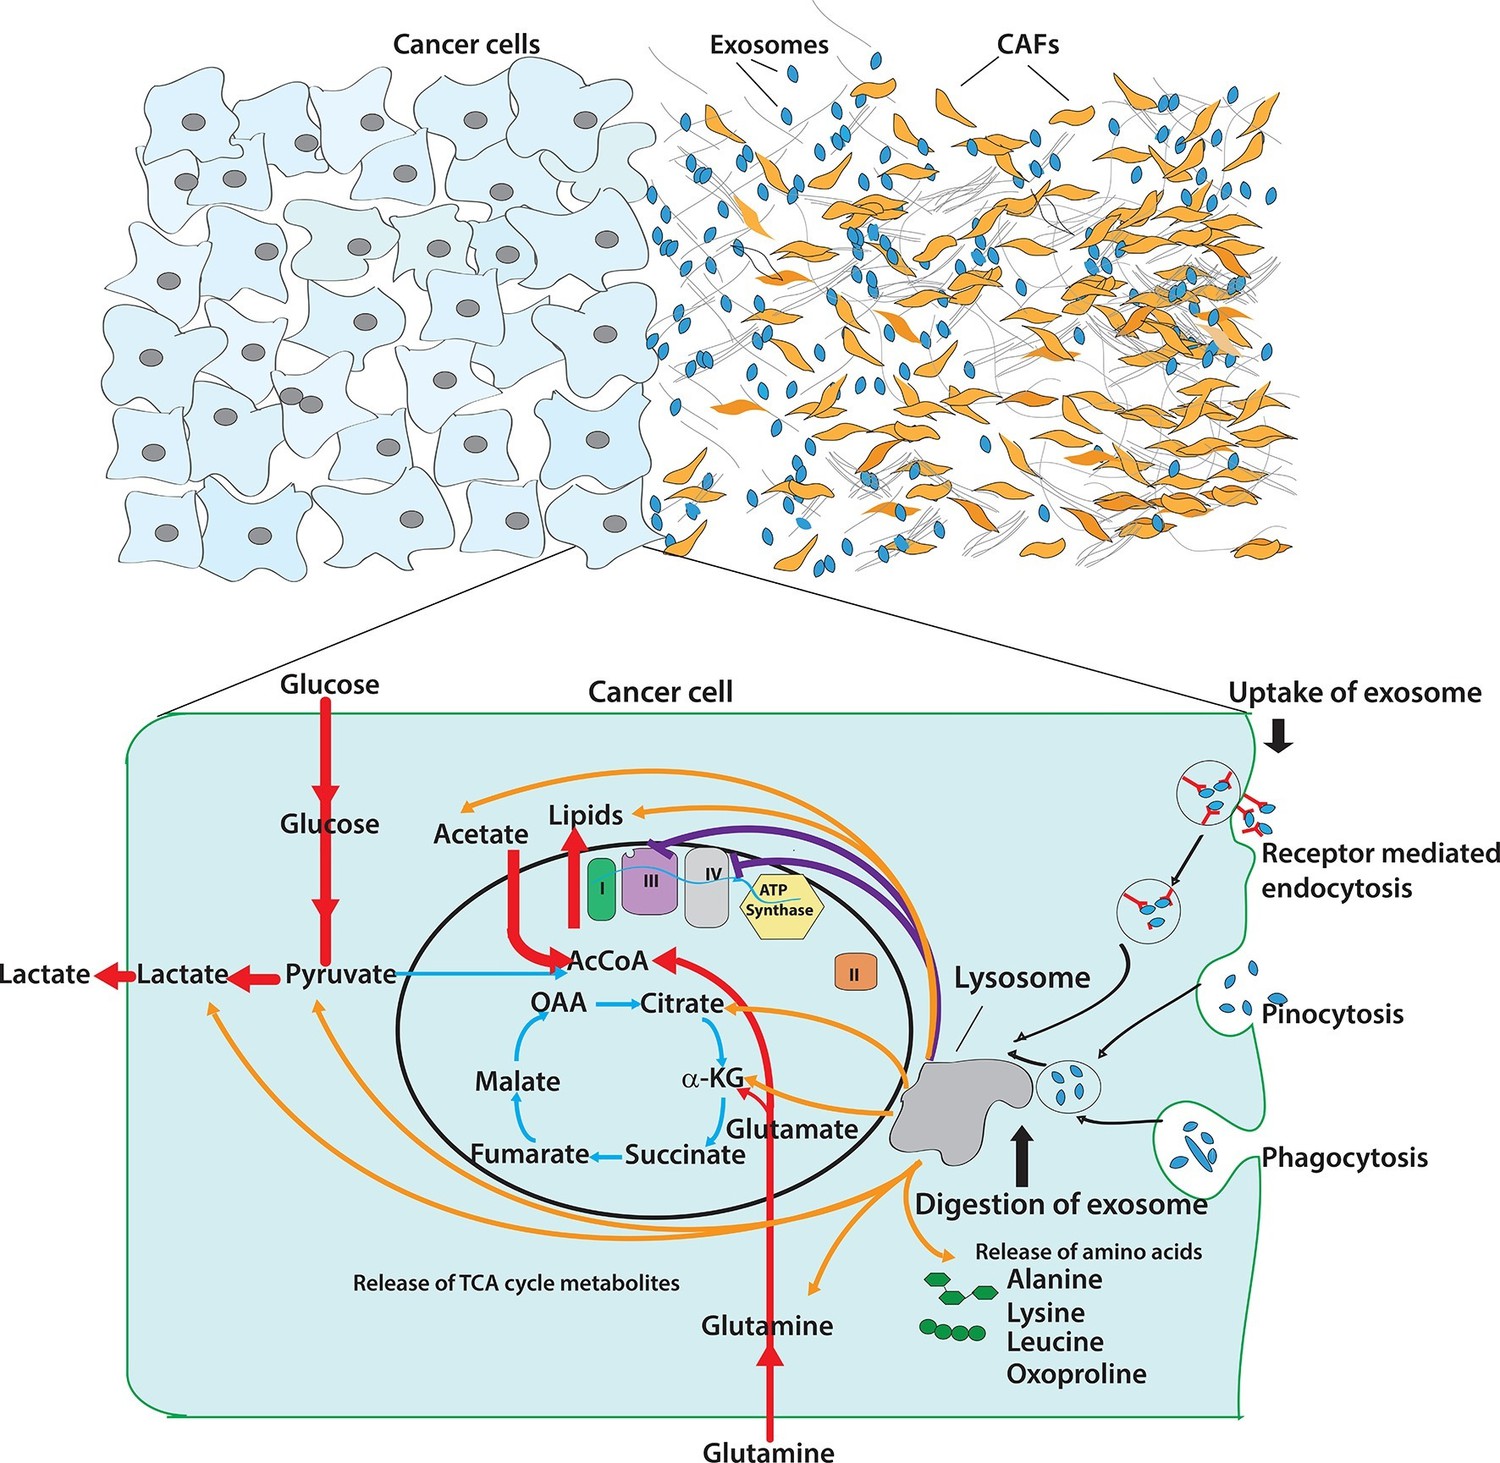
Pleiotropic regulation of cancer cell metabolism by CDEs.
Schematic shows the metabolic regulation of CDEs in cancer cells through inhibition of oxidative phosphorylation and contribution of metabolite cargo. This regulation leads to significant increase of reductive glutamine metabolism in cancer cells in presence of exosomes. CDEs are also cargo of amino acids, TCA cycle metabolites, and lipids. In nutrient starved TME metabolites derived from exosomes enrich cancer cells with biosynthesis building blocks and thereby promote tumor growth.
Author response image 1
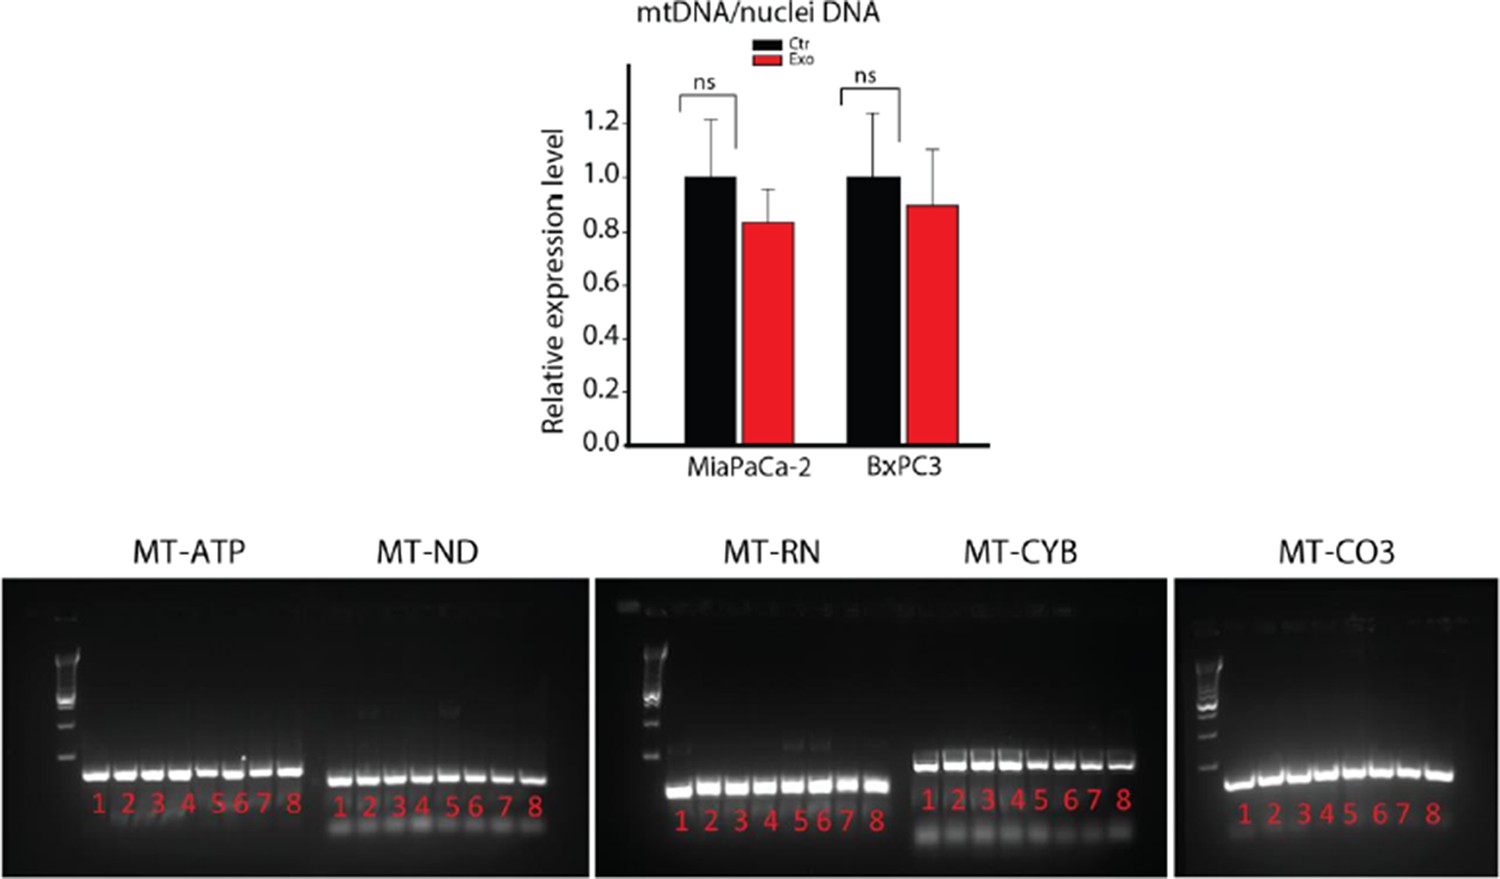
DNA extracted from whole CAFs (samples 1-4) or CAF-derived exosomes (samples 5-8) was analyzed for the presence of 5 mitochondrial genes, MT-ATP6, MT-ND5, MT-RNR1, MT-CYB and MT-CO3 by PCR.
MT-ATP6: Mitochondrially Encoded ATP Synthase 6; MT-ND5: Mitochondrially Encoded NADH Dehydrogenase 5; MT-RNR1: Mitochondrially Encoded 12S RNA; MT-CYB: Mitochondrially Encoded Cytochrome B; MT-CO3: Mitochondrially Encoded Cytochrome C Oxidase III.
Download links
A two-part list of links to download the article, or parts of the article, in various formats.
Downloads (link to download the article as PDF)
Open citations (links to open the citations from this article in various online reference manager services)
Cite this article (links to download the citations from this article in formats compatible with various reference manager tools)
Tumor microenvironment derived exosomes pleiotropically modulate cancer cell metabolism
eLife 5:e10250.
https://doi.org/10.7554/eLife.10250


