Bordetella adenylate cyclase toxin is a unique ligand of the integrin complement receptor 3
- Institute of Microbiology of the Czech Academy of Sciences, Czech Republic
- Charles University in Prague, Czech Republic
- Institute of Biotechnology of the Czech Academy of Sciences, Czech Republic
Figures
Figure 1 with 3 supplements
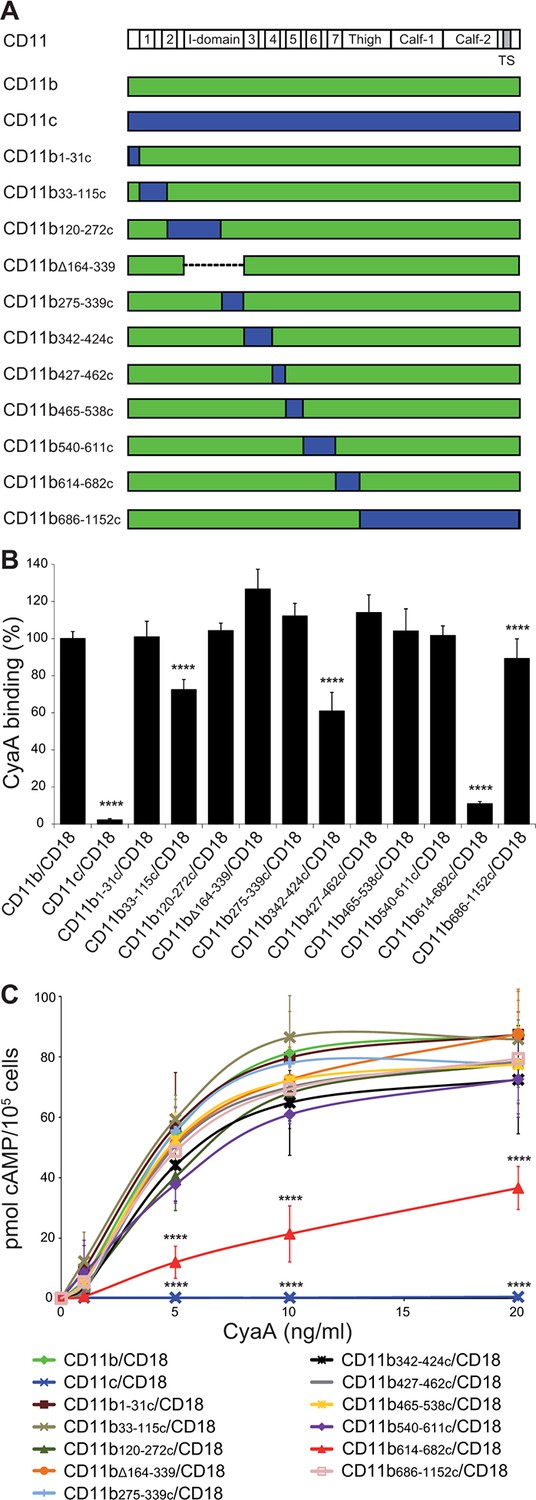
Residues 614-682 of CD11b are crucial for CyaA binding and penetration into cells.
(A) The CD11 subunits of β2 integrins consist of a long N-terminal extracellular domain, a single-pass transmembrane segment (TS) and a short C-terminal cytoplasmic tail, respectively. The N-terminal part of the extracellular domain harbors seven β-sheet repeats (numbers in boxes), forming a β-propeller domain, which is followed by the thigh, calf-1 and calf-2 domains. The I-domain segment, inserted between repeats 2 and 3 of the β-propeller domain, plays a critical role in interaction of the I-domain-containing integrins with their endogenous ligands. To map the CyaA binding site on the CD11b subunit, segments of CD11b (green) were systematically replaced with their CD11c counterparts (blue). In the CD11bΔ164-339 molecule, the entire I domain of CD11b was deleted. (B) 2x10⁵ CHO cells expressing integrin molecules were incubated with 2 µg/ml of CyaA-biotin, the surface-bound toxin was labeled with streptavidin-PE and the cells were analyzed by flow cytometry. CyaA binding was expressed as percentage of toxin binding to CHO cells expressing the native form of CD11b/CD18. Each bar represents the mean value with SD of at least five independent experiments performed in duplicate or triplicate. Significantly reduced binding of CyaA to mutant integrins in comparison with intact CD11b/CD18 is indicated (****, p<0.0001; ANOVA). (C) 1x10⁵ CHO cells expressing integrin molecules were incubated with various concentrations of CyaA and the amounts of accumulated cAMP were determined in cell lysates by ELISA. Each point represents the mean value ± SD of at least seven determinations from at least three independent experiments. Significant differences between mean values of cAMP intoxication of cells expressing intact CD11b/CD18 and mutant integrins are shown (****, p<0.0001; ANOVA).
Figure 1—figure supplement 1

Expression of the CD18 subunit on the surface of CHO cells.
A CHO cell line was transfected with a plasmid construct encoding CD18 and the positively transfected cells were selected using a cell sorter. The expression of the CD18 subunit (violet) on the cell surface was examined by flow cytometry upon staining of 2x10⁵ cells with the anti-CD18 mAb MEM-48. CHO cells transfected with an empty vector were processed in parallel and used as negative control (grey). A typical flow cytometry histogram from one representative binding experiment out of five performed is given. RFI, relative fluorescence intensity.
Figure 1—figure supplement 2
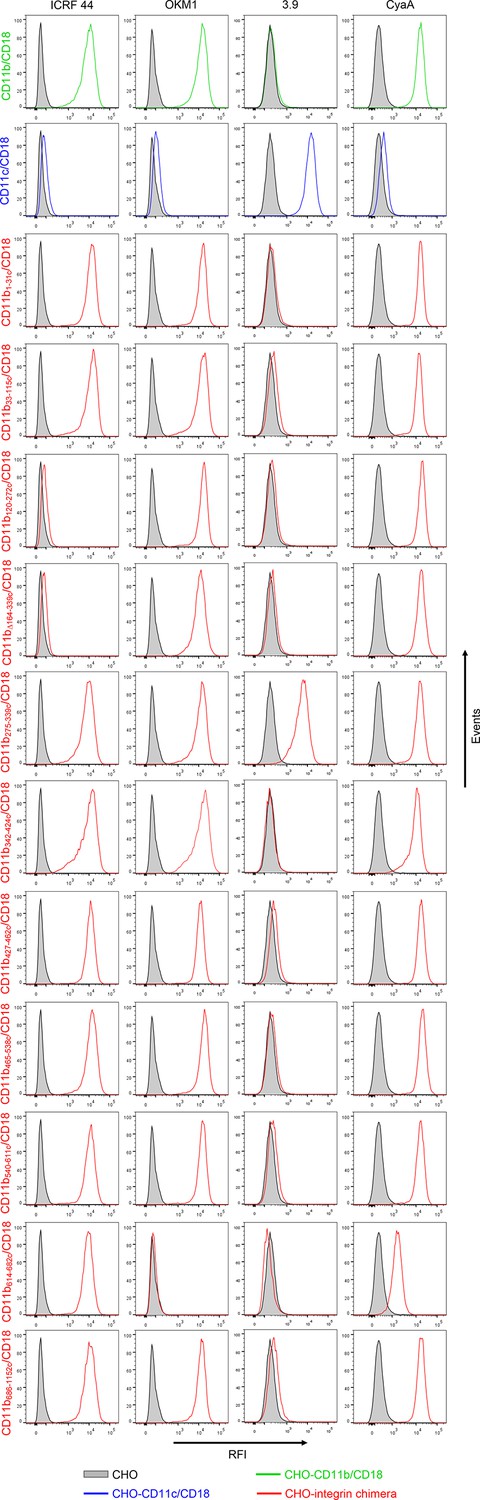
Binding of mAbs and CyaA to CHO cells expressing CD11b/CD18, CD11c/CD18 and the CD11b-CD11c/CD18 chimeras.
A CHO cell line stably expressing intact CD18 subunit was transfected with plasmid constructs encoding CD11b, CD11c, or their respective chimeric variants. Cells stably expressing the integrin molecules were selected using a cell sorter. The expression levels of CD11b/CD18 (green), CD11c/CD18 (blue) and CD11b-CD11c/CD18 chimeras (red) on the cell surface were examined by flow cytometry upon staining of 2x10⁵ cells with the ICRF 44 mAb (recognizing the I-domain of CD11b (left panels)), the OKM1 mAb (recognizing segment 614-682 of CD11b (middle left panels)), or the 3.9 mAb (recognizing the I-domain of CD11c (middle right panels)). The cells were also analyzed for capacity to bind CyaA: 2x10⁵ transfected cells were incubated with 2 μg/ml of CyaA-biotin, the surface-bound toxin was labeled with streptavidin-PE and the cells were analyzed by flow cytometry (right panels). A typical histogram from one representative binding experiment out of five performed is shown for binding of the respective mAb (ICRF 44, OKM1 or 3.9), or CyaA to each integrin variant. CHO cells expressing no β2 integrin (transfected with empty vectors) were processed in parallel and used as negative control (grey). RFI, relative fluorescence intensity.
Figure 1—figure supplement 3
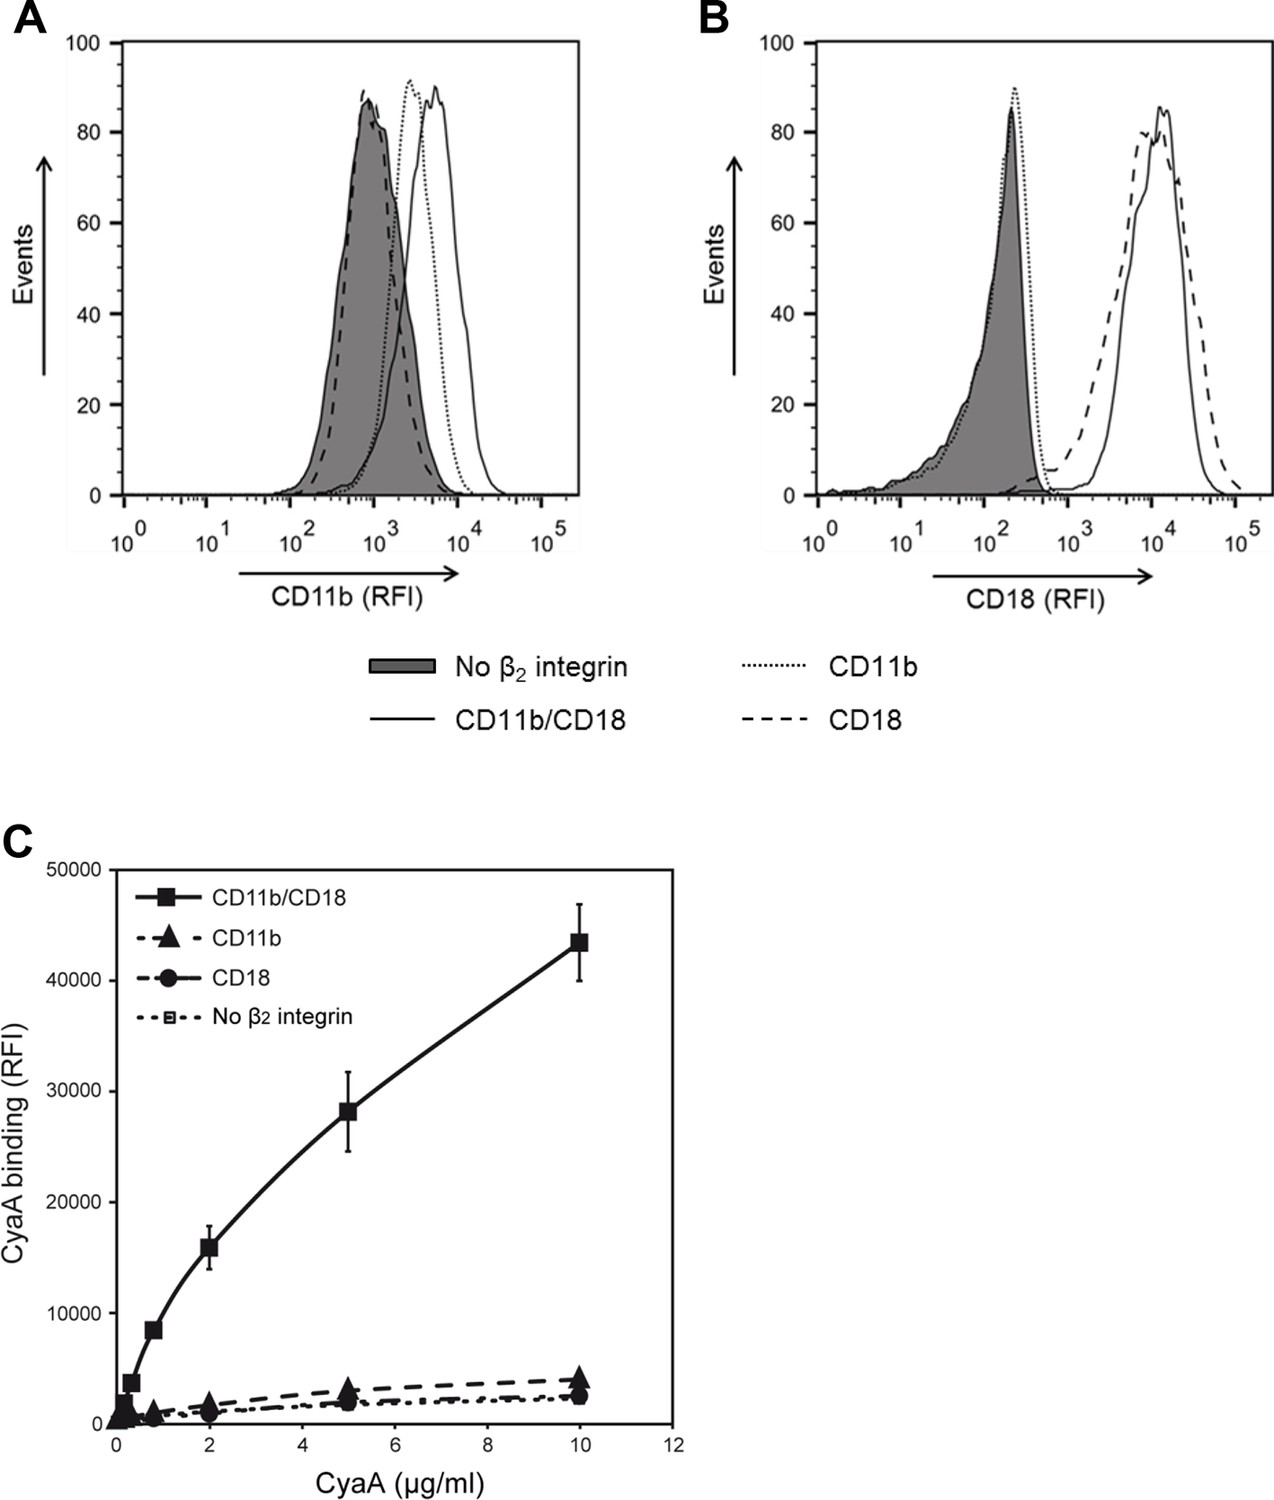
CyaA recognizes CD11b only in the heterodimeric complex with CD18.
(A and B) 1x10⁵ CHO cells stably expressing intact dimeric CD11b/CD18 or its individual monomeric subunits CD11b or CD18 were stained with the anti-CD11b mAb OKM1 (A) or the anti-CD18 mAb MEM-48 (B) and analyzed by flow cytometry. A typical overlay flow cytometry histogram from one representative binding experiment out of three performed is given. (C) 1x10⁵ integrin-transfected CHO cells were incubated with different concentrations of Dy647-labeled CyaA and the cells were analyzed by flow cytometry. CyaA binding data were deduced from the mean fluorescence intensities of three independent experiments and each point represents the mean value ± SD. Binding of CyaA to cells expressing CD11b, CD18 or no β2 integrin was at all measured toxin concentrations significantly lower than toxin binding to cells expressing intact CD11b/CD18 (****, p<0.0001; ANOVA). CHO cells transfected with an empty vector and expressing no β2 integrin were processed in parallel and used as negative control (all panels). RFI, relative fluorescence intensity.
Figure 2 with 2 supplements
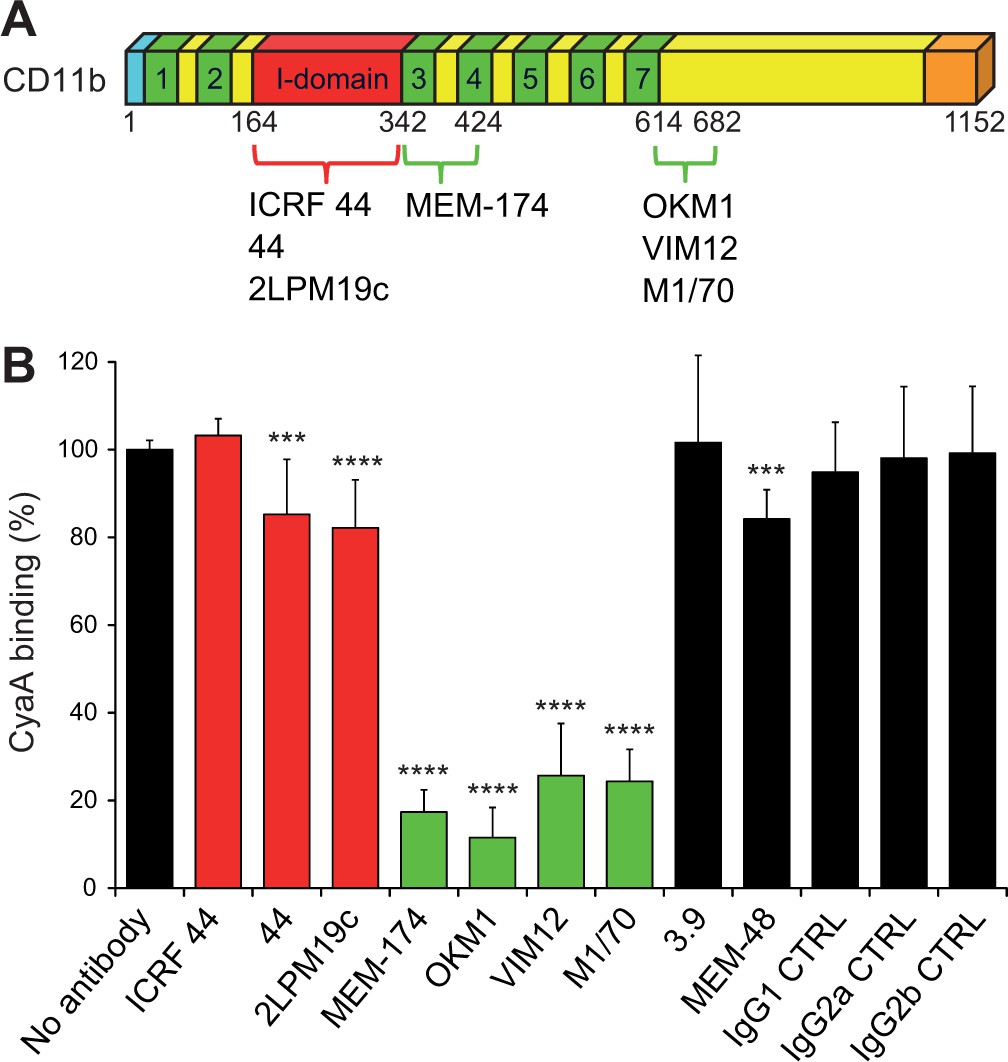
Antibodies recognizing the same segments of CD11b as CyaA block its binding to CR3.
(A) Schematic representation showing the binding segments of a set of mAbs in the CD11b subunit of CR3, which were mapped by flow cytometry. The ICRF 44, 44 and 2LPM19c mAbs recognize the I-domain of CD11b, the major ligand binding site of CR3. The MEM-174, or OKM1, VIM12 and M1/70 mAbs target amino acid segments 342-424 or 614-682 of CD11b, respectively, which are important for CyaA binding. (B) 2x10⁵ CHO-CD11b/CD18 cells were preincubated without or with saturating concentrations of different mAbs and then incubated with 2 µg/ml of CyaA-biotin. Surface-bound CyaA-biotin was labeled with streptavidin-PE and the cells were analyzed by flow cytometry. CyaA binding was expressed as percentage of toxin binding to CHO-CD11b/CD18 cells treated without mAb. Each bar represents the mean value with SD of at least eight determinations from at least three independent experiments. Significant differences between mean values of CyaA binding to mAb-untreated cells and cells treated with different mAbs are indicated (***, p<0.001; ****, p<0.0001; ANOVA). 3.9, CD11c-specific mAb; MEM-48, CD18-specific mAb; IgG1, IgG2a and IgG2b, isotype control mAbs.
Figure 2—figure supplement 1
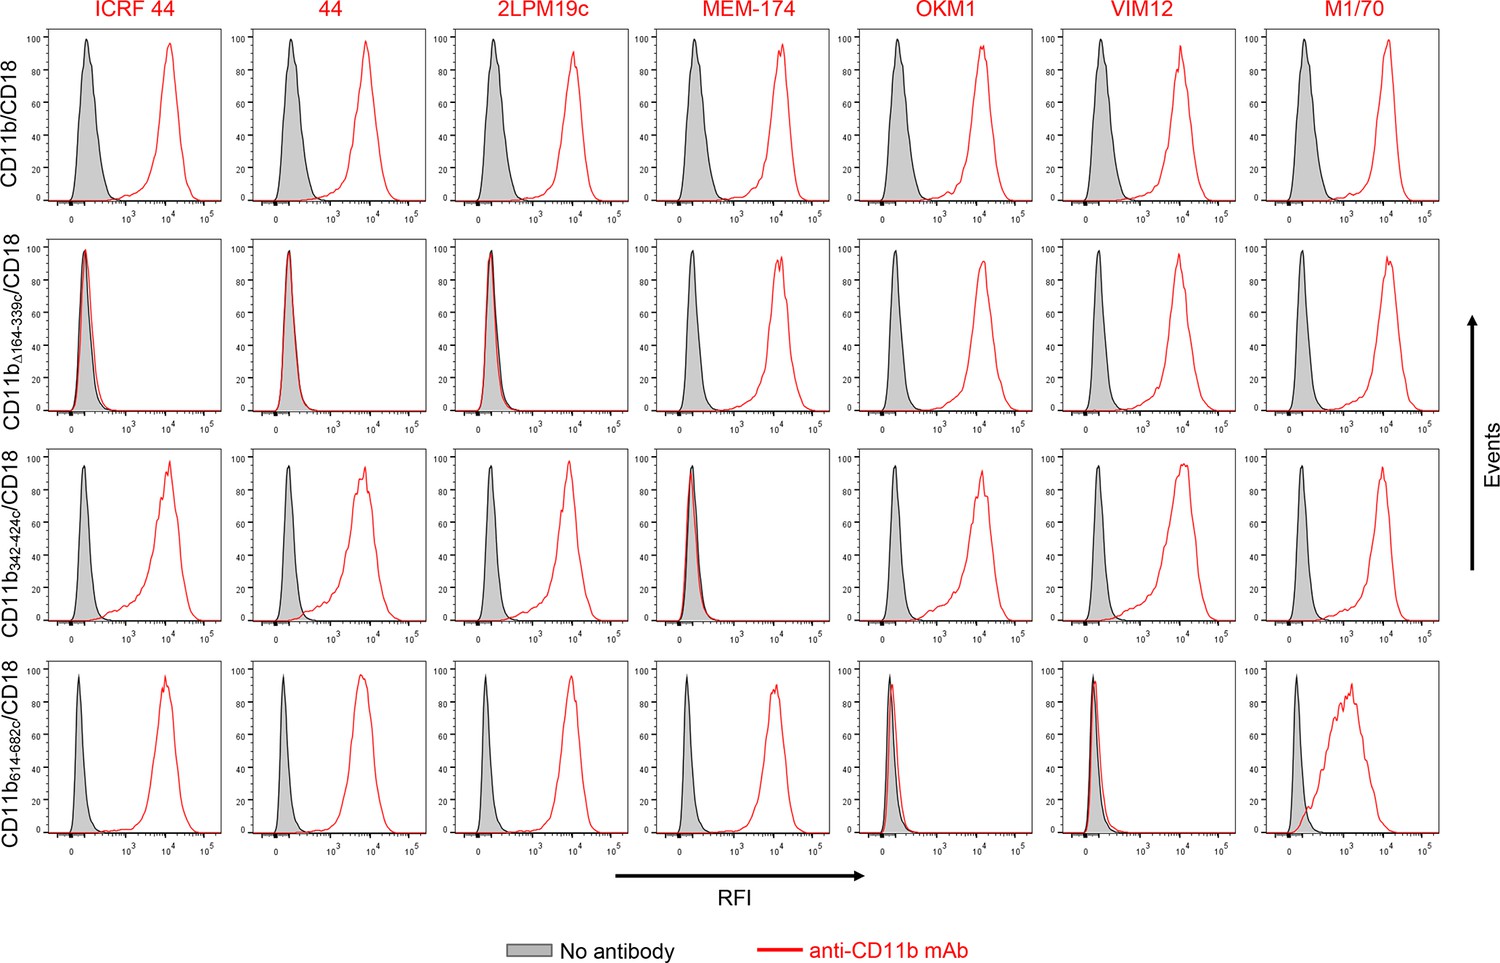
Flow cytometry profiles of anti-CD11b mAbs on CHO cells expressing the integrin CD11b/CD18 and its mutant variants.
2x10⁵ CHO cells stably expressing intact CD11b/CD18, or the mutant variant lacking the I-domain (CD11bΔ164-339/CD18), or two CR3-CR4 chimeras (CD11b342-424c/CD18 and CD11b614-682c/CD18) with a strongly reduced capacity to bind CyaA were left unstained (grey) or were stained with a panel of anti-CD11b mAbs (red). The cells were analyzed for their capacity to bind mAbs by flow cytometry and typical overlay histograms from one representative binding experiment out of five performed are shown. RFI, relative fluorescence intensity. The data confirmed that the ICRF 44, 44 and 2LPM19c mAbs recognize the I-domain of CR3 and revealed that the MEM-174 mAb has an epitope in the segment 342-424 of CD11b and the OKM1, VIM12 and M1/70 mAbs target the segment 614-682 of CD11b.
Figure 2—figure supplement 2
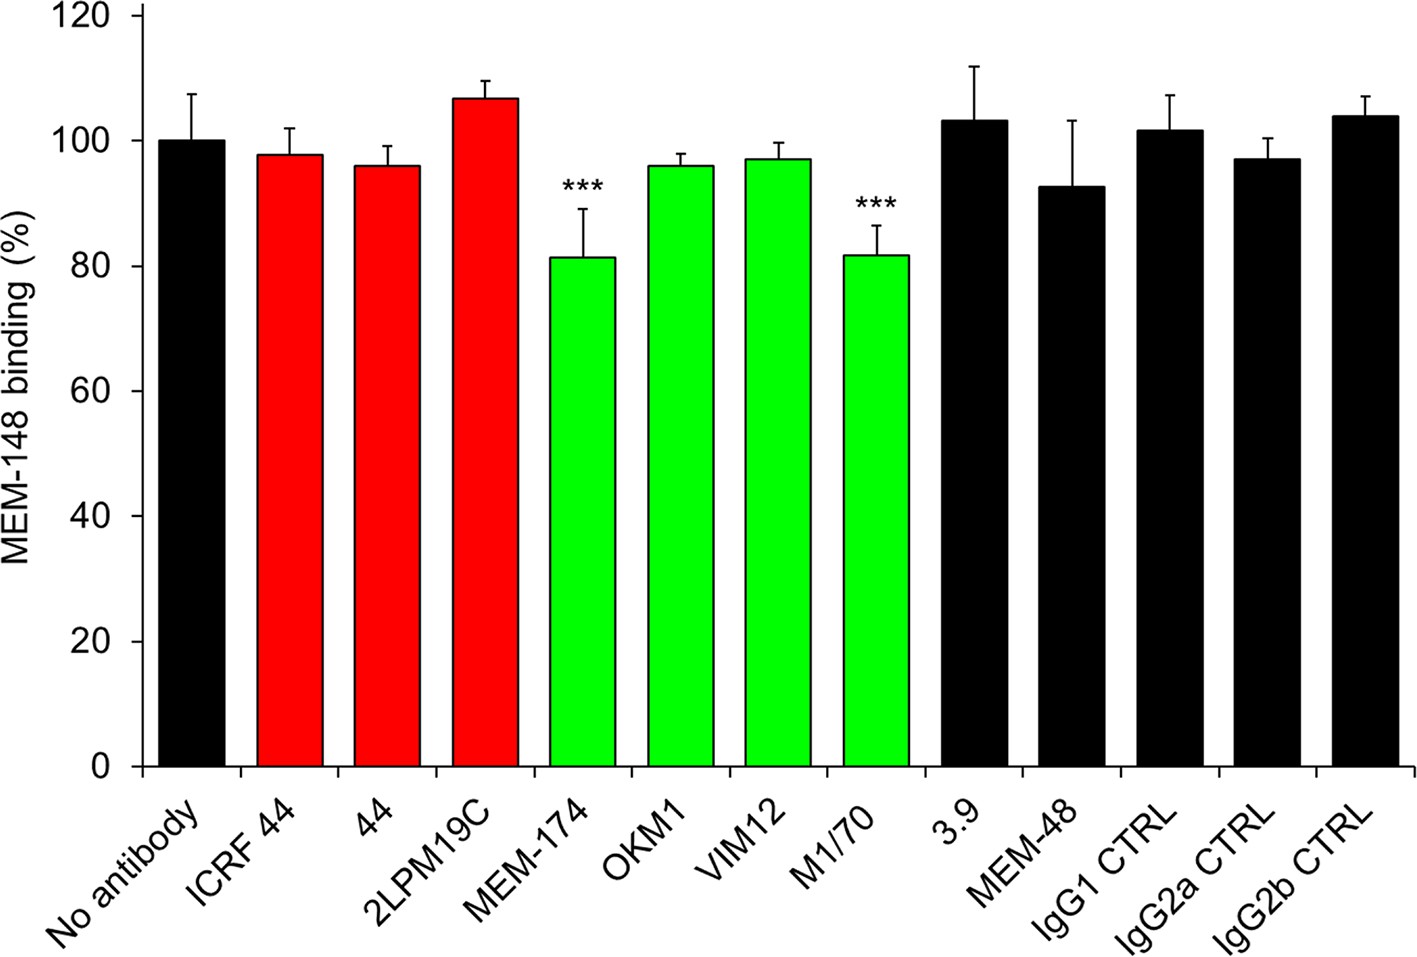
Anti-CD11b antibodies do not activate CR3.
2x10⁵ CHO-CD11b/CD18 cells were preincubated without or with saturating concentrations of the indicated anti-CD11b mAbs and the CR3 was stained with the integrin activation-reporting anti-CD18 mAb MEM-148. MEM-148 binding was determined by flow cytometry and expressed as percentage of MEM-148 binding to CHO-CD11b/CD18 cells treated without mAb. Each bar represents the mean value with SD of two independent experiments performed in duplicate. Significant differences between mean values of MEM-148 binding to mAb-untreated cells and cells treated with different anti-CD11b mAbs are indicated (***, p<0.001; ANOVA).
Figure 3 with 1 supplement
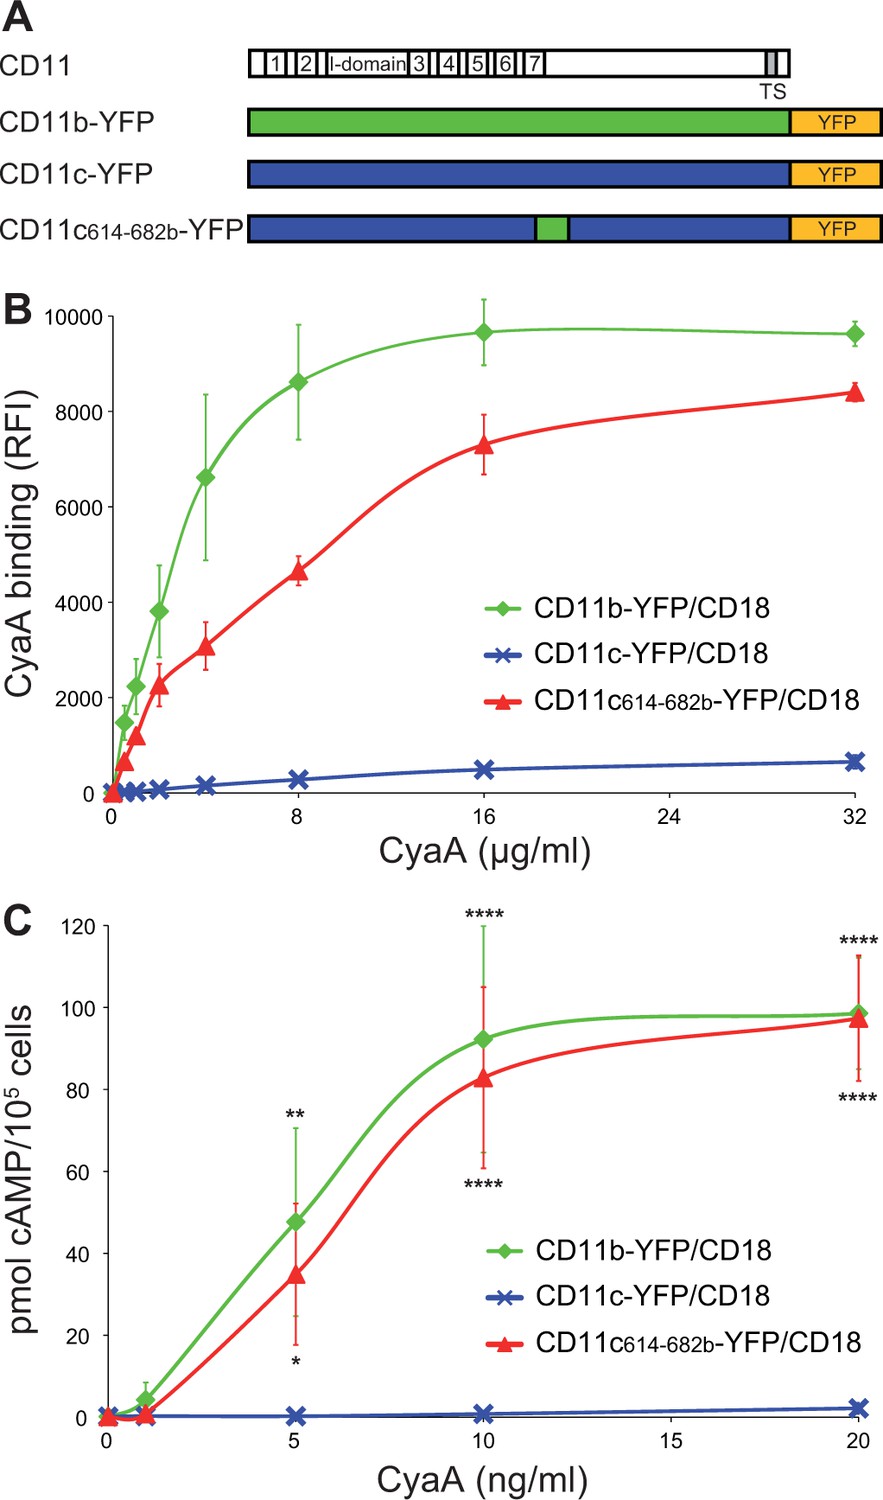
Residues 614 to 682 of CD11b confer CyaA binding to CD11c.
(A) Schematic representation of the CD11c subunit (blue) with residues 614–682 replaced by the corresponding residues of CD11b (green). All CD11 molecules were C-terminally fused to yellow fluorescent protein (YFP) to allow quantification of expression. (B) 2x10⁵ CHO cells expressing integrin molecules were incubated with different concentrations of CyaA-biotin and the surface-bound toxin was labeled with streptavidin-PE. The cells were analyzed by flow cytometry and mean fluorescence intensities of CyaA binding were plotted against the concentrations of CyaA. Each point represents the mean value ± SD of two independent experiments performed in triplicate. CyaA binding to cells expressing CD11c614-682b-YFP/CD18, or CD11b-YFP/CD18 was at all measured CyaA concentrations significantly higher in comparison with cells expressing intact CD11c-YFP/CD18 (p<0.0001; ANOVA). RFI, relative fluorescence intensity. (C) 1x10⁵ CHO cells expressing integrin molecules were incubated with various concentrations of CyaA and the amounts of accumulated cAMP were determined in cell lysates by ELISA. Each point represents the mean value ± SD of two independent experiments performed in duplicate. Significant differences between mean values of cAMP intoxication of cells expressing CD11c614-682b-YFP/CD18, or CD11b-YFP/CD18 and intact CD11c-YFP/CD18 are shown (*, p<0.05; **, p<0.01; ****, p<0.0001; ANOVA).
Figure 3—figure supplement 1
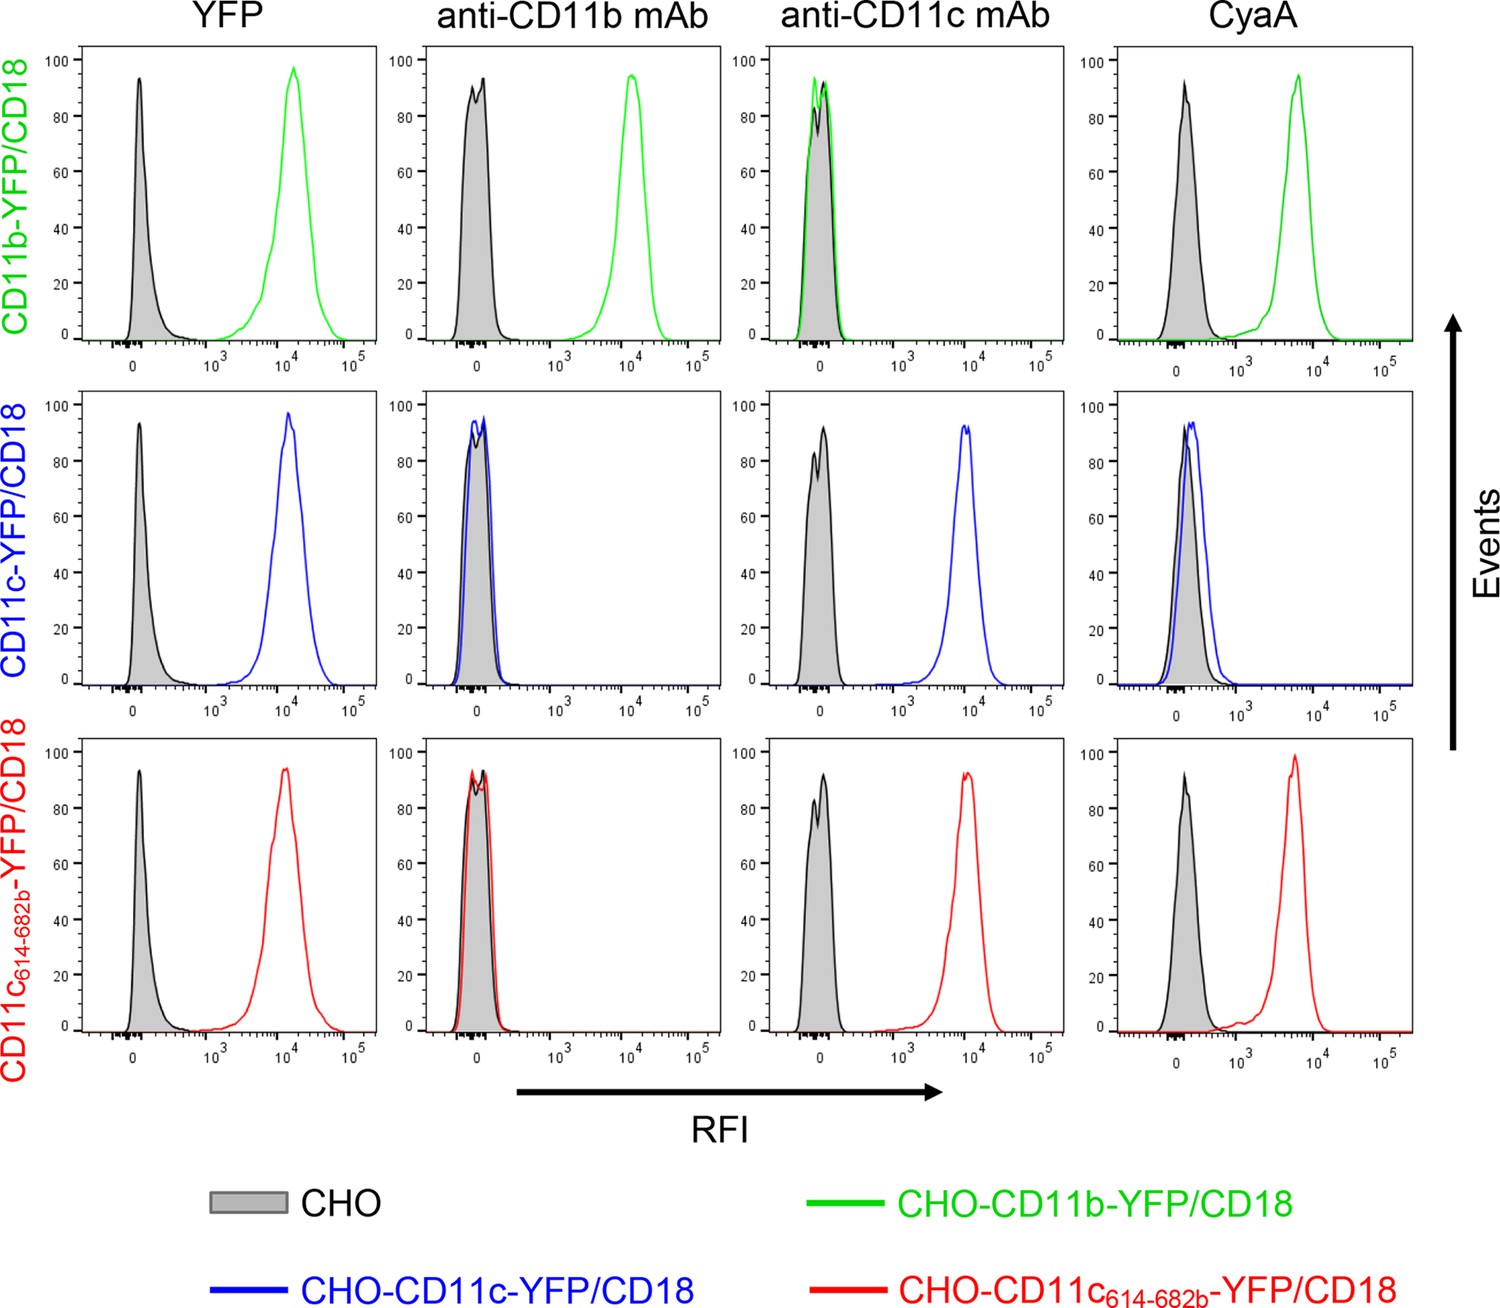
Expression of integrin variants fused with a fluorescent YFP protein on the surface of CHO cells and binding of CyaA to transfected cells.
A CHO cell line stably expressing the intact CD18 subunit was transfected with plasmid constructs encoding CD11b-YFP, CD11c-YFP or CD11c614-682b-YFP and cells stably expressing the integrin molecules were selected using a cell sorter. The expression levels of CD11b-YFP/CD18 (green), CD11c-YFP/CD18 (blue) and CD11c614-682b-YFP/CD18 chimera (red) on the surface of 2x10⁵ cells were examined by flow cytometry for YFP (left panels), or upon staining of cells with mAb recognizing CD11b (MEM-174, middle left panels), or CD11c (3.9, middle right panels). The cells were also analyzed for capacity to bind CyaA: 2x10⁵ transfected cells were incubated with 2 μg/ml of CyaA-biotin, the surface-bound toxin was labeled with streptavidin-PE and the cells were analyzed by flow cytometry (right panels). CHO cells expressing no β2 integrin (transfected with empty vectors) were processed in parallel and used as negative control (grey). Typical flow cytometry histograms from one representative binding experiment out of four performed are shown. RFI, relative fluorescence intensity.
Figure 4 with 2 supplements
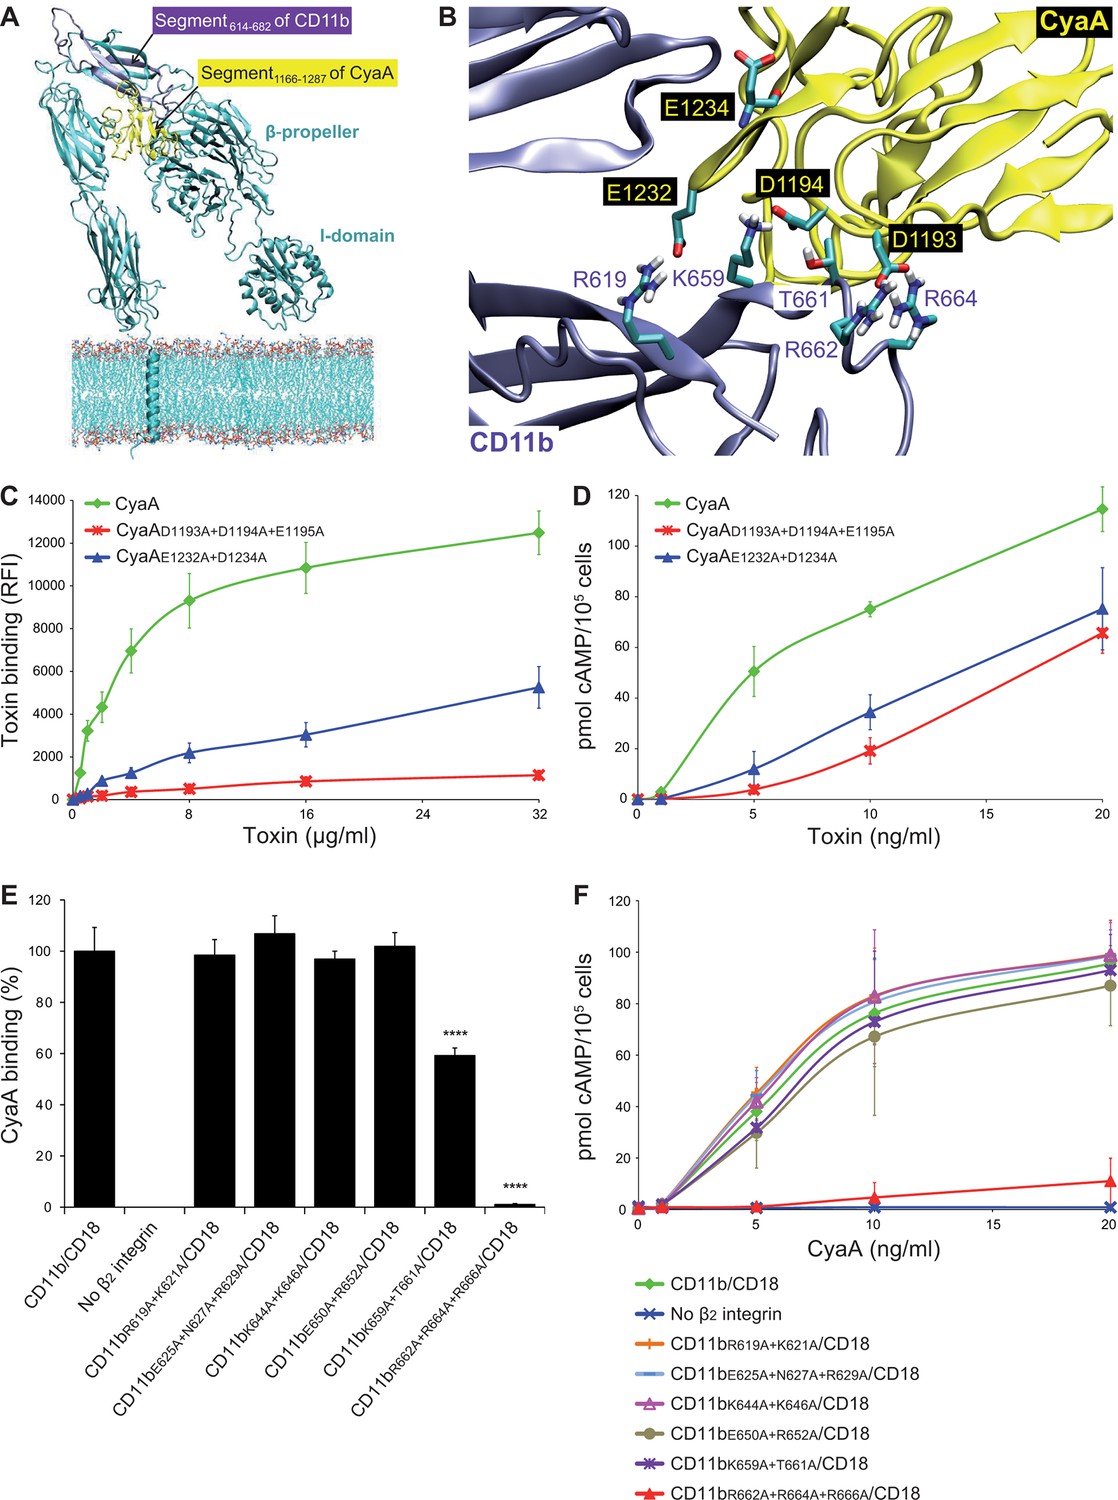
Electrostatic interaction of oppositely charged residues underlies CyaA binding to CR3.
(A) 3D structure of CR3 was modeled by homology onto the known 3D structure of CR4. The structure of the CD11b binding site within the segment 1166-1287 of CyaA was predicted using I-TASSER. For clarity, only the CD11b subunit is shown. (B) To identify interacting residues, a flexible side chain docking of the segment 1166-1287 of CyaA to CR3 was performed using the ClusPro server. (C) Different concentrations of Dy647-labeled intact CyaA or its variants with point mutations in the CD11b binding site of the toxin were incubated with 2x10⁵ CHO cells expressing intact CR3 and the cells were analyzed by flow cytometry. Mean fluorescence intensities of binding of intact CyaA or its variants were plotted against the toxin concentrations. Each point represents the mean value ± SD of four independent experiments. Binding of CyaA mutant variants to cells was at all measured concentrations significantly lower than binding of intact CyaA (p<0.0001; ANOVA). RFI, relative fluorescence intensity. (D) Different concentrations of intact CyaA and its mutant variants were incubated with 1x10⁵ CHO cells expressing intact CR3 and intracellular levels of cAMP were determined by ELISA. Each point represents the mean value ± SD of two independent experiments performed in triplicate. Intoxication of cells by CyaA mutant variants was at all measured concentrations significantly lower than intoxication of cells by intact CyaA (p<0.0001; for CyaAE1232+D1234A at 20 ng/ml p<0.001; ANOVA). (E) 2x10⁵ CHO cells expressing integrin molecules were incubated with 2 µg/ml of CyaA-biotin, the surface-bound toxin was labeled with streptavidin-PE and the cells were analyzed by flow cytometry. CyaA binding was expressed as percentage of toxin binding to CHO cells expressing the native form of CD11b/CD18. Each bar represents the mean value with SD of two independent experiments performed in duplicate. Significantly reduced binding of CyaA to mutant integrins in comparison with intact CD11b/CD18 is indicated (****, p<0.0001; ANOVA). (F) 1x10⁵ CHO cells expressing different integrin molecules were incubated with various concentrations of CyaA and the amounts of accumulated cAMP were determined in cell lysates by ELISA. Each point represents the mean value ± SD of six independent experiments. Intoxication of cells expressing CD11bR662A+R664A+R666A/CD18 or no β2 integrin was in concentrations ranging from 5 to 20 ng/ml of CyaA significantly lower than intoxication of cells expressing intact CD11b/CD18 (p<0.0001; ANOVA).
Figure 4—figure supplement 1
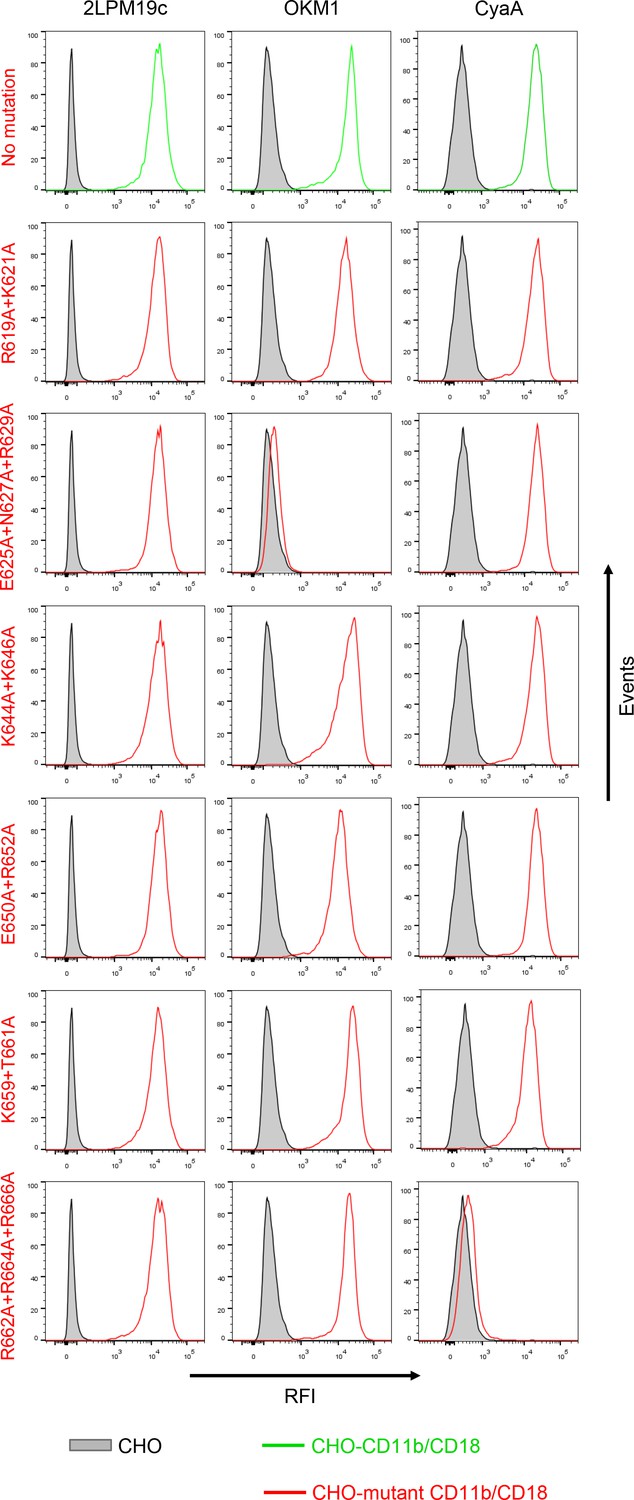
Expression of CD11b/CD18 and of its mutant variants on the surface of CHO cells and binding of CyaA to transfected cells.
A CHO cell line stably expressing the intact CD18 subunit was transfected with plasmid constructs encoding intact CD11b or its mutant variants with the charged and hydrophilic residues within the segment 614-682 replaced with alanine residues. Cells stably expressing integrin molecules were selected using a cell sorter. The expression levels of CD11b/CD18 (green) and its mutant variants (red) on the cell surface were examined by flow cytometry after staining of 2x10⁵ cells with the 2LPM19c mAb recognizing the I-domain of CD11b (left panels), or the OKM1 mAb recognizing the mutagenized segment 614-682 of CD11b (middle panels). The cells were also analyzed for capacity to bind CyaA: 2x10⁵ transfected cells were incubated with 2 μg/ml of CyaA-biotin, the surface-bound toxin was labeled with streptavidin-PE and the cells were analyzed by flow cytometry (right panels). CHO cells expressing no β2 integrin (transfected with empty vectors) were processed in parallel and used as negative control (grey). Typical flow cytometry histograms from one representative binding experiment out of four performed are shown. RFI, relative fluorescence intensity. In contrast to other substitutions in the segment 614-682 of CD11b, the triple substitution E625A+N627A+R629A abolished binding of OKM1, suggesting that the epitope recognized by OKM1, or part of it, comprises these residues.
Figure 4—figure supplement 2

Staining of CHO cells expressing intact CD11b/CD18 and of its two mutant variants with the four mAbs that block the binding of CyaA.
2x10⁵ CHO cells stably expressing intact CD11b/CD18, or its mutant variants exhibiting significantly reduced capacity to bind CyaA, were stained with the anti-CD11b mAbs that block CyaA binding. The cells were analyzed by flow cytometry and antibody binding was expressed as percentage of mAb binding to CHO cells expressing the native form of CD11b/CD18. Each bar represents the mean value with SD of four independent experiments. Significant differences between mean values of mAb binding to cells expressing mutant integrin and cells expressing intact CD11b/CD18 are indicated (****, p< 0.0001; ANOVA).
Figure 5 with 2 supplements
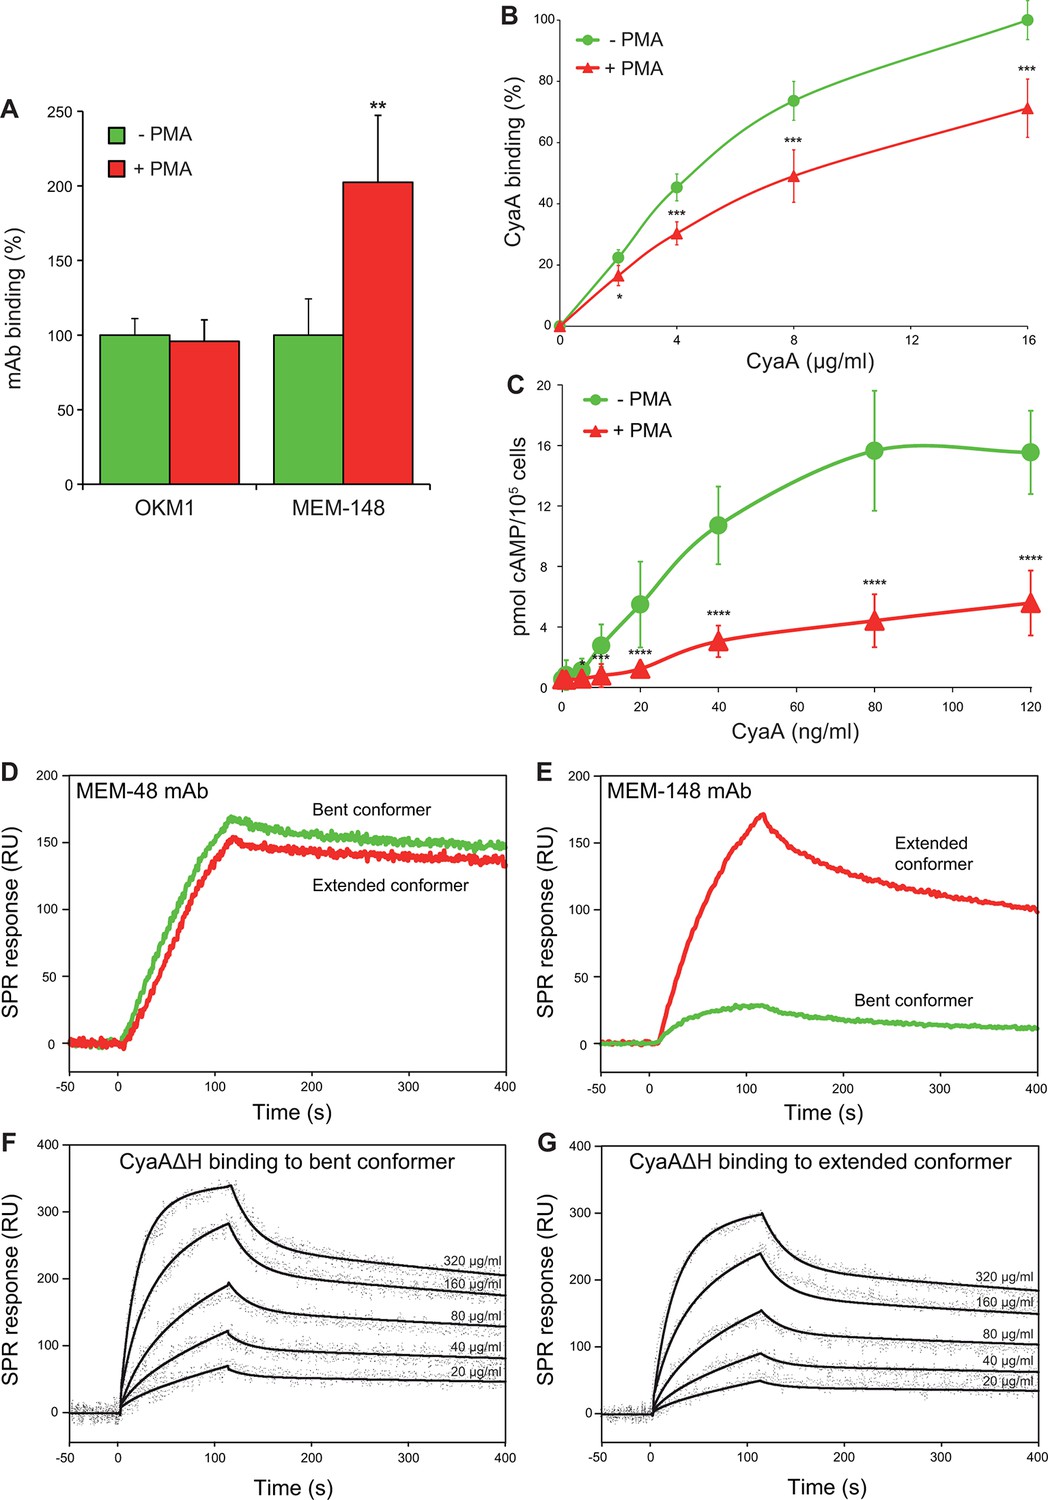
CyaA preferentially recognizes the inactive (bent) conformation of CR3.
(A, B) A leukocyte-enriched fraction prepared from fresh whole blood was treated without or with 100 nM PMA to activate CR3. The cells were promptly stained with the OKM1 mAb recognizing both CR3 conformations, or with the MEM-148 mAb recognizing the extended integrin conformation (A), or with different concentrations of Dy647-labeled CyaA (B) in a combination with anti-CD14 mAb. After 2 min, cells were analyzed by flow cytometry, monocytes were gated based on light-scatter characteristics and expression of CD14 and used for calculation of mAbs and CyaA binding. Binding of mAbs, or CyaA (at the highest tested concentration) to PMA-untreated cells was taken as 100%. Each value represents the mean with SD of three independent experiments performed in duplicate using three different donors. Significant differences between mean values of mAbs or CyaA binding to cells treated with buffer alone and cells treated with PMA are shown (*, p<0.05; **, p< 0.01; ***, p<0.001; Student’s t-test). (C) 1x10⁵ human primary monocytes were pretreated without or with 100 nM PMA and incubated with indicated concentrations of CyaA. The amounts of accumulated cAMP were determined in cell lysates by ELISA. Each point represents the mean value ± SD of seven independent experiments performed in duplicate using cells of seven different donors. Significant differences between mean values of cAMP intoxication of monocytes incubated in the absence and in the presence of PMA are shown (*, p<0.05; ***, p<0.001; ****, p<0.0001; Student’s t-test). (D-G) The bent and extended conformers of sCR3 were immobilized to a Bio-Rad ProteOn XPR36 GLC sensor chip and the MEM-48 mAb recognizing both conformations of sCR3 (D), or the MEM-148 mAb recognizing the extended integrin conformation (E) were used as controls. To analyze the interaction between the bent (F), or extended (G) conformation of sCR3 and the toxin, CyaA∆H was passed over the chip surface at concentrations of 20, 40, 80, 160 and 320 µg/ml. The data were analyzed by global fitting of the response curves using a bivalent analyte model and calculated kinetic parameters are given in Table 1.
Figure 5—figure supplement 1
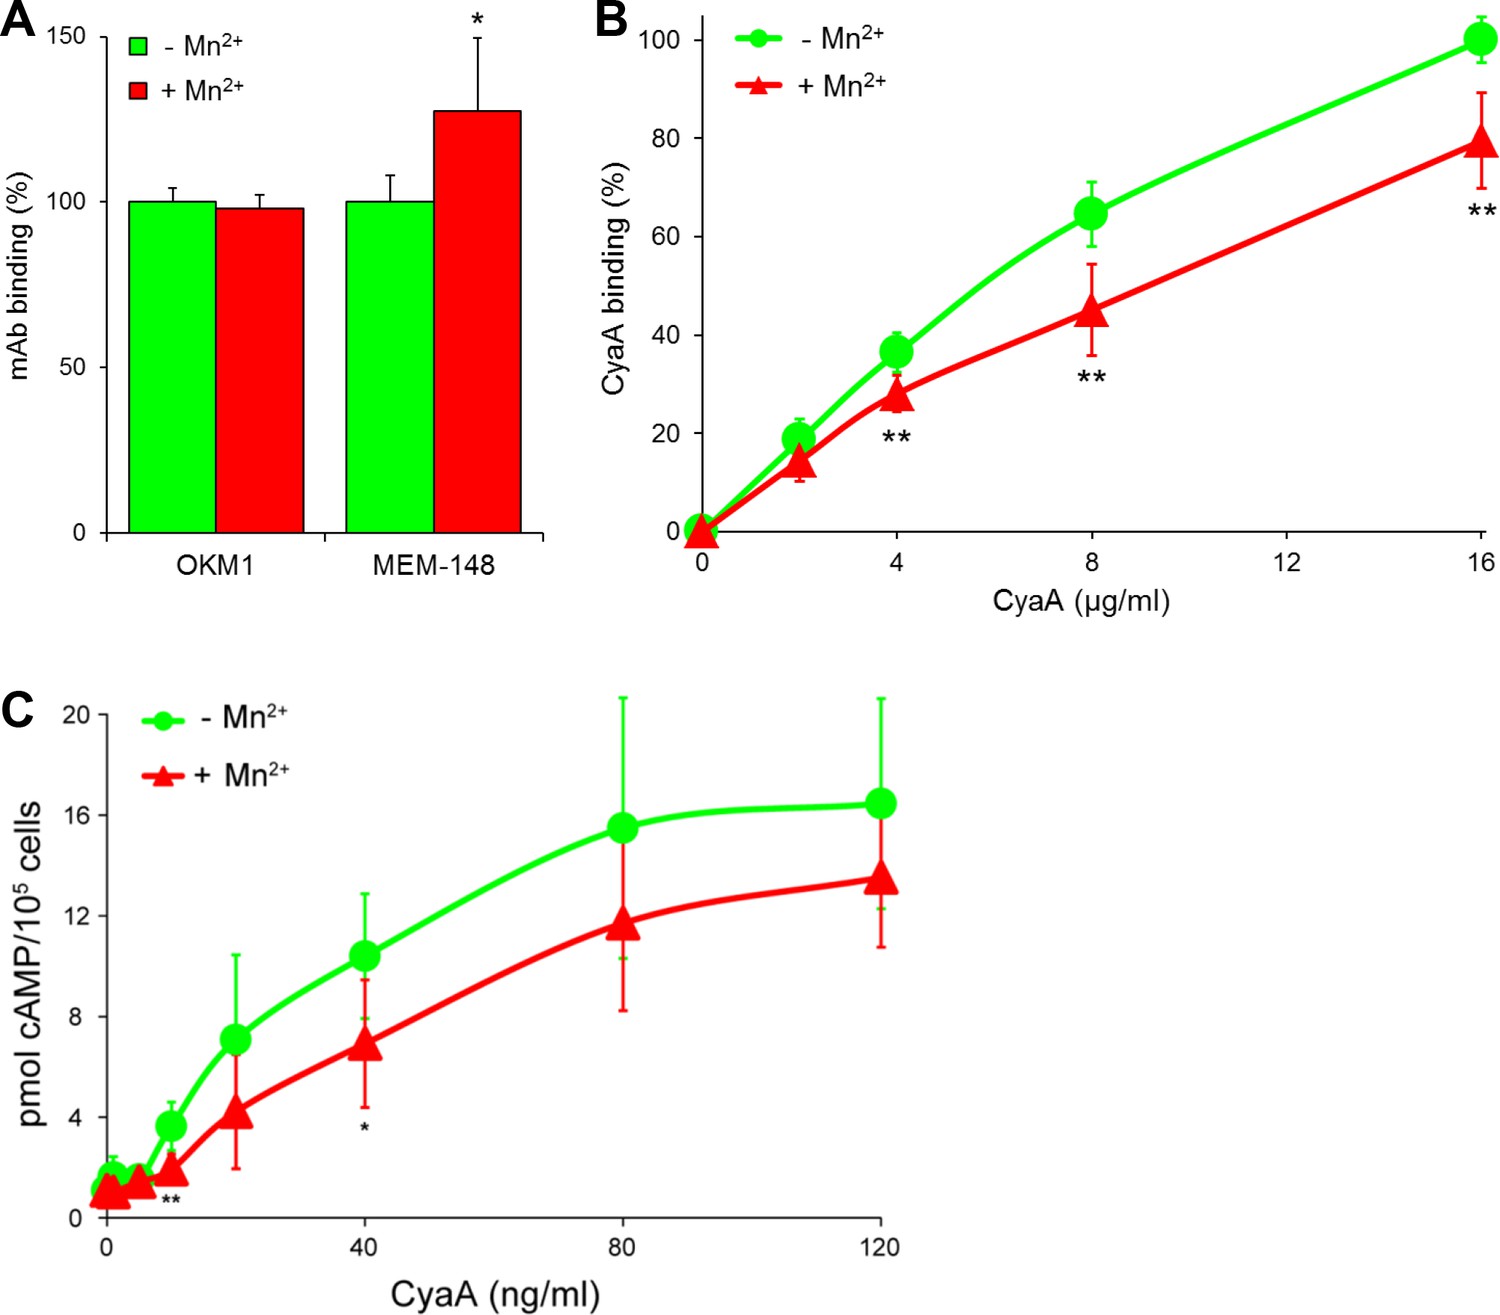
CyaA preferentially recognizes the inactive (bent) conformation of CR3.
(A, B) A leukocyte-enriched fraction prepared from fresh whole blood was treated without or with 1 mM Mn2+ ions to activate CR3. The cells were promptly stained with the OKM1 mAb recognizing both CR3 conformations, or with the MEM-148 mAb recognizing the extended integrin conformation (A), or with different concentrations of Dy647-labeled CyaA (B) in a combination with anti-CD14 mAb. After 2 min, cells were analyzed by flow cytometry, monocytes were gated based on light-scatter characteristics and expression of CD14 and used for calculation of mAbs and CyaA binding. Binding of mAbs, or CyaA (at the highest tested concentration) to Mn2+-untreated cells was taken as 100%. Each value represents the mean with SD of three independent experiments performed in duplicate using three different donors. Significant differences between mean values of mAbs or CyaA binding to cells treated with buffer alone and cells treated with Mn2+ ions are shown (*, p<0.05; **, p<0.01; Student´s t-test). (C) 1x10⁵ primary human monocytes were pretreated without or with 1 mM Mn2+ to activate CR3 and then incubated with indicated concentrations of CyaA. The amounts of accumulated cAMP were determined in cell lysates by ELISA. Each point represents the mean value ± SD of four independent experiments (three performed in duplicate) using cells of four different donors. Significant differences between mean values of cAMP intoxication of monocytes incubated in the absence and in the presence of Mn2+ are shown (*, p<0.05; **, p<0.01; Student’s t-test).
Figure 5—figure supplement 2
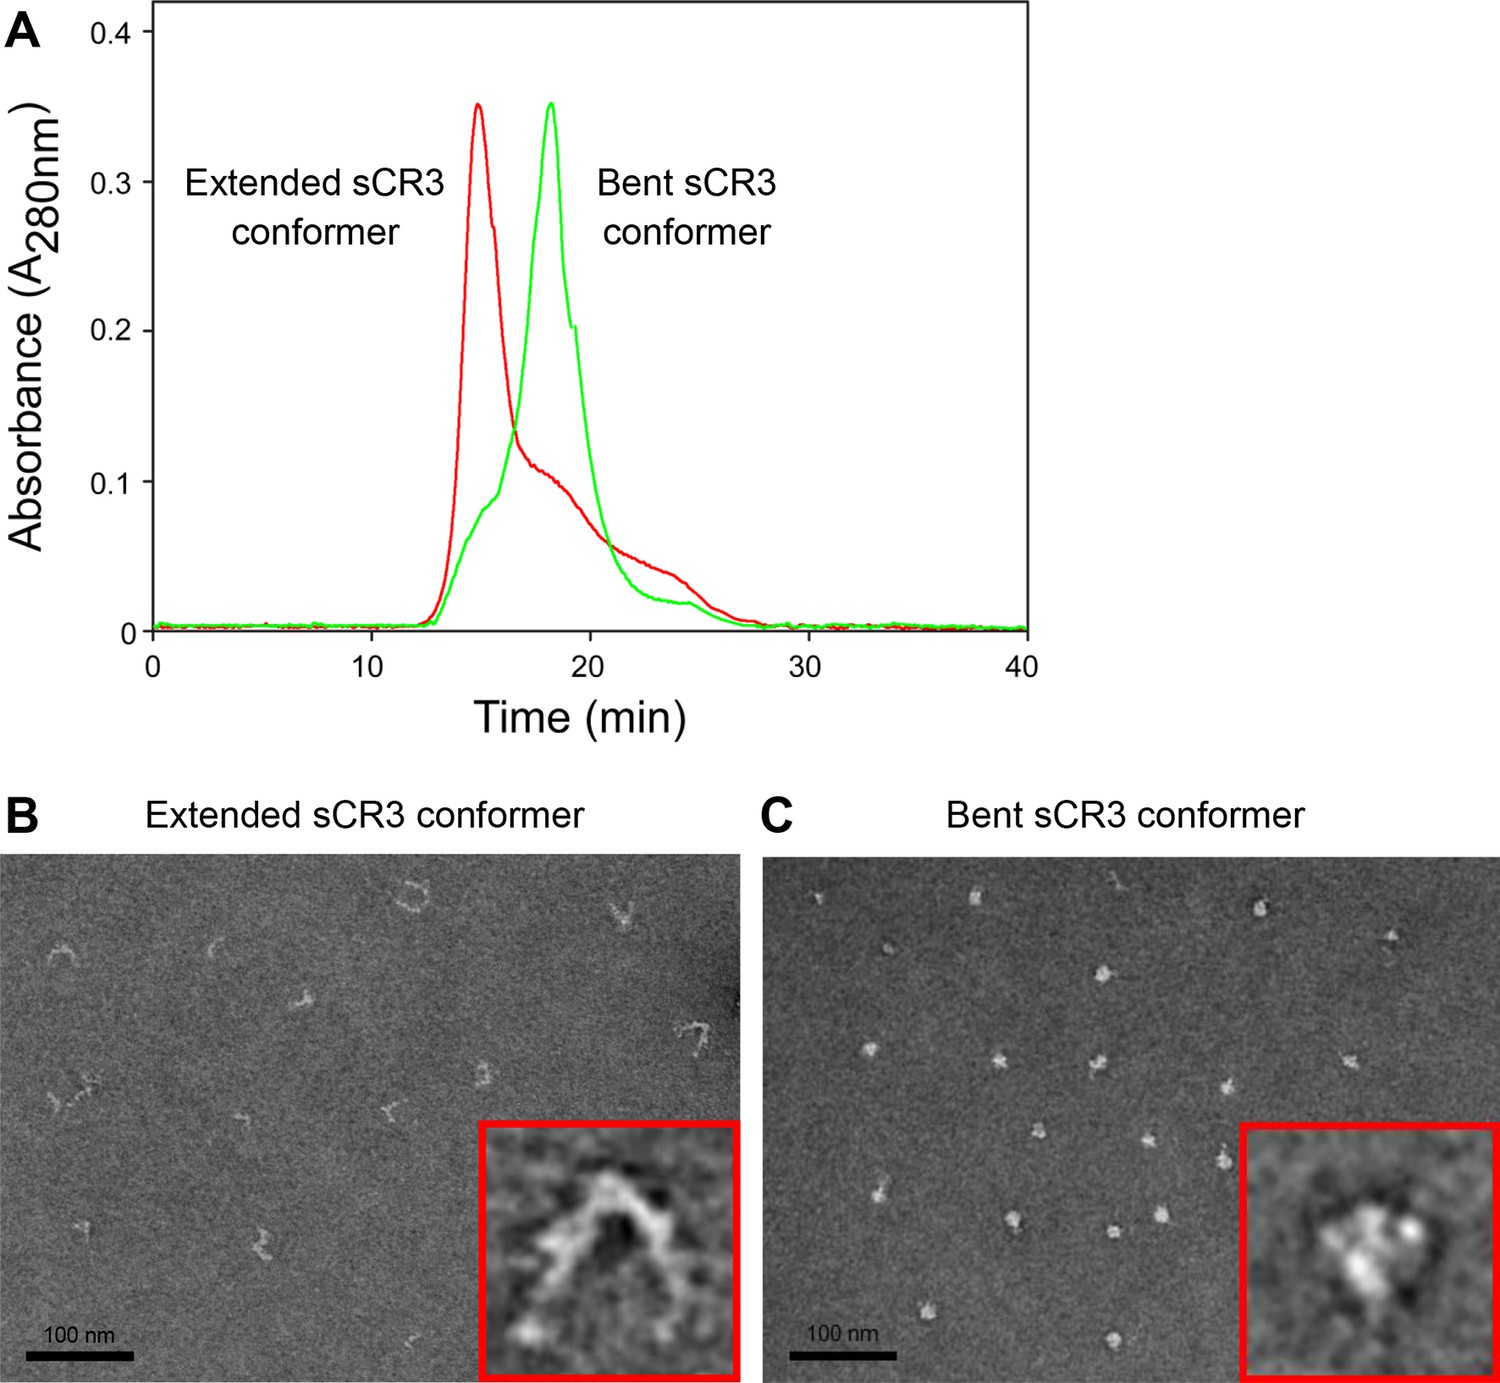
Isolation and characterization of the bent and extended conformers of sCR3.
(A) Soluble ectodomain complex of CR3 secreted from CHO transfected cells was purified from cell media by affinity chromatography and the bent and extended conformers were separated by size exclusion chromatography. An overlay of chromatograms of re-analyzed samples containing either the extended (red) or the bent (green) conformer of sCR3 is shown. (B, C) The efficacy of separation was confirmed by transmission electron microscopy upon application of the extended (B) and bent (C) integrin conformers on glow-discharged carbon copper grids, followed by staining with uranyl formate. Inlet figures in red frames show zoomed views of the sCR3 conformers.
Figure 6 with 1 supplement
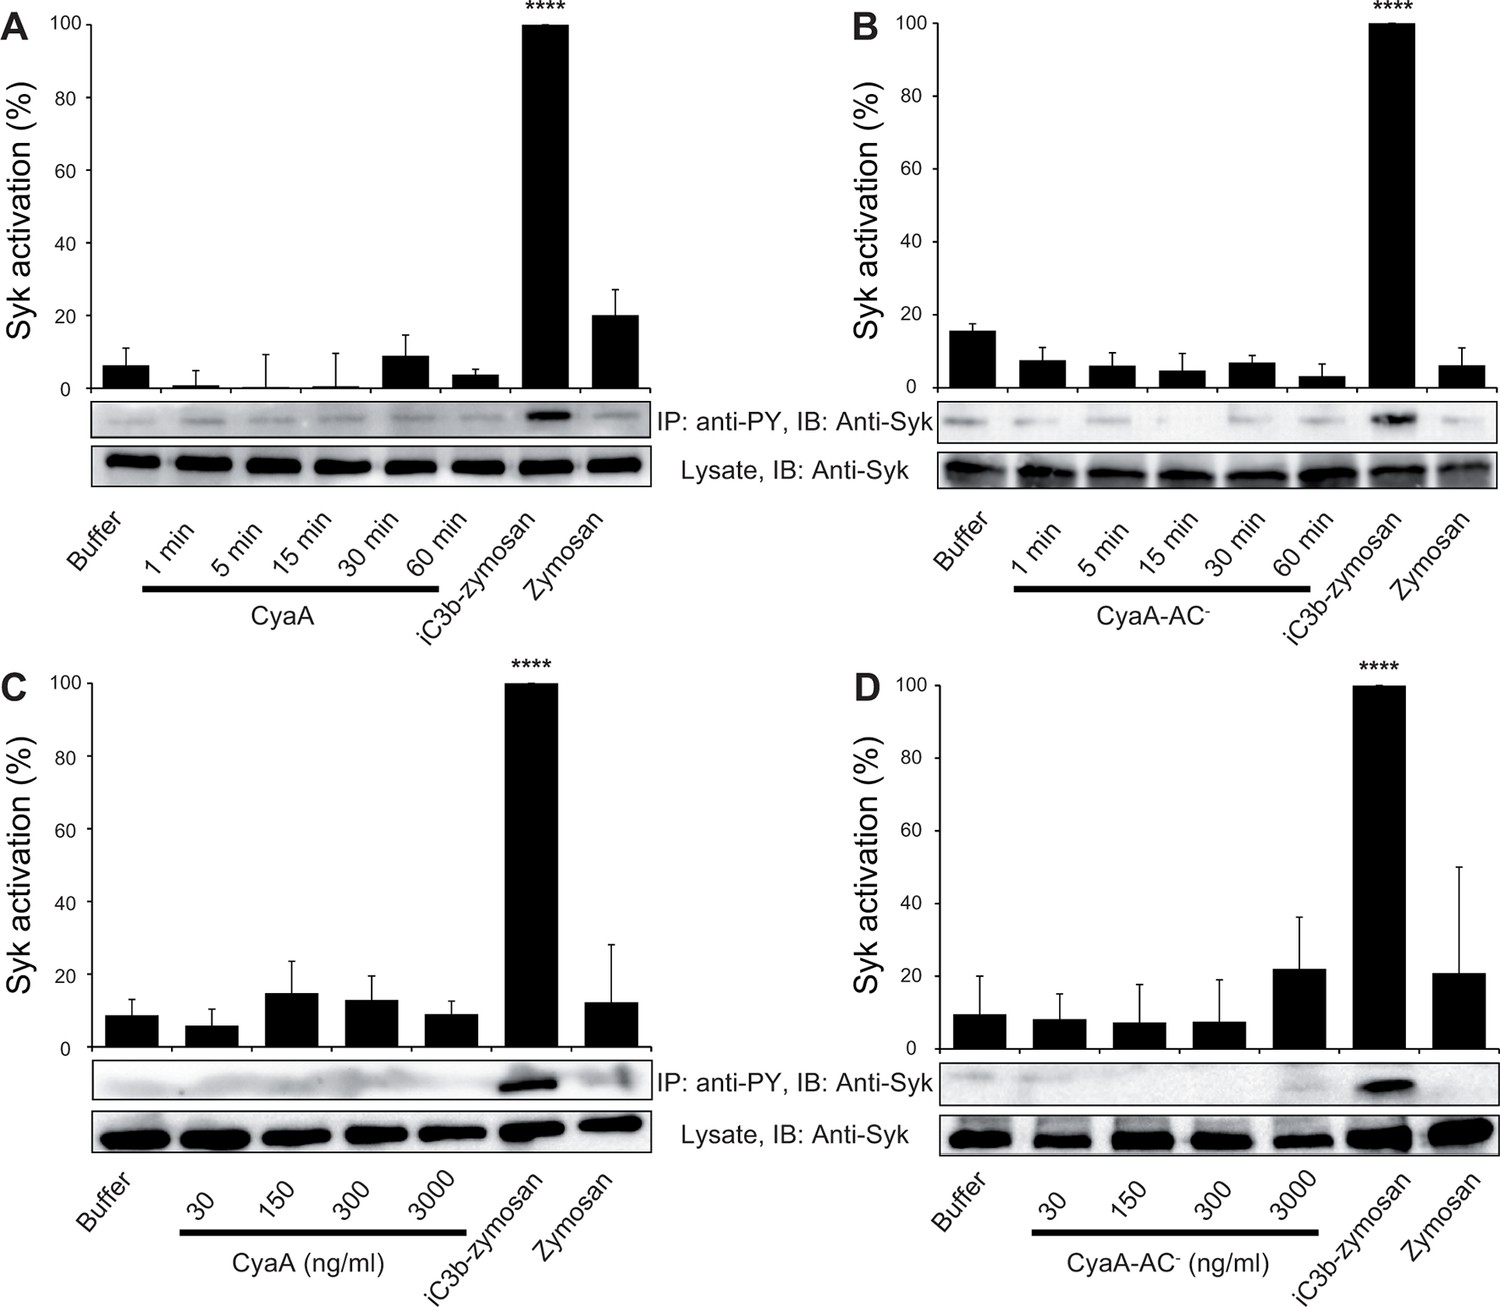
CyaA binding to CR3 does not trigger Syk activation.
(A, B) 3x10⁶ THP-1 cells were incubated with 30 ng/ml of CyaA (A), or CyaA-AC- (B) for indicated times. (C, D) 3x10⁶ THP-1 cells were incubated with different indicated concentrations of CyaA for 15 min (C), or CyaA-AC- for 30 min (D). (A-D) Treated cells were lysed and cell lysates were immunoprecipitated (IP) with anti-phosphotyrosine (anti-PY) mAb. Syk-P immunoprecipitated from whole cell lysates was detected by immunoblotting (IB) with anti-Syk mAb and normalized to total Syk detected in whole cell lysates. Cells treated with iC3b-opsonized zymosan were taken as a positive control and the cells treated with buffer, or unopsonized zymosan were taken as negative controls. Each bar represents the mean value with SD of three independent experiments. In comparison to buffer-treated cells, a significant increase of Syk activation was observed only in cells treated with iC3b-opsonized zymosan (****, p<0.0001; ANOVA).
Figure 6—figure supplement 1
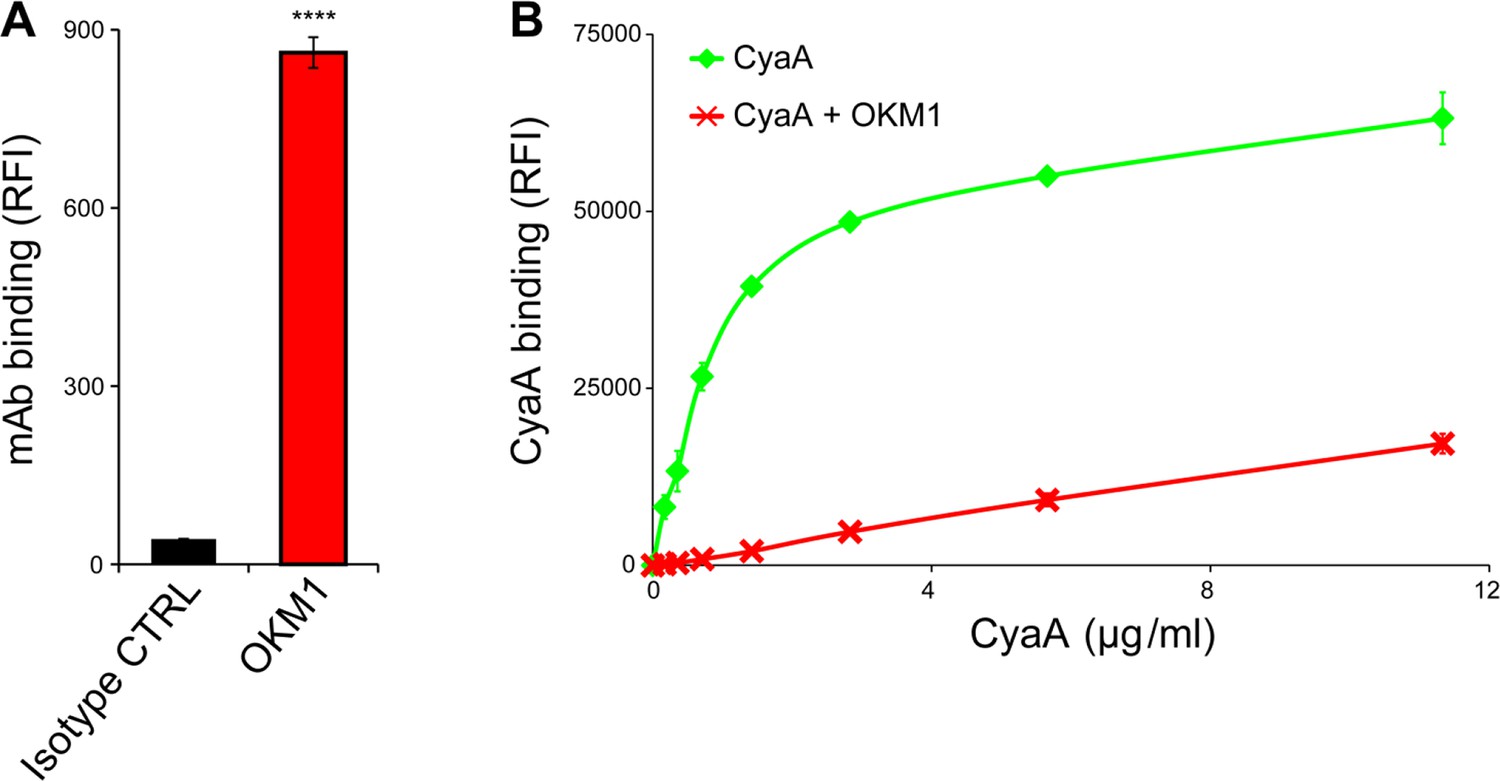
CyaA binds efficiently and specifically the THP-1 cells.
(A) 2x10⁵ THP-1 cells were treated with the anti-CD11b OKM1 mAb, or with an isotype-matched mouse IgG2b control antibody and the cells were analyzed by flow cytometry. Each bar represents the mean value ± SD of two independent experiments performed in duplicate. Significant difference between mean values of OKM1 and the control mAb binding to THP-1 cells is indicated (****, P < 0.0001; Student’s t-test). (B) 2x10⁵ THP-1 cells were preincubated without or with 25 μg/ml of the anti-CD11b OKM1 mAb for 30 min and subsequently treated with different concentrations of CyaA-biotin. The surface-bound toxin was labeled with streptavidin-PE and the cells were analyzed by flow cytometry. Mean fluorescence intensities of CyaA binding were plotted against toxin concentrations. Each point represents the mean value ± SD of two independent experiments performed in duplicate. Binding of CyaA to cells preincubated with the OKM1 mAb was at all measured concentrations significantly lower than binding of CyaA to cells pre-treated with buffer alone (P < 0.01; Student’s t-test). RFI, relative fluorescence intensity.
Figure 7 with 6 supplements
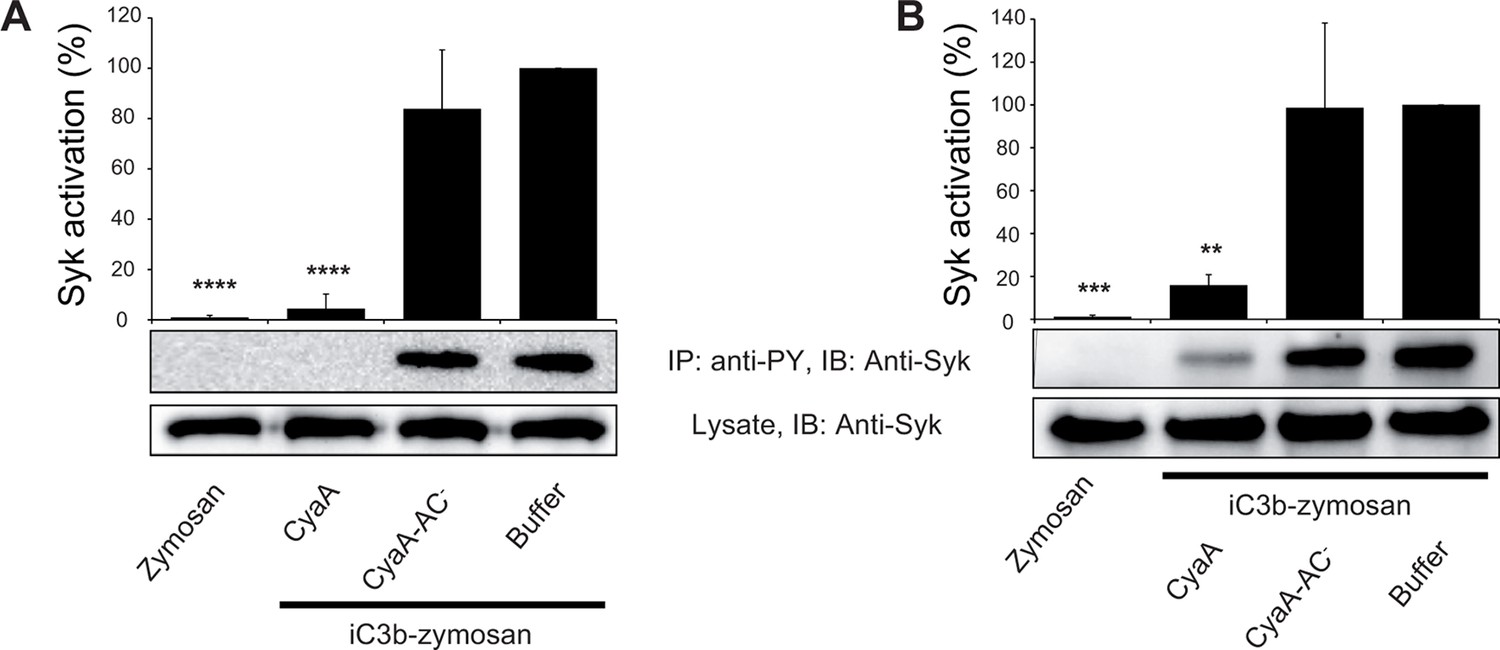
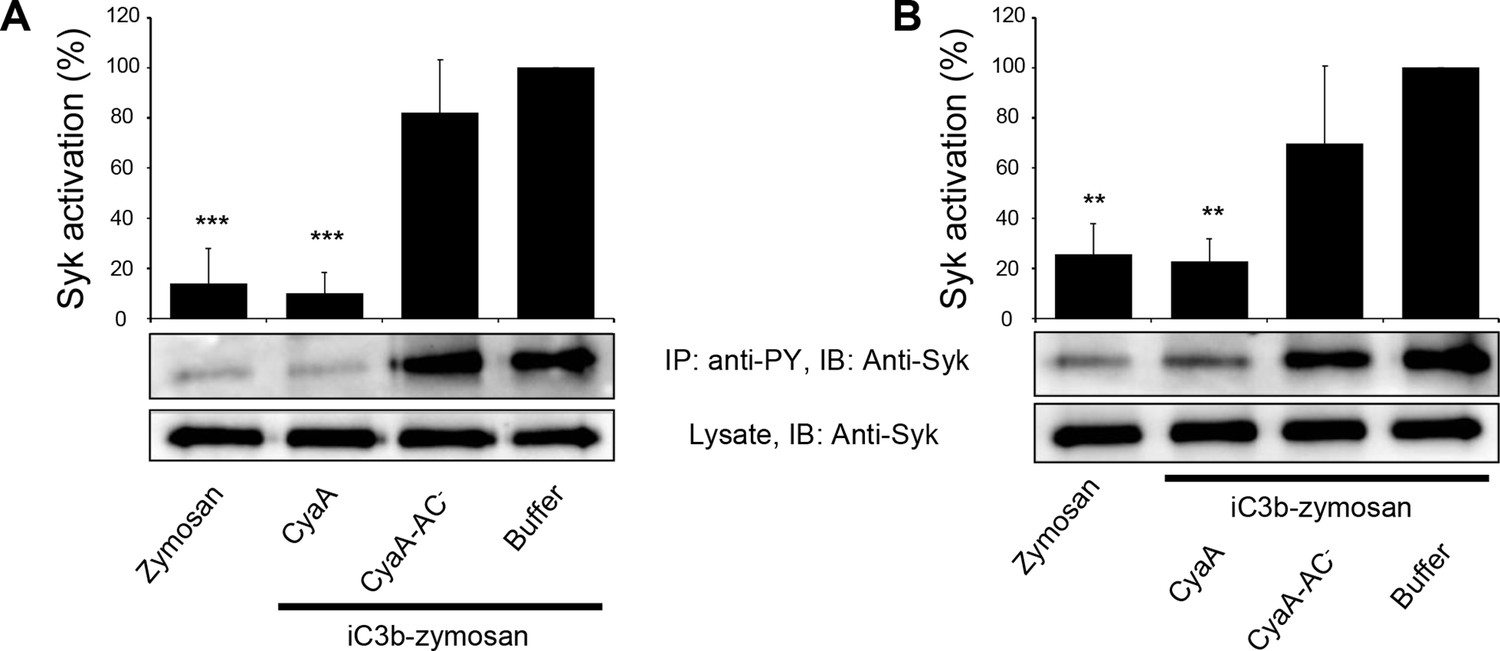
CyaA-produced cAMP blocks opsonin-induced Syk activation.
(A) 3x10⁶ THP-1 cells were incubated with 300 ng/ml of CyaA, CyaA-AC- or buffer alone for 15 min and subsequently incubated with iC3b-opsonized zymosan for 30 min to activate Syk. Cells treated with buffer followed by unopsonized zymosan were used as a control. (B) 3x10⁶ THP-1 cells were pre-incubated with iC3b-opsonized zymosan for 15 min to activate Syk and subsequently incubated with 300 ng/ml of CyaA, CyaA-AC- or buffer alone for 30 min. Cells treated with unopsonized zymosan followed by buffer were taken as negative control. Processing of cells and detection of Syk were performed as in the legend to Figure 6. Each bar represents the mean value with SD of three independent experiments. Significant differences between mean values of Syk activation in cells treated with iC3b-opsonized zymosan in the absence or presence of CyaA or CyaA-AC- are shown (**, p<0.01; ***, p<0.001; ****, p<0.0001; ANOVA).
Figure 7—figure supplement 1
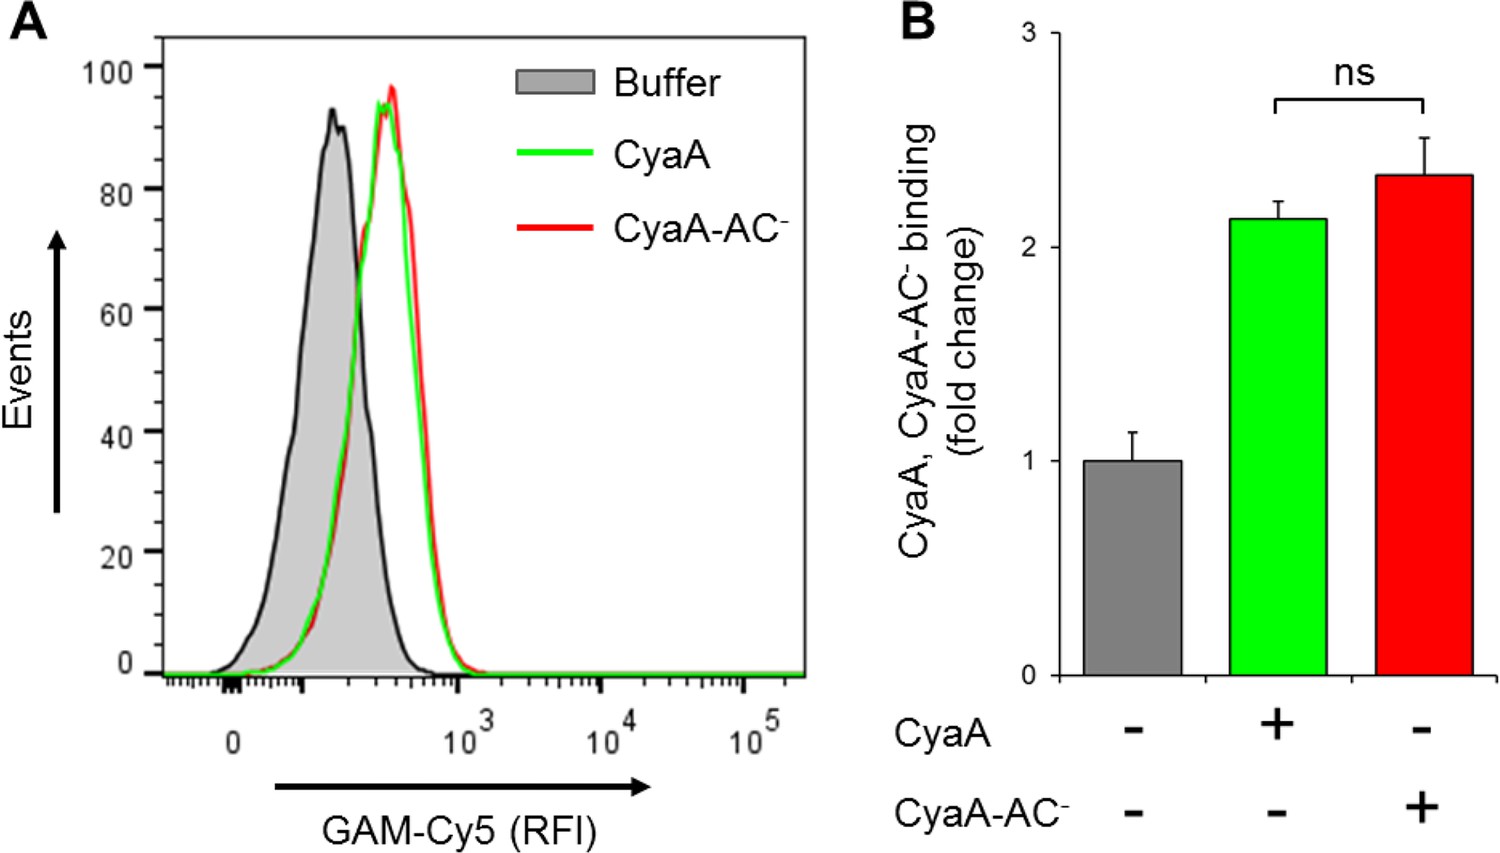
CyaA and its enzymatically inactive variant CyaA-AC- bind THP-1 cells with the same efficacy.
(A) 2x10⁵ THP-1 cells were treated with buffer alone, or with 300 ng/ml of CyaA or CyaA-AC- and then stained with CyaA-specific mAb 3D1, followed by Cy5-labeled secondary antibody (GAM-Cy5). Cells were analyzed by flow cytometry and a typical overlay histogram from one representative binding experiment out of two independent experiments performed in duplicate is shown. (B) The CyaA and CyaA-AC- binding data were deduced from the mean fluorescence intensities of the flow cytometry experiments and the mean values with SD were expressed as fold change with respect to control cells treated with buffer alone. The mean values of CyaA and CyaA-AC- binding to THP-1 cells did not significantly differ (ns; ANOVA).
Figure 7—figure supplement 2
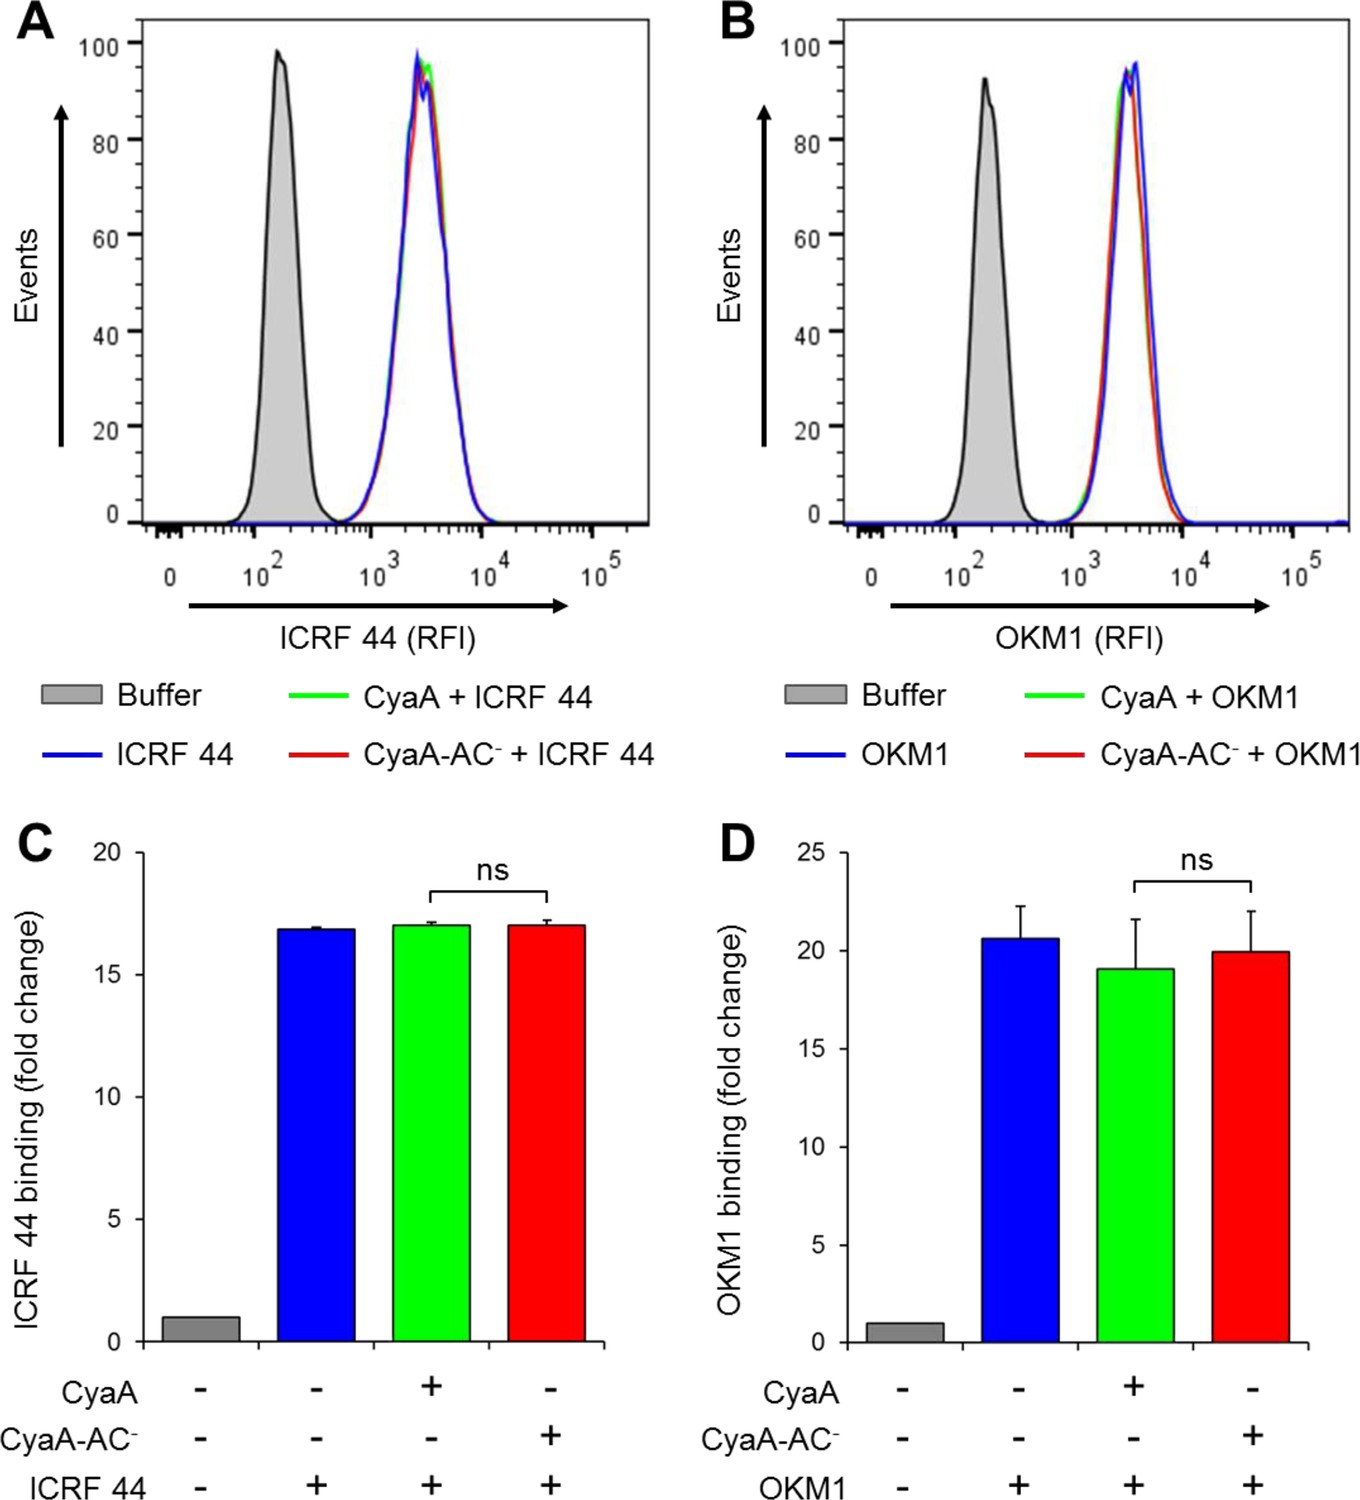
CyaA and CyaA-AC- do not alter the level of CR3 expression on the surface of THP-1 cells.
(A, B) 2x10⁵ THP-1 cells were treated with 300 ng/ml of CyaA (green), CyaA-AC- (red) or buffer (blue) for 15 min at 37°C, followed by staining with anti-CD11b mAbs ICRF 44 (A) or OKM1 (B). The cells were analyzed by flow cytometry and a typical overlay histogram from one representative binding experiment out of three independent experiments performed is shown for each mAb. THP-1 cells treated with buffer alone are shown as negative control (grey). RFI, relative fluorescence intensity. (C, D) The mAbs binding data were deduced from the mean fluorescence intensities of the flow cytometry experiments and the mean values with SD were expressed as fold change with respect to control unstained cells. The mean values of ICRF 44 (C) or OKM1 (D) mAb binding to THP-1 cells treated with CyaA or CyaA-AC- did not significantly differ (ns; ANOVA).
Figure 7—figure supplement 3
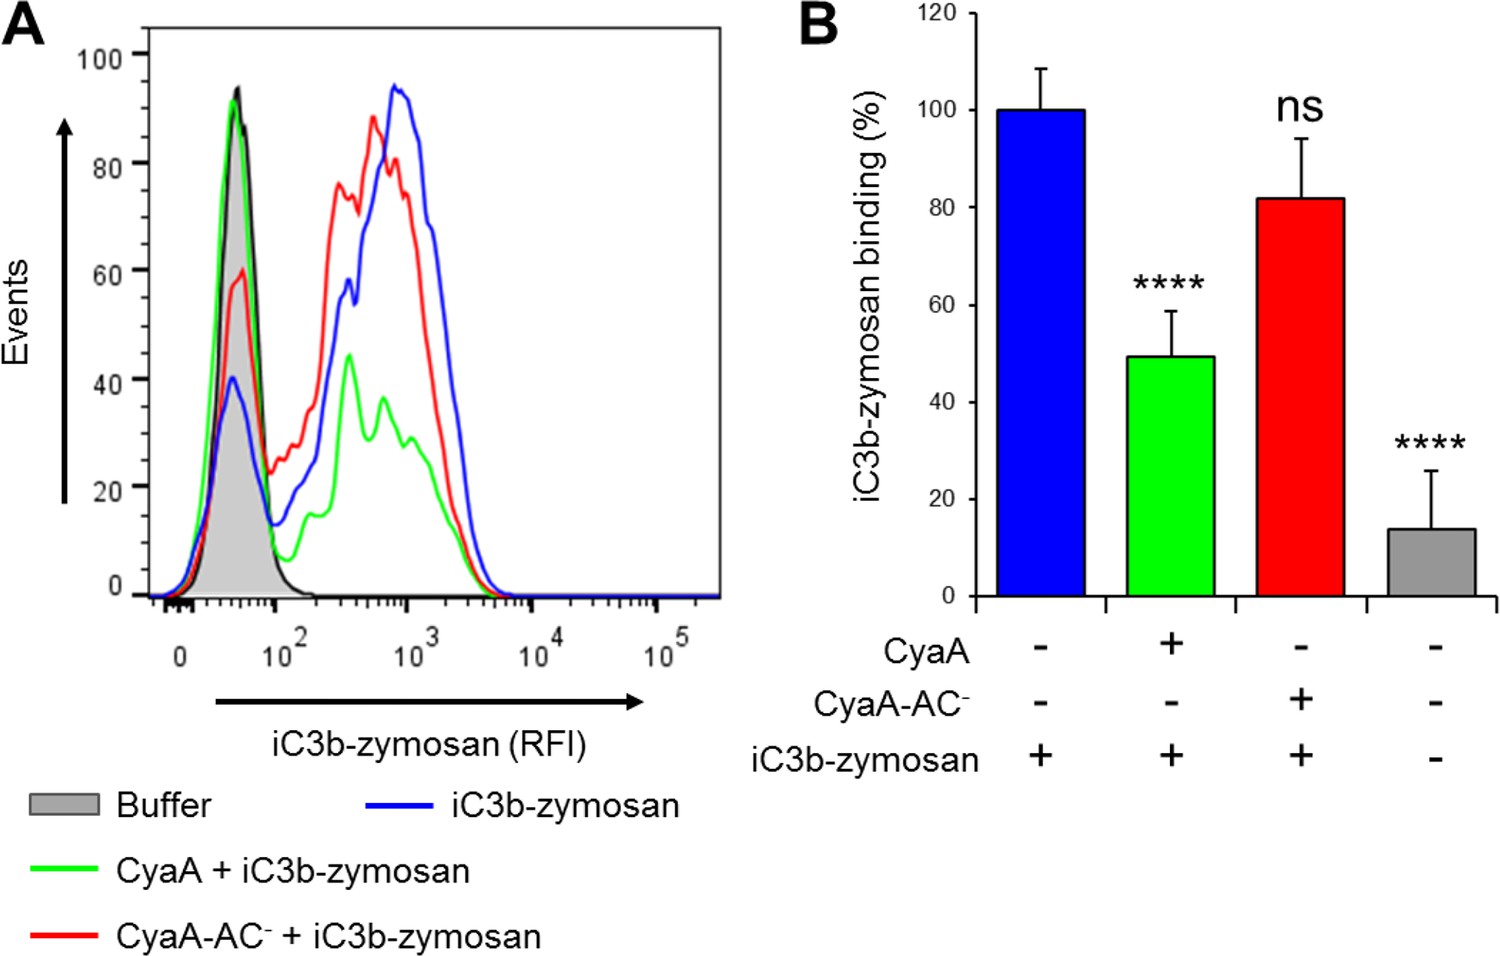
CyaA reduces binding of iC3b-zymosan to THP-1 monocytes.
(A) 2x10⁵ THP-1 cells were treated with 300 ng/ml of CyaA (green), CyaA-AC- (red) or buffer (blue) for 15 min at 37°C, followed by iC3b-zymosan for 30 min at 37°C. Cells were analyzed by flow cytometry and a typical overlay histogram from one representative binding experiment out of two independent experiments performed in duplicate is shown. Cells treated with buffer alone are shown in grey. (B) The iC3b-zymosan binding data were deduced from the mean fluorescence intensities of the flow cytometry experiments and the mean values with SD were expressed as percentage of iC3b-zymosan binding to cells in the absence of CyaA or CyaA-AC-. Significant differences between mean values of iC3b-zymosan binding to buffer-treated cells and cells treated with CyaA or CyaA-AC- are indicated (****, p<0.0001; ns, not significant; ANOVA).
Figure 7—figure supplement 4
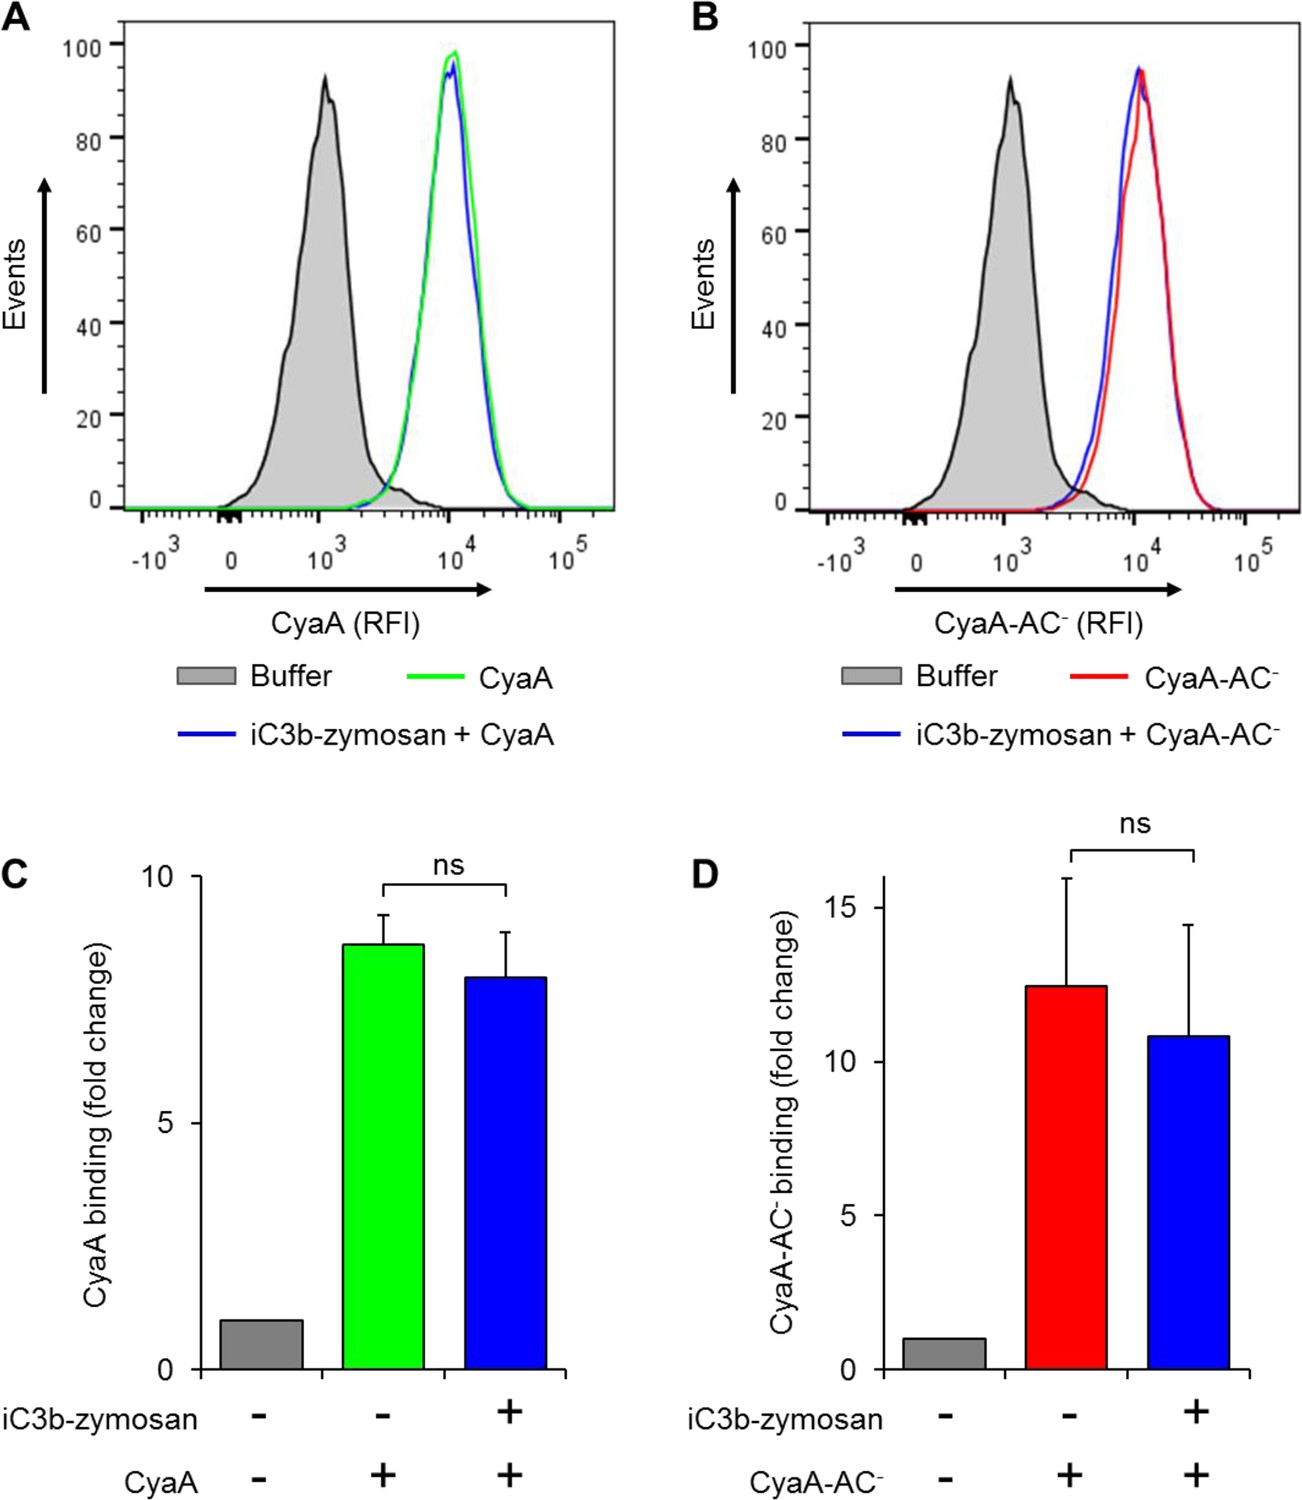
Preincubation of THP-1 monocytes with iC3b-opsonized zymosan does not reduce binding of CyaA or of CyaA-AC- to cells.
(A, B) 2x10⁵ THP-1 cells were preincubated with buffer alone or iC3b-opsonized zymosan for 30 min at 37°C and subsequently treated with biotinylated CyaA (A) or CyaA-AC- (B) for 10 min at 37°C. The surface-bound toxin was labeled with streptavidin-PE and the cells were analyzed by flow cytometry. A typical overlay histogram from one representative binding experiment out of three independent experiments performed is shown. RFI, relative fluorescence intensity. (C-D) The CyaA and CyaA-AC- binding data were deduced from the mean fluorescence intensities of the flow cytometry experiments and the mean values with SD were expressed as fold change with respect to cells treated with buffer alone. Preincubation of THP-1 monocytes with iC3b-opsonized zymosan did not significantly change binding of CyaA (C) or CyaA-AC- (D) to cells (ns; ANOVA).
Figure 7—figure supplement 5
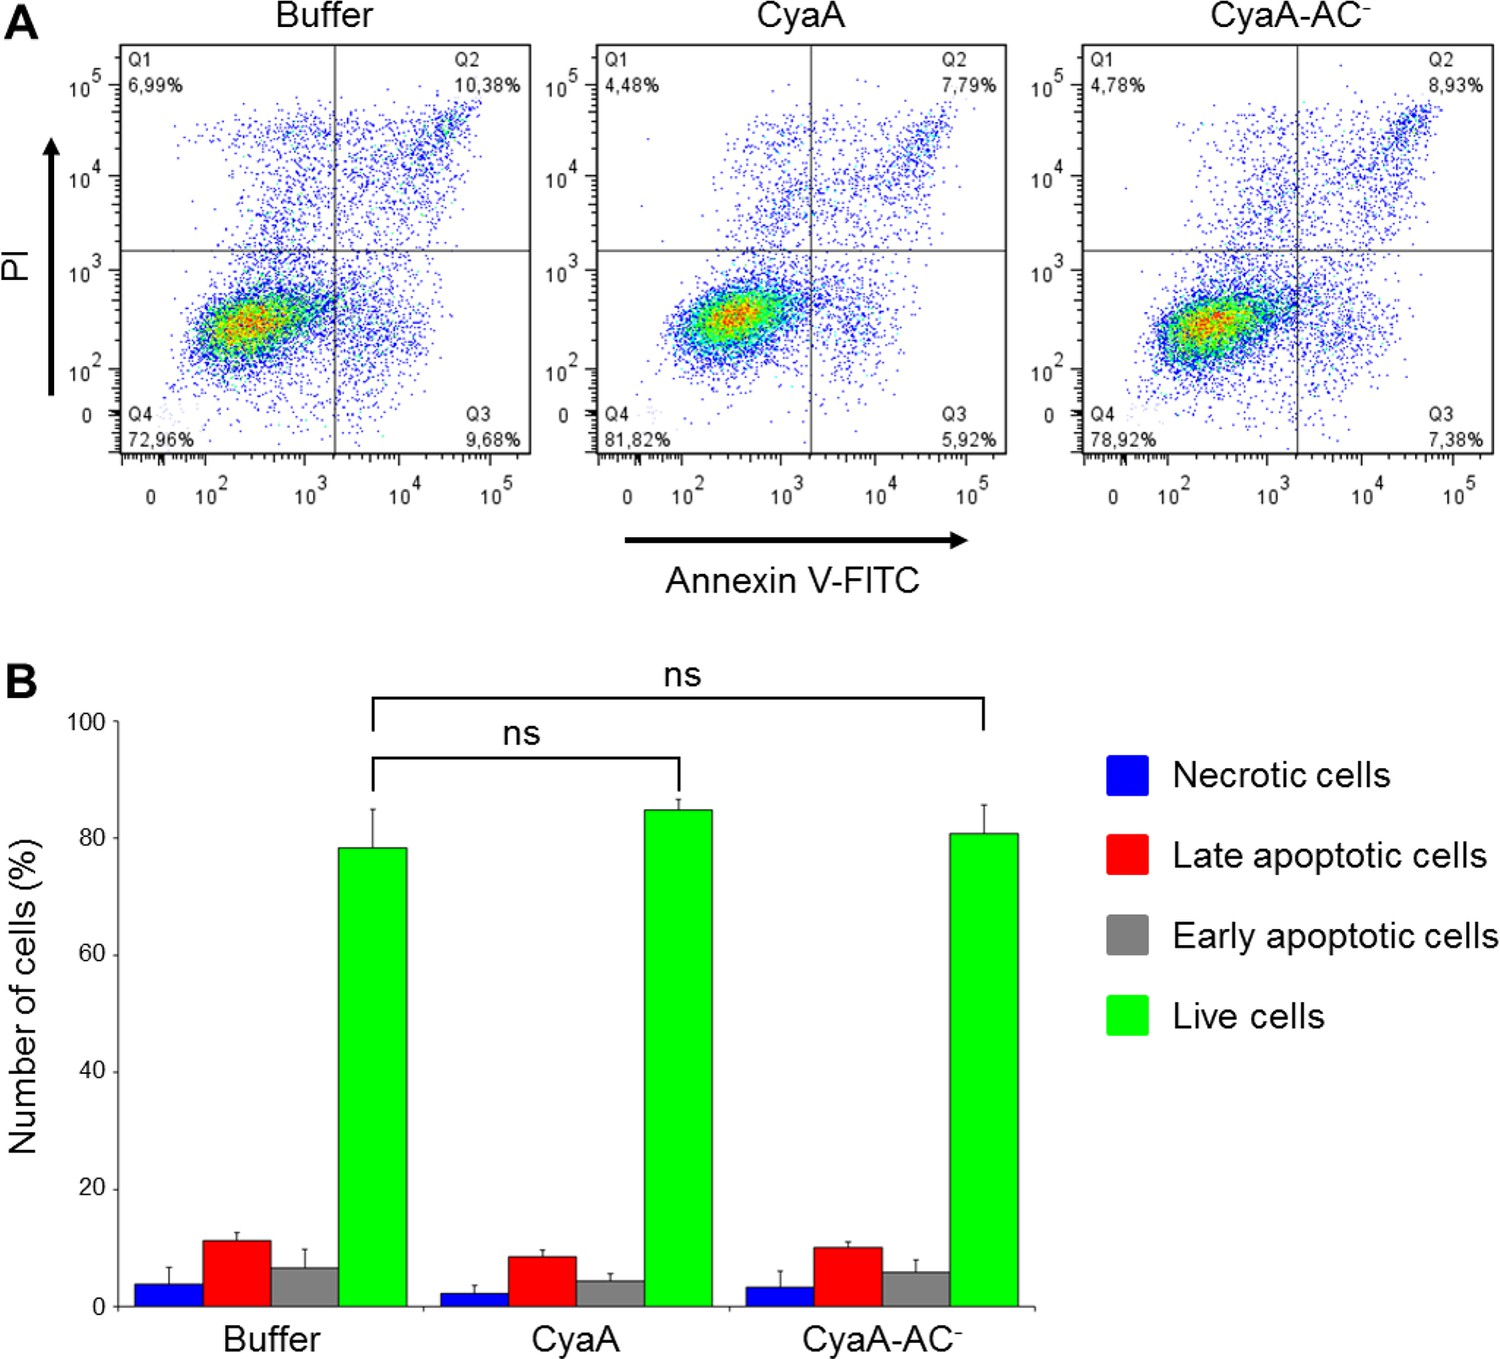
CyaA and its enzymatically inactive variant CyaA-AC- do not alter viability of THP-1 cells over the duration of the signaling experiments.
(A) THP-1 cells were treated with buffer alone or with 300 ng/ml of CyaA or CyaA-AC- for 45 min at 37°C (i.e. at the same conditions as during the signaling experiments). After washing, cells were stained with FITC-labeled Annexin V for 20 min at 20°C and analyzed by flow cytometry in the presence of 1 µg/ml of propidium iodide (PI). A typical flow cytometry dot plot from one representative binding experiment out of two independent experiments performed in triplicate is given for each sample. Cell death/apoptosis was evaluated by quadrant gating: Q1, necrotic cells; Q2, late apoptotic cells; Q3, early apoptotic cells; Q4, live cells. (B) The percentages of cells were calculated for each quadrant from the flow cytometry experiments and the mean values with SD were plotted as a bar chart. The mean percentages of live cells treated with CyaA or CyaA-AC- did not significantly differ from buffer-treated cells (ns; ANOVA).
Figure 7—figure supplement 6
CyaA-produced cAMP blocks opsonin-induced Syk activation.
(A) 3x10⁶ primary human monocytes were incubated with 300 ng/ml of CyaA, CyaA-AC- or buffer alone for 15 min and were subsequently incubated with iC3b-opsonized zymosan for 30 min to activate Syk. Cells treated with buffer followed by unopsonized zymosan were used as a control. (B) 3x10⁶ primary human monocytes were pre-incubated with iC3b-opsonized zymosan for 15 min to activate Syk and subsequently incubated with 300 ng/ml of CyaA, CyaA-AC- or buffer alone for 30 min. Cells treated with unopsonized zymosan followed by buffer were taken as negative control. Processing of cells and detection of Syk were performed as in the legend to Figure 6. Each bar represents the mean value with SD of three independent experiments. Significant differences between mean values of Syk activation in cells treated with iC3b-opsonized zymosan in the absence or presence of CyaA or CyaA-AC- are shown (**, p<0.01; ***, p<0.001; ANOVA).
Figure 8
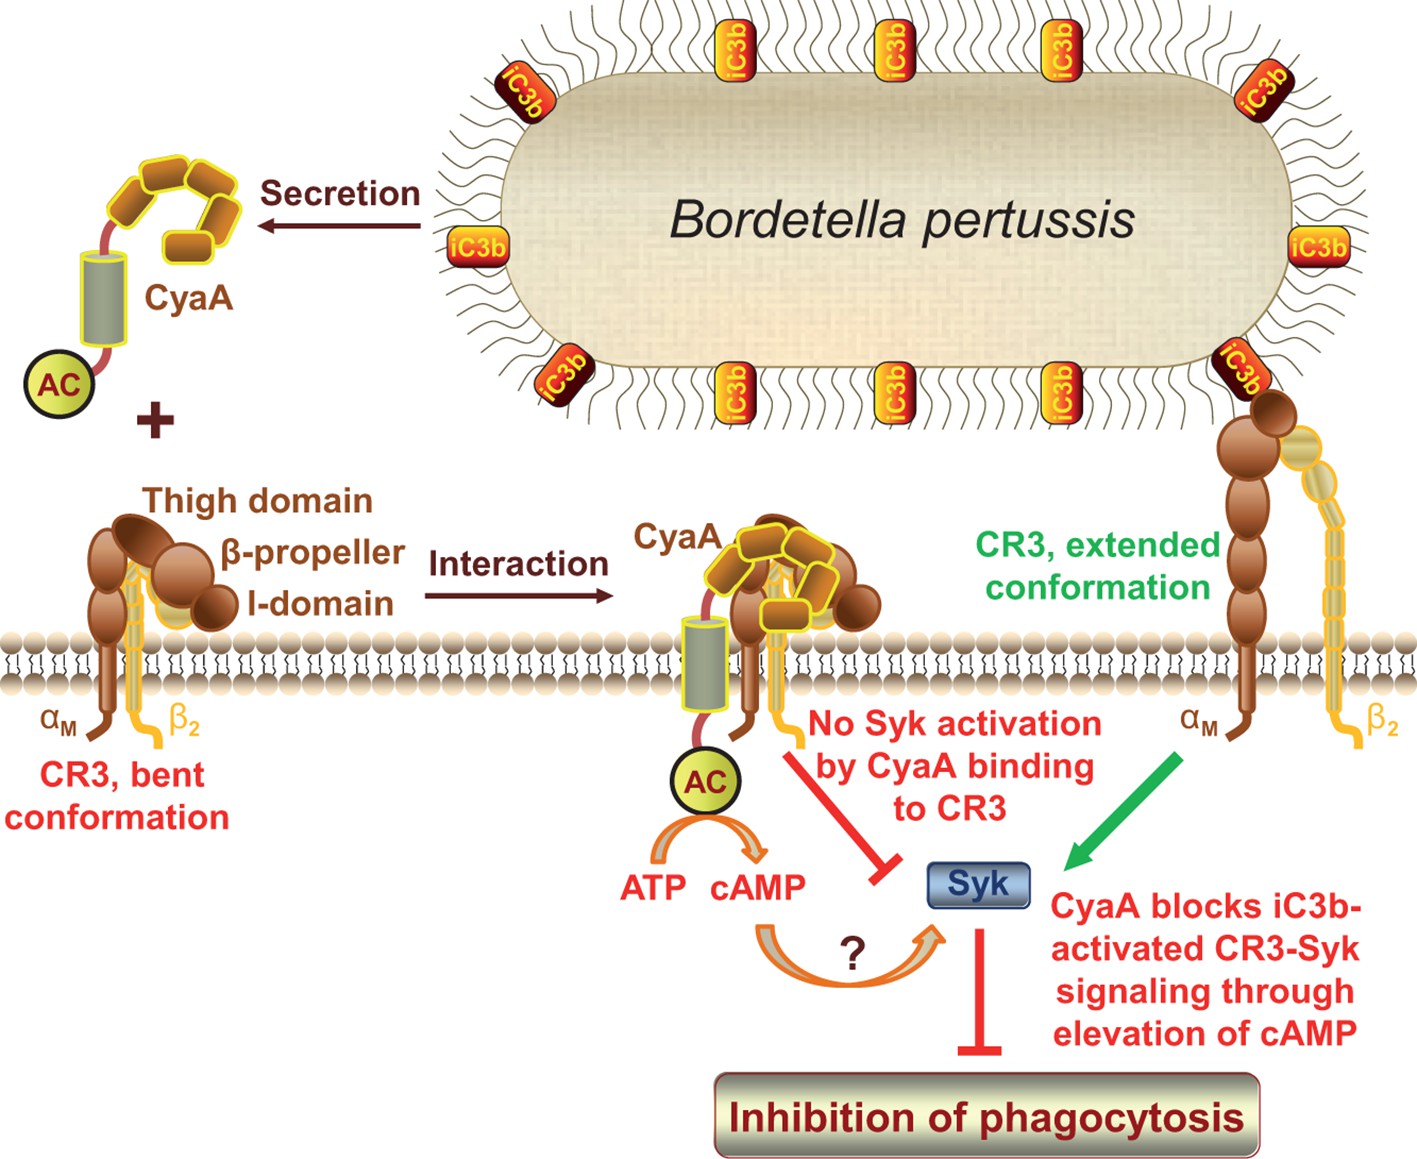
CyaA acts as a unique ligand of the I-domain-containing integrin CR3.
CyaA secreted by B. pertussis binds CR3 outside of its I-domain, using a unique site that encompasses the C-terminal end of the last repeat of the β-propeller domain and the N-terminal portion of the thigh domain of CD11b. CyaA preferentially binds the integrin in a non-activated (bent, low-affinity) conformation and engagement of CR3 by CyaA does not trigger Syk activation in monocytes. Moreover, CyaA-catalyzed elevation of cAMP effectively blocks the iC3b opsonin-elicited activation of CR3-Syk signaling in monocytes. It remains to be elucidated how CyaA-produced cAMP signaling suppresses Syk activity. Binding outside of the I-domain in an activation-independent mode thus enables the toxin to hijack CR3 and block its signaling, thereby enabling B. pertussis to evade CR3-mediated phagocytosis.
Figure 9 with 3 supplements
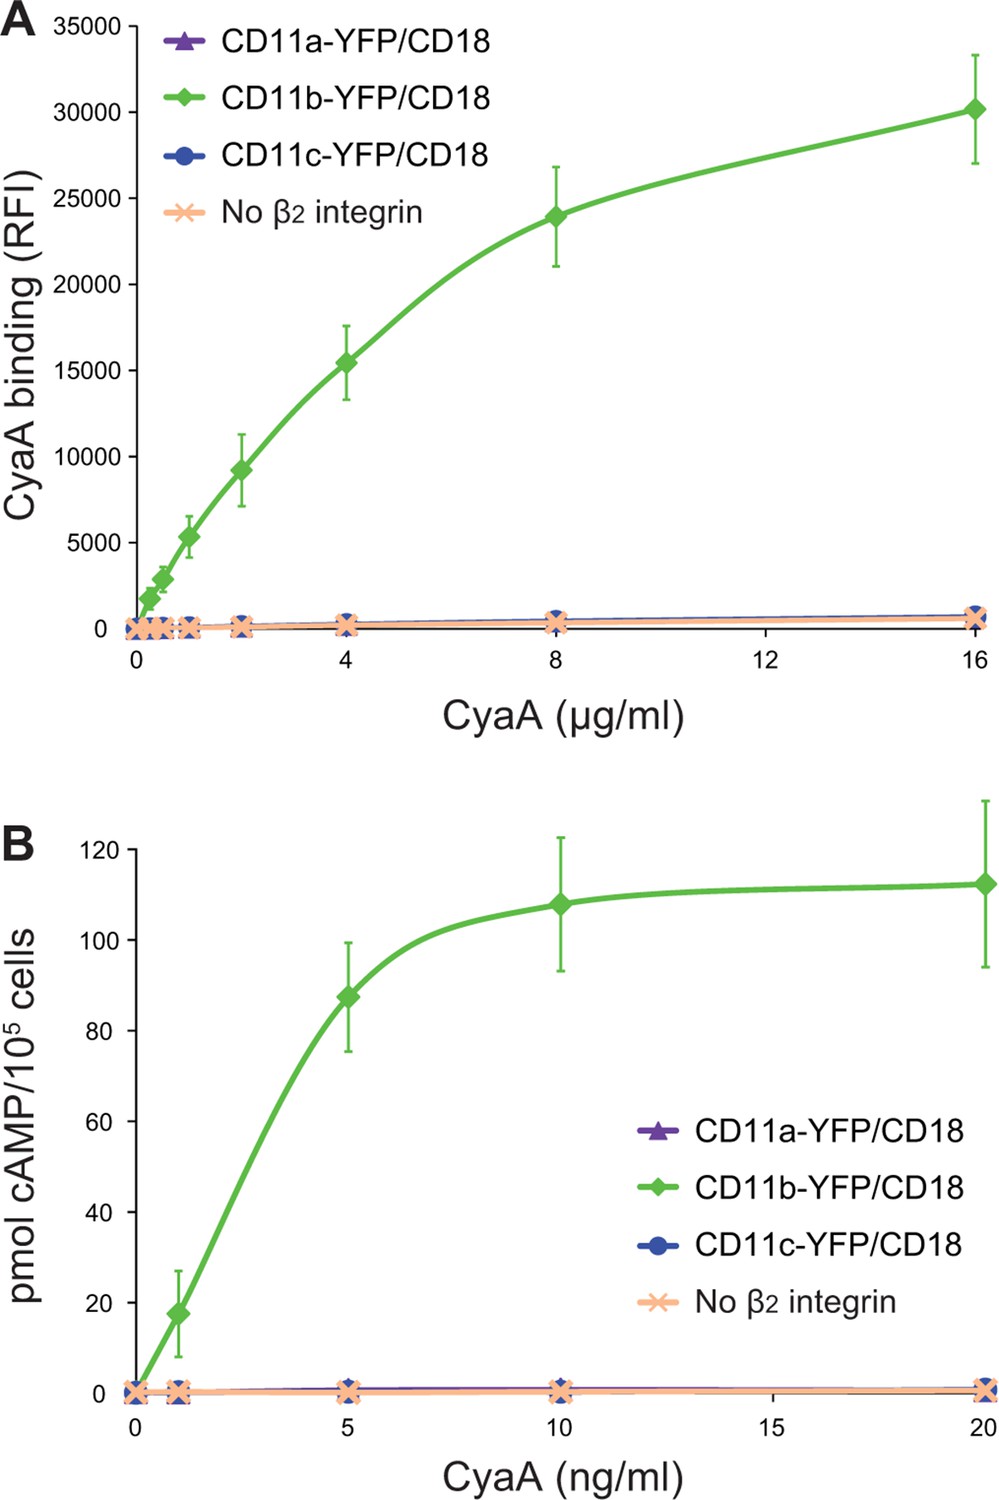
CyaA binds and intoxicates cells expressing LFA-1 with equally low efficacy as cells expressing CR4, or lacking any β2 integrin at all.
(A) 2x10⁵ stably transfected CHO cells expressing CD11a-YFP/CD18, CD11b-YFP/CD18, CD11c-YFP/CD18, or no β2 integrin were incubated with different concentrations of Dy647-labeled intact CyaA and analyzed by flow cytometry. Mean fluorescence intensities of CyaA binding were plotted against the concentrations of CyaA. RFI, relative fluorescence intensity. (B) 1x10⁵ CHO cells expressing integrin molecules were incubated at indicated concentrations of CyaA and the amounts of accumulated cAMP were determined in cell lysates by ELISA. (A and B) Each point represents the mean value ± SD of three independent experiments performed in duplicate. CyaA binding to or cAMP intoxication of cells expressing CD11a-YFP/CD18, CD11c-YFP/CD18, or no β2 integrin was at all toxin concentrations significantly lower than toxin binding to or cAMP intoxication of cells expressing intact CD11b-YFP/CD18 (p<0.0001; ANOVA). However, CyaA binding to or cAMP intoxication of cells expressing CD11a-YFP/CD18 was at all measured toxin concentrations found to be statistically the same as toxin binding to or cAMP intoxication of cells expressing CD11c-YFP/CD18 or no β2 integrin at all (P > 0.1; ANOVA).
Figure 9—figure supplement 1
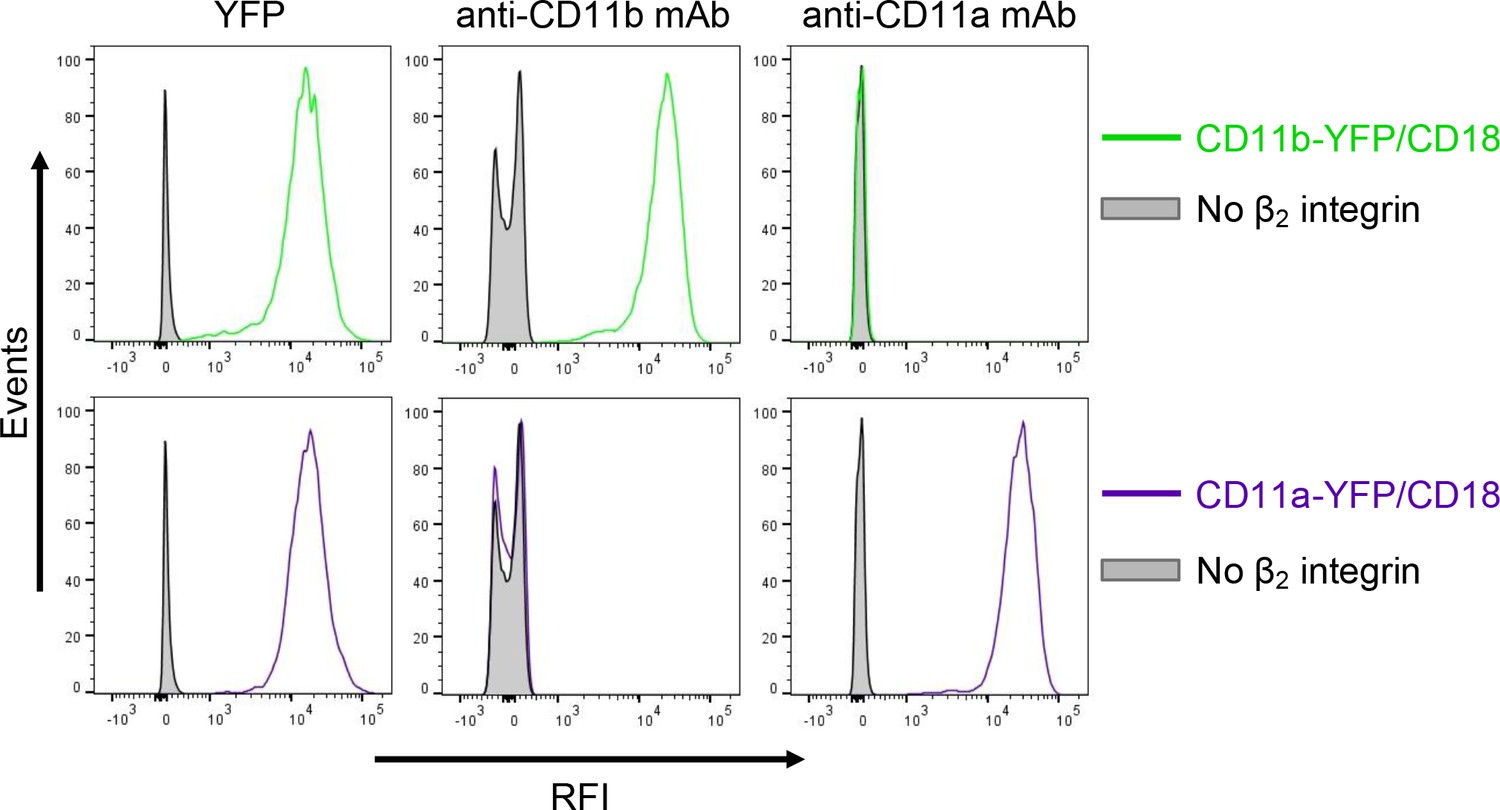
Expression of integrin variants fused with a fluorescent YFP protein on the surface of CHO cells.
A CHO cell line stably expressing the intact CD18 subunit was transfected with plasmid constructs encoding CD11b-YFP or CD11a-YFP and cells stably expressing the integrin molecules were selected using a cell sorter. The expression levels of CD11b-YFP/CD18 (green) and CD11a-YFP/CD18 (violet) on the surface of 2x10⁵ cells were examined by flow cytometry for YFP (left panels), or upon staining of cells with a mAb recognizing CD11b (M1/70, middle panels), or a mAb recognizing CD11a (MEM-25, right panels). CHO cells expressing no β2 integrin (transfected with empty vectors) were used as negative control (grey). Typical flow cytometry histograms from one representative binding experiment out of four performed are shown. RFI, relative fluorescence intensity.
Figure 9—figure supplement 2
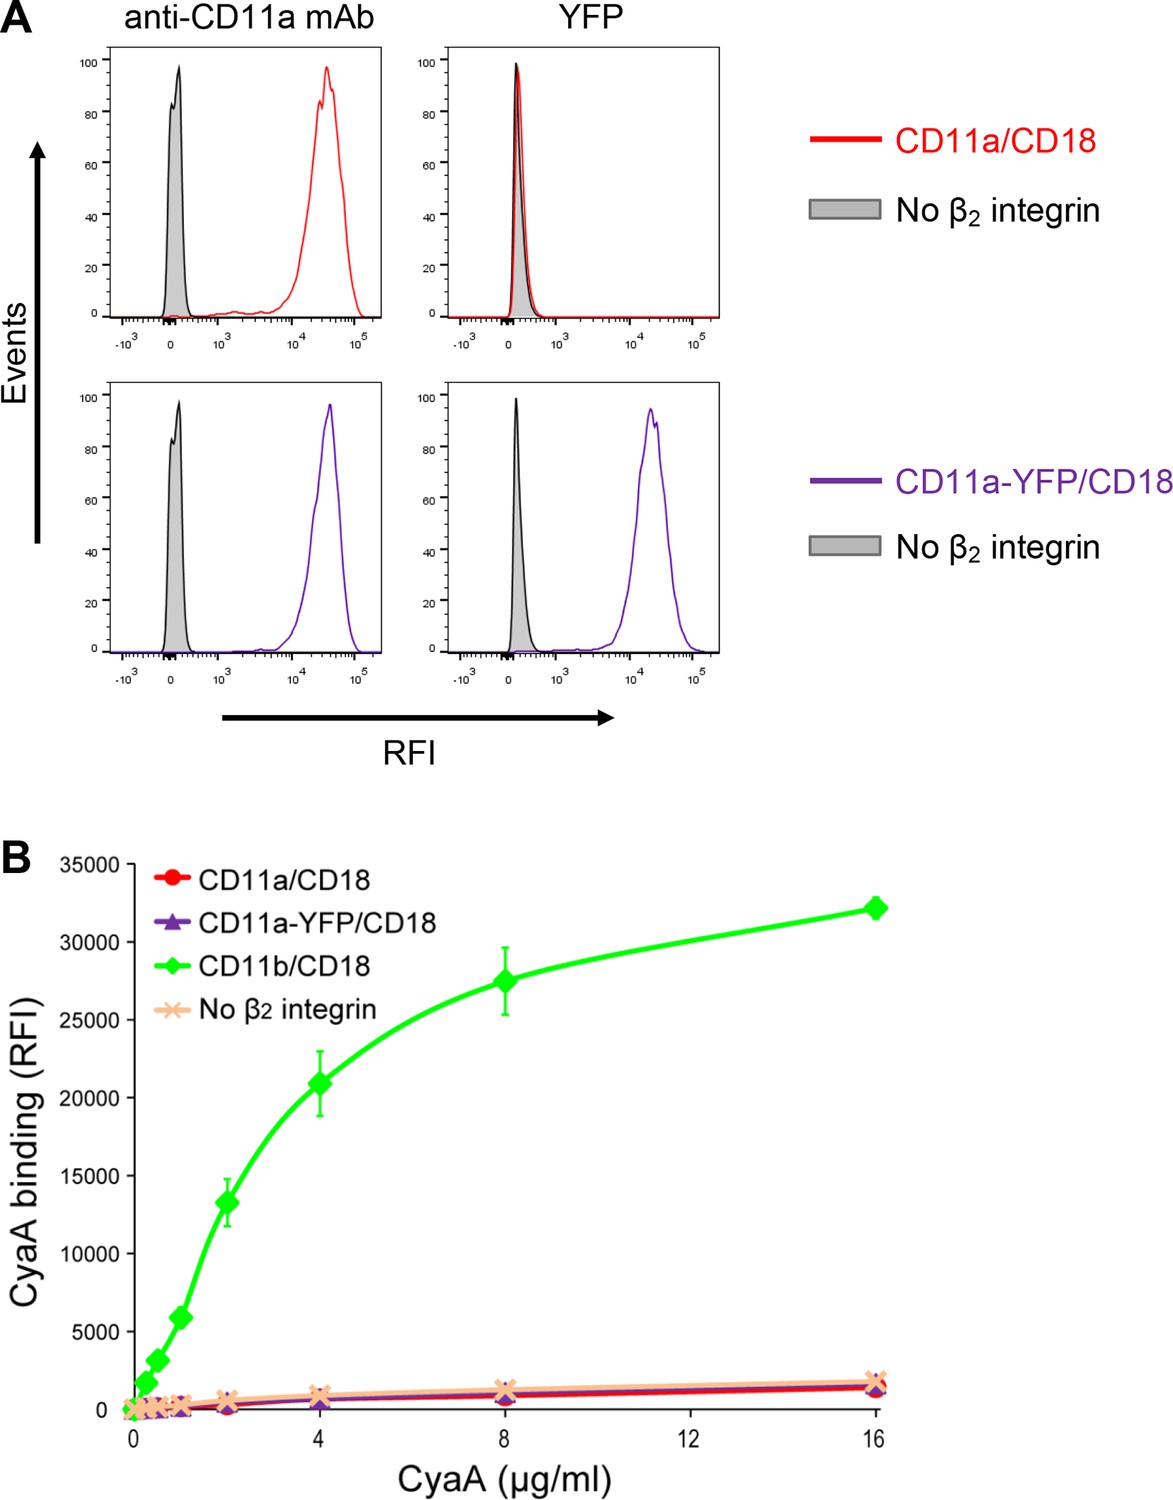
Residual binding of CyaA to CD11a-YFP/CD18 is not due to the presence of the YFP tag.
(A) A CHO cell line stably expressing the intact CD18 subunit was transfected with a plasmid construct encoding CD11a and cells stably expressing CD11a/CD18 were selected using a cell sorter. The expression levels of CD11a/CD18 (red) on the surface of 2x10⁵ cells were examined by flow cytometry upon staining of cells with the anti-CD11a mAb MEM-25 (left panels) and compared with expression levels of CD11a-YFP/CD18 (violet). Both CD11a/CD18- and CD11a-YFP/CD18-epressing cells were also examined by flow cytometry for YFP (right panels). CHO cells expressing no β2 integrin (transfected with empty vectors) were used as negative control (grey). Typical flow cytometry histograms from one representative binding experiment out of four performed are shown. RFI, relative fluorescence intensity. (B) 2x10⁵ stably transfected CHO cells expressing CD11a/CD18, CD11a-YFP/CD18, CD11b/CD18, or no β2 integrin were incubated with different concentrations of Dy647-labeled intact CyaA and analyzed by flow cytometry. Mean fluorescence intensities of CyaA binding were plotted against the concentrations of CyaA. RFI, relative fluorescence intensity. Each point represents the mean value ± SD of two independent experiments performed in duplicate. CyaA binding to cells expressing CD11a/CD18, CD11a-YFP/CD18 or no β2 integrin was at all toxin concentrations significantly lower than toxin binding to cells expressing intact CD11b/CD18 (p<0.0001; ANOVA). In contrast, CyaA binding to cells expressing CD11a/CD18 at all measured toxin concentrations was found to be statistically the same as toxin binding to cells expressing CD11a-YFP/CD18 or no β2 integrin at all (P > 0.1; ANOVA).
Figure 9—figure supplement 3
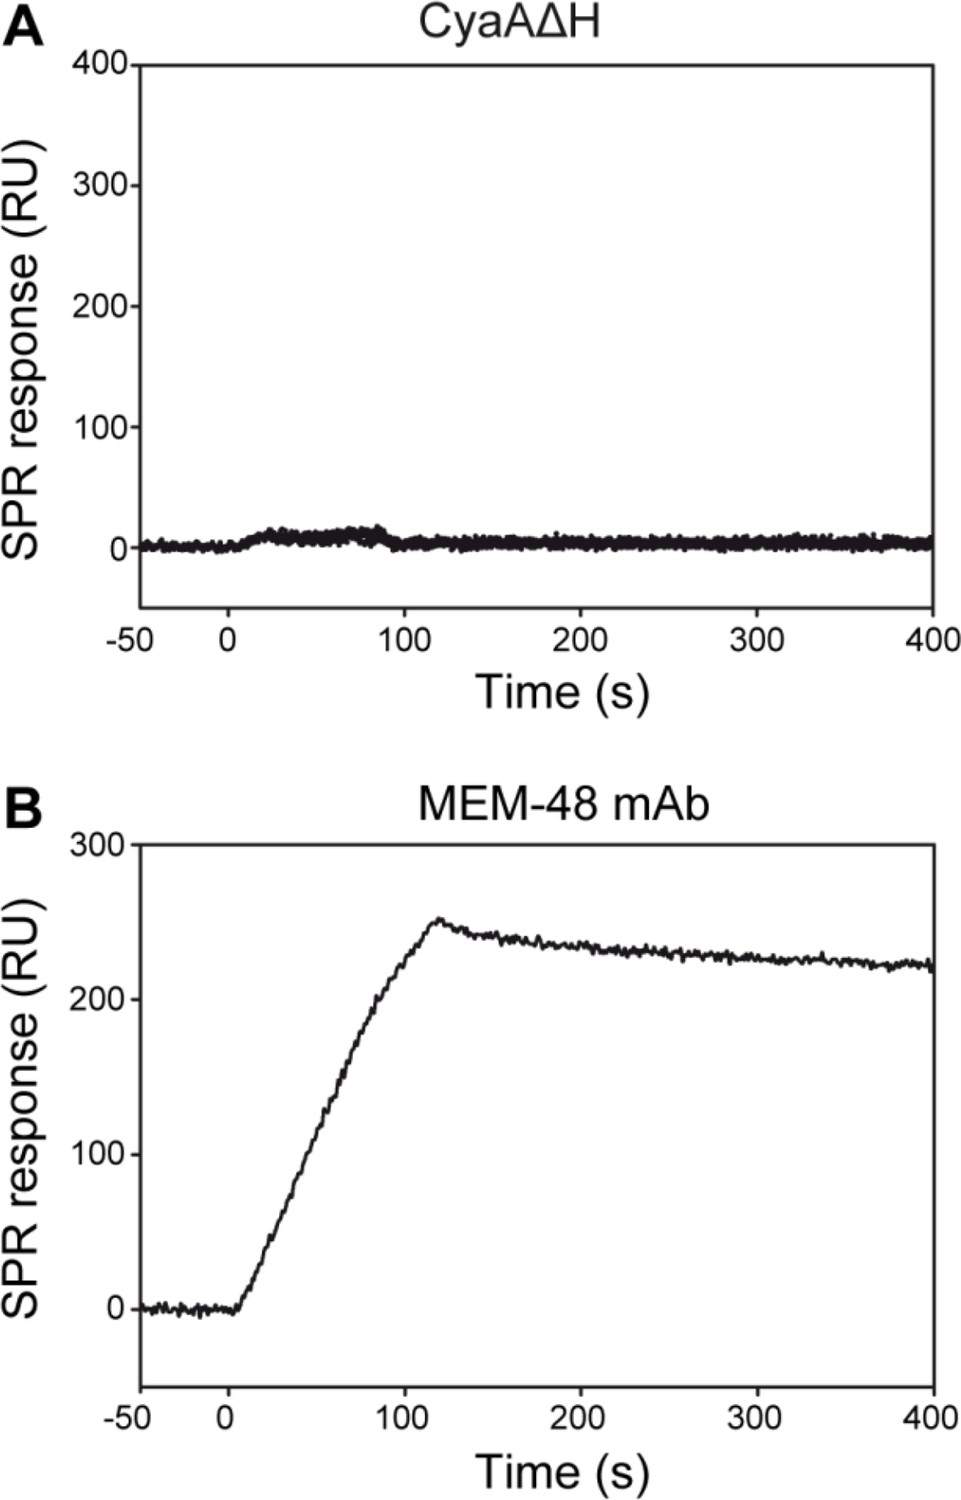
CyaA does not interact with the intact native LFA-1 integrin.
(A) LFA-1 was purified from human peripheral blood mononuclear cells by immunoaffinity chromatography and immobilized onto an SPR sensor chip. To analyze the interaction between LFA-1 and the toxin, CyaA∆H was passed over the chip surface at concentrations of 20, 40, 80, 160 and 320 µg/ml. (B) The MEM-48 mAb recognizing the CD18 subunit of LFA-1 was used as positive control.
Tables
Table 1
Kinetic parameters of CyaA∆H binding to sCR3 calculated by a bivalent analyte model.
| Liganda | Analyte | ka1 [×103 M-1s-1] | kd1 [×10-3 s-1] | ka2 [×10-4 RU-1s-1] | kd2 [×10-4 s-1] |
|---|---|---|---|---|---|
| Bent sCR3 | CyaA∆H | 5.8 ± 0.7 | 1.2 ± 0.2 | 1.3 ± 0.2 | 3.8 ± 0.5 |
| Extended sCR3 | 2.8 ± 0.2 | 1.8 ± 0.4 | 2.7 ± 0.3 | 5.1 ± 0.6 |
-
aTwo independent SPR binding experiments were performed in duplicate and the differences between mean values of CyaA∆H binding to the bent and extended conformation of sCR3 were statistically significant (p<0.01; Student’s t-test).
Download links
A two-part list of links to download the article, or parts of the article, in various formats.
Downloads (link to download the article as PDF)
Open citations (links to open the citations from this article in various online reference manager services)
Cite this article (links to download the citations from this article in formats compatible with various reference manager tools)
Bordetella adenylate cyclase toxin is a unique ligand of the integrin complement receptor 3
eLife 4:e10766.
https://doi.org/10.7554/eLife.10766


