ETS family transcriptional regulators drive chromatin dynamics and malignancy in squamous cell carcinomas
- The Rockefeller University, United States
- Albert Einstein College of Medicine, United States
Figures
Figure 1 with 2 supplements
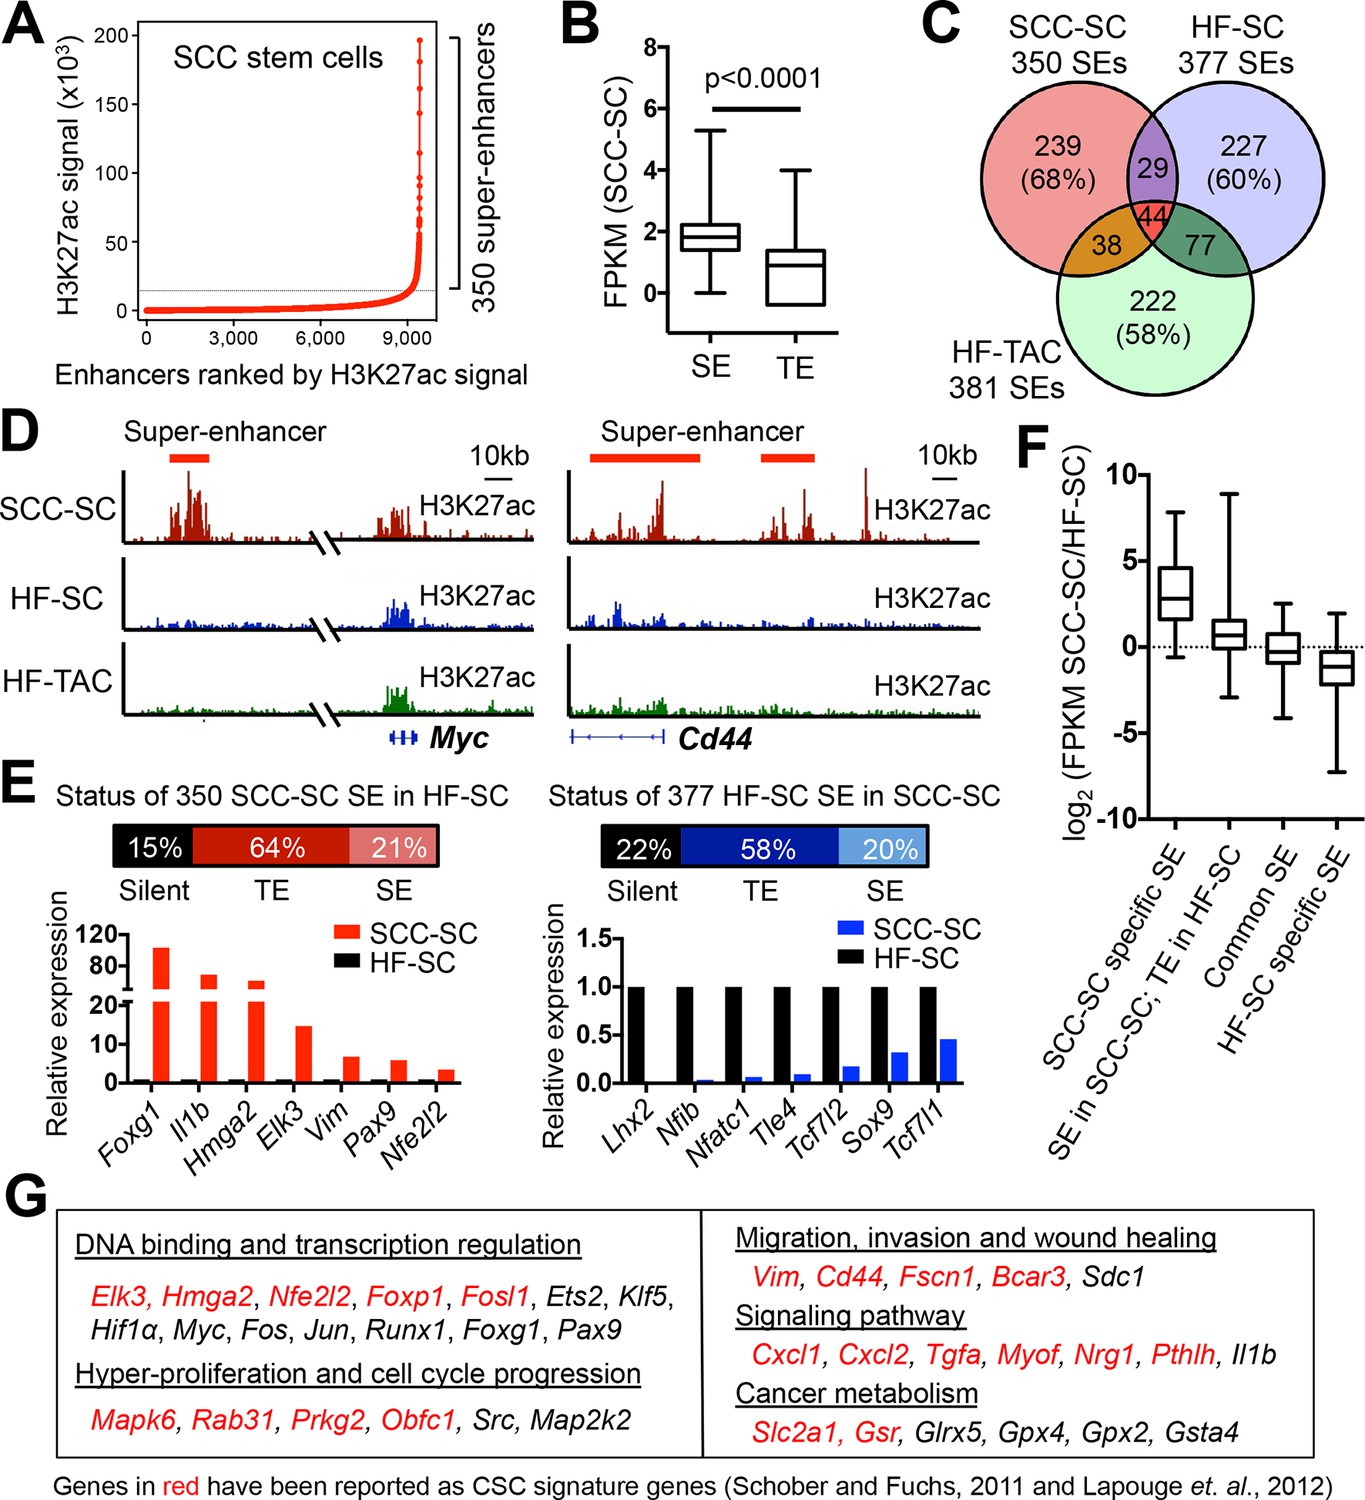
Chromatin mapping reveals striking differences between normal skin SCs and SCC-SCs.
(A) Identification of H3K27ac super-enhancers in SCC-SCs. (B) Differential gene expression levels driven by SCC-SC super-enhancers and typical-enhancers. p-Values are from t-test. (C) Venn diagram showing that super-enhancers of SCC-SCs show little overlap with HF-SCs or HF-TACs. (D) Examples of SCC-SC-specific super-enhancers at Myc and Cd44 loci. (E) Differences between HF-SC and SCC-SC super-enhancers. Note the decommissioning of HF-SC master regulators in SCC-SCs and corresponding suppression of HF-SC TF expression. (F) Enhancer remodeling correlates with gene expression changes. Boxplot displaying the full range of gene expression changes (min. to max.). (G) Selected genes associated with SCC-SC super-enhancers. HF, hair follicle; SC, stem cell; SCC, squamous cell carcinoma; TF, transcription factor.
Figure 1—figure supplement 1
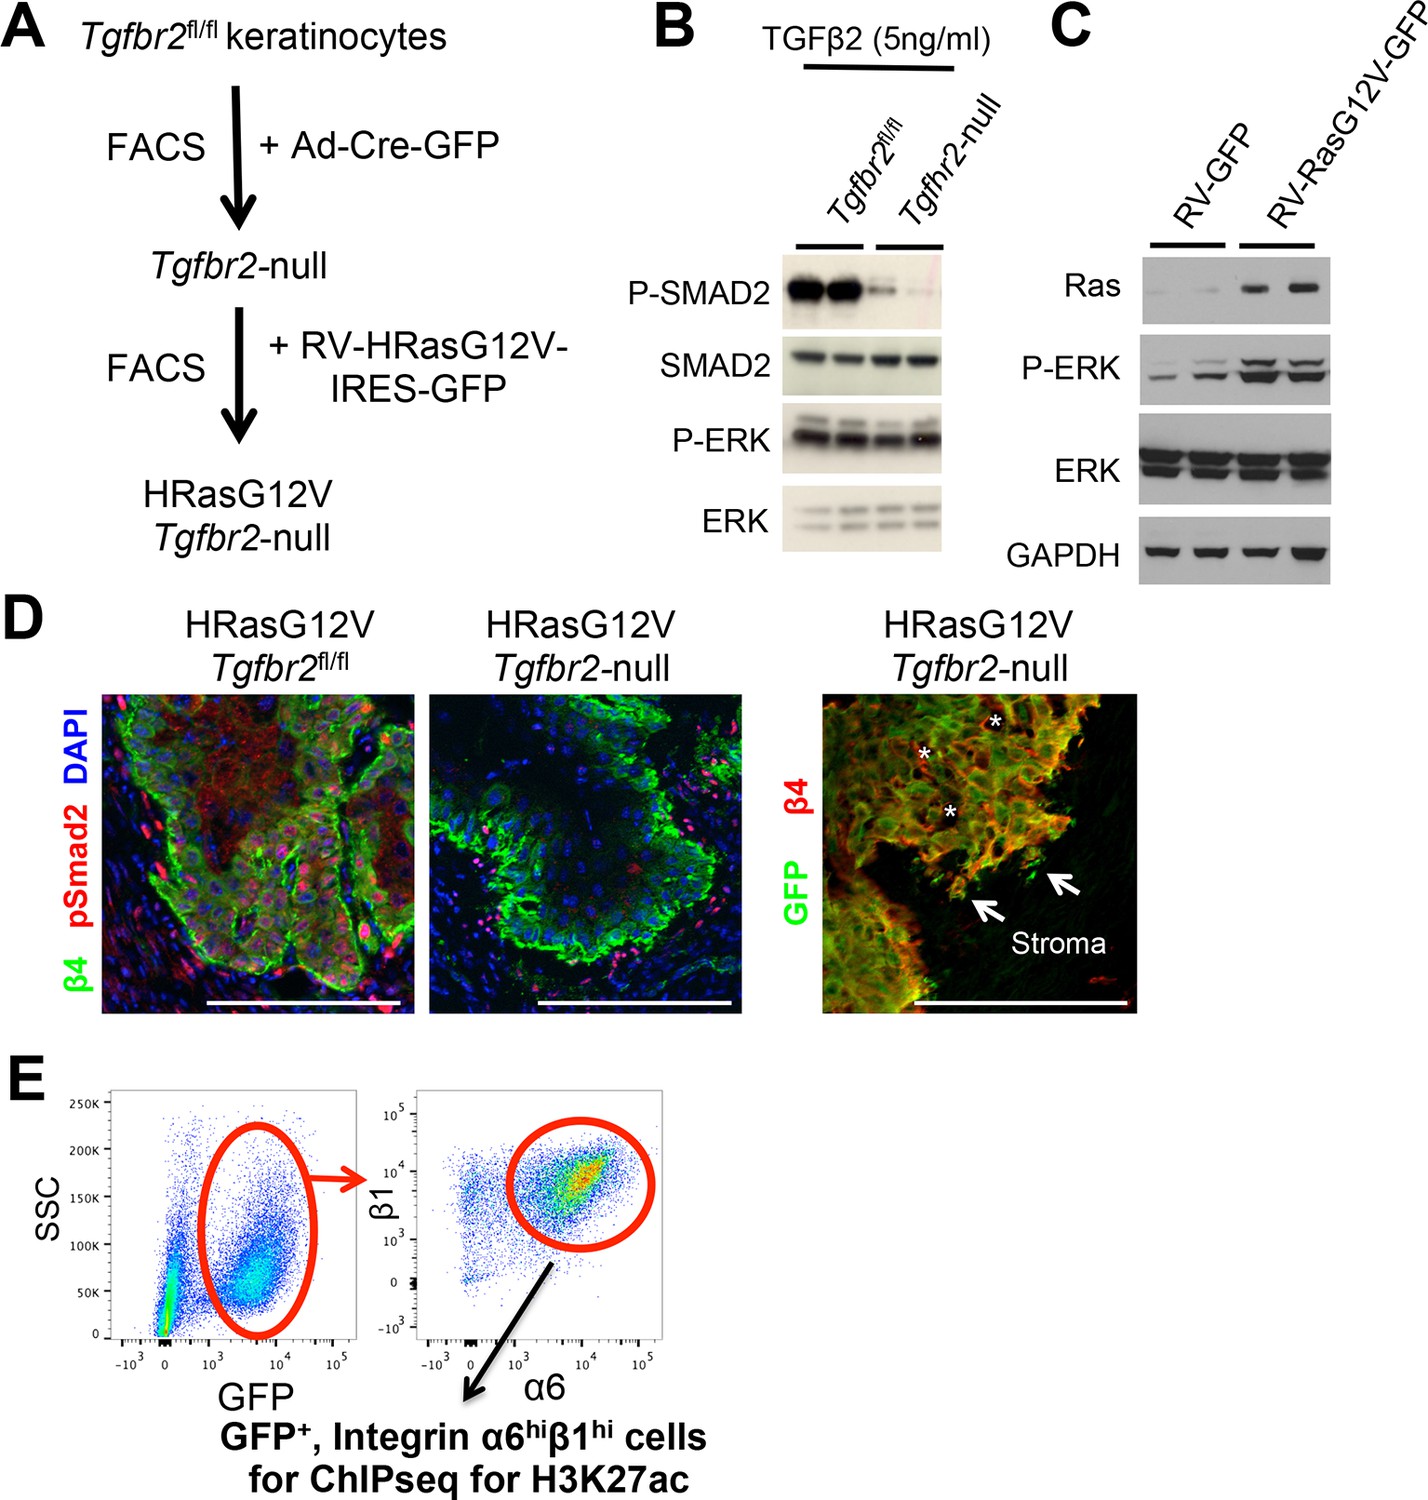
Validation of the allograft tumor model.
(A) Schematic of HRasG12V; Tgbr2-null SCC allograft model. (B) Immunoblot analysis showing impaired TGFβ/SMAD signaling in HRasG12V;TGFβRIIKO-GFP keratinocytes. (C) Immunoblot analysis showing increased Ras/MAPK/Erk activation (P-ERK) in in HRasG12V; Tgbr2-null keratinocytes. (D) Immunofluorescence microscopy validates the loss of TGFβ signaling in primary SCCs. Note that phospho-SMAD2 is activated in HRasG12V; Tgbr2fl/fl tumors, but not in HRasG12V; Tgbr2-null tumors. Scale bars, 100 μm. (E) FACS purification scheme for isolating SCC stem cells for ChIP-seq analysis: Representative flow cytometry profiles of cells isolated from primary HRasG12V; Tgbr2-null SCCs and fractionated based on surface α6 (CD49f) and β1 (CD29) integrins (high in SCC-SCs) after selecting live, GFP-positive, transplanted tumor cells. FACS, fluorescence-activated cell sorting; SC, stem cell; SCC, squamous cell carcinoma.
Figure 1—figure supplement 2
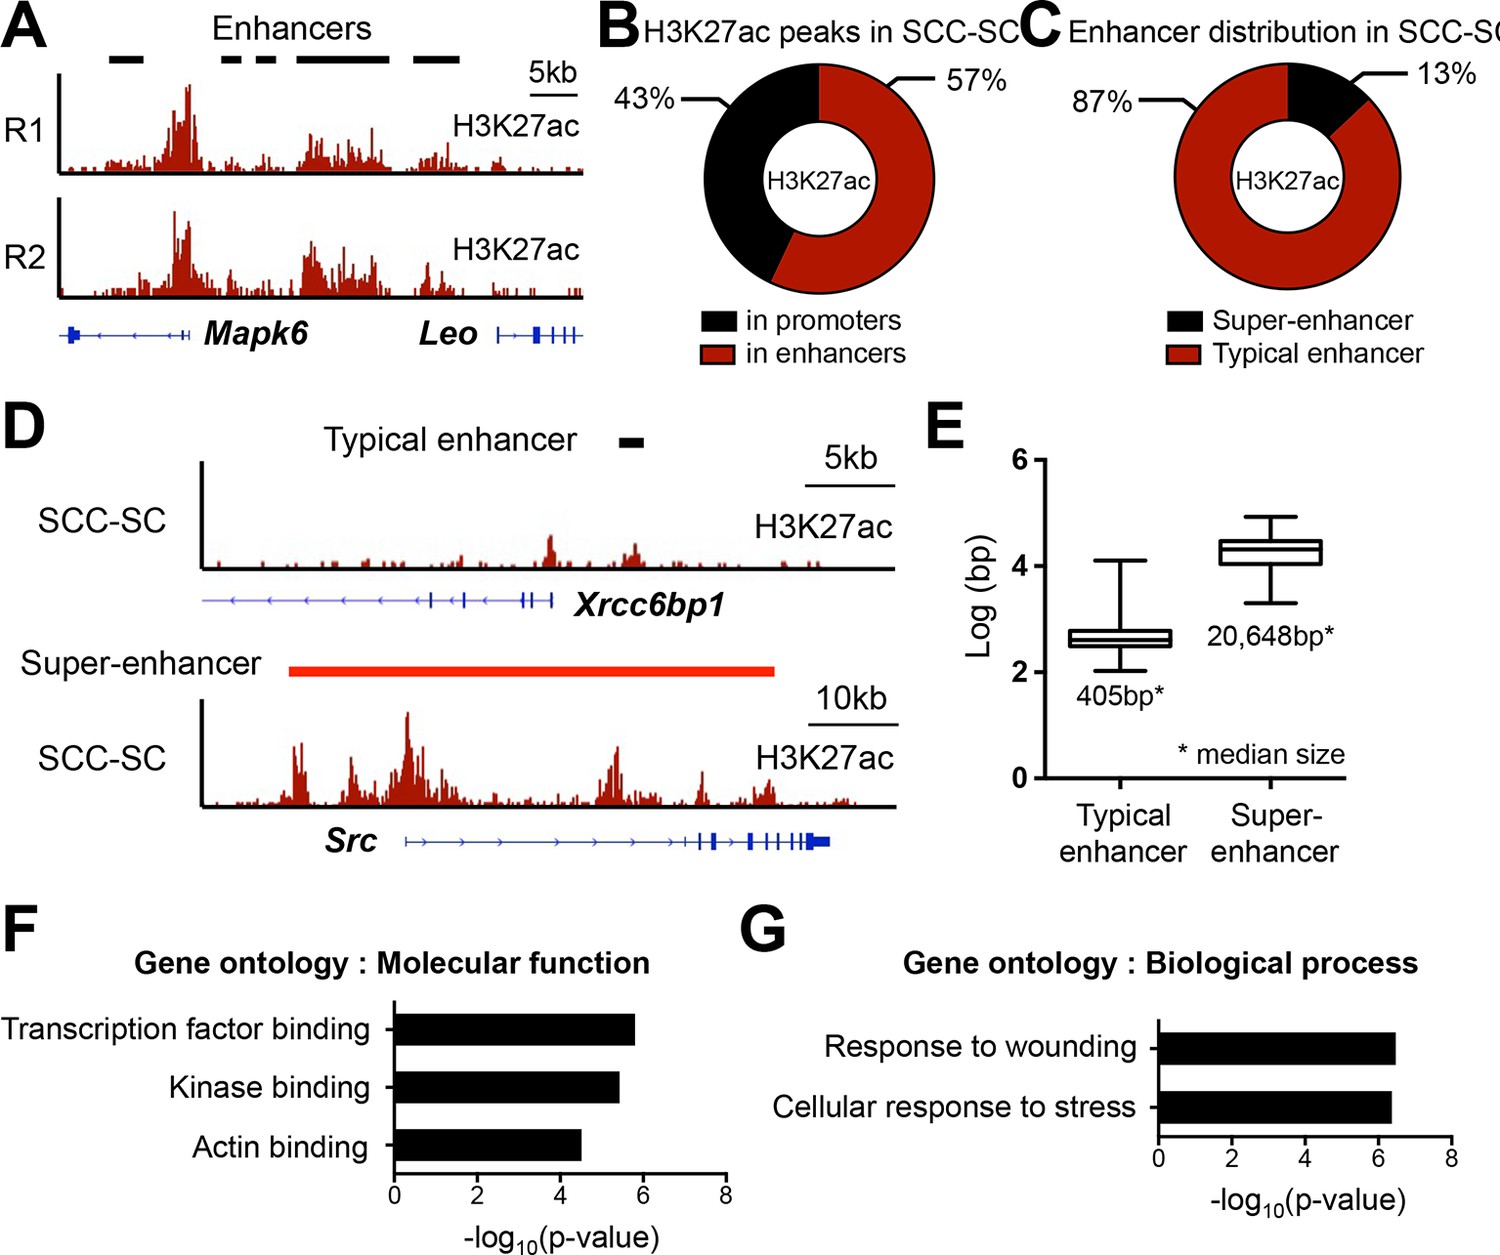
Super-enhancer profiling in SCC-SCs.
(A) Representative example of H3K27ac-marked super-enhancers at the Mapk6 locus in SCC-SCs shows highly similar profiles of two independent biological replicates. (B) Distribution of H3K27ac occupancy at promoter and enhancers in SCC-SCs. (C) Distribution of typical- and super-enhancers in SCC-SCs. (D) Representative H3K27ac-marked typical-enhancer and super-enhancer at Xrcc6bp1 and Src loci, respectively, in SCC-SCs. (E) Enhancer size distribution in SCC-SCs. (F and G) Gene Ontology analysis of SCC-SCs super-enhancer-associated genes on molecular function and biological process. SCC-SC, squamous cell carcinoma-stem cell.
Figure 2
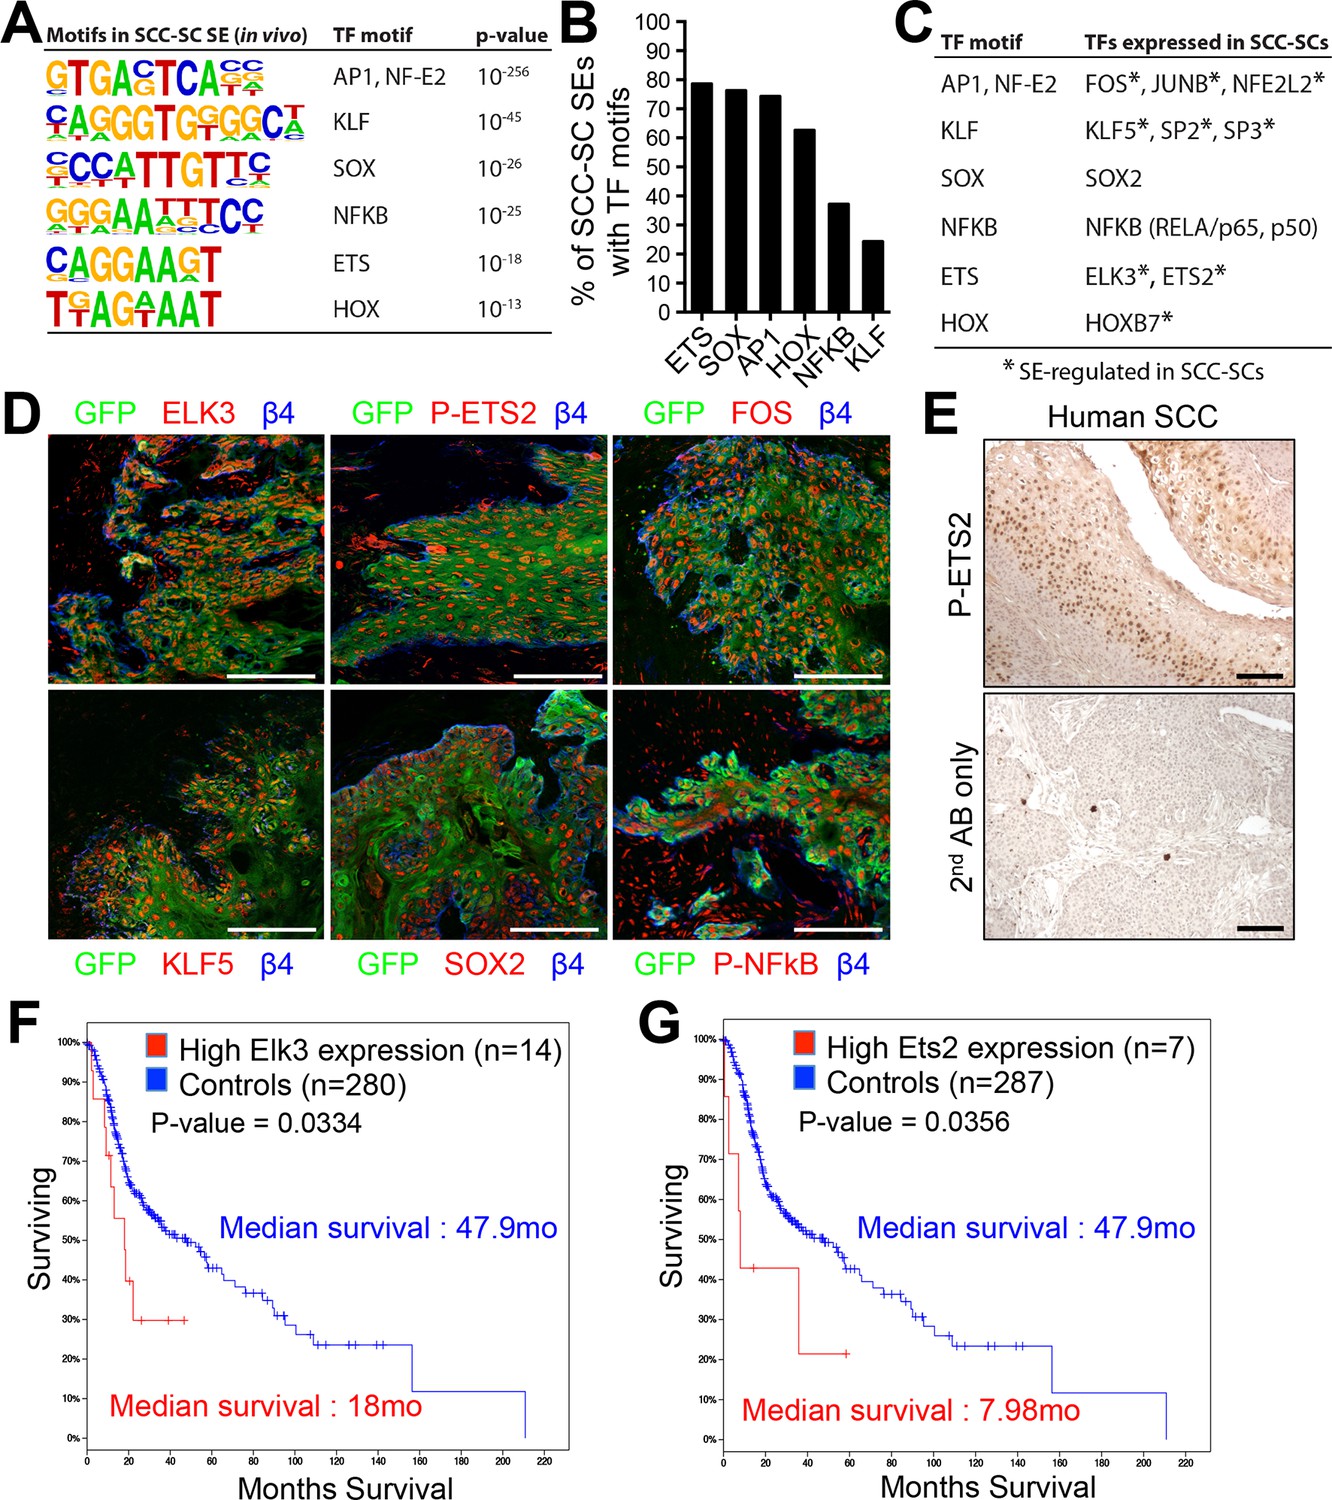
Identification of a cohort of SCC-SC specific transcriptional regulators.
(A) Motif analysis of SCC-SC super-enhancers for putative TF binding sites. (B) Frequency of putative TF binding sites in SCC-SC super-enhancers. (C) SCC-SC TFs with potential to bind to the TF-motifs within SCC-SC super-enhancers. Genes encoding the TFs that are marked with an asterisk are SE-associated. (D) Immunofluorescence images showing nuclear localization of SCC-SC TFs (red) in allograft SCC-SC-derived tumors (GFP). Scale bars, 100 μm. (E) Immunohistochemistry with P-ETS2 antibodies in human SCC samples. (F and G) High expression of mouse SCC-SC-expressed ETS family members correlate with poor survival in human SCCs. Kaplan–Meier analysis compares overall survival of TCGA head and neck SCC patients stratified according to high and low ELK3 and ETS2 expression. SC, stem cell; SCC, squamous cell carcinoma; TF, transcription factor;
Figure 3
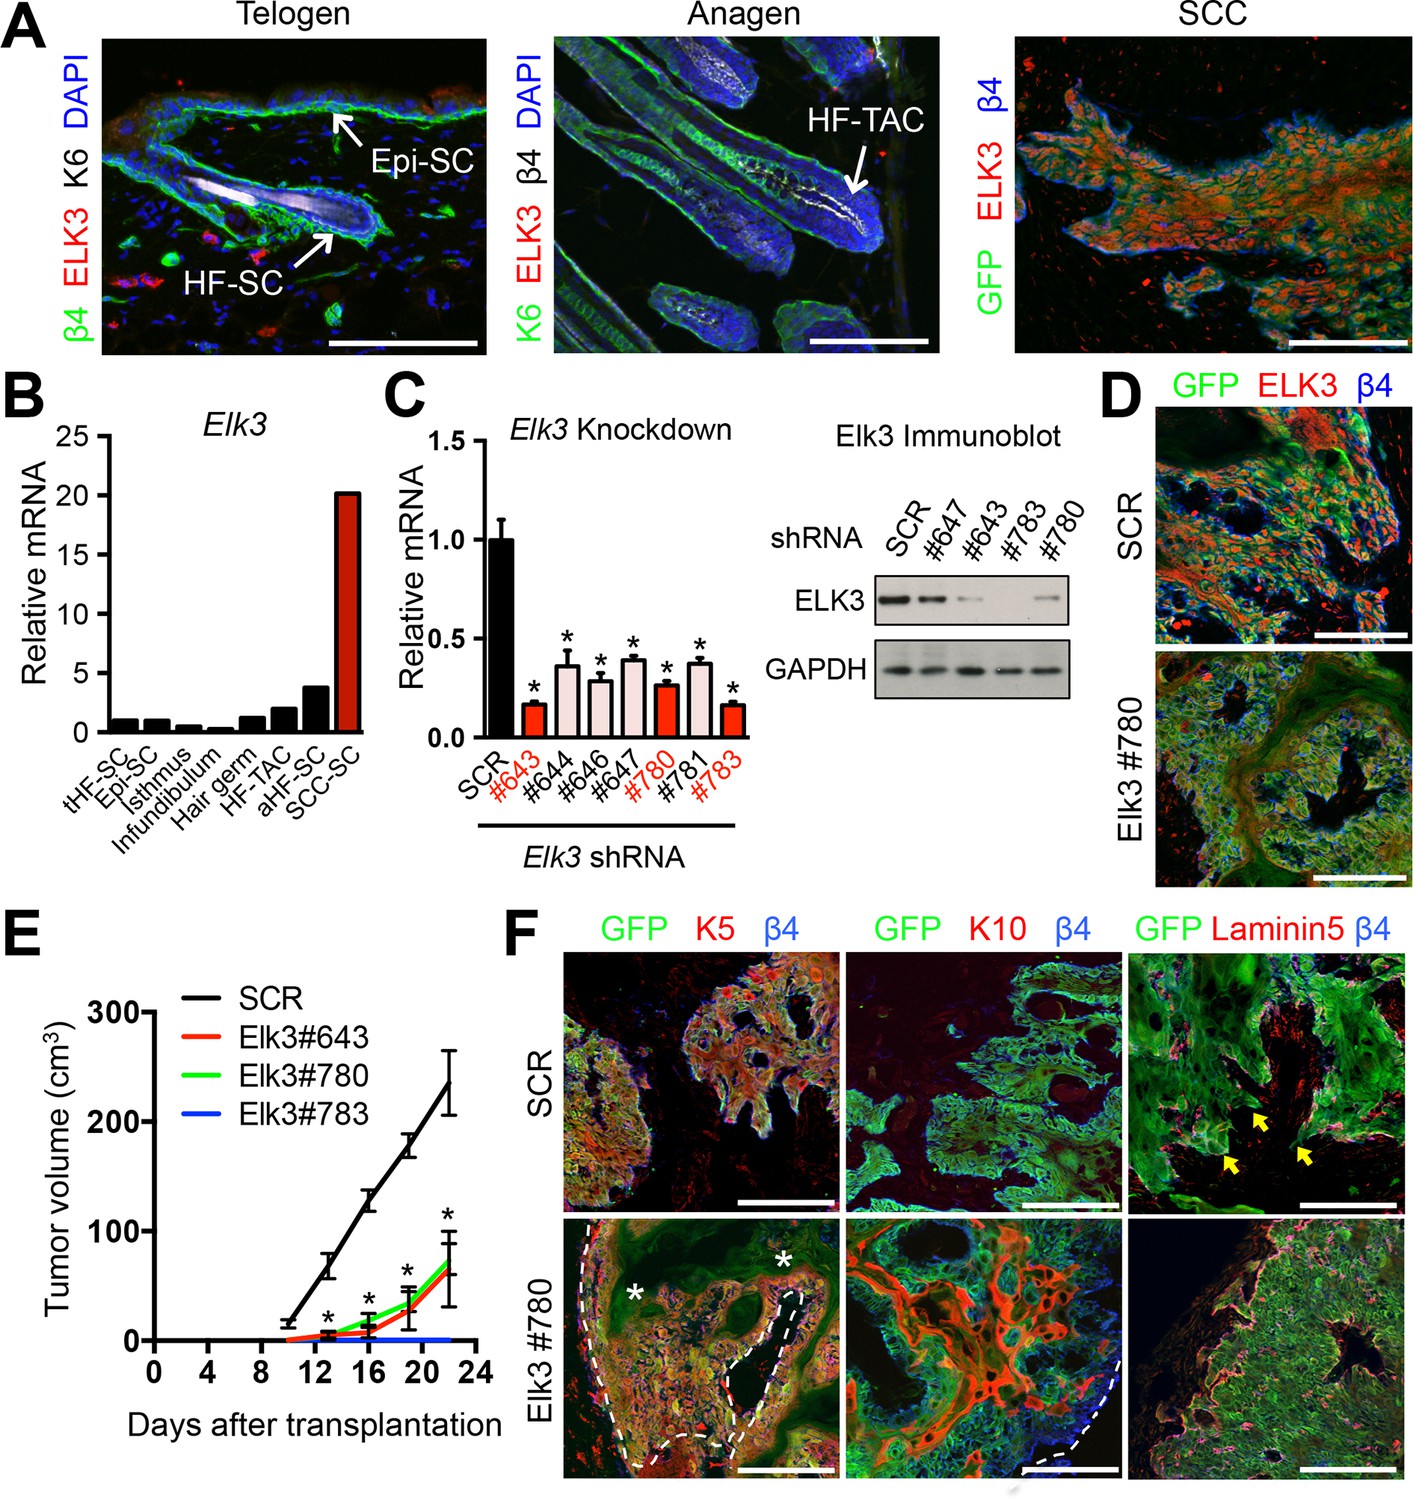
ELK3 is specifically induced in SCC-SCs and promotes SCC growth.
(A) Immunofluorescence analysis showing that ELK3 is absent in normal skin epithelia but expressed in SCC-SC-derived allograft tumors. Epi-SC, epidermal basal cells; HF-SC, hair follicle stem cells; HF-TAC, short-lived, transit-amplifying cells. Scale bars, 100 μm. (B) Elk3 gene expression is low or absent in normal skin cells but specifically induced in SCC-SCs. Telogen(t) and anagen(a) HF-SCs; isthmus, infundibulum, and hair germ are other progenitor compartments of the HF. (C) (left) Knockdown efficiency of Elk3 shRNAs in HRasG12V; Tgfbr2-null cells as measured by quantitative RT-PCR. (n = 3 ± SEM; *p<0.05). (right) Immunoblot analyses confirming that changes in mRNA levels are reflected at the level of protein. (D) Immunofluorescence image of allograft tumors (GFP) from control and Elk3-knockdown SCC-SCs. Scale bars, 100 μm. (E) Changes in tumor volume of Elk3 knock-down and control allografts over time (n = 3). (F) Immunofluorescence images of Elk3 knock-down allograft tumor (GFP) showing reduced numbers of undifferentiated keratin 5 (K5) cells, appearance of keratinized pearls of cells expressing differentiation marker keratin 10 (K10), and diminished signs of basement membrane breakdown (as judged by laminin 5) and of invasion at the tumor-stromal interface. Asterisks mark absence of K5 in keratinized pearls. Dotted line marks tumor-stromal boundaries. Arrows denote invasive tumor cells at signs of discontinuous basement membrane. Scale bars, 100 μm. HF, hair follicle; SC, stem cell; SCC squamous cell carcinoma.
Figure 4
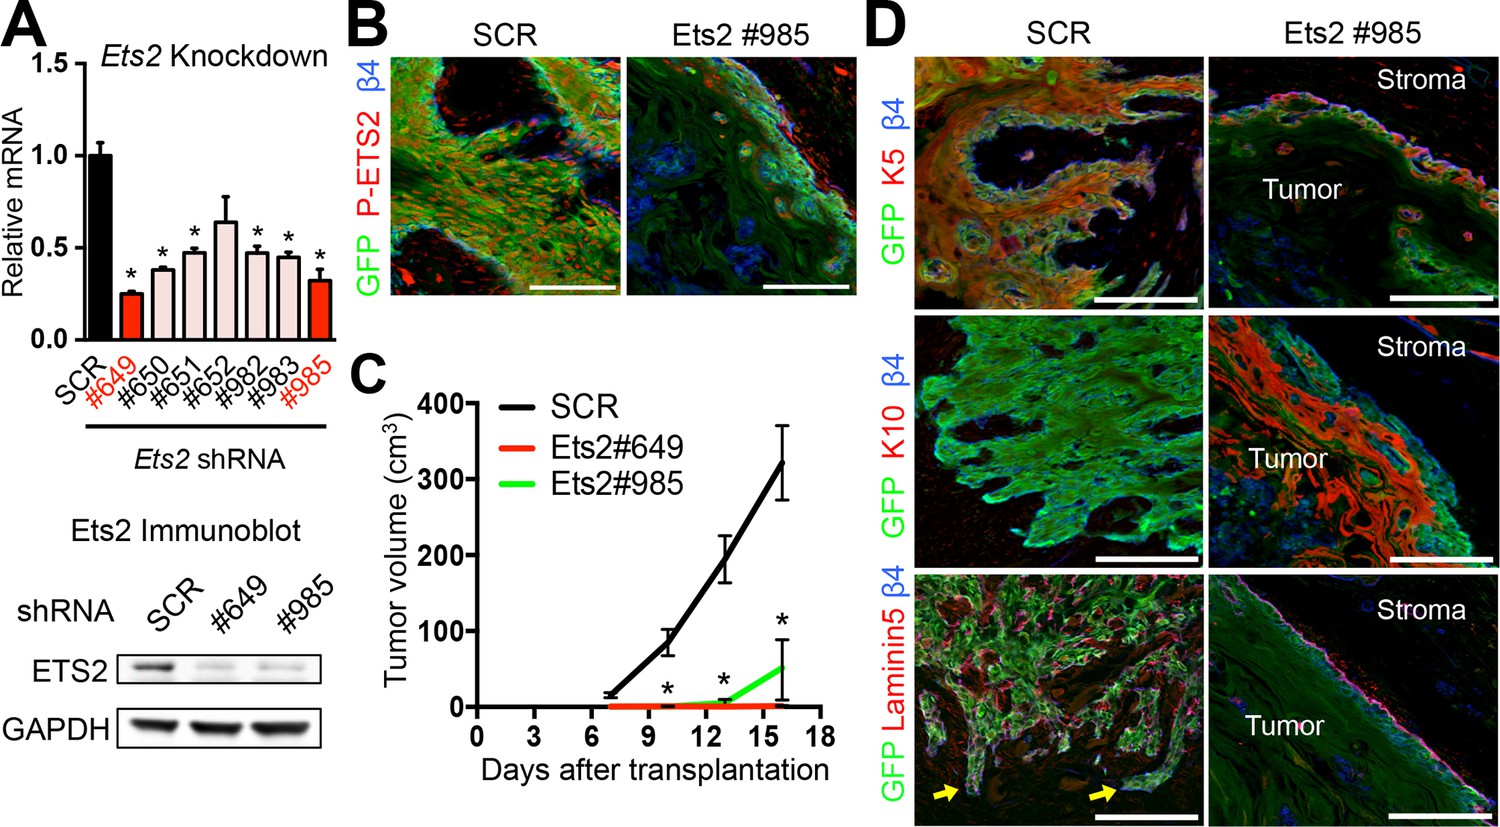
ETS2 governs SCC growth and malignancy.
(A) (left) Knockdown efficiency of Ets2 shRNAs in HRasG12V; Tgfbr2-null cells as measured by quantitative RT-PCR. (n = 3 ± SEM *p<0.05). (right) Immunoblot analyses confirming that changes in mRNA levels are reflected at the level of protein. (B) Immunofluorescence image of allograft tumor (GFP) showing reduced ETS2 protein in Ets2 knock-down tumors. Scale bars, 100 μm. (C) Changes in tumor volume of Ets2 knock-down and control allografts over time (n = 3). (D) Immunofluorescence images of allograft tumors (GFP) of transduced SCC-SCs. Note reduction in undifferentiated K5+ cells and appearance of keratinized pearls of K10+ differentiated cells upon Ets2 knock-down. Of note, yellow arrows depict regions of discontinuous laminin5 and integrin β4 staining, indicative of a disrupted basement membrane and local tumor invasion. Scale bars, 100 μm. SC, stem cell; SCC, squamous cell carcinoma; SEM, standard error of the mean.
Figure 5 with 1 supplement
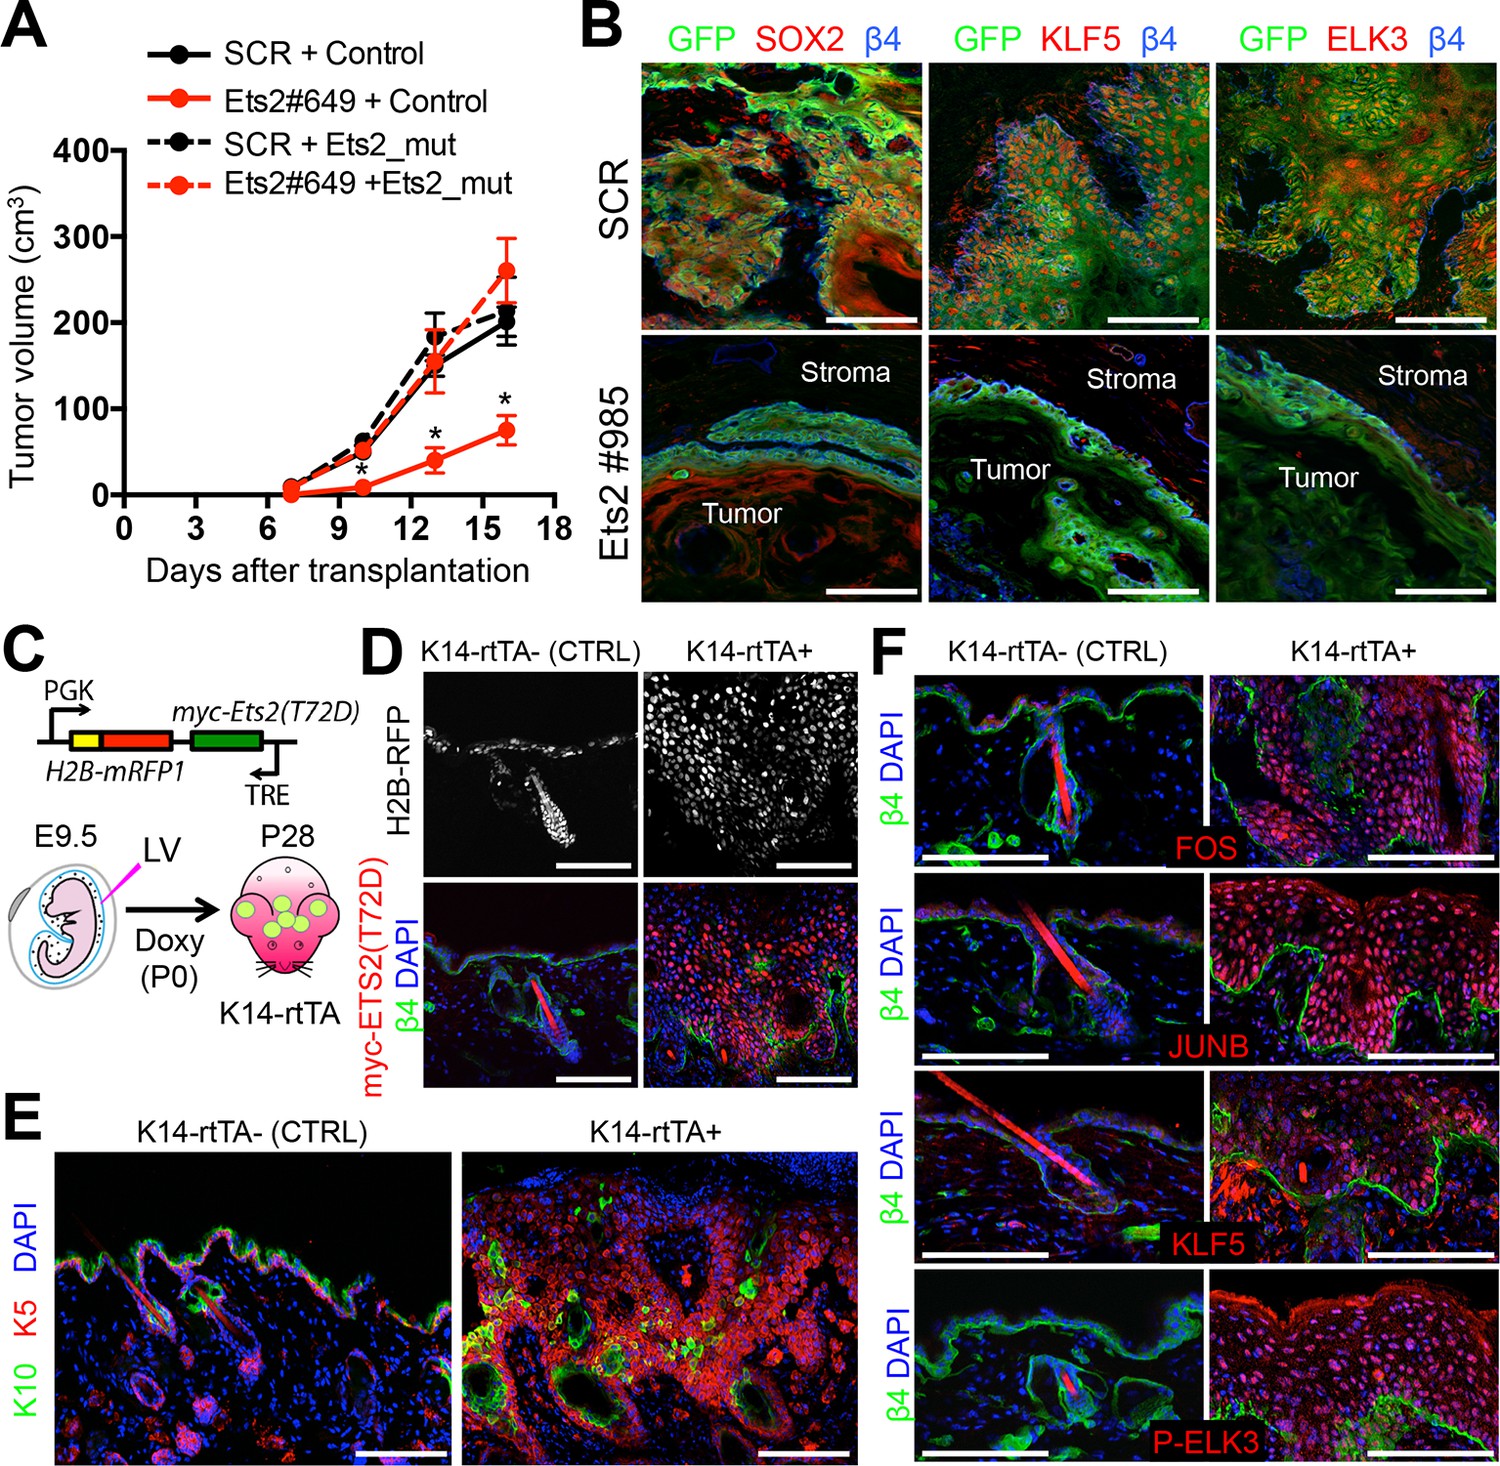
ETS2 controls a transcriptional network driving SCC growth.
(A) Rescue of SCC-SC growth by expressing an Ets2 cDNA harboring silent mutations in the Ets2-shRNA target site. (B) Immunofluorescence images of allograft tumors (GFP) derived from transduced SCC-SC cells. Note loss of SOX2, KLF5, and ELK3 expression in Ets2 knock-down but not control tumors. Scale bars, 100 μm. (C) Schematic of strategy to induce expression of a constitutively active, ETS2 (T72D) in normal skin. (D) Validation of efficient in utero transduction (H2B-RFP) and postnatal ETS2-T72D Doxy-induction in skin epithelium. (E) ETS2-T72D expression induces expansion of undifferentiated K5+ cells resulting in epidermal thickening and invagination. (F) Induction of constitutively active ETS2-T72D in epidermal progenitors results in marked upregulation of four additional TFs which have sequence motifs in >70% of SCC-SC super-enhancers and whose genes are themselves regulated by super-enhancers. SC, stem cell; SCC, squamous cell carcinoma.
Figure 5—figure supplement 1
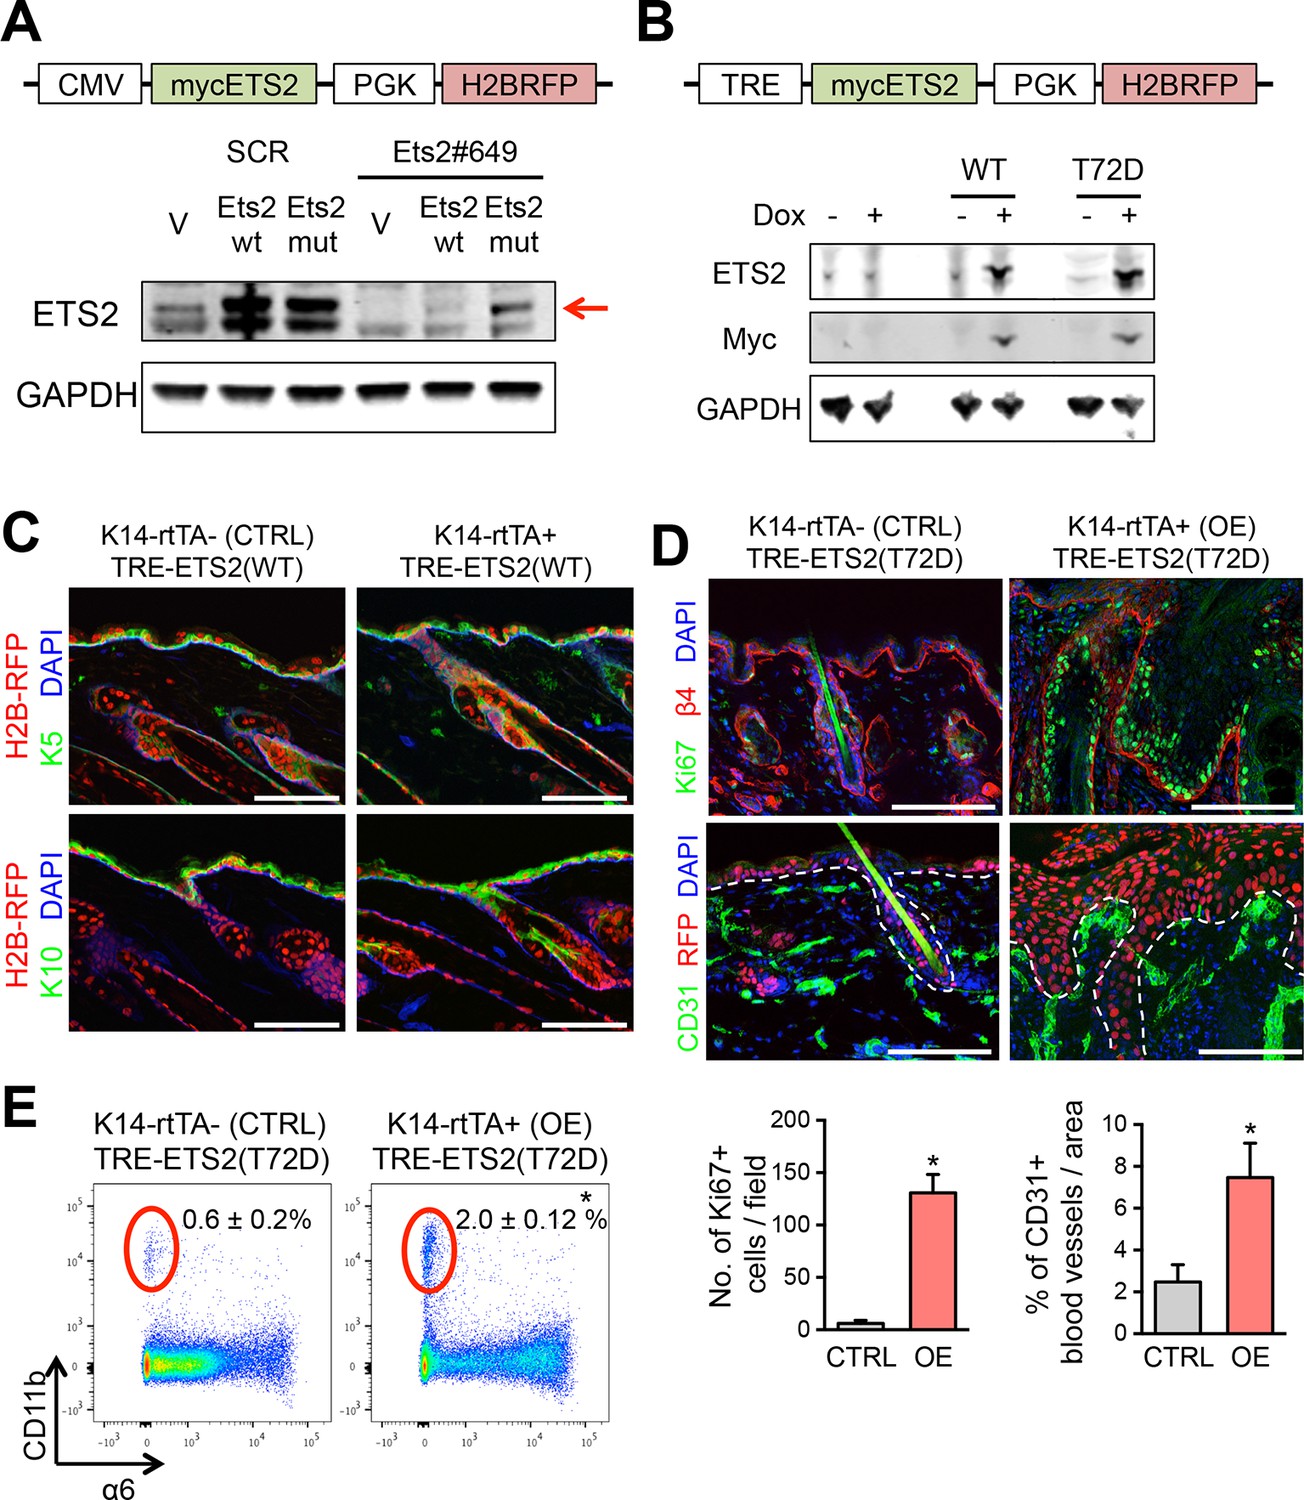
Validation of ETS2 expression constructs.
(A) Lentiviral-based vector allowing for constitutive expression of a myc-tagged ETS2 cDNA, either WT or harboring silent mutations that abrogate shRNA binding. Immunoblot analysis to verify that both constructs express ETS2 protein at equivalent levels in HRasG12V; Tgfbr2-null keratinocytes, but that when Ets2#649 shRNA is transduced, myc-ETS2 is only suppressed in cells transduced with the WT 3’UTR and not the mutant 3’UTR version. (B) Vector allowing for Doxycycline-inducible expression of a myc-tagged ETS2 cDNA, either WT or harboring the phosphomimetic T72D varient. H2B-RFP, driven by a constitutively active PGK promoter, was inserted to control for lentiviral transduction. When the vector is transduced in cells or mice expressing the rtTA Doxy-inducible transactivator, Doxy will activate the Myc-tagged, ETS2-T72D protein. Immunoblot analysis to verify ETS2 protein expression in HRasG12V; Tgfbr2-null keratinocytes. (C) Ectopic induction of wild-type ETS2 in skin epidermis does not disrupt the morphology or function of the tissue. At E9.5, litters harboring K14rtTA and control embryos were infected in utero with lentivirus harboring the wild-type ETS2 construct in (B). This method allows for efficient and selective transduction of the skin epithelium by E12.5. Postnatally, these pups were administered Doxycycline to activate rtTA (if present) and 4 weeks later, their skin was analyzed for transduction (H2BRFP) and epidermal architecture (K5 and K10). Sagittal sections of skin are stained with DAPI. Note no significant differences between the control and the WT ETS2 expression. (D) Same experiment in (C) but with the ETS2 (T72D) construct in (B). Note striking difference in phenotype when this version of ETS2, constitutively activated at its Ras/MAPK phosphorylation site, is expressed in otherwise normal skin epidermis. Immunolabeling is for β4 integrin to mark the basal surface of cells attached to an underlying basement membrane; Ki67, to mark actively cycling cells; and CD31, an endothelial marker for blood vessels. Quantifications of Ki67 and blood vessels are shown beneath the immunofluorescence pictures. Bars = 100 µm. (E) FACS profiling of the cells for CD11b, a pan marker of inflammatory immune cells. FACS, fluorescence-activated cell sorting.
Figure 6
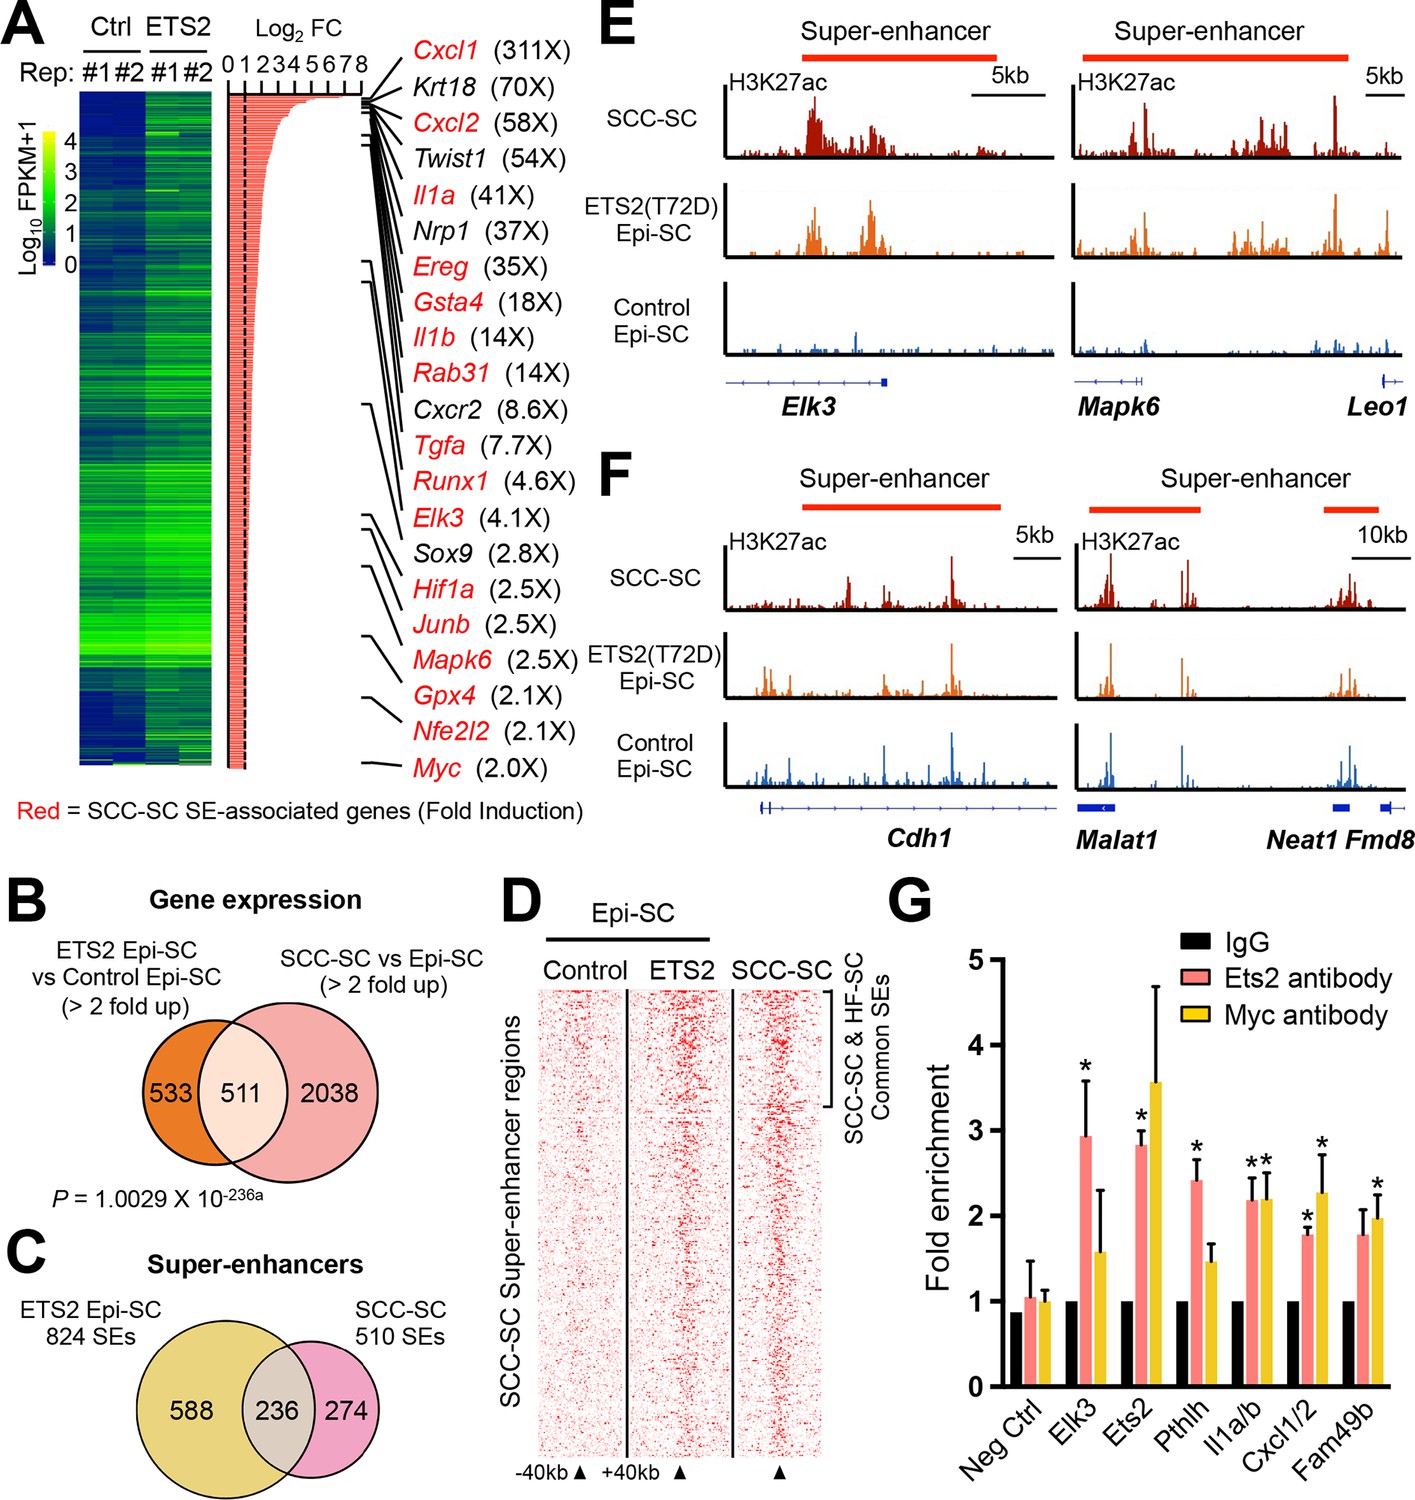
Super-activated ETS2 drives chromatin dynamics and transcriptional changes that occur during malignant transformation.
(A) Summary of transcriptional profiling of basal epidermal progenitors (Epi-SC) purified from ETS2 (T72D) induced or control skin. Significantly upregulated genes (greater than twofold) were ranked and are listed at right with fold changes. Of note, SCC-SC super-enhancer (SE)-associated genes are marked in red. (B) Venn diagram showing significant overlap between differentially regulated transcripts in T72D-ETS2 Epi-SCs and SCC-SC as compared to Epi-SC. (C) Venn diagram showing that SEs of SCC-SCs show high overlap with those of ETS2 (T72D) Epi-SC. (D) Heatmap showing H3K27ac ChIP-seq read densities in the SCC-SC SEs. Note that read densities of ETS2 (T72D) induced Epi-SCs are higher than those of control Epi-SCs. (E) Examples of SEs acquired in ETS2 (T72D) induced Epi-SC and which show significant overlap with SCC-SC SEs. Shown are Elk3 and Mapk6 loci. (F) Examples of SEs shared not only by SCC-SCs and ETS2 (T72D)-EpiSCs, but also by wild-type EpiSCs. Note that both Neat1 and Cdh1 are highly expressed in both normal and malignant skin epithelia. (G) qPCR fold enrichment of ETS2 and myc ChIP DNA of SCC-SC super-enhancer epicenters. Values are normalized to IgG control (n = 3 ± SEM *p<0.05). SC, stem cell; SCC, squamous cell carcinoma.
Figure 7 with 1 supplement
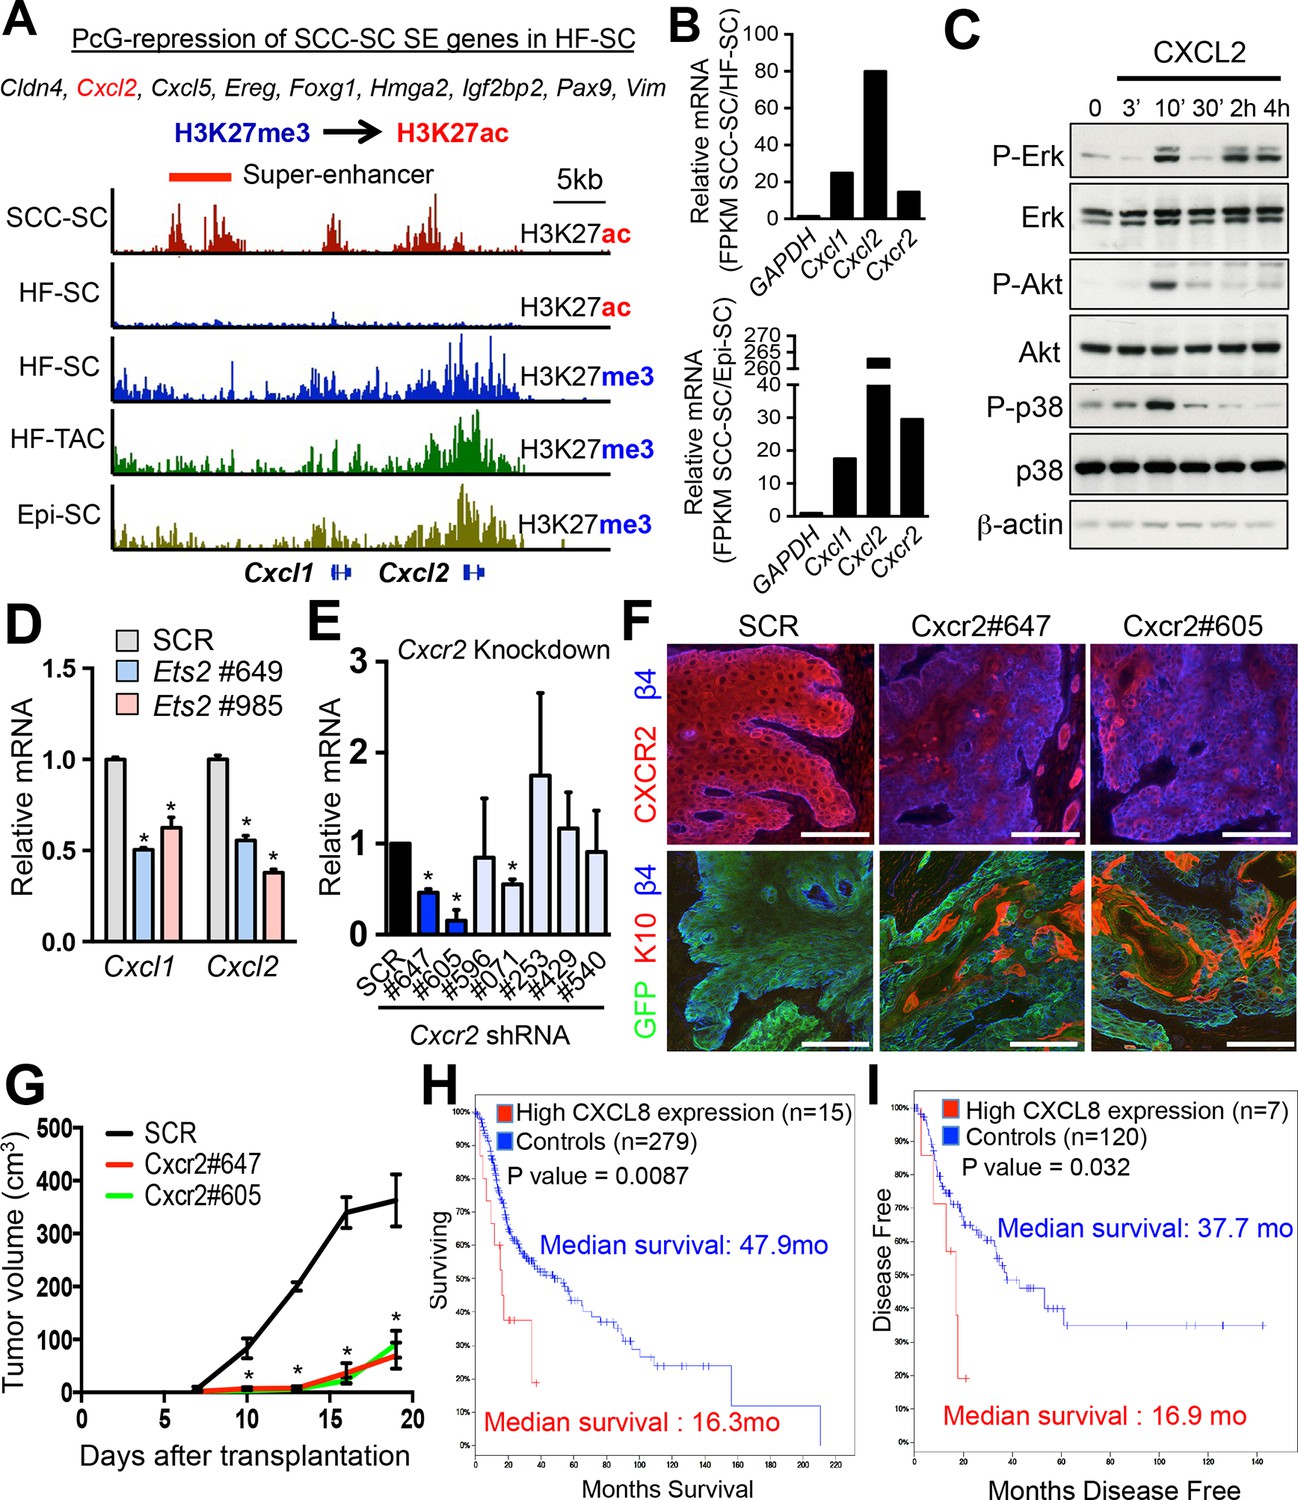
Inflammatory mediators are SCC-SE-regulated and affect SCC growth.
(A) Chromatin status at the Cxcl1/2 locus in SCC-SCs versus normal skin progenitors. Note that strong peaks of H3K27ac-associated, active chromatin are present throughout this locus in SCC-SCs, while in normal skin progenitors, the locus is heavily marked by H3K27me3, indicative of Polycomb-mediated repression. (B) Gene expression changes of Cxcl1, Cxcl2, and Cxcr2 (encoding the receptor for CXCL1/2) in SCC-SCs compared to their normal HF-SC or Epi-SC counterparts. (C) Immunoblot analysis shows that CXCL2 activates MAPK signaling in HRasG12V; Tgfbr2-null keratinocytes. β-actin levels are shown as controls. (D) Knock-down of Ets2 reduces Cxcl1/2 mRNA expression. (E) Knock-down efficiency of Cxcr2 shRNAs in HRasG12V; Tgbr2-null cells as measured by quantitative RT-PCR. (n = 3 ± SEM *p<0.05). (F) Immunofluorescence images of allograft tumors (GFP) from Cxcr2-shRNA and scrambled control-shRNA transduced SCC-SC cells. Note that CXCR2-reduction is accompanied by a marked increase in K10+ differentiated cells within the tumors. Scale bars, 100 μm. (G) Changes in tumor volume of Cxcr2 knock-down and control allografts over time (n = 3). (H and I) High CXCL8 expression (the closest human homologue for CXCL1/2) correlates with shortened survival in human head & neck SCC patients. Kaplan–Meier analysis comparing overall survival (H) and disease-free survival (I) of TCGA HNSCC patients stratified according to the highest (>5th percentile) CXCL8 expression/amplification versus the rest (>5th percentile) (please visit http://bit.ly/1Afq0Gt). SC, stem cell; SCC, squamous call carcinoma.
Figure 7—figure supplement 1
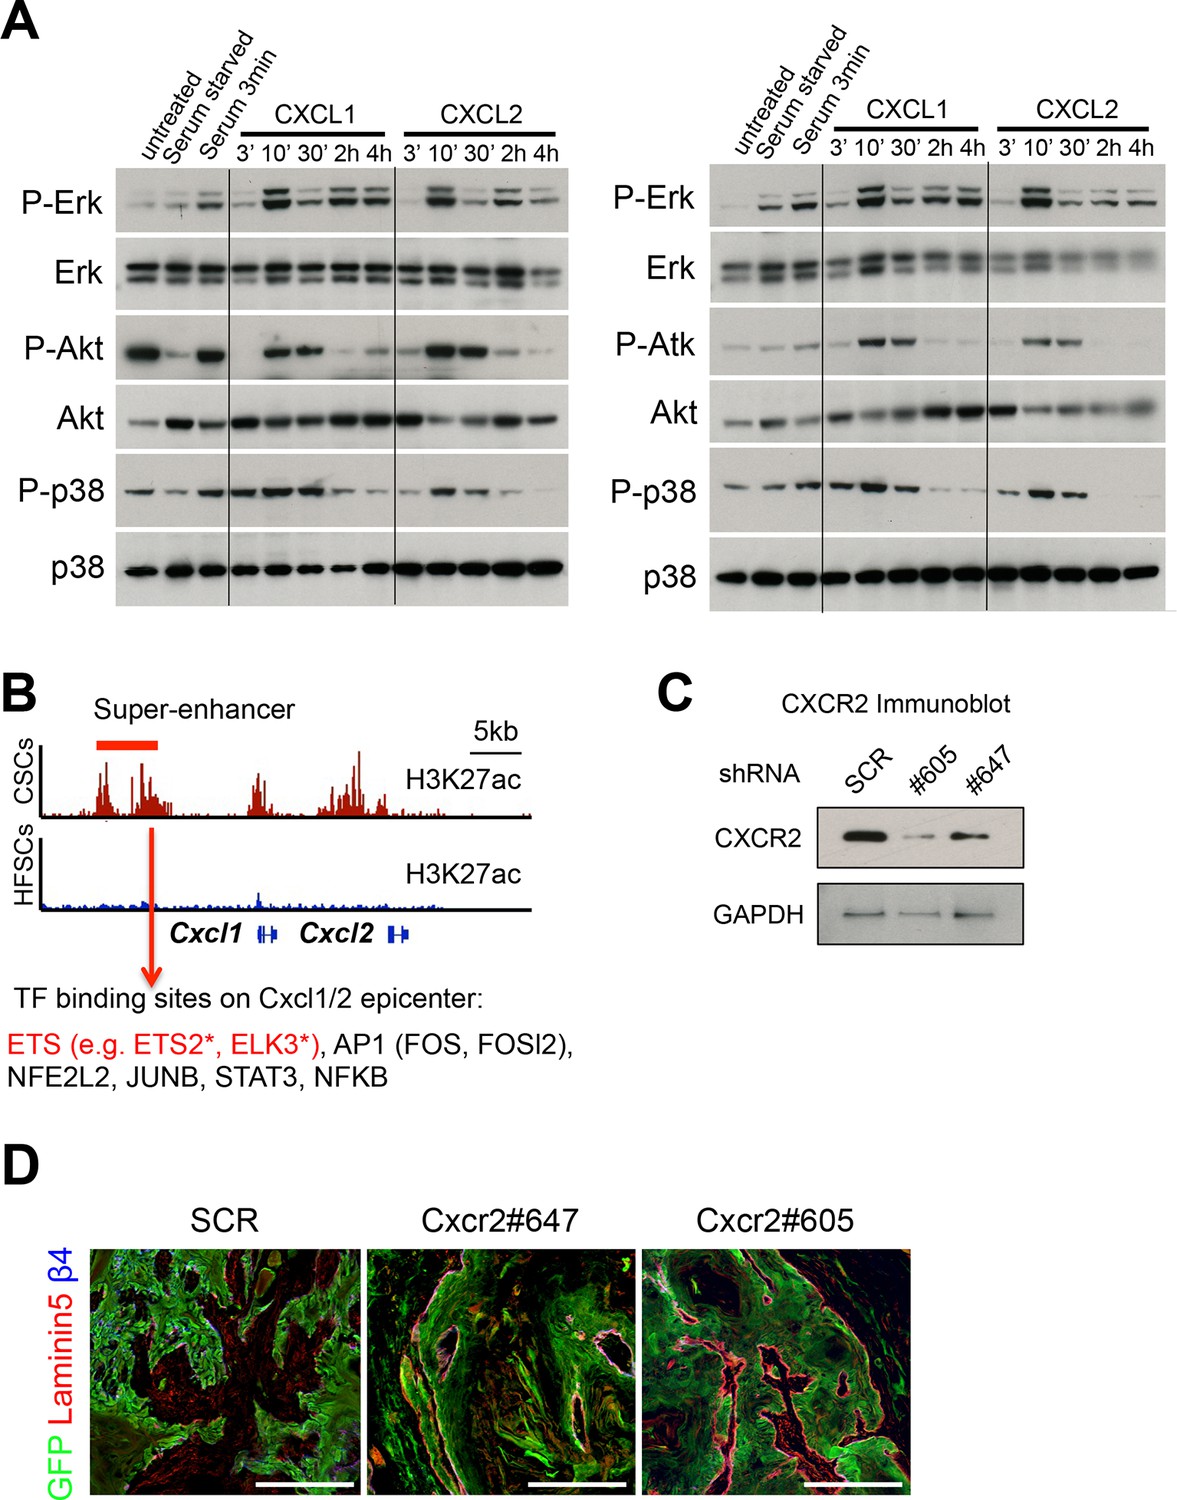
SCC-SC TFs coordinately bind to Cxcl1/2 SE-epicenters.
(A) Two replicate immunoblot analyses show that CXCL1 and CXCL2 activate MAPK signaling in HRasG12V;Tgfbr2-null keratinocytes. β-actin levels are shown as controls. Note that the response for P-AKT and P-p38 is consistently transient, reflective of feed-back regulation. (B) Motif analysis on Cxcl1/2 SE-epicenters reveals putative binding of a cohort of SCC-SC TFs to drive Cxcl1 and Cxlc2 expression. (C) Immunoblot validating the knock-down efficiency of Cxcr2 shRNAs on CXCR2 protein levels (D) Immunofluorescence images of Cxcr2 shRNA-transduced allograft tumor (GFP) showing intact and continuous laminin5+ basement membrane, reflective of reduced tumor potential. SCC-SC, squamous cell carcinoma-stem cell.
Additional files
-
Supplementary file 1
List of super-enhancers of SCC-SC in vivoby H3K27ac ChIP-seq: chromosomal coordinates and corresponding gene assignments.
- https://doi.org/10.7554/eLife.10870.014
-
Supplementary file 2
List of super-enhancers of SCC-SC in vivo by H3K27ac nano-ChIP-seq: Chromosomal coordinates and corresponding gene assignments.
- https://doi.org/10.7554/eLife.10870.015
-
Supplementary file 3
List of super-enhancers of ETS2(T72D) super-activated Epi-SC in vivo by H3K27ac nano-ChIP-seq: Chromosomal coordinates and corresponding gene assignments.
- https://doi.org/10.7554/eLife.10870.016
Download links
A two-part list of links to download the article, or parts of the article, in various formats.
Downloads (link to download the article as PDF)
Open citations (links to open the citations from this article in various online reference manager services)
Cite this article (links to download the citations from this article in formats compatible with various reference manager tools)
ETS family transcriptional regulators drive chromatin dynamics and malignancy in squamous cell carcinomas
eLife 4:e10870.
https://doi.org/10.7554/eLife.10870


