Inhibition by small-molecule ligands of formation of amyloid fibrils of an immunoglobulin light chain variable domain
- Howard Hughes Medical Institute, UCLA, United States
- UCLA-DOE Institute for Genomics and Proteomics, United States
- UCLA, United States
Figures
Figure 1
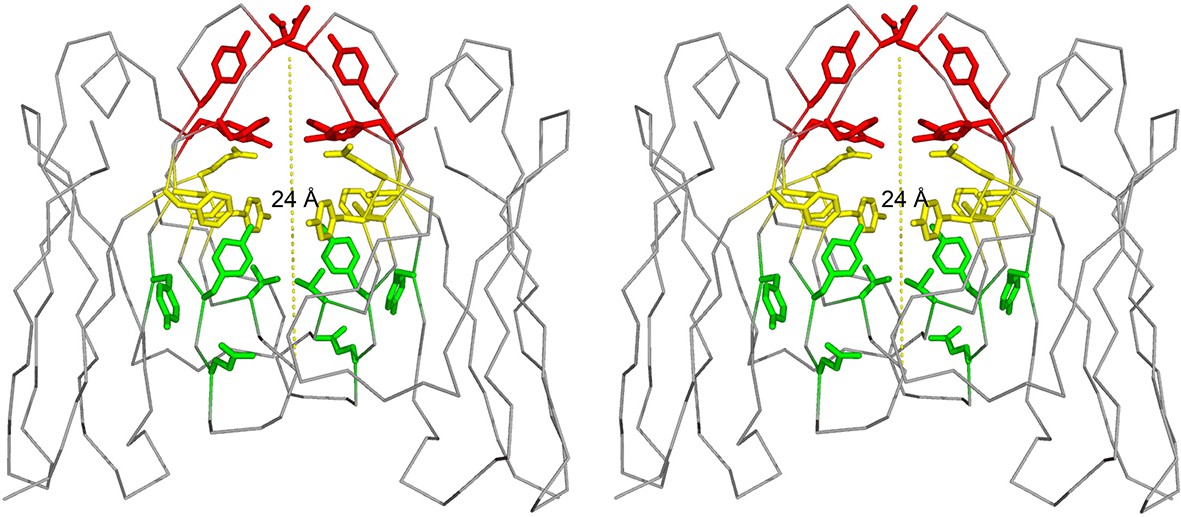
Stereo image of the ligand-binding sites of the VL dimer.
We designate the A-site in red (residues Y34, Y93, D97 and F99), B-site in yellow (residues S36, Y51, E52, S91 and F101), and C-site in green (residues Y38, Q40, V48 and Y89).
Figure 2
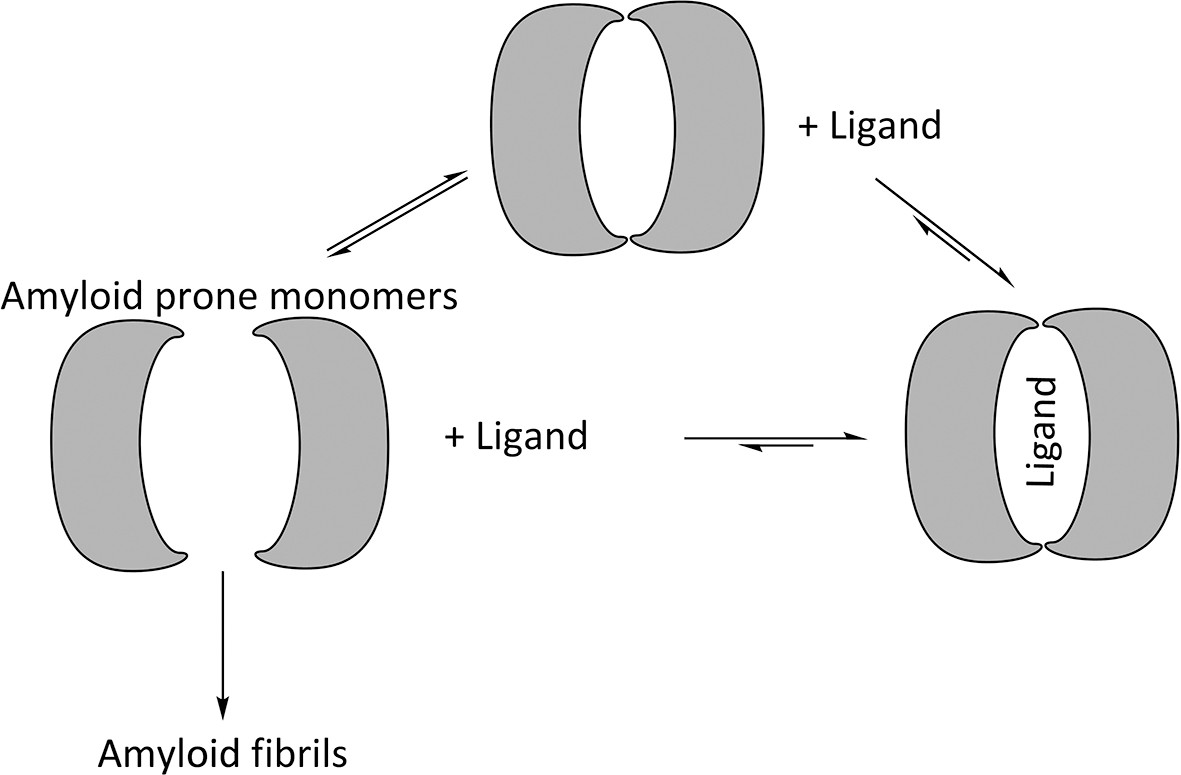
Proposed mechanism for using ligands to hinder the aggregation of immunoglobulin VL s into amyloid fibrils.
VL s are in equilibrium between dimers and monomers in solution. Ligands may be used to stabilize the VL dimer and therefore shift the equilibrium away from amyloid-prone monomers.
Figure 3

Panel of ligands analyzed with ThT assays and EM for their ability to inhibit VL amyloid formation.
(A) Preliminary molecules screened. 1. 1,2-naphthoquinone. 2. 1,4-naphthoquinone. 3. 5-hydroxy-1,4-naphthoquinone. 4. quinone. 5. 8-anilinonaphthalene-1-sulfonic acid. 6. methoxy-2-naphthyl-propionic acid. 7. dopamine. 8. L-phenylalanine. 9. L-tryptophan. 10. methylene blue. 11. eosin Y. 12. rhodamine 6G. 13. Basic Blue 12. 14. Chicago Sky Blue 6B. 15. 8-aminonaphthalene-1,3,6-trisulfonic acid. 16. Basic Blue 41. 17. dimenhydrinate. 18. stictic acid. 19. 6-carboxyfluorescein. 20. phenol red. 21. R-(-)-apomorphine. 22. sulforhodamine 101. 23. fluorescein methyleneiminodiacetic acid. 24. rhodamine B. 25. tetracycline. 26. doxycycline. 27. (−)-epigallocatechin gallate. (B) Molecules showing an inhibitory effect on the formation of amyloid fibrils during the preliminary screen. (C) Molecules identified in a DrugBank search using the most effective candidates from the preliminary screen and a similarity threshold of 0.3. Search using phenol red: 28. diethylstilbestrol (0.4), 29. sulindac (0.4), 30. tamoxifen (0.4), 31. acitretin (0.4). Search using Chicago Sky Blue 6B: 32. suramin (0.4), 33. Bumetanide (0.3), 34. sulfasalazine (0.3), 35. sulfadoxine (0.3), 36. amsacrine (0.3), 37. methotrimeprazine (0.3). Search using methylene blue: 38. clofazimine (0.3), 39. primaquine (0.3), 40. imiquimod (0.3).
Figure 4

Thioflavin T fibril formation assays and electron micrographs of Mcg VLs in the presence of various concentrations of methylene blue and sulfasalazine.
Averaged fluorescence readings are based on three repeated ThT assays. Error bars are not shown for clarity. The EM micrographs have a scale bar of 0.5 μm. (A) Mcg alone. (B) Mcg with various concentrations of methylene blue. (C) Mcg with various concentrations of sulfasalazine. As the concentration of ligand is increased, the ability of VLs to form amyloid fibrils is hindered, as indicated by a decrease in ThT assay fluorescence and inability to detect fibrils with EM. The ligand concentration that effectively inhibited amyloid formation in these assays was 500 μM for methylene blue and 250 μM for sulfasalazine.
Figure 5
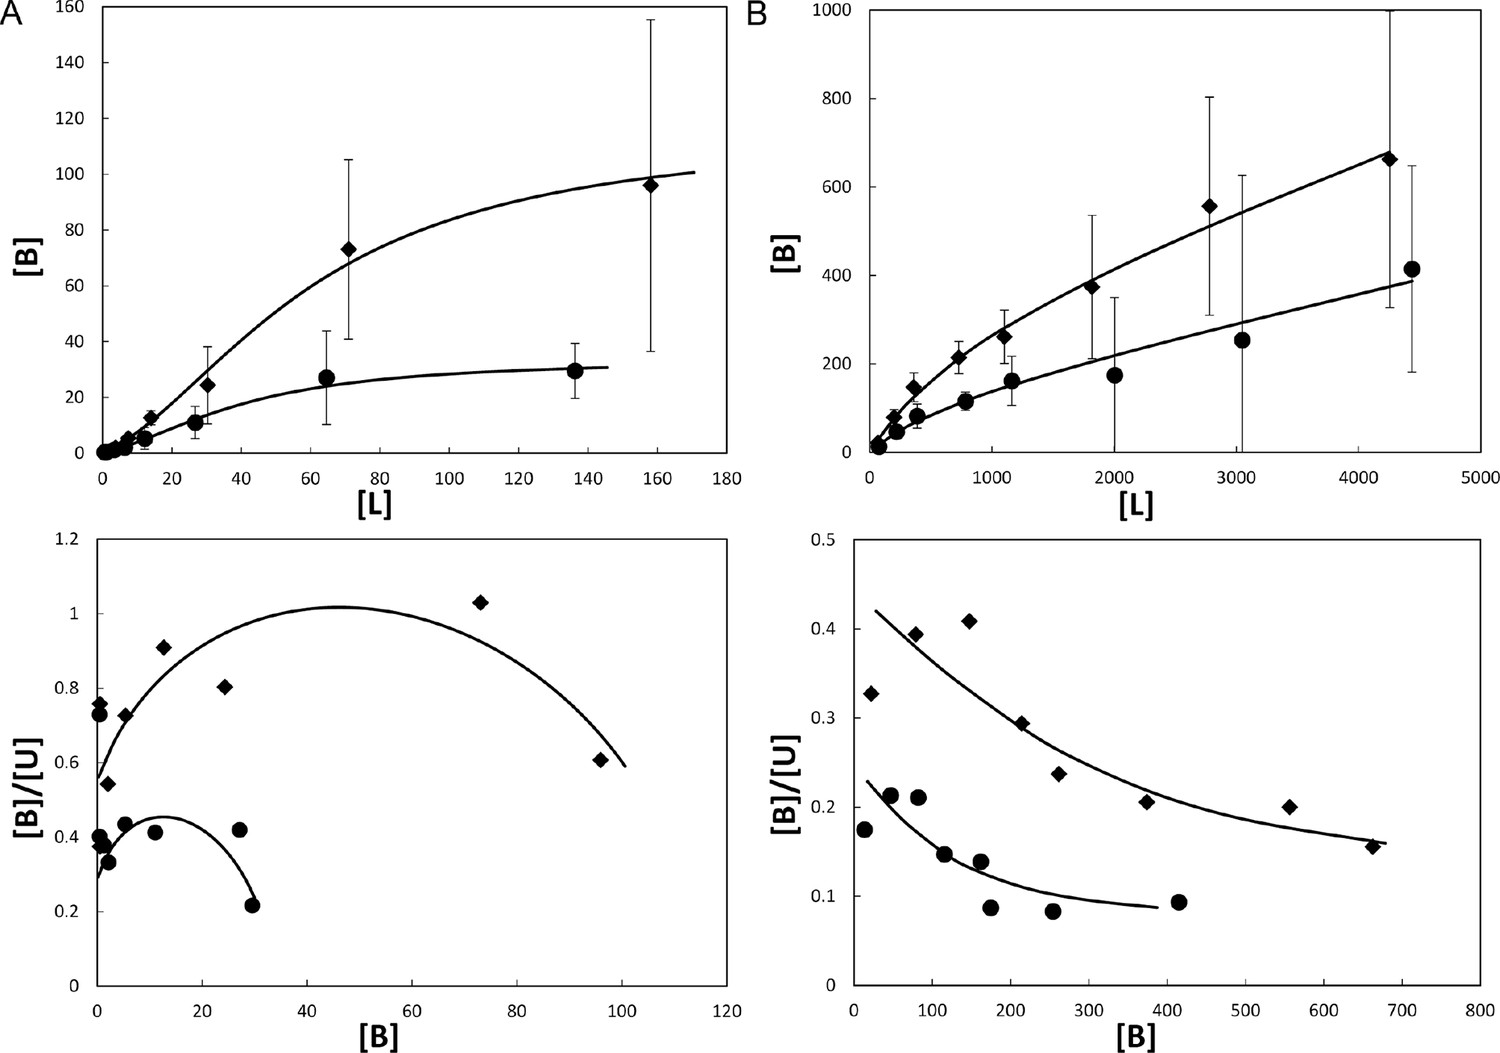
Binding of ligands to Mcg VLs.
Binding curves (top) and Scatchard plots (bottom) of ligand binding determined from equilibrium dialysis experiments. Each curve represents binding equations fit to the data by least squares. Binding constants were derived from the fit equations (see Table 1). Vertical bars represent the standard errors of the mean from independently repeated experiments. [B], [L], and [U] are bound, total, and unbound concentrations of ligand in μM. (A) Methylene blue binding to Mcg. Rhombs show means for 3 independent experiments performed with 1.0 mg/ml Mcg. Circles show means for 5 independent experiments performed with 0.5 mg/ml Mcg. Notice the sigmoidal shape of the binding plot and concave shape of the Scatchard plot indicating cooperative binding. (B) Sulfasalazine binding to Mcg. Rhombs show means for 3 independent experiments performed with 5.0 mg/ml Mcg. Circles show means for 3 independent experiments performed with 2.5 mg/ml Mcg. Notice the saturated binding and a down-curving shape of the Scatchard plot indicating one binding constant followed by non-specific binding.
Figure 6
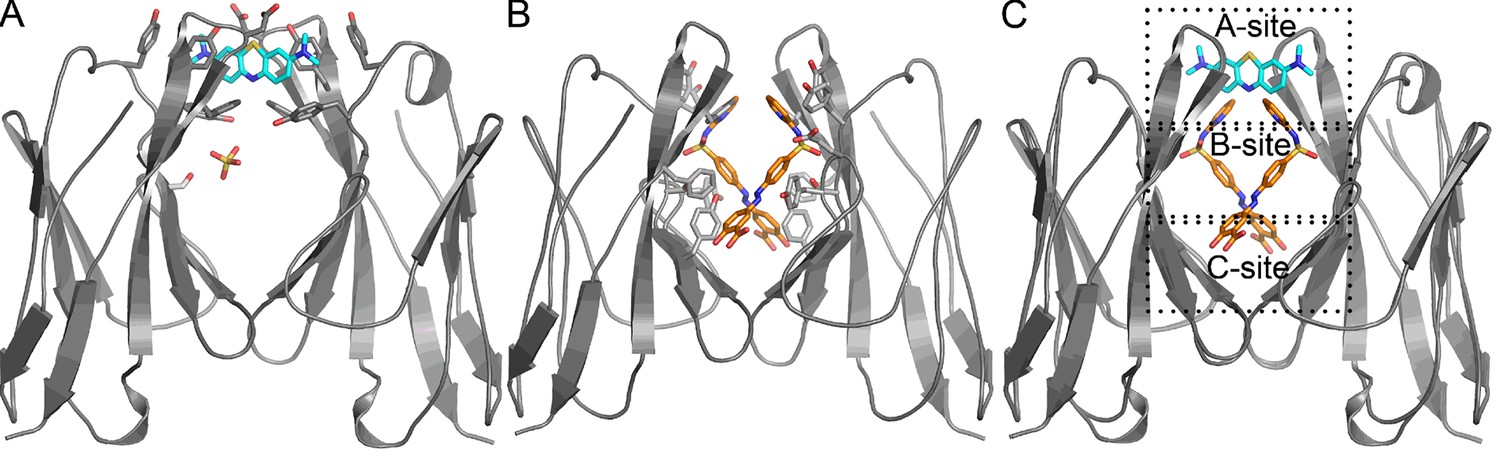
Crystal structures of Mcg binding methylene blue (PDB 5ACM) and Mcg binding sulfasalazine (PDB 5ACL).
(A) Mcg and methylene blue. Methylene blue binds the cavity between the VL domains. The sulfate ion binds in the hydrophobic cavity at S36 and may block the secondary methylene blue binding site. (B) Mcg and sulfasalazine. Two symmetry-related sulfasalazine molecules bind in the hydrophobic cavity between the VL domains, simultaneously occupying all three sites: A, B, and C. (C) Overlay of the structures from A and B for comparison and annotation of A-B-C binding sites.
Figure 7
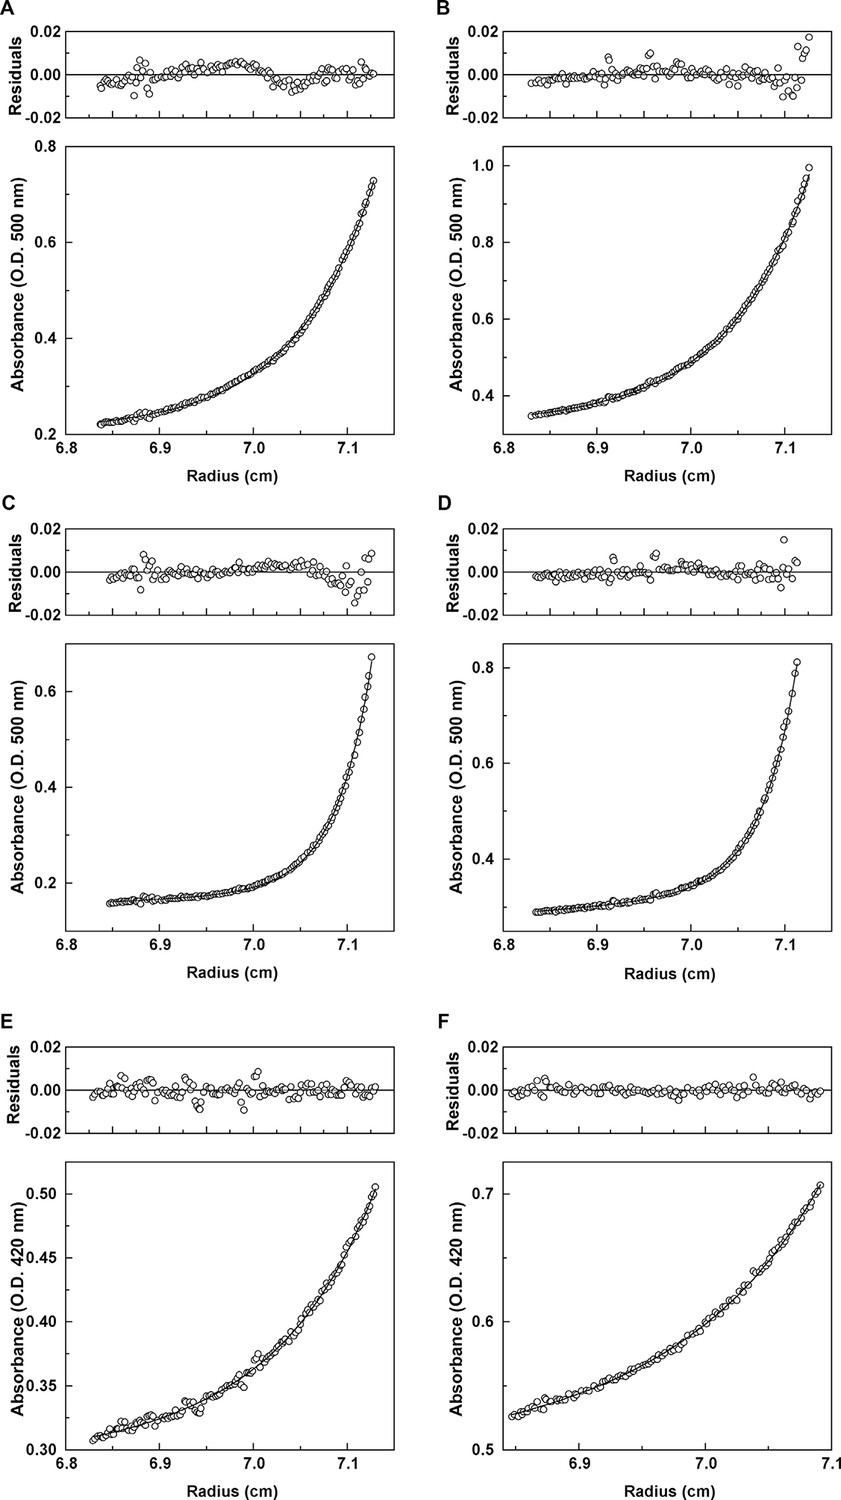
Analytical ultracentrifugation data for Mcg with methylene blue and Mcg with sulfasalazine.
(A) Absorbance and residuals for 80 μM Mcg with 100 μM methylene blue at 22,000 rpm. (B) Absorbance and residuals for 80 μM Mcg with 150 μM methylene blue at 22,000 rpm. (C) Dimer meniscus depletion - absorbance and residuals for 80 μM Mcg with 100 μM methylene blue at 35,000 rpm. (D) Dimer meniscus depletion - absorbance and residuals for 80 μM Mcg with 150 μM methylene blue at 35,000 rpm. (E) Absorbance and residuals for 200 μM Mcg with 300 μM sulfasalazine at 22,000 rpm. (F) Absorbance and residuals for 200 μM Mcg with 500 μM sulfasalazine at 22,000 rpm. Measurements were taken after samples reached equilibrium and the distribution of protein along the cells did not change. Residuals show the corresponding error of the fit of the model to the data.
Tables
Table 1
Disassociation constants of ligands that bind to the Mcg VL dimer.
| Ligand | <K1> [μM] (SEM) | <K2> or KNS [μM] (SEM) | N | Binding model | Equations fit ([Y]: bound ligand, [L]: free ligand, [R]: receptor) |
|---|---|---|---|---|---|
| methylene blue | 207 (35) | 21 (4) | 8 | Two positively cooperative sites R+L⇔ RL+L ⇔ RL2 | (1) [Y]=([L]*[R]/K1)*(1+ [L]/K2)) (2) [R]=[R0]/(1+[L]/K1+[L]2/(K1*K2)) |
| sulfasalazine | 698 (105) | 21 (8) (non-specific binding) | 6 | Two equivalent + non-specific sites R+L ⇔ RL | (3) [Y]=[R0]*[L]/(K1+[L]) + KNS*[L] |
| SEM – standard error of the mean; N – number of independent experiments KNS – nonspecific binding | |||||
Table 2
Statistics of X-ray data collection and atomic refinement. Values in parentheses are for the outermost shell of data. Each structure was derived from a single crystal.
| Mcg-methylene blue PDB 5ACM | Mcg-sulfasalazine PDB 5ACL | |
|---|---|---|
| Space group | P21 | P21212 |
| Cell dimensions | ||
| a, b, c (Å) | 39.2, 31.1, 73.6 | 31.8, 74.6, 39.3 |
| α, β, γ (°) | 90, 90.1, 90 | 90, 90, 90 |
| Resolution (Å) | 39.2-1.0 (1.07) | 29.3-1.5 (1.53) |
| Rsym (%) | 7.2 (59.1) | 5.5 (52.9) |
| I/σ(I) | 9.8 (2.4) | 18.7 (3.7) |
| Completeness (%) | 88.6 (81.8) | 97.9 (83.2) |
| Redundancy | 3.5 (3.5) | 6.9 (5.9) |
| No. reflections | 259214 | 107913 |
| Rwork/Rfree (%) | 11.1/12.2 | 15.9/18.7 |
| No. atoms | ||
| Protein | 1610 | 845 |
| Ligand/ion | 36 | 33 |
| Water | 210 | 134 |
| Average B-factors (Å2) | 16.8 | 20.4 |
| R.m.s deviations | ||
| Bond lengths (Å) | 0.05 | 0.02 |
| Bond angles (º) | 3.27 | 2.04 |
| Crystallization conditions | 0.2 M NH4Cl, 2.2 M (NH4)2SO4, 0.5 M methylene blue | 0.2 M Tri-potassium citrate, 2.2 M (NH4)2SO4, 0.5 M sulfasalazine |
Table 3
Apparent VL molecular weights and ligand binding derived from analytical ultracentrifugation.
| Speed (rpm) | Concentration of Mcg (μM) | Ligand | Concentration of ligand (μM) | Apparent molecular weight (Da) | Oligomer state |
|---|---|---|---|---|---|
| 22,000 | 80 | methylene blue | 100 | 27,342 ± 268* | Dimer + multimer |
| 150 | 26,507 ± 225* | Dimer + multimer | |||
| 35,000 | 80 | methylene blue | 100 | 23,609 ± 212* | Dimer |
| 150 | 23,397 ± 152* | Dimer | |||
| 22,000 | 200 | sulfasalazine | 300 | 21,989 ± 571* | Dimer |
| 500 | 21,821 ± 345* | Dimer |
-
*Standard error.
Download links
A two-part list of links to download the article, or parts of the article, in various formats.
Downloads (link to download the article as PDF)
Open citations (links to open the citations from this article in various online reference manager services)
Cite this article (links to download the citations from this article in formats compatible with various reference manager tools)
Inhibition by small-molecule ligands of formation of amyloid fibrils of an immunoglobulin light chain variable domain
eLife 4:e10935.
https://doi.org/10.7554/eLife.10935


