Precise regulation of the guidance receptor DMA-1 by KPC-1/Furin instructs dendritic branching decisions
- Stanford University, United States
- Howard Hughes Medical Institute, Stanford University, United States
- University of Illinois at Chicago, United States
- University of Chicago, United States
Figures
Figure 1 with 1 supplement
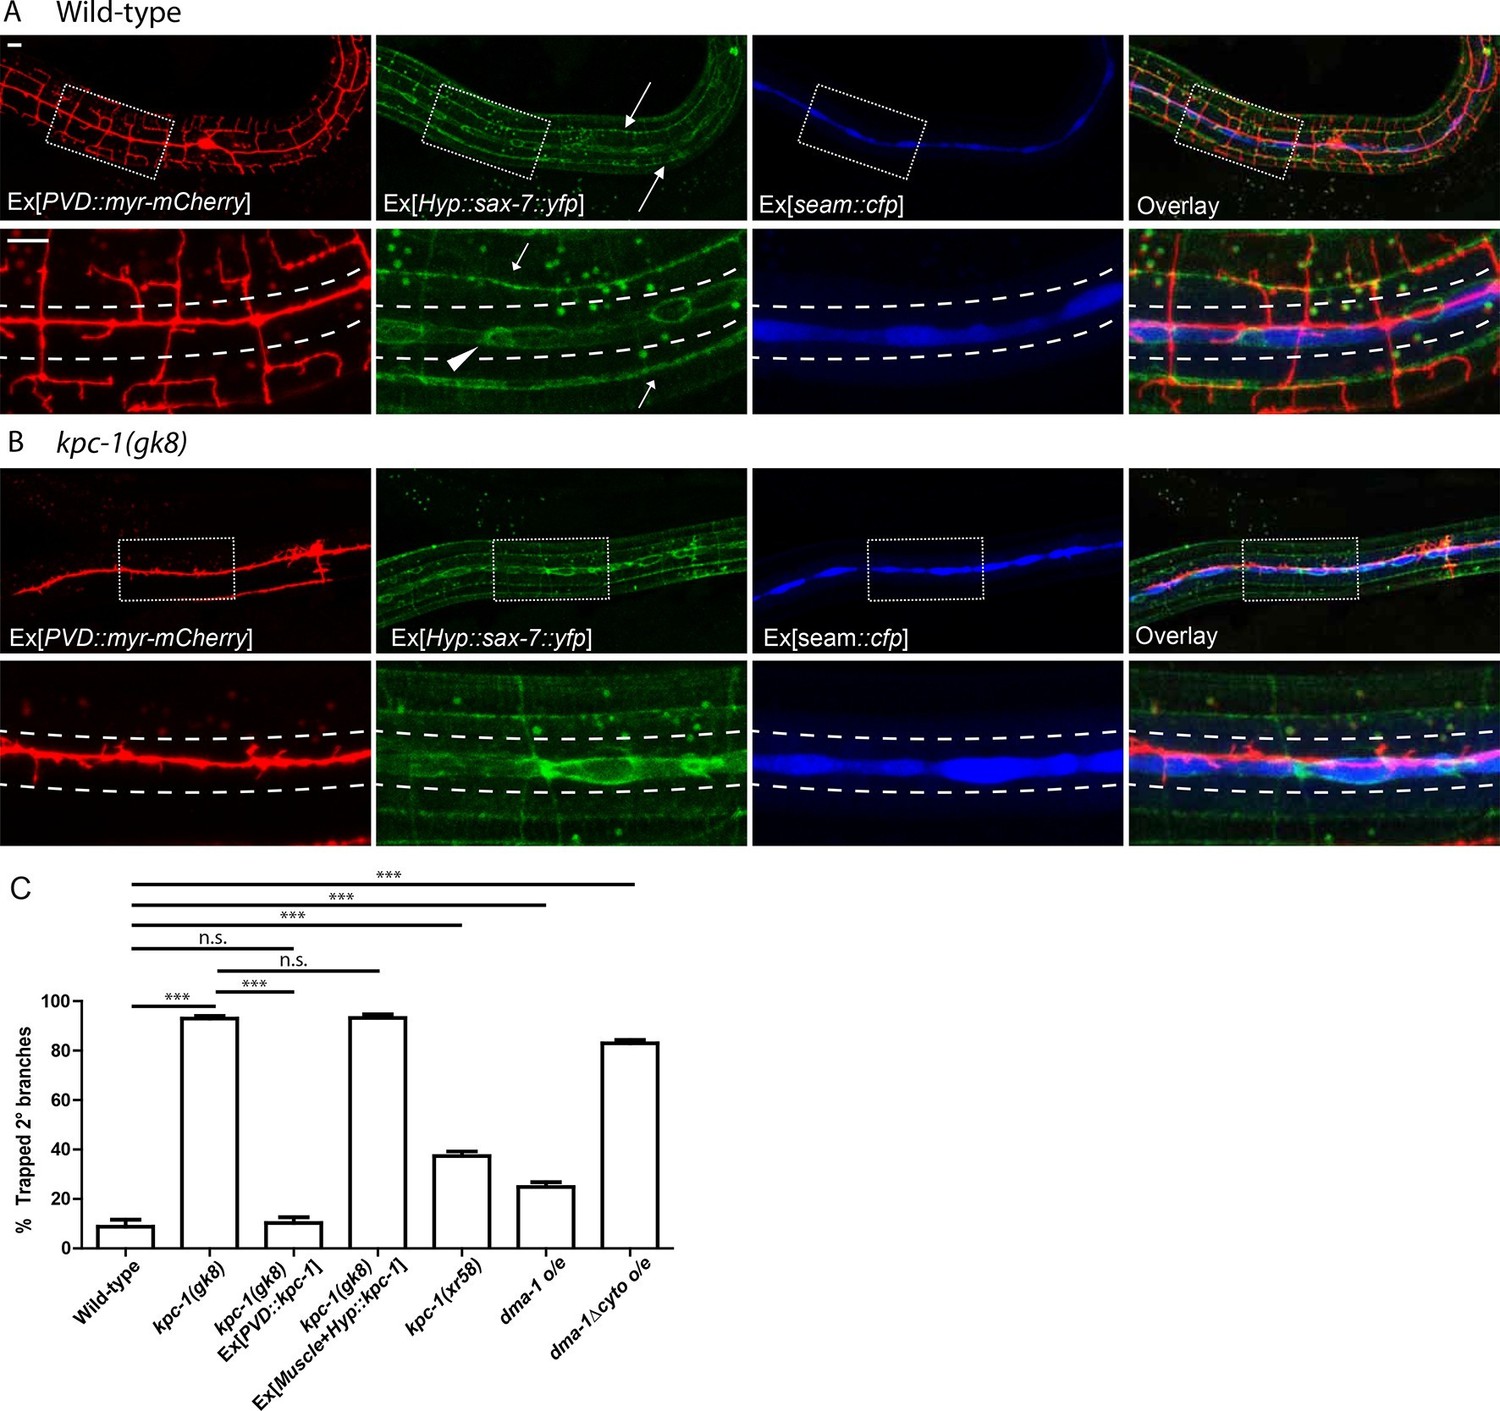
The kpc-1 mutants showed severe trapping of PVD dendrites.
(A) Fluorescent images showing (red) morphology of the PVD neuron, (green) localization of SAX-7 in the hypodermal cell, (blue) seam cells and overlay between the three in wild-type worms. SAX-7 was enriched in two sublateral longitudinal lines and at the lateral midline around the seam cell-hypodermal junctions. Arrows: Sublateral stripes of enriched SAX-7 that co-localize with PVD 3° dendrites. Arrowhead: SAX-7 enriched near the 1°dendrites, where it was encountered by the 2° branches as they emerge. The images in the lower panels are zoomed-in views of the regions indicated by the boxes. Dotted lines indicate the 'trap zone' marked by enriched SAX-7 around seam cells. (B) In kpc-1(gk8) mutants, almost all branches failed to grow out of the trap zone between the dotted lines indicated by enriched SAX-7. Scale bar: 10 μm. (C) Quantification of the percentage of 2° branches trapped around the 1°dendrite. *** is p<0.001, n.s. is p>0.05 by Student’s T-test. N=50 for each genotype.
Figure 1—figure supplement 1
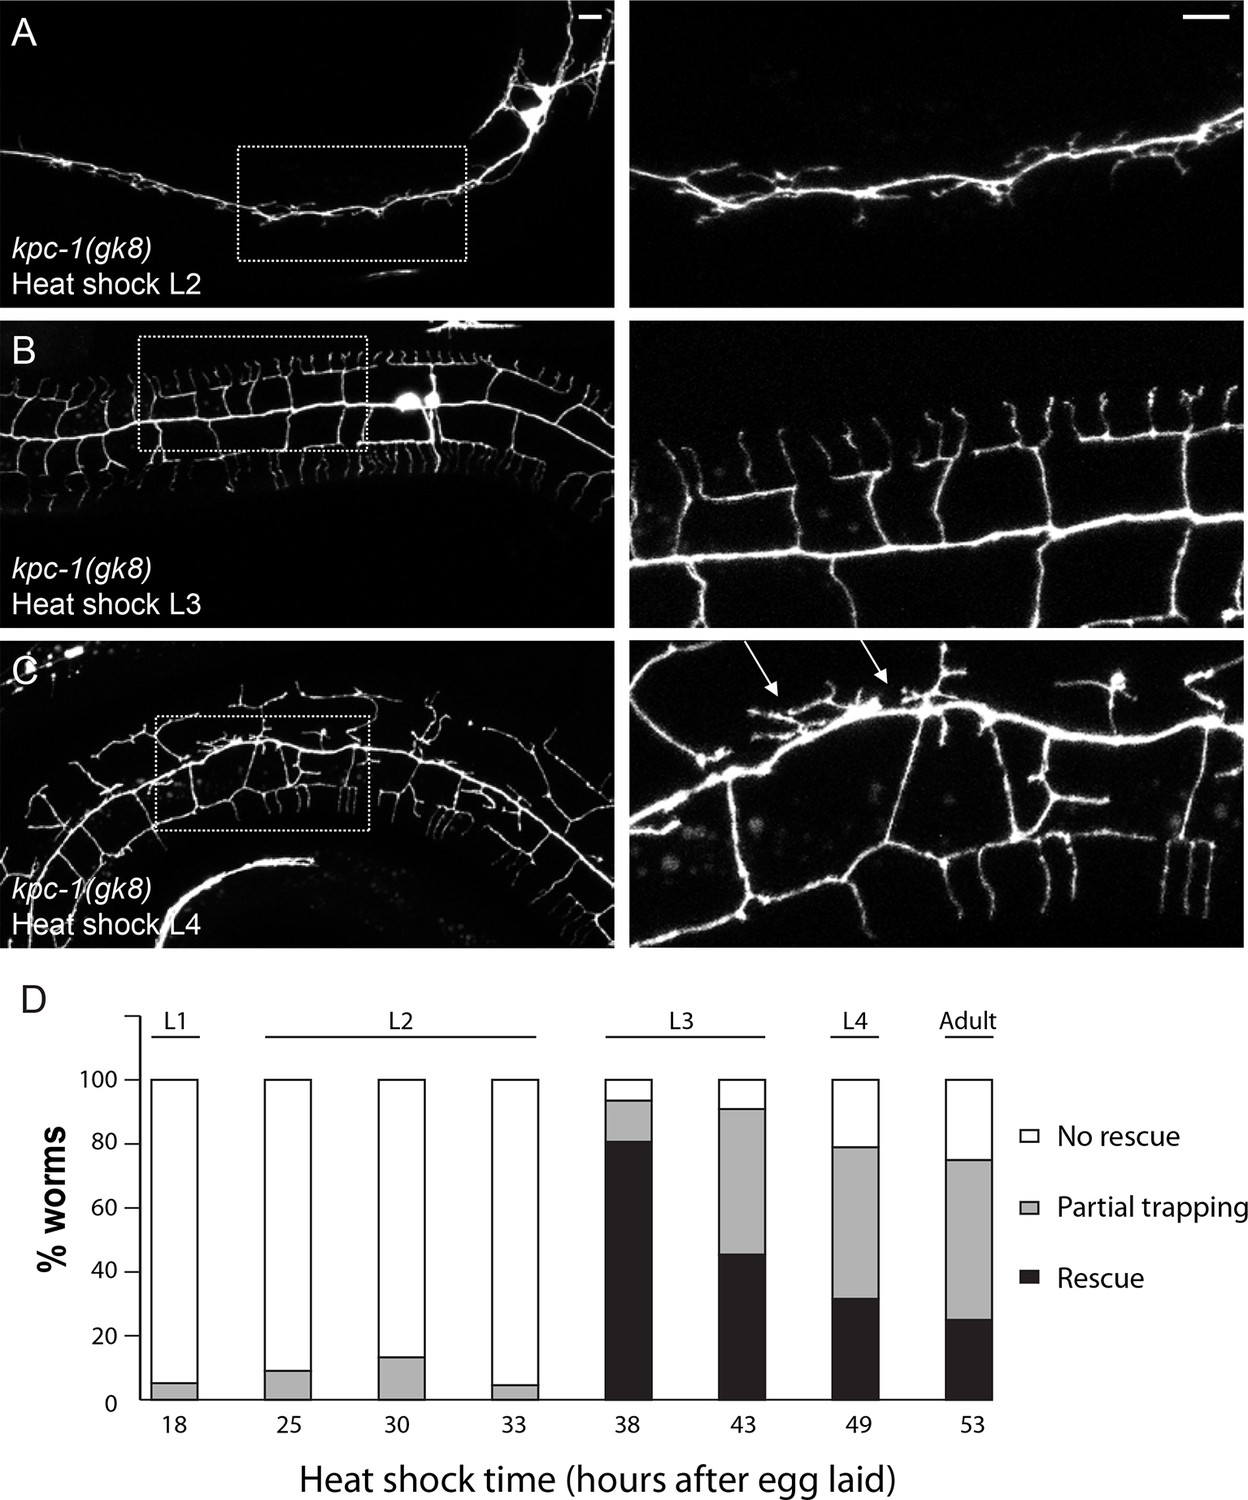
Heat shock expression of KPC-1 at distinct time points during development produced different phenotypes.
(A) Expressing KPC-1 during L2 failed to rescue the kpc-1(gk8) mutant phenotype. (B) Expressing KPC-1 during early L3 completely rescued the mutant phenotype. (C) Expressing KPC-1 during L4 or later stages could partially rescue some menorahs, but still many branches were trapped in the trap zone. Scale bar: 10 μm. (D) Quantification of the percentage of worms heat shocked at various time points showing no rescue, partial or full rescue.
Figure 2 with 3 supplements
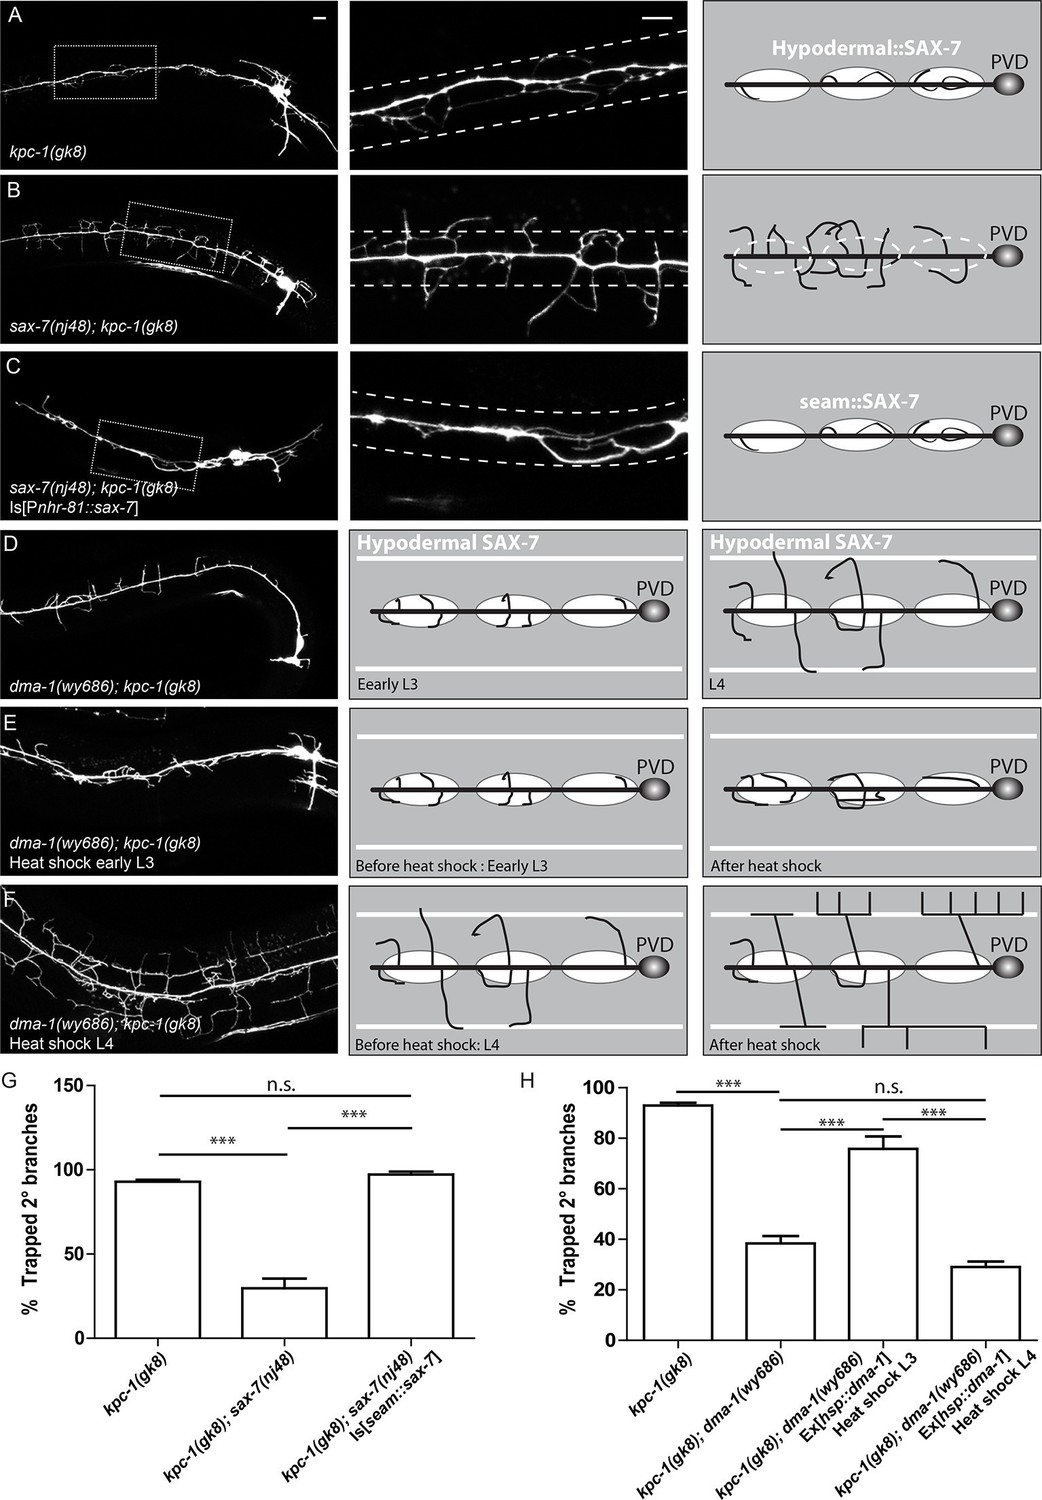
The SAX-7/MNR-1/DMA-1 tripartite complex was causal for the trapping phenotype in kpc-1 mutants.
(A) Left: Fluorescent image showing PVD morphology of a kpc-1(gk8) null mutant. Middle: Zoomed-in view of the boxed area in the left panel. Dotted lines indicate the 'trapping zone' with enriched SAX-7. Almost all 2° dendrites were trapped in this region. Right: Schematic illustration of the phenotype. (B) PVD morphologies of sax-7(nj48); kpc-1(gk8) double mutants were indistinguishable from sax-7(nj48) single mutants. Dendrites could escape from the trap zone. (C) Expressing SAX-7 in the seam cells restored the trapping phenotype. (D) Left: Fluorescent image showing the PVD morphology of a dma-1(wy686); kpc-1(gk8) double mutant. Middle: Schematic illustration showing the initial phase of 2° branch outgrowth during early L3 when the dendrites pass the 'trap zone'. Right: Later in development, dendrites of the dma-1; kpc-1 mutants had escaped the trap zone but failed to form menorahs due to lack of DMA-1. (E) Expressing DMA-1 during early L3 in dma-1(wy686); kpc-1(gk8) double mutants completely restored the trapping phenotype. (F) Expressing DMA-1 during L4 or later stages generated a striking rescue of menorahs. Since the dendrites had already escaped from the trap zone, supplying DMA-1 enabled the dendrites to respond to sublateral SAX-7 and MNR-1 signal and form normal 3° and 4° branches at the right place. Scale bar: 10 μm. (G-H) Quantification of the percentage of 2° branches that were trapped around the 1°dendrite. *** is p<0.001, n.s. is p>0.05 by Student’s T-test. N=50 for each genotype.
Figure 2—figure supplement 1
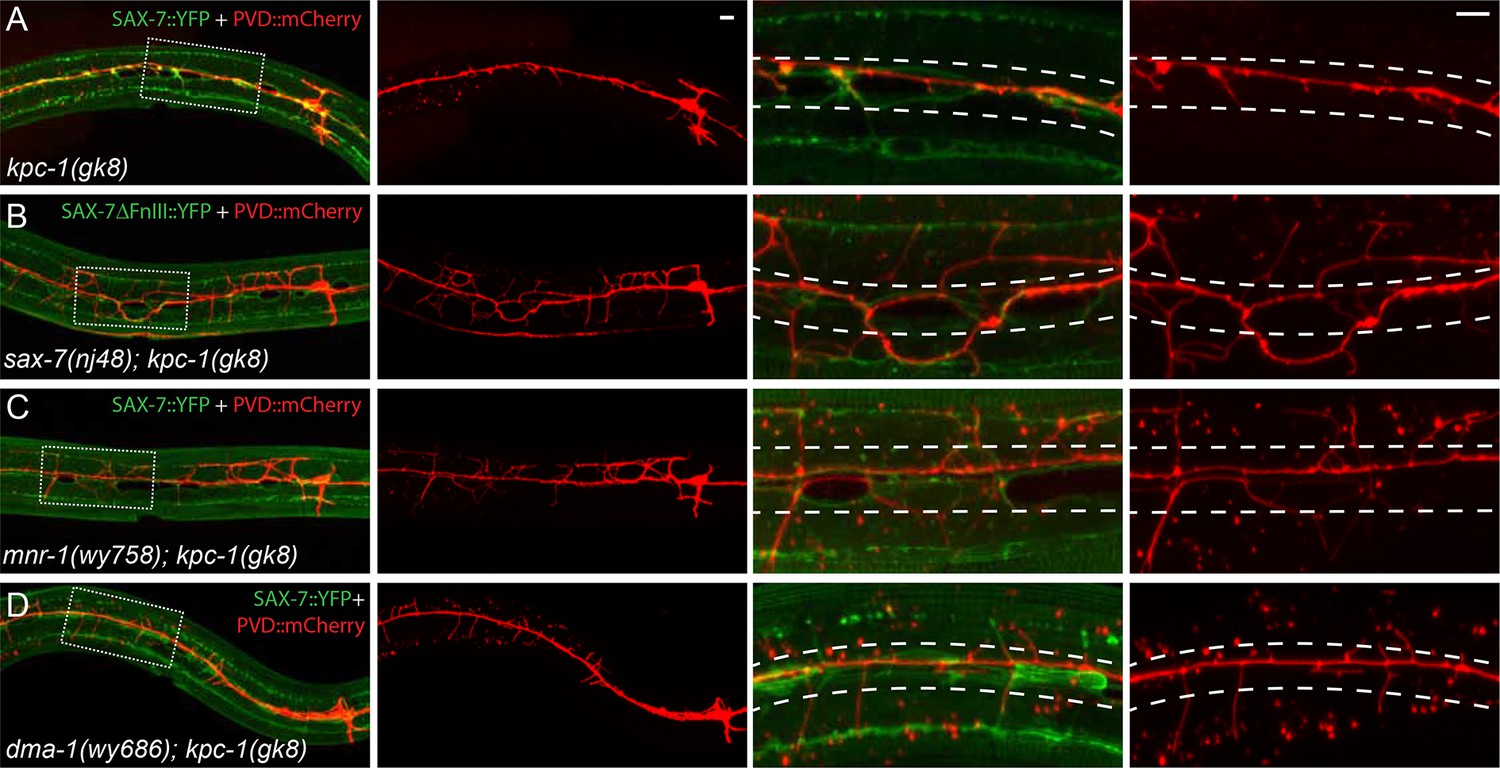
The SAX-7/MNR-1/DMA-1 ligand-receptor complex was causal for the trapping phenotype in kpc-1 mutants.
(A–D) Fluorescent images showing hypodermal SAX-7 localization in green and PVD morphology in red of (A) kpc-1(gk8) single mutant, (B) sax-7(nj48); kpc-1(gk8), (C) mnr-1(wy758); kpc-1(gk8) and (D) dma-1(wy686); kpc-1(gk8) double mutants. In the kpc-1 single mutant, almost all 2° branches failed to grow out of the trap zone indicated by the enriched SAX-7 (between dotted lines), whereas in double mutants, despite strong morphology defects, 2° dendrites grew out of the trap zone and extended toward the sublateral lines. Full length SAX-7::YFP was used in panels A, C and D while SAX-7ΔFnIII::YFP, a non-functional form of SAX-7 which still showed correct subcellular localization, was used in panel B to prevent rescuing of the sax-7 mutant phenotype. The images in the right 2 columns are zoomed-in views of the regions indicated by the dashed boxes on the left.
Figure 2—figure supplement 2
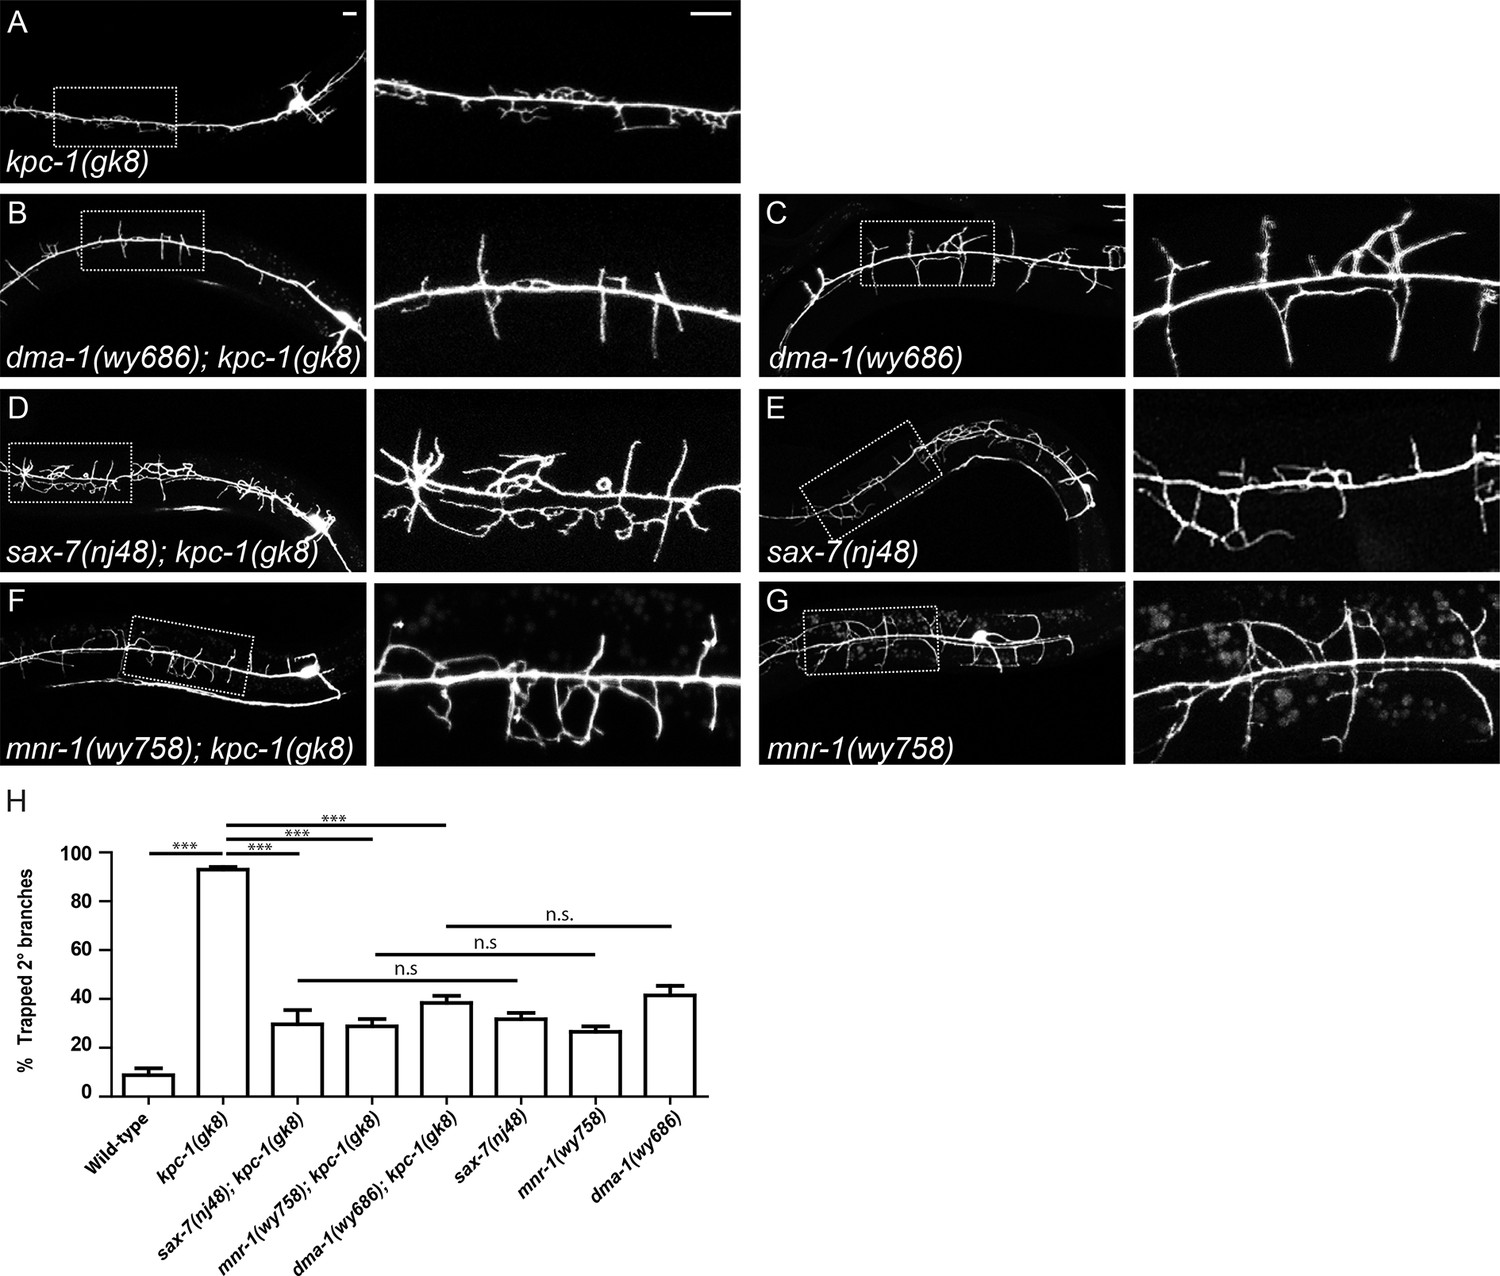
SAX-7, MNR-1 and DMA-1 were epistatic to KPC-1.
(A–G) Fluorescent images showing PVD morphologies of (A) kpc-1(gk8), (B) dma-1(wy686); kpc-1(gk8), (C) dma-1(wy686), (D) sax-7(nj48); kpc-1(gk8), (E) sax-7(nj48), (F) mnr-1(wy758); kpc-1(gk8) and (G) mnr-1(wy758) mutants. The PVD dendritic phenotypes of the double mutants were indistinguishable from the sax-7, mnr-1 and dma-1 single mutants but different from the kpc-1 single mutants. Scale bar: 10 μm. (H) Quantification of the percentage of 2° branches that were trapped around the 1°dendrite. *** is p<0.001, n.s. is p>0.05 by Student’s T-test. N=50 for each genotype.
Figure 2—figure supplement 3
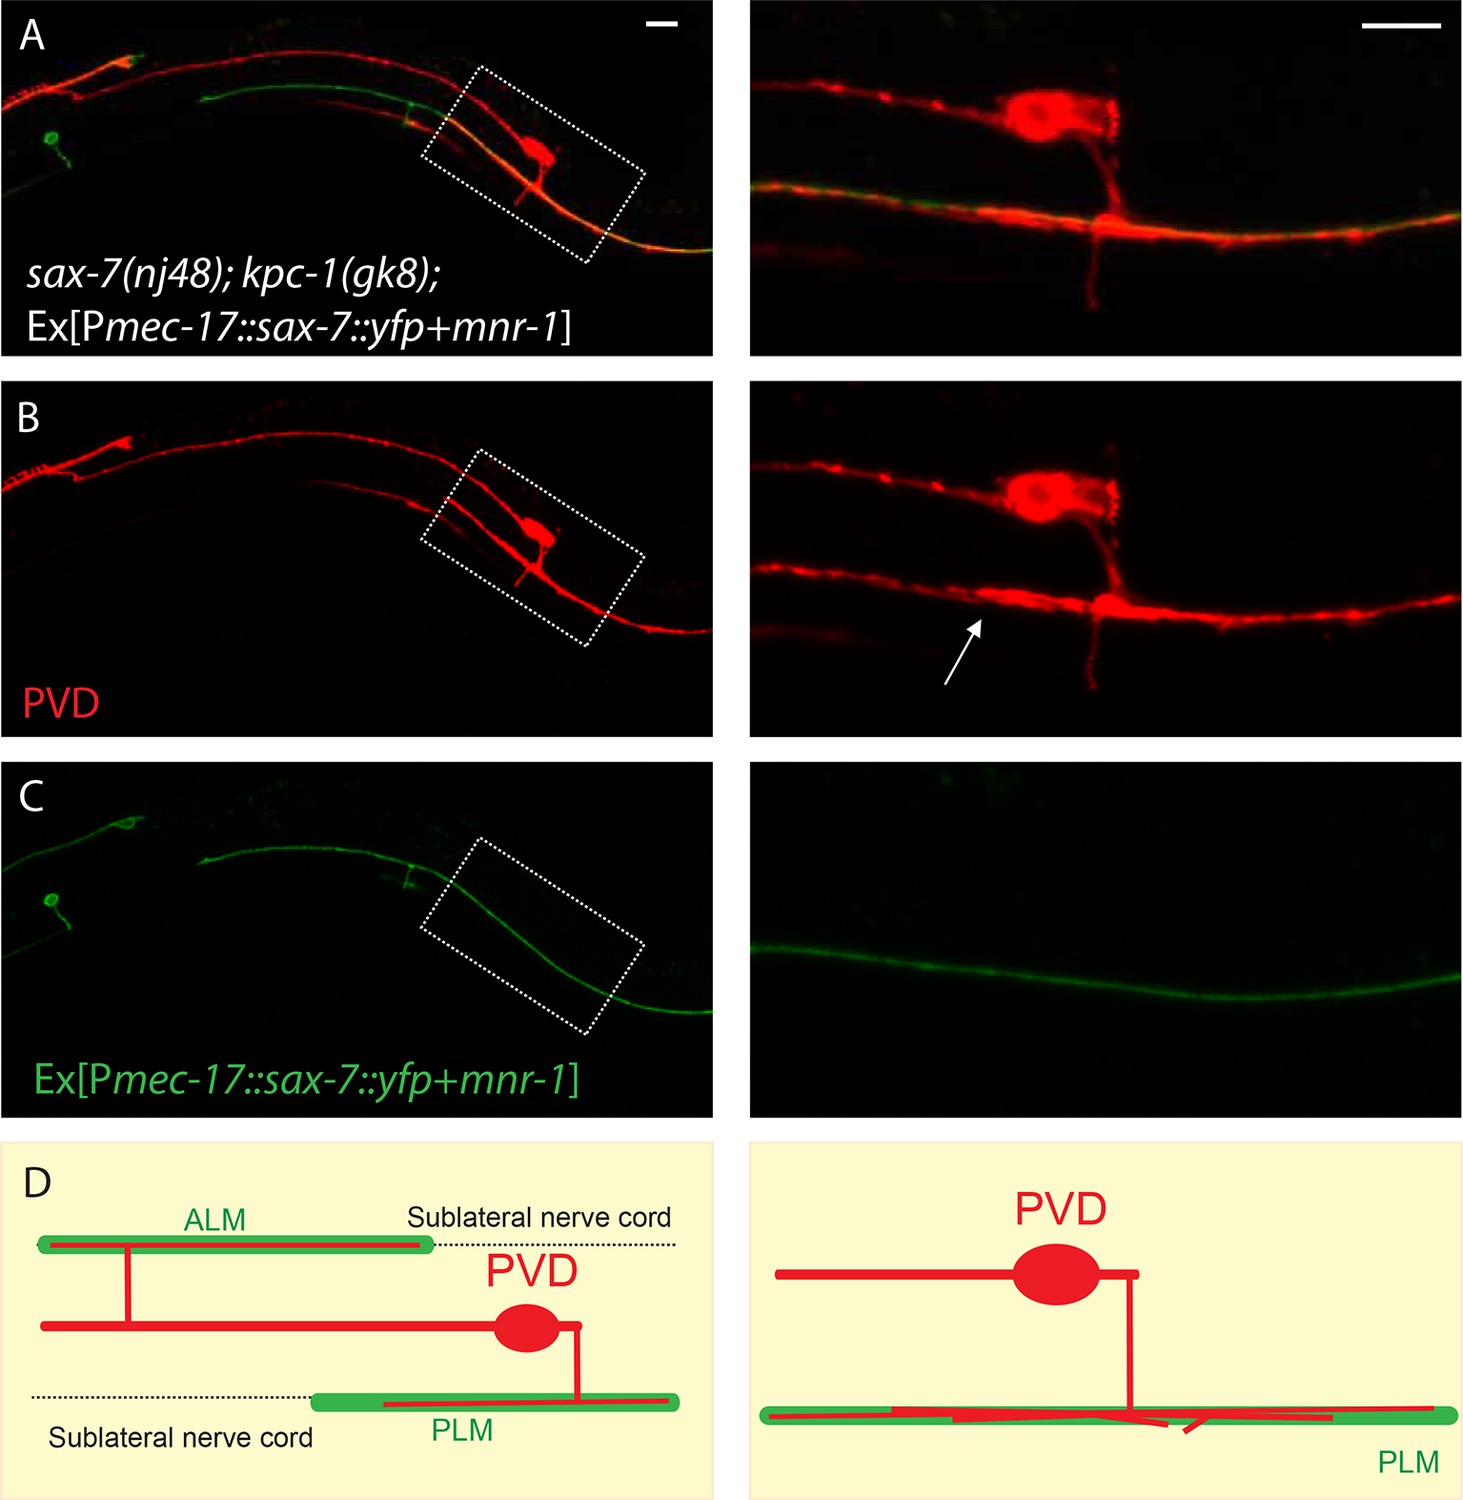
PLM and ALM neurons expressing SAX-7-YFP and MNR-1 caused the PVD dendrites of sax-7; kpc-1 double mutants to follow these neurons.
(A–C) Fluorescent images of (A) overlay, (B) PVD neuron and (C) PLM and ALM neurons expressing SAX-7::YFP and MNR-1. Right panels show the zoomed-in views of boxed regions in the left panels. Arrow points to multiple PVD dendrites fasciculating on the PLM neurite. Scale bar: 10 μm (D) Schematic illustration of the phenotype.
Figure 3 with 1 supplement
Partial loss of KPC-1 caused defects in higher order dendritic branches.
(A–C) Fluorescent images showing PVD morphologies of (A) wild-type (B) kpc-1(xr58) mutant and (C) kpc-1(gk8) mutant animals expressing a low concentration (0.5ng/μL) of full length, functional KPC-1. The xr58 mutants had severe defects in self-avoidance of 3° branches and reduced number of 4° branches. The phenotype was mimicked by expressing low-level wild-type KPC-1 in the gk8 null allele of kpc-1. Arrows: Gaps between 3° branches in wild-type neurons. Arrowheads: 3° branches that overlapped with their neighbors in mutants. Star: Defective menorah with no 4° branches. Asterisks: Trapped 2° branches. (D) Schematic of the KPC-1 protein showing locations of mutations in gk8 and xr58 mutants. (E–F) Fluorescent images of (E) SAX-7 localization in the hypodermal cell, and (F) overlay with a PVD marker in red. SAX-7 was highly enriched in the sublateral lines where 3° branches formed and grew and was also localized to vertical stripes followed by the 4° branches but at much lower concentration. Scale bar: 10 μm. (G) Schematic figure of PVD outgrowth. 2° branches emerging from the 1° dendrites and 4° branches growing away from the 3° branches faced similar challenges to go from regions with higher levels of SAX-7 to places that were less attractive. Compromised function of KPC-1 led to defects in escaping.
Figure 3—figure supplement 1
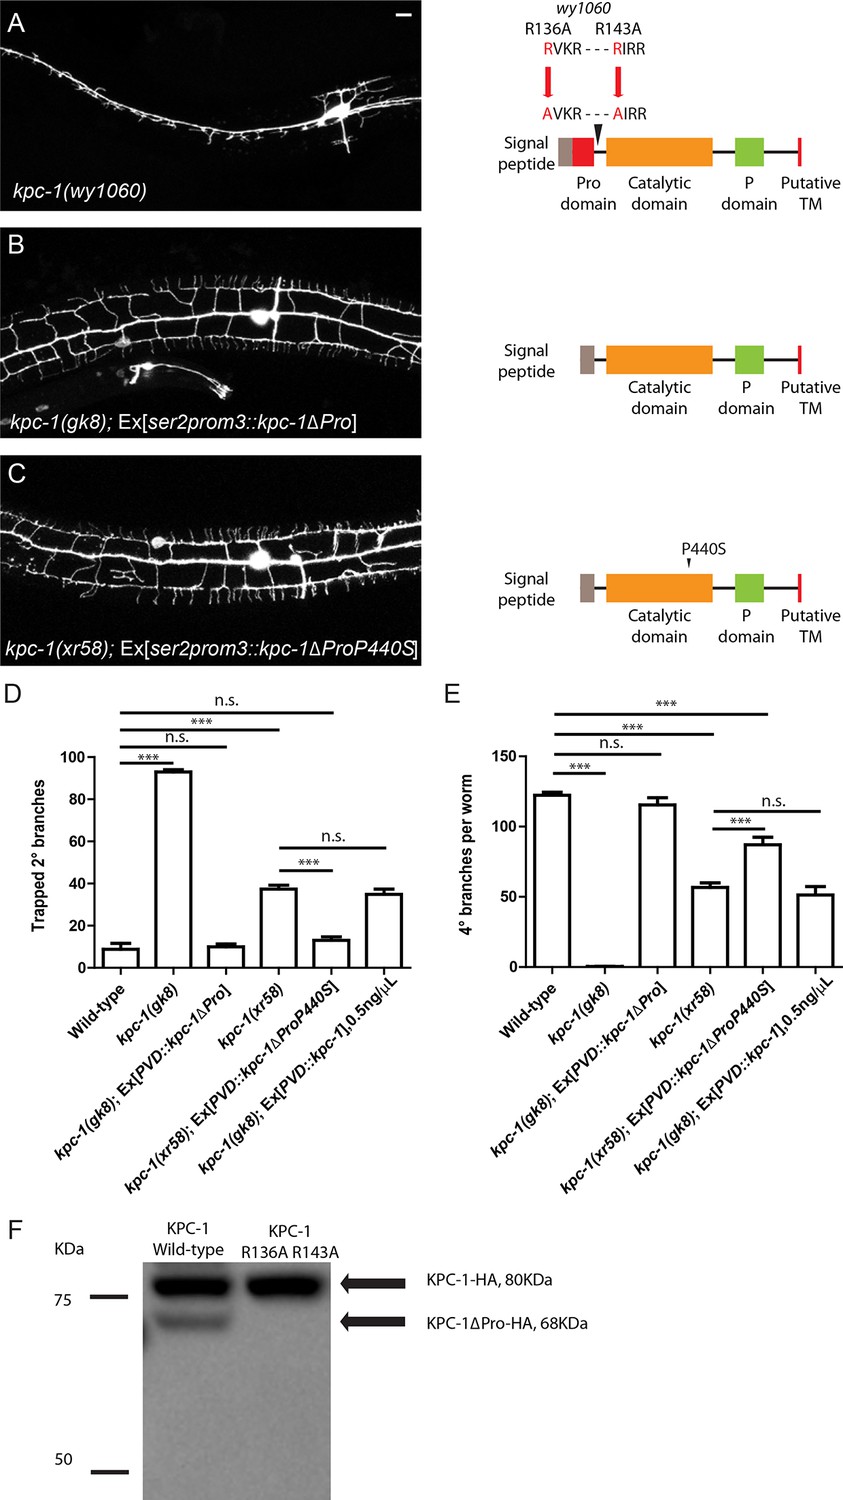
Activation of KPC-1 required self-cleavage.
(A) Fluorescent image showing PVD morphology of kpc-1(wy1060) mutants generated by CRISPR. Both self-cleavage sites were mutated (R136A, R143A). Schematic figure on the right shows the locations of the mutated self-cleavage sites. (B) KPC-1 lacking the N-terminal Pro domain could fully rescue the null kpc -1(gk8) mutants. Scale bar: 10 μm. (C) KPC-1ΔProP440S lacking its Pro domain and also carrying the P440S point mutation in the protease domain rescued the kpc-1(xr58) mutant phenotype. (D) Quantification of the percentage of 2° branches that were trapped around the 1°dendrite. *** is p<0.001, n.s. is p>0.05 by Student’s T-test. N=50 for each genotype. (E) Quantification of the total number of 4° branches per animal. *** is p<0.001, n.s. is p>0.05 by Student’s T-test. N=50 for each genotype. (F) Western blot showing HA-tagged KPC-1 expressed in S2 cells. Two bands were detected corresponding to full length and Pro domain-cleaved KPC-1 proteins in size. The R136A, R143A mutant form with both self-cleavage sites mutated lacked the ΔPro band.
Figure 4 with 2 supplements
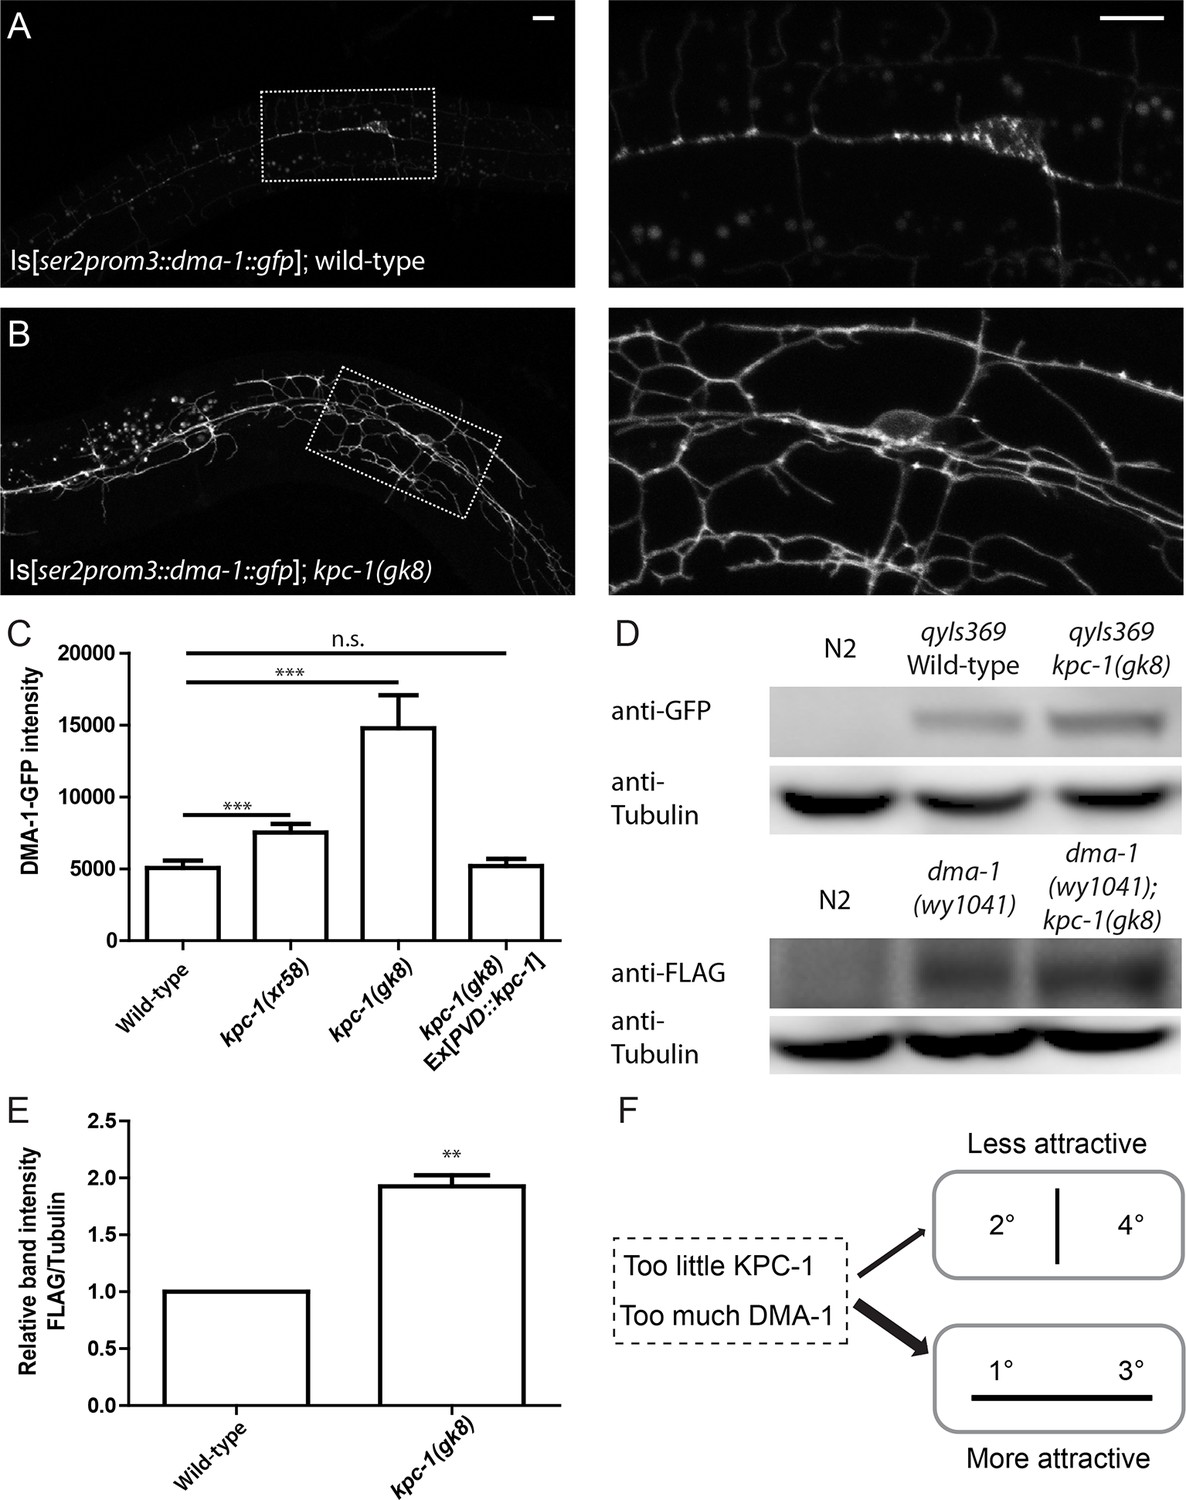
The level of the DMA-1 receptor was increased in kpc-1 mutants.
(A–B) Fluorescent images of DMA-1::GFP in PVD neurons in (A) wild-type and (B) kpc-1(gk8) mutant animals. DMA-1 showed diffuse staining in the entire dendritic arbor but was more enriched in vesicles in the cell body and 1° dendrites in wild-type PVD. Diffuse membrane localization of DMA-1::GFP was significantly increased and vesicle-like puncta were reduced in the kpc-1(gk8) mutant. The images on the right are zoomed-in views of the regions indicated by the dashed boxes. Scale bar: 10 μm. (C) Quantification of fluorescent intensity of diffuse DMA-1::GFP on the 2° dendrites. *** is p<0.001 by Student’s T-test. N=50 for each genotype. (D) Upper panels: Western blot against GFP in wild-type worms without transgene, wild-type worms expressing DMA-1-GFP and kpc-1(gk8) mutant worms expressing DMA-1-GFP. Lower panels: Western blot against FLAG in wild-type animals, dma-1(1041) mutants with 2xFLAG inserted into the dma-1 cytosolic domain of the endogenous genomic locus using CRISPR/Cas9, and dma-1(1041); kpc-1(gk8) double mutants. (E) Quantification of relative band intensity normalized to α-tubulin. ** is p<0.01 by Student’s T-test. N=4 (F) Schematic figure of the proposed model in which loss of KPC-1 caused increased membrane DMA-1, leading to defects in escaping from the high levels of ligands around the 1° and 3° dendrites.
Figure 4—figure supplement 1
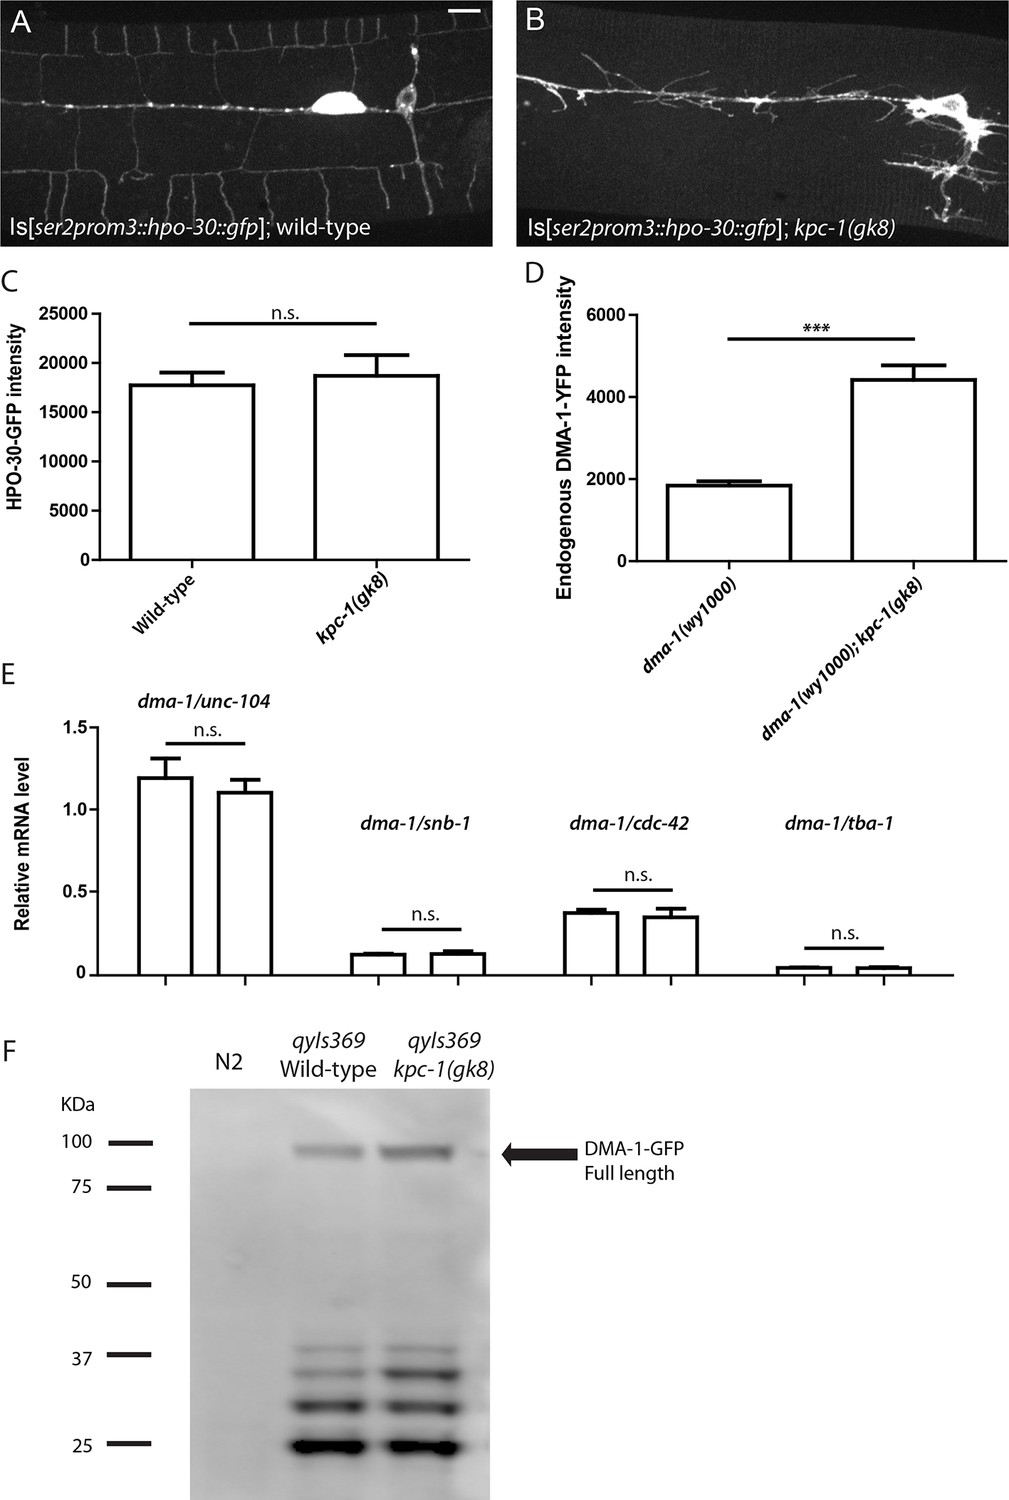
KPC-1 caused specific down-regulation of DMA-1 receptor.
(A–B) Fluorescent images of HPO-30::GFP in (A) wild-type and (B) kpc-1(gk8) mutant PVD neurons. The level of HPO-30 on the membrane was not changed in kpc-1 mutants. Scale bar: 10 μm. (C) Quantification of HPO-30-GFP intensity on the branches. n.s. is p>0.05 by Student’s T-test. N=20 for each genotype. (D) Quantification of DMA-1-YFP fluorescent intensity of an endogenously tagged dma-1(wy1000) allele and its double mutants with kpc-1(gk8). *** is p<0.001 by Student’s T-test. N=20 for each genotype. (E) Quantification of dma-1 mRNA level relative to unc-104, snb-1, cdc-42 and tba-1 measured by qPCR. n.s. is p>0.05 by Student’s T-test. N=3 (F). Full Western blot against GFP in wild-type worms without transgenes, wild-type worms expressing DMA-1-GFP and kpc-1(gk8) mutants expressing DMA-1-GFP. No additional or absent bands were detected in the kpc-1 mutant.
Figure 4—figure supplement 2
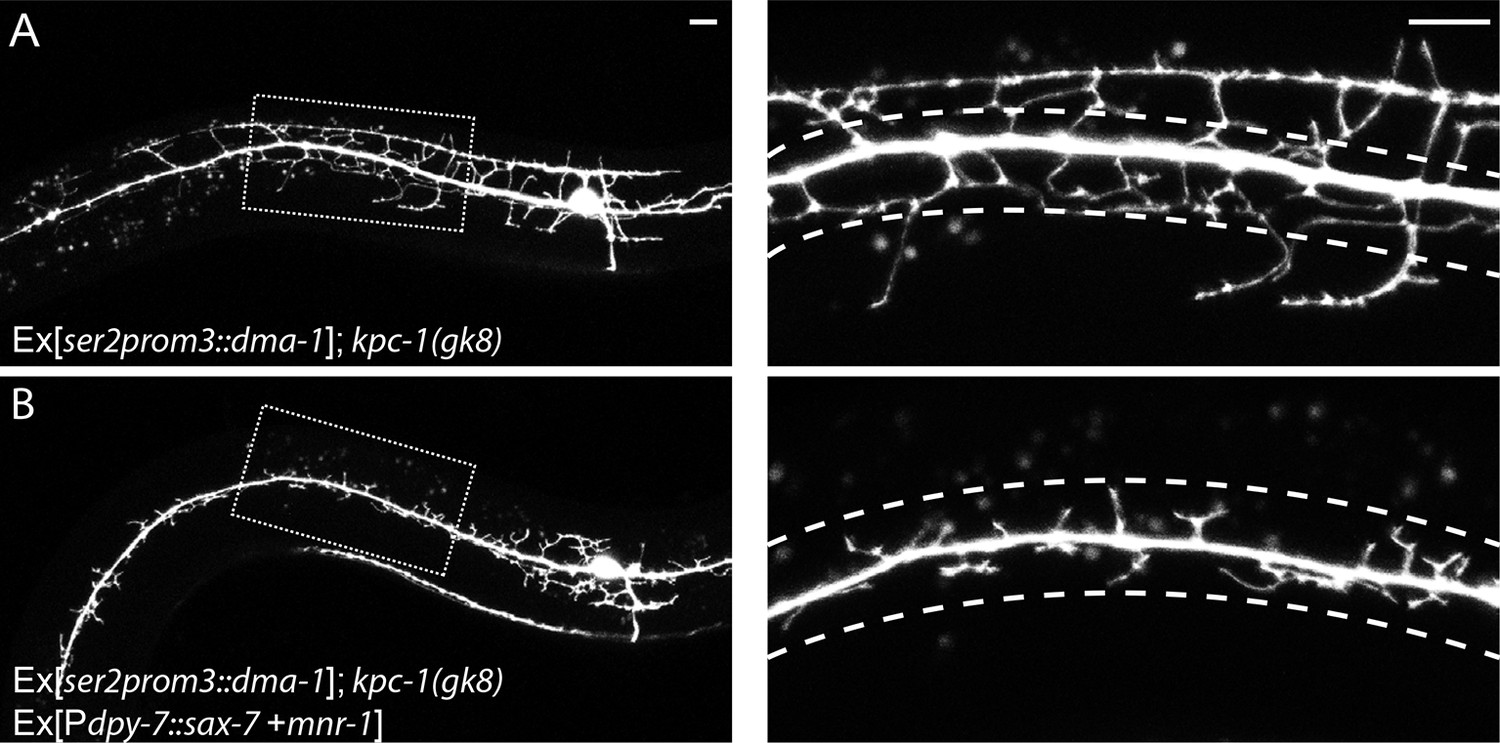
(A) Overexpressing DMA-1 caused more dendrites to escape from the trap zone.
(B) Overexpressing SAX-7 and MNR-1 in the hypodermal cells trapped the dendrites back around the 1° dendrites. The images on the right are zoomed-in views of the region indicated by the dashed boxes on the left. Dashed lines indicate the 'trap zone' with high level SAX-7. Scale bar: 10 μm.
Figure 5 with 1 supplement
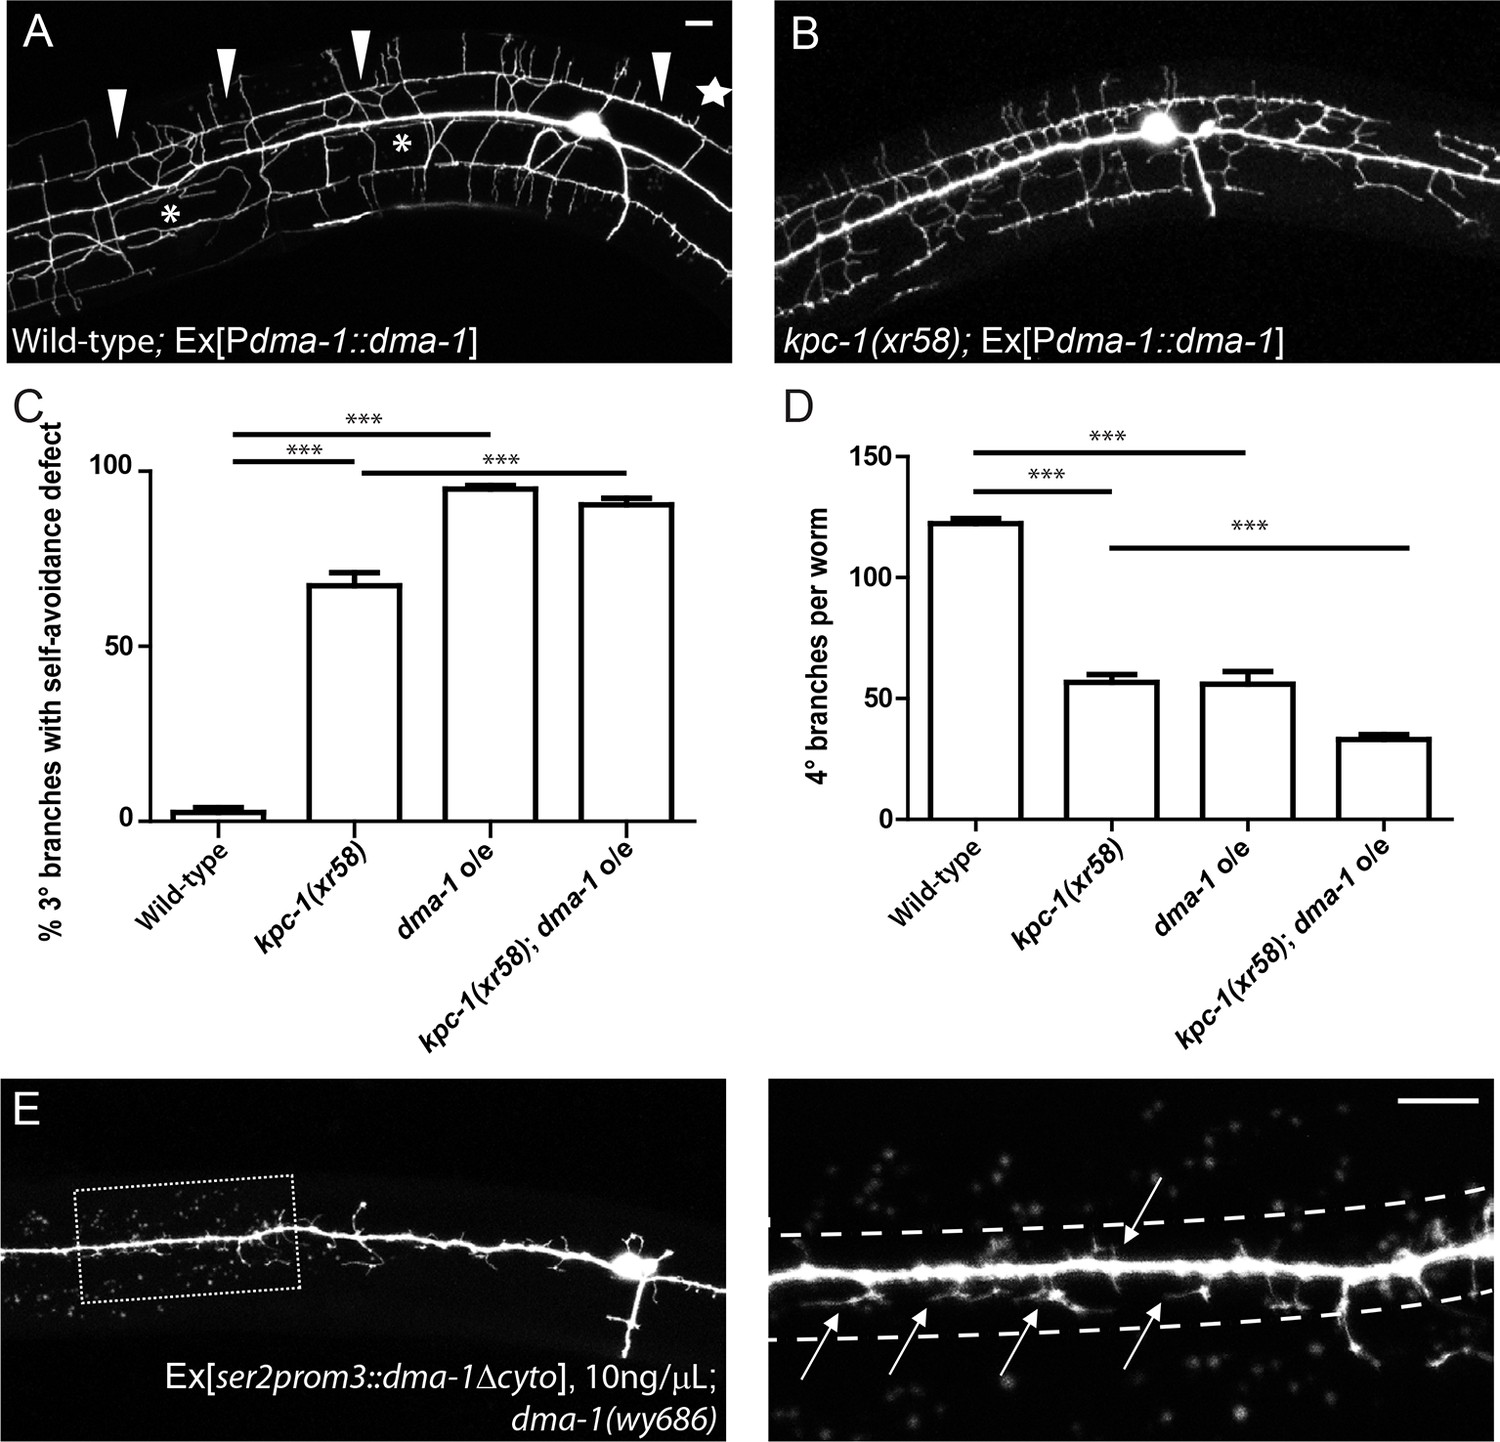
Overexpression of DMA-1 generated kpc-1 mutant-like phenotypes.
(A) Overexpression of DMA-1 in PVD neurons caused similar defects to those of the kpc-1(xr58) mutants shown in Figure 3B. Arrowheads: 3° branches that overlapped with their neighbors in mutants. Star: Defective menorah with no 4° branches. Asterisks: Trapped 2° branches. (B) Overexpressing DMA-1 in kpc-1(xr58) enhanced the 3° self-avoidance and 4° outgrowth phenotypes. (C) Quantification of the percentage of 3° branches that made contact with their neighbors. (D) Quantification of the total number of 4° branches per animal. *** is p<0.001 by Student’s T-test. N=50 for each genotype. (E) Overexpressing truncated DMA-1 without its cytosolic domain produced dramatic trapping phenotype. Arrows: Trapped dendrites. Dotted lines indicated the trap zone. Scale bar: 10 μm.
Figure 5—figure supplement 1

Regulation of DMA-1 by KPC-1 did not require the cytosolic domain of DMA-1.
(A) Fluorescent image showing PVD morphology of the wy908 cytosolic deleted mutant allele of dma-1. 2° and 3° dendrites were mostly intact but the number of 4° branches was reduced. (B) Dendrites of dma-1(wy908); kpc-1(gk8) double mutants were still trapped. (C) Schematic of the DMA-1 protein showing the cytosolic domain deleted in the wy908 allele. (D) Cytosolic domain-truncated DMA-1 expressed in dma-1(wy686) null mutants as a transgene at low concentration gave rise to the same phenotype as wy908. When expressed at a higher concentration, this construct caused robust trapping phenotype shown in Figure 5E. Scale bar: 10μm.
Figure 6 with 1 supplement
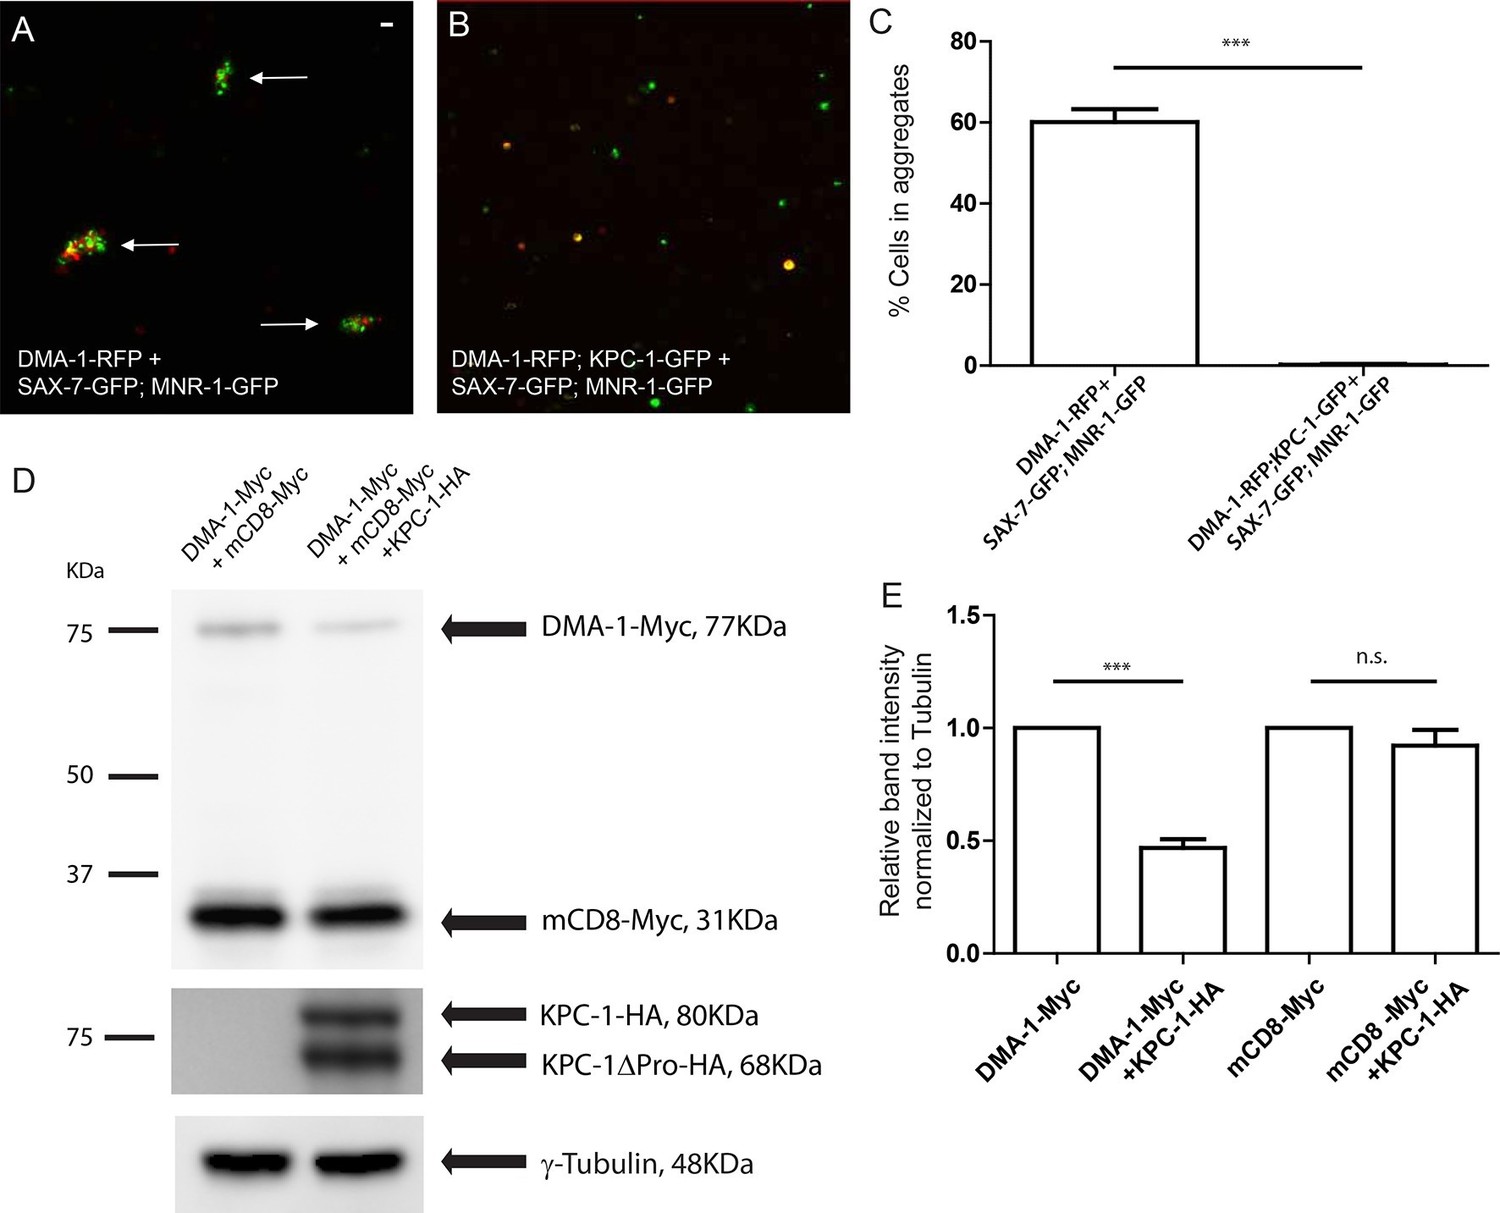
KPC-1 interrupted the interaction between DMA-1 and SAX-7/MNR-1 by down-regulating membrane DMA-1.
(A) Drosophila S2 cells co-expressing SAX-7-GFP and MNR-1-GFP formed aggregates with cells expressing DMA-1-RFP alone. (B) Cell aggregation failed when KPC-1-GFP is co-transfected with DMA-1-RFP. (C) Quantification of percentages of fluorescent cells in aggregates after 3 hr. *** is p<0.001 by Student’s T-test. The experiment was repeated three times for quantification. (D) Immunoblot showing that the amount of DMA-1 was significantly reduced when co-transfected with KPC-1 while that of another co-transfected type I transmembrane protein, mCD8, was not affected. (E) Quantification of band intensity on the Western blots. *** is p<0.001 and n.s. is p>0.05 by Student’s T-test. Each experiment was repeated three times for quantification.
Figure 6—figure supplement 1
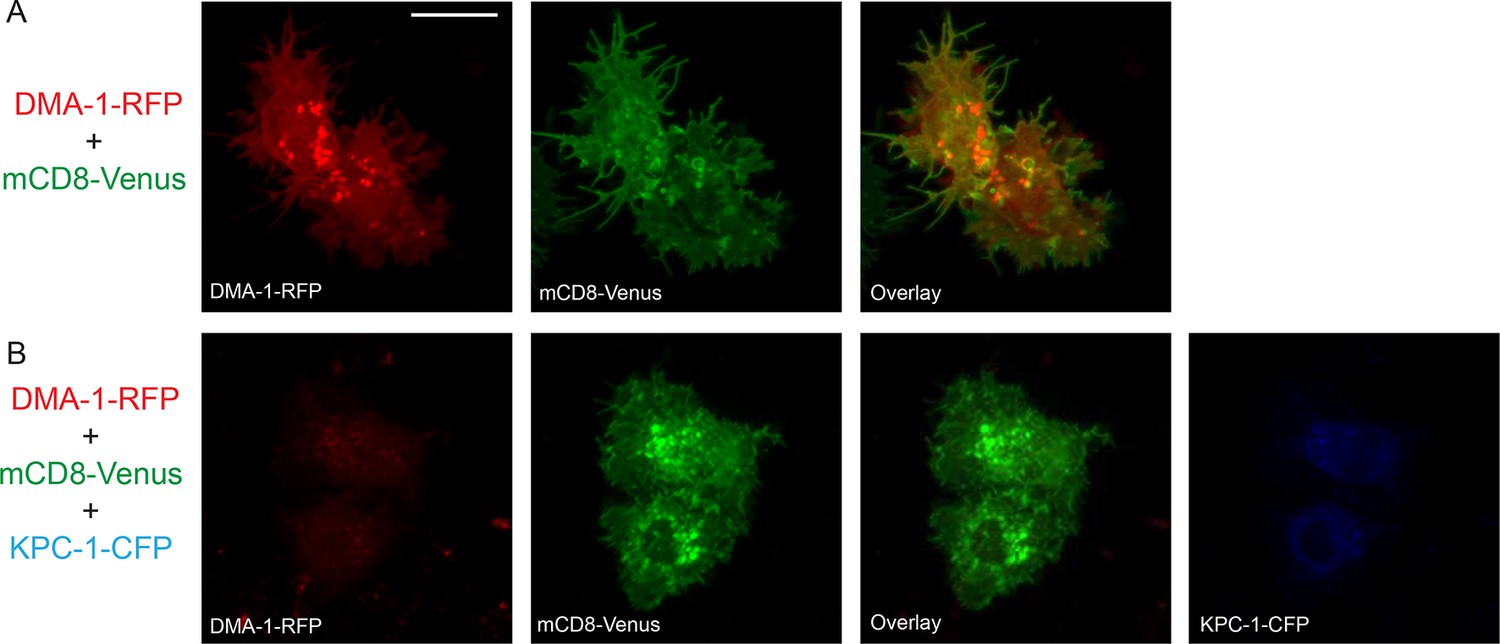
KPC-1 prevented DMA-1 from localizing to the plasma membrane.
(A) Fluorescent images showing S2R+ cells expressing DMA-1-RFP and mCD8-Venus. DMA-1 localized to the plasma membrane. (B) Co-transfection with KPC-1-CFP caused depletion of DMA-1 from the membrane while mCD8-Venus was unaffected. Scale bar: 10 μm.
Figure 7

KPC-1 targeted DMA-1 to endocytic vesicles through direct interaction with its ectodomain.
(A–B) Fluorescent images of DMA-1-GFP (upper panels), mCherry-RAB-7 (middle panels) and overlay (lower panels) in PVD neurons of (A) wild-type and (B) kpc-1(gk8) mutant animals. Many DMA-1-GFP puncta co-localized with late endosomes/lysosomes labeled by mCherry-RAB-7 in wild-type PVD while the co-localization was reduced in the kpc-1(gk8) mutants. kpc-1 mutants showed enhanced DMA-1-GFP fluorescence on the membrane of dendritic branches but less in vesicles. (C–D) Fluorescent images of DMA-1Δcyto-GFP (upper panels), mCherry-RAB-7 (middle panels) and overlay (lower panels) in PVD neurons of (C) wild-type and (D) kpc-1(gk8) mutants. DMA-1 lacking its entire cytosolic domain showed brighter signal on the plasma membrane but still localized to endocytic vesicles. However, in the kpc-1(gk8) mutants, DMA-1Δcyto-GFP was almost exclusively on the plasma membrane but was absent from RAB-7-positive versicles. Scale bar: 10 μm. (E) Quantification of the percentages of mCherry-RAB-7 vesicles that showed DMA-1-GFP or DMA-1Δcyto-GFP fluorescence. *** is p<0.001, * is p<0.05 by Student’s T-test. N=20 for each genotype. (F) DMA-1 binding on KPC-1-immoilized surface using biolayer interferometry. Blue circles represent DMA-1 binding responses on KPC-1, with the black curve as the fit to a Langmuir isotherm model. Open rectangles show DMA-1 binding on a negative-control surface with the SA tip decorated with biotynlated ectodomain of human GPR56. (G-I) Fluorescent images showing the localization of (G) KPC-1-CFP, (H) Venus-RAB-7 and (I) overlay in S2R+ cells. Arrow: KPC-1-CFP puncta that co-localized with Venus-RAB-7. Scale bar: 10 μm. (J) Schematic illustration of the model. Plasma membrane DMA-1 is down-regulated via two synergistic mechanisms: KPC-1 binds to the ectodomain of DMA-1 and targets it to endosomes, while other endocytic pathways signal through the cytosolic domain of DMA-1. LRR: Leucine rich repeats domain, cyto: cytosolic domain, LE/LY: Late endosomes/lysosomes
Additional files
-
Supplementary file 1
Table S1 Mutant alleles and transgenes used in this study.
Table S2 Plasmids used in this study. Table S3 sgRNAs and repair oligos for CRISPR.
- https://doi.org/10.7554/eLife.11008.019
Download links
A two-part list of links to download the article, or parts of the article, in various formats.
Downloads (link to download the article as PDF)
Open citations (links to open the citations from this article in various online reference manager services)
Cite this article (links to download the citations from this article in formats compatible with various reference manager tools)
Precise regulation of the guidance receptor DMA-1 by KPC-1/Furin instructs dendritic branching decisions
eLife 5:e11008.
https://doi.org/10.7554/eLife.11008


