Ion channels and calcium signaling in motile cilia
- Howard Hughes Medical Institute, Boston Children's Hospital, United States
- Harvard Medical School, United States
Figures
Figure 1
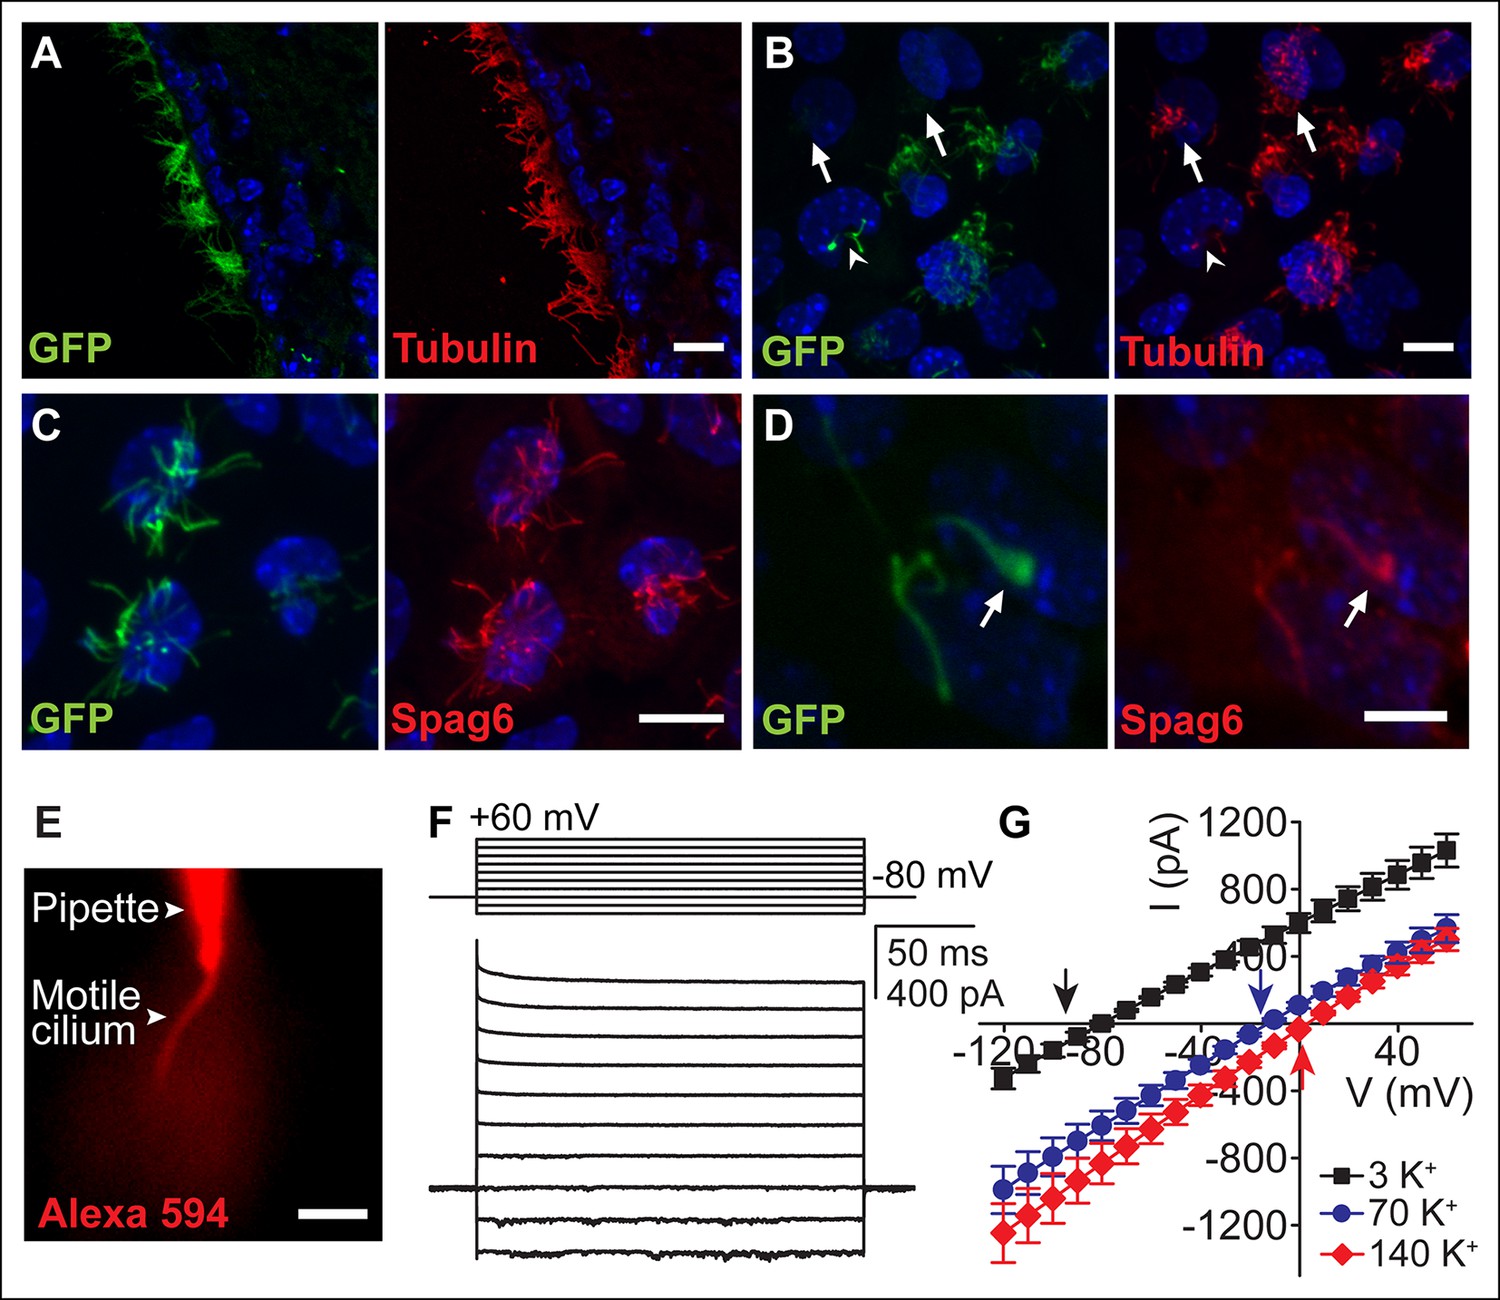
Ependymal motile cilia identification and patch clamp.
(A) Immunolabeling of motile cilia in a section of the lateral ventricle from an Arl13B-EGFPtg mouse. Ciliary localization of Arl13B-EGFP was confirmed using anti-GFP (green) and anti-acetylated tubulin antibodies (red). (B) Anti-GFP (green) and anti-acetylated tubulin staining (red) of cultured ependymal cells at DIV10. GFP labeling of motile cilia varied, with some cells displaying only weak or barely detectable GFP fluorescence in cilia (arrows). Some cells were only sparsely ciliated (arrowhead). (C) Staining of cultured multiciliated cells with anti-GFP (green) and anti-Spag6 (red). (D) Representative staining of a previously recorded ependymal cell grown on a gridded glass bottom dish (grid size, 50 μm, arrow marks motile cilium). Motile cilia of sparsely ciliated cells were GFP (green) and Spag6 (red) positive (n = 40/45). Nuclei were labeled with Hoechst dye (blue, A–D). Panels B-D display average intensity z-projections of image stacks. Scale bars, 10 μm (A–C) and 5 μm (D). (E) Image showing dye diffusion into a motile cilium after successful break-in (50 μM Alexa 594 hydrazide, n = 9). Scale bar, 3 μm. (F) Example current (bottom) recorded in the whole-motile-cilium configuration in response to increasing voltage steps (top). Holding potential, -80 mV. (G) Mean steady state current after break-in plotted as a function of command voltage (n = 4). External solution (aCSF) with 3 mM KCl (black filled squares), 70 mM KCl (blue filled circles), and 140 mM KCl (red filled diamonds). Arrows in the graph indicate calculated EK values. Error bars; ± SEM.
Figure 2
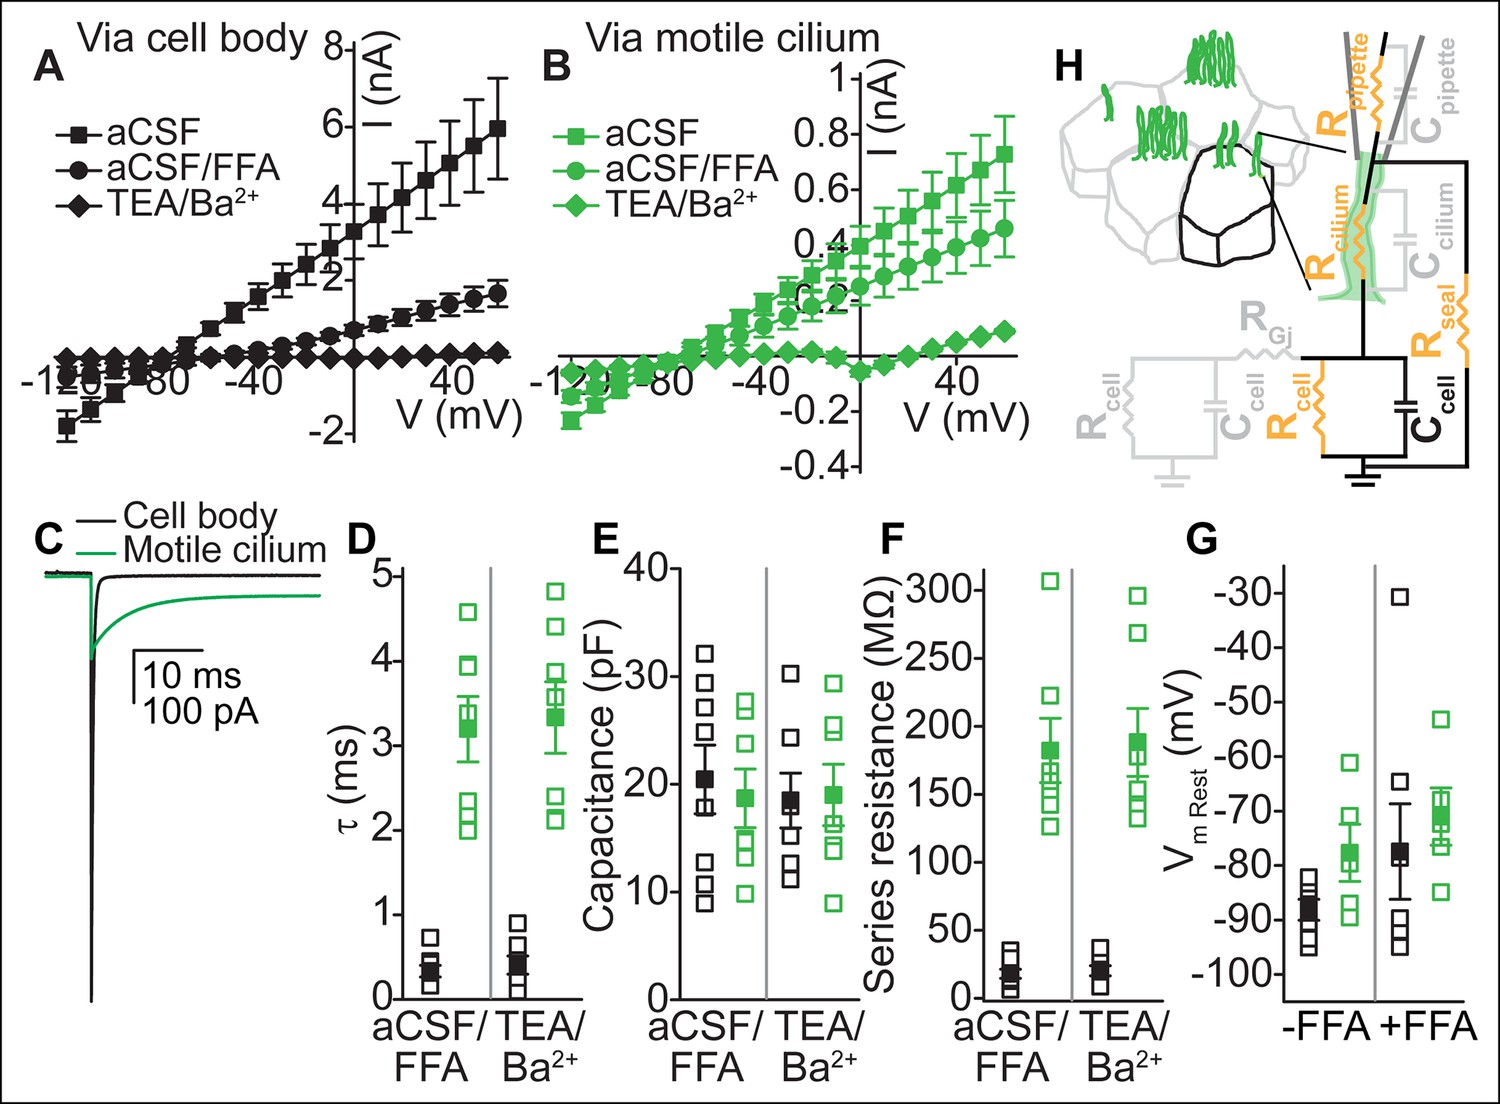
Electrical coupling of motile cilia to the cellular compartment.
(A,B) Mean current-voltage relation recorded from the cell body (A, n = 6) or a motile cilium (B, n = 5) after break-in in aCSF (filled squares), subsequent cell uncoupling with flufenamic acid (FFA, 100 μM, 2 min, filled circles), or block of K+ conductances in TEA-Cl/BaCl2 (TEA/Ba2+, filled diamonds; only cell/cilium recordings with input resistance >1 GΩ after TEA-Cl/BaCl2 treatment are plotted). Holding potential between 200 ms steps, -80 mV. Note: The voltage in A and B refers to the command voltage. The voltage error, that is, the difference between the command voltage and membrane voltage produces a large error due to the high resistance through the cilium in series with the low, multicellular membrane resistance (resting K+ conductance, cell-cell connections via gap junctions). Thus, large currents are inaccurate: the top traces only serve to show that flufenamic acid uncouples cells. (C) Example capacitive currents recorded in response to a 20 mV hyperpolarizing voltage step (50 ms) for the cell body (black) and motile cilium (green) after uncoupling with flufenamic acid (FFA, 100 μM) and block of K+ conductances (TEA-Cl/BaCl2). The steady state (time-independent) current in the motile cilium trace is leak current. (D–F) Time constant (D), membrane capacitance (E), and series resistance (F) determined from an average of 100–200 sweeps of capacitive current for cell body (black squares) and motile cilium (green squares) recordings after cell uncoupling with flufenamic acid (FFA, 100 μM, ~5 min) and perfusion with TEA-Cl/BaCl2 (TEA/Ba2+, n = 7–8). (G) Resting membrane potential assessed under current clamp with a gramicidin-perforated patch for cell bodies (black squares) and motile cilia (green squares) before (n = 7 cell body, n = 8 motile cilia) and after (n = 7 cell body, n = 5 motile cilia) addition of flufenamic acid (FFA, 100 μM) to the bath. Open squares represent the range of individual cells/cilia; filled squares are the mean. Error bars; ± SEM. (H) Cartoon illustrating simplified equivalent circuit of access to the cellular compartment via a motile cilium. The cable-like properties of a motile cilium significantly increase the access (series) resistance. Block of gap junctions by flufenamic acid removes the contributions from neighboring cells.
Figure 3 with 1 supplement
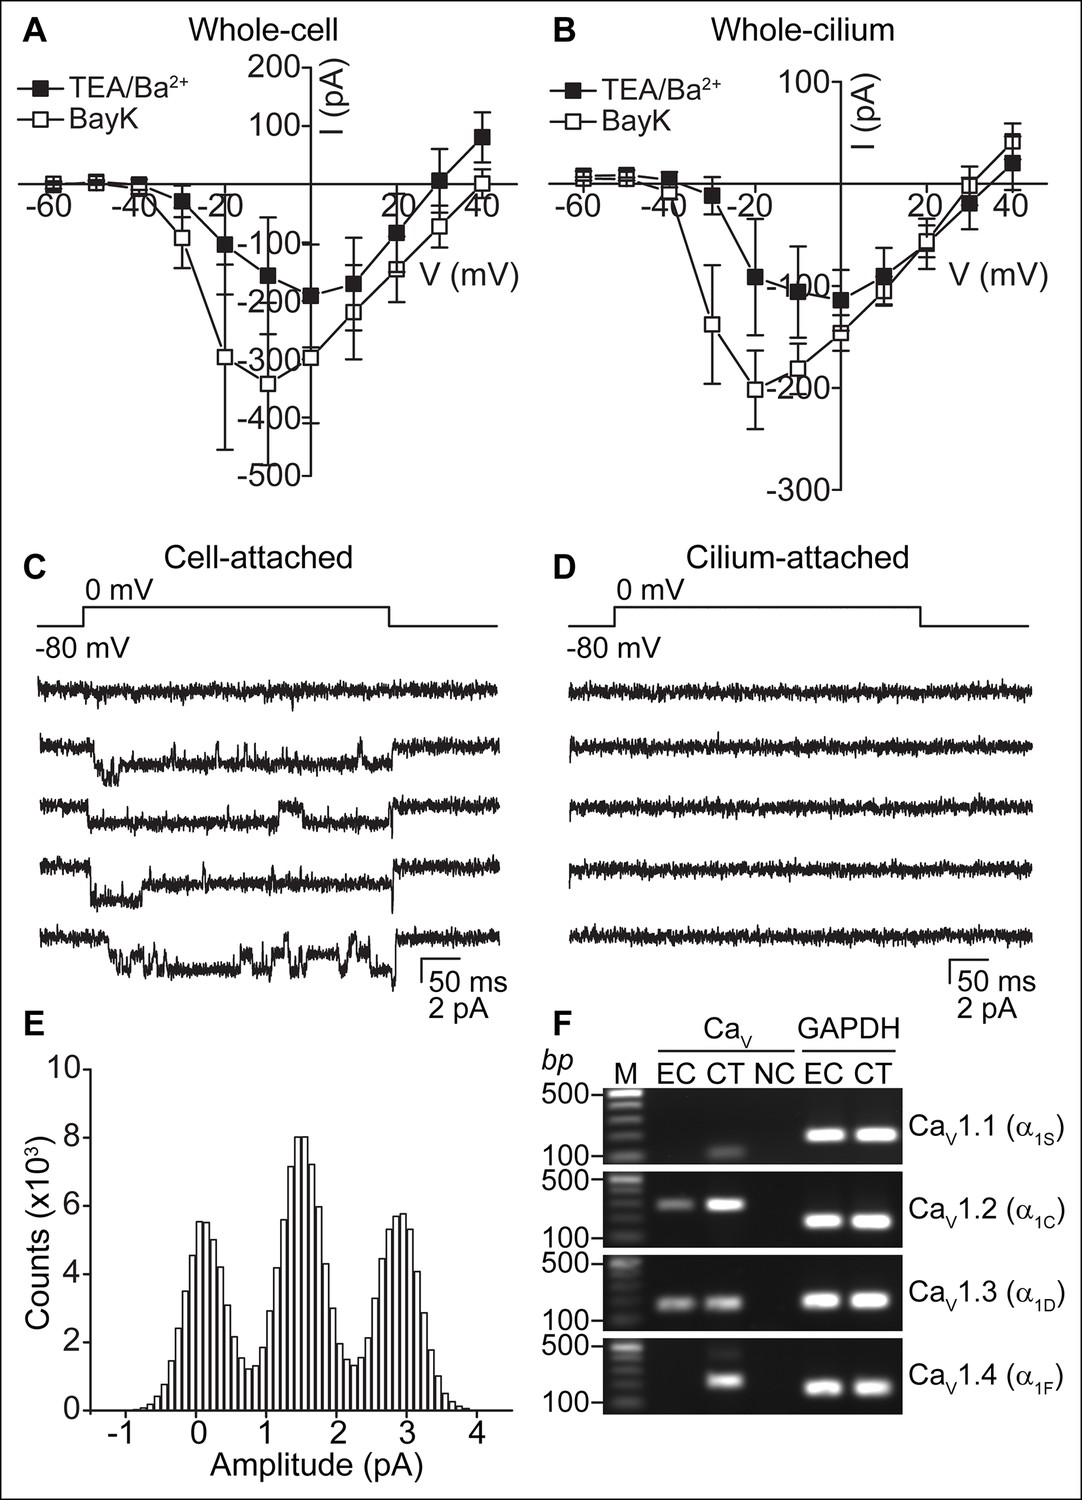
CaV-mediated currents and single channels in ependymal cells.
(A,B) Average peak current in response to voltage steps (500 ms) before (filled squares, in TEA-Cl/BaCl2) and after addition of the CaV potentiator, BayK 8644 (BayK, 5 μM, open squares), recorded from the cell body (A, n = 7) or motile cilia (B, n = 8). Peak current amplitudes varied substantially (range pre BayK treatment: cells, -58 pA to -726 pA; cilia, -25 pA to -413 pA). The high series resistance in whole-motile-cilium recordings shifts the peak to more hyperpolarized potentials. Holding potential, -80 mV. Cells were uncoupled by flufenamic acid (FFA, 100 μM). Error bars; ± SEM. (C,D) Example of 5 consecutive traces recorded in cell-attached (C) or cilium-attached (D, pipette filled with BaCl2). BayK-induced long lasting CaV channel openings were observed in 6 of 8 cell-attached recordings (BayK, 5 μM, bath). CaV channel openings were rare in motile cilia-attached recordings (n = 1/29, see Figure 3—figure supplement 1; note: smaller pipettes in motile cilia recordings results in smaller membrane area sampling). (E) All point amplitude histogram of all traces from the recording shown in C. (F) RT-PCR showing amplification of CaV1.2 and CaV1.3 transcripts from cDNA derived from cultured ependymal cells (EC, DIV10). cDNAs from skeletal muscle (CaV1.1), heart (CaV1.2), brain (CaV1.3), and eyes (CaV1.4) served as positive control tissues (CT). Minus reverse transcriptase negative control (NC). Molecular ladder (M). GAPDH was amplified from all cDNAs. Images cropped for illustration.
Figure 3—figure supplement 1
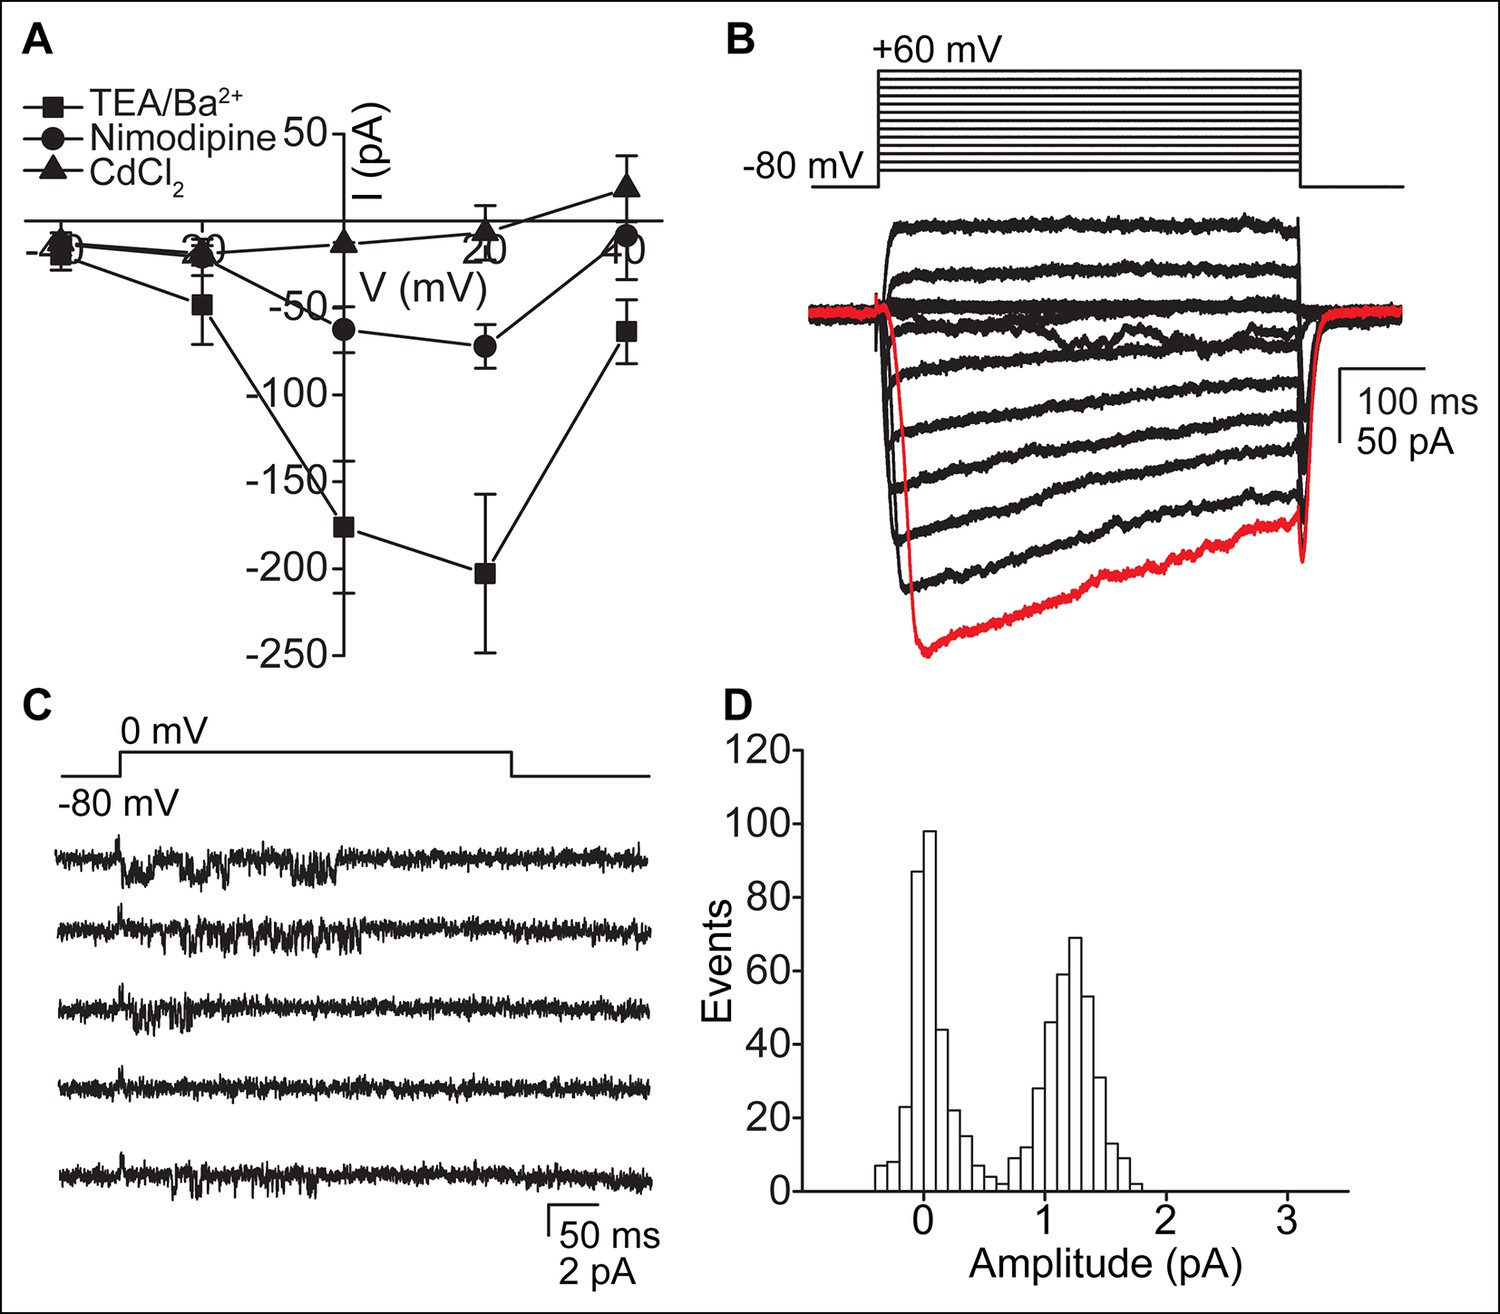
CaV-mediated currents and single channels in ependymal cells.
(A) Reduction of CaV currents by nimodipine (10 μM, 2 min pre-incubation) and cadmium chloride (CdCl2, 100 μM) (n = 4, recorded from the cell body). Holding potential, -60 mV. Error bars; ± SEM. (B) Example of slightly distorted current observed in some whole-motile-cilium recordings due to the high series resistance. The red trace depicts the delayed opening of CaV channels as a result of the increased series resistance and delayed voltage clamp. Large oscillations indicate transient loss of voltage clamp. (C,D) Example of 5 consecutive traces recorded from a motile cilium in the cilium-attached configuration in presence of BayK8644 (5 μM, bath and pipette, C) and open point amplitude histogram of all recorded traces (D, fraction of full amplitude = 0.9). Single channel openings were observed in 1 of 29 recordings. Mean single channel amplitude was 1.2 pA.
Figure 4 with 1 supplement
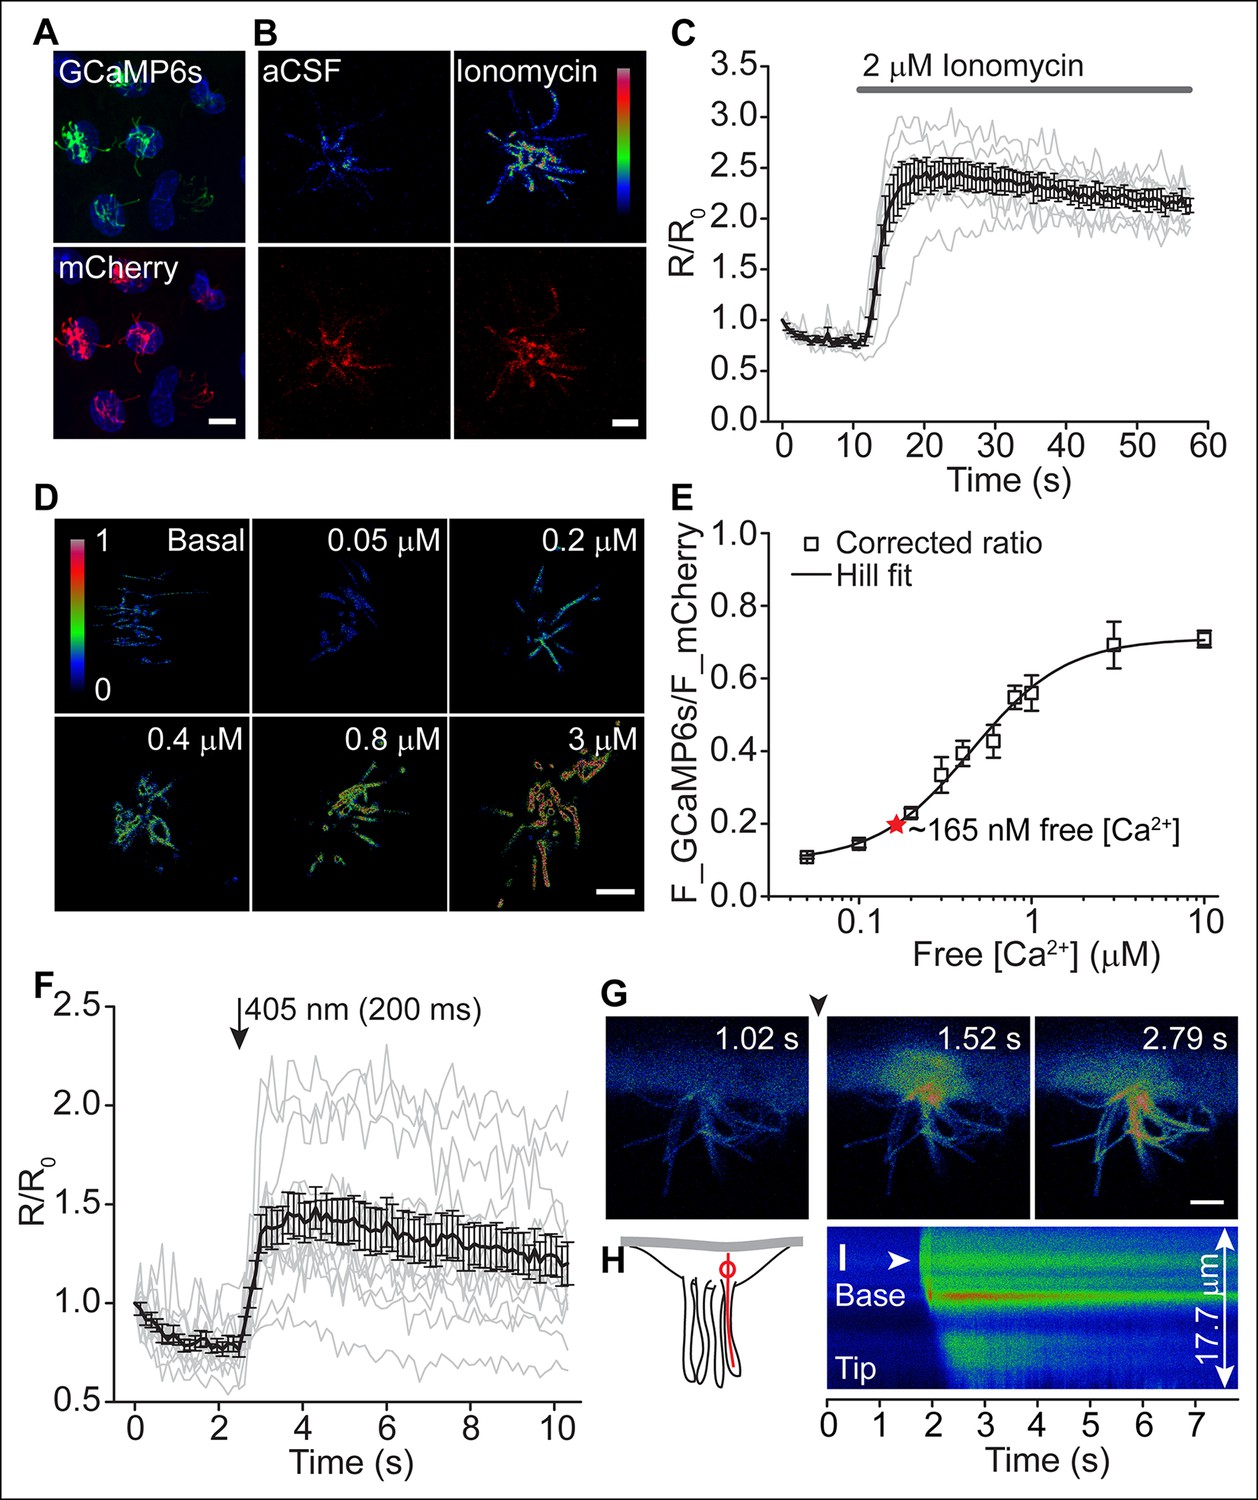
Motile cilia [Ca2+] can be modified by cytoplasmic [Ca2+].
(A) Cluster of recombinant adenovirus-transduced ependymal cells expressing the cilia-targeted fusion construct mSSTR3-mCherry-GCaMP6s. In fixed cells, cilia were recognized by staining with anti-GFP (green) and anti-mCherry (red) antibodies. (B,C) mSSTR3-mCherry-GCaMP6s reported changes in motile cilia [Ca2+] in response to ionomycin (2 μM). Example images (B) showing GCaMP6s (pseudocolor) and mCherry fluorescence before (in aCSF) and after addition of ionomycin to the bath, and quantified ratio changes (C, n = 7 cells). The ratio of GCaMP6s and mCherry (R) was normalized to the initial ratio (R0). (D) Example pseudocolor images of F_GCAMP6s/F_mCherry ratios of ependymal motile cilia in aCSF (basal) and under defined free [Ca2+] in the bath. Ratio images were background-subtracted and thresholded. (E) Calibration curve showing F_GCAMP6s/F_mCherry ratio plotted as a function of free [Ca2+] (n = 5–8 for each [Ca2+]). Resting motile cilia [Ca2+] was 165 nM at steady state (n = 30, red star). (F) Quantified changes in F_GCAMP6s/F_mCherry ratio in response to Ca2+ uncaging in the cytoplasm (n = 13). (G) Example pseudocolor images from a time lapse recording of an ependymal cell, recorded from the side (see Materials and methods). Ca2+ was uncaged in the cytoplasm at the cilia base (approx. time point marked by arrowhead, 405 nm illumination for 200 ms). (H) Cartoon illustrating line scanning. The red circle and red line indicate the typical position of the uncaging stimulus and line scan. (I) Example record of a line scan through the cytoplasm and a motile cilium displayed in pseudocolor. The arrowhead marks the position of uncaging at the ciliary base. Ca2+ rapidly diffused from the cytoplasm into the motile cilium (593 ± 86 ms to the tip, n = 15). Error bars; ± SEM. Scale bars, 10 μm (A) and 5 μm (B,D,G).
Figure 4—figure supplement 1
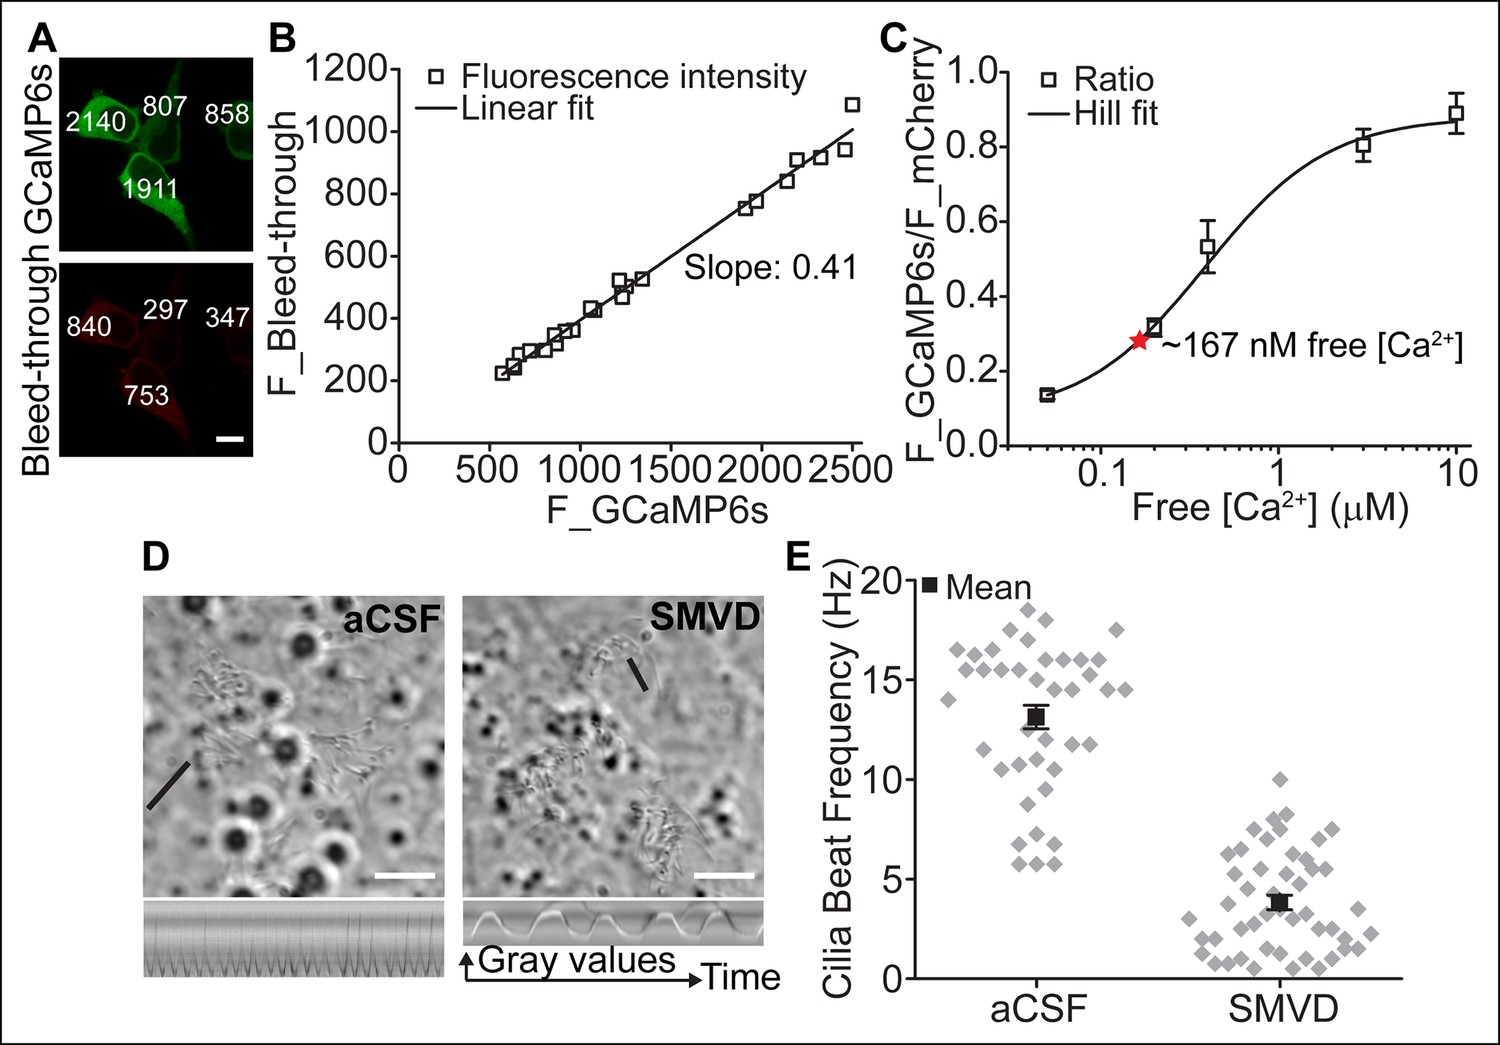
Motile cilia [Ca2+] can be modified by cytoplasmic [Ca2+].
(A) Example images of HEK293 cells transfected with GCaMP6s. Images were acquired using the same settings used to calibrate the sensor. Non-sequential scanning resulted in bleed-through of the GCaMP6s signal. Fluorescent intensities are indicated. Scale bar, 10 μm. (B) Plotted linear correlation of the GCaMP6s fluorescent intensity and F_bleed-through (n = 24). (C) Sensor calibration using sequential scanning mode after treatment with sodium metavanadate (SMVD, 100 μM; n = 4–5 for each [Ca2+]). Resting motile cilia [Ca2+], 167 nM (n = 10, red star). (D) Example DIC images taken before and after incubation of ependymal cells with sodium metavanadate (SMVD, 100 μM). Black line indicates the position of the line used to derive the kymographs shown below. Scale bars, 10 μm. (E) SMVD treatment greatly reduced the cilia beat frequency (n = 40, aCSF and n = 48, SMVD). Beating frequencies of analyzed cilia ranged from 5.75–18.5 Hz in aCSF and 0–10 Hz after incubation with SMVD. Error bars; ± SEM.
Figure 5 with 1 supplement

Depolarization increases ciliary [Ca2+], but not ciliary beat frequency or fluid velocity.
(A,B) Example pseudocolor images of a cell expressing the ratiometric sensor mSSTR3-mCherry-GCaMP6s in motile cilia before and during perfusion of 140 K+ (A) and quantification of ciliary F_GCaMP6s/ F_mCherry ratio changes in response to 140 K+ (B, n = 15 cells). Ionomycin (1 μM) was applied as control stimulus. (C,D) Example pseudocolor images of a cell pre-treated with nimodipine (10 μM, 2 min, C) and quantification of ratio changes in response to a depolarizing stimulus (140 K+) after CaV channel block by 10 µM nimodipine (D, n = 11 cells). (E) Ciliary beat frequency of cultured ependymal cells was not substantially altered during perfusion of depolarizing [K+] solutions (70 or 140 K+, n = 5 coverslips). The black line in the DIC image (left) indicates the position of the line used to derive the kymographs. Kymographs were analyzed at the indicated time points (duration, 1 s). (F) Example image of a brain slice showing frame by frame position of tracked beads along the lateral ventricle. Dotted lines indicate the area in which beads were tracked (<30 μm from surface). The arrow marks the direction of fluid flow. (G) Bead velocities measured under the conditions indicated. The mean is indicated by the black line and the open circles (gray) represent the velocities of all tracked beads for each condition (3 K+: n = 6 slices, 21 beads; ATP (100 μM): n = 4 slices, 13 beads; 40 K+: n = 2 slices, 10 beads; 70 K+: n = 5 slices, 16 beads; 70 K+ + 10 μM nimodipine (70 N): n = 5 slices, 14 beads). Error bars; ± SEM. Scale bars, 5 μm (A,C,E) and 10 μm (F).
Figure 5—figure supplement 1
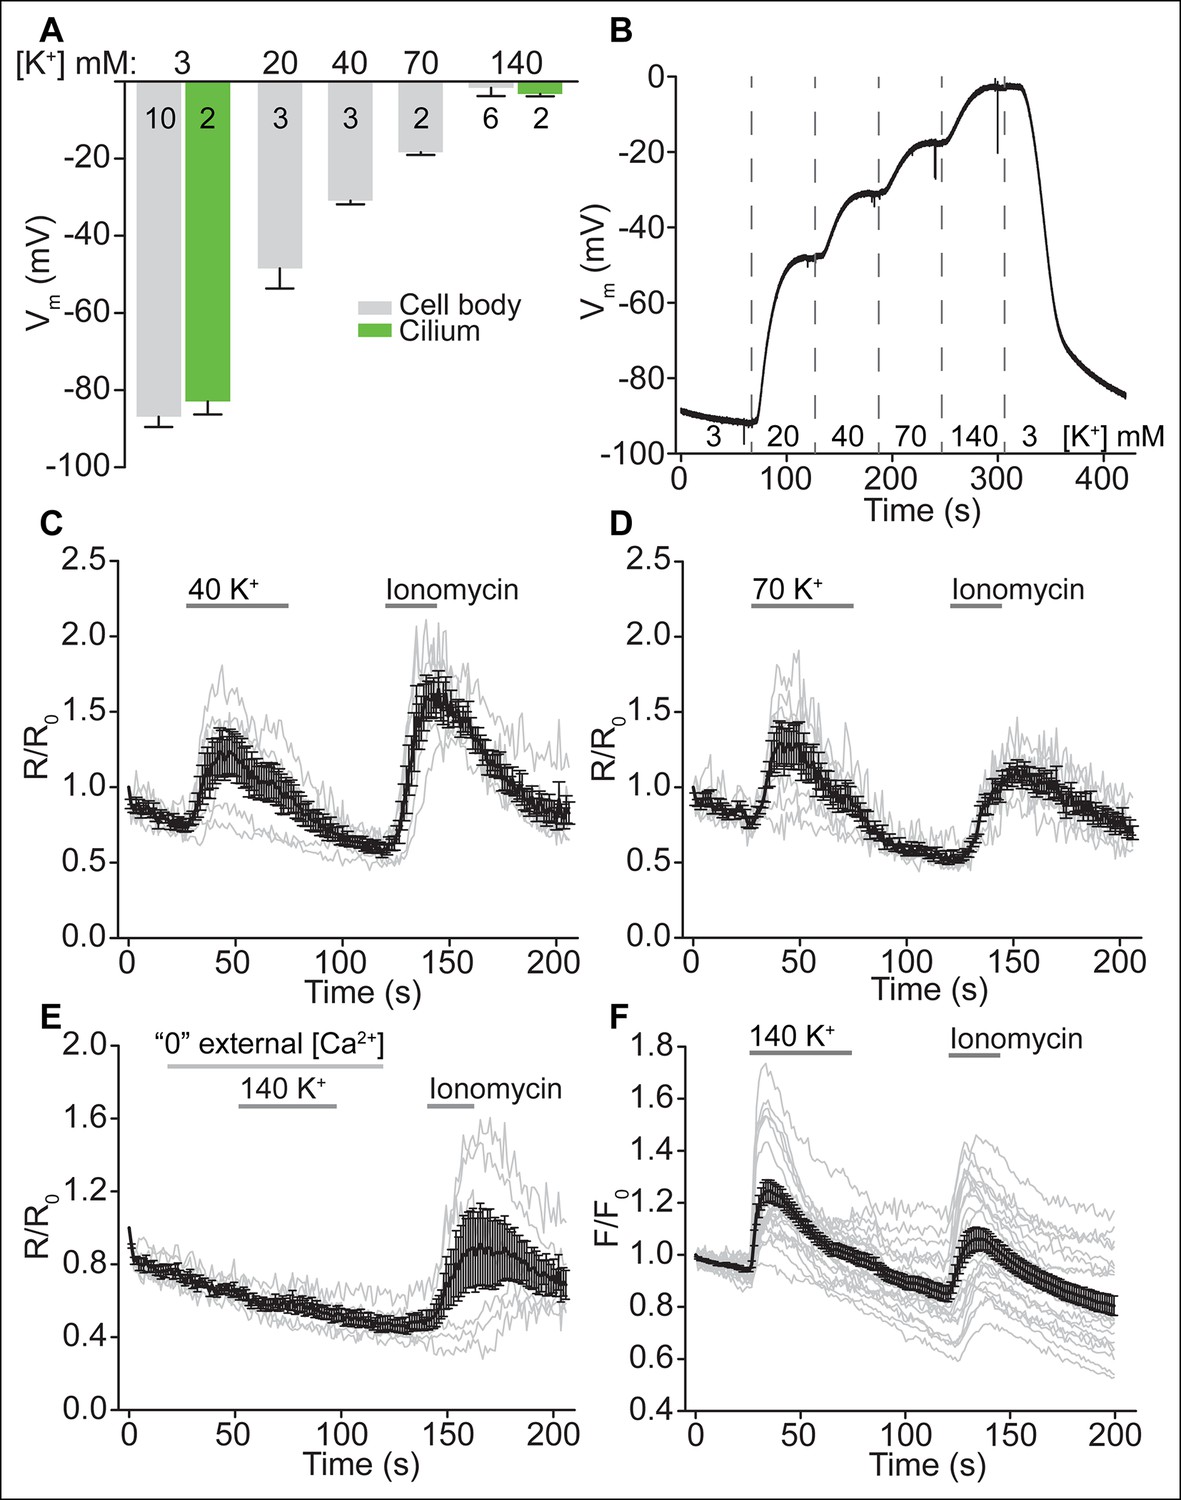
Depolarization increases ciliary [Ca2+], but not ciliary beat frequency or fluid velocity.
(A) Average cell (gray) and motile cilia (green) membrane potential in varying bath [K+]. (B) Example current clamp recording from an ependymal cell body. (C,D) Motile cilia F_GCaMP6s/F_mCherry ratio changes in response to 40 K+ (C, n = 6 cells) and 70 K+ (D, n = 7 cells). Ionomycin (1 μM) was applied as control stimulus. (E) Motile cilia F_GCaMP6s/F_mCherry ratio changes in response to 140 K+ in externally Ca2+-chelated solution (no added Ca2+, 0.5 mM EGTA, n = 6). (F) Quantified changes in cytoplasmic [Ca2+] in response to 140 K+ (n = 22/23, 3 coverslips). Ependymal cells were loaded with the Ca2+ dye, OGB-1 (2 μM). Error bars; ± SEM.
Videos
Video 1
Time lapse of a ciliated cell.
Ependymal cells were grown on gridded culture dishes (grid size, 50 μm). Sparsely ciliated cells were recorded, fixed and stained with a central pair marker (Spag6). The example movie corresponds to the staining shown in Figure 1D (same grid). Frame rate 0.065 s, playback 1x. Scale bar, 5 μm.
Video 2
Patch clamping of a motile cilium.
Frame rate 0.58 s, playback 1x. Scale bar, 3 μm.
Video 3
Time lapse of a cell imaged from the side.
Ca2+ was uncaged in the cytoplasm at the cilia base (approximate location indicated by circle) with a brief 405 nm laser pulse (time point 1.016 s for 200 ms) and diffused into the motile cilia. Cilia movement was inhibited by sodium metavanadate (100 μM). Frame rate 0.254 s, playback 1x. Scale bar, 5 μm.
Download links
A two-part list of links to download the article, or parts of the article, in various formats.
Downloads (link to download the article as PDF)
Open citations (links to open the citations from this article in various online reference manager services)
Cite this article (links to download the citations from this article in formats compatible with various reference manager tools)
Ion channels and calcium signaling in motile cilia
eLife 4:e11066.
https://doi.org/10.7554/eLife.11066


