Unnatural amino acid photo-crosslinking of the IKs channel complex demonstrates a KCNE1:KCNQ1 stoichiometry of up to 4:4
- University of British Columbia, Canada
Figures
Figure 1
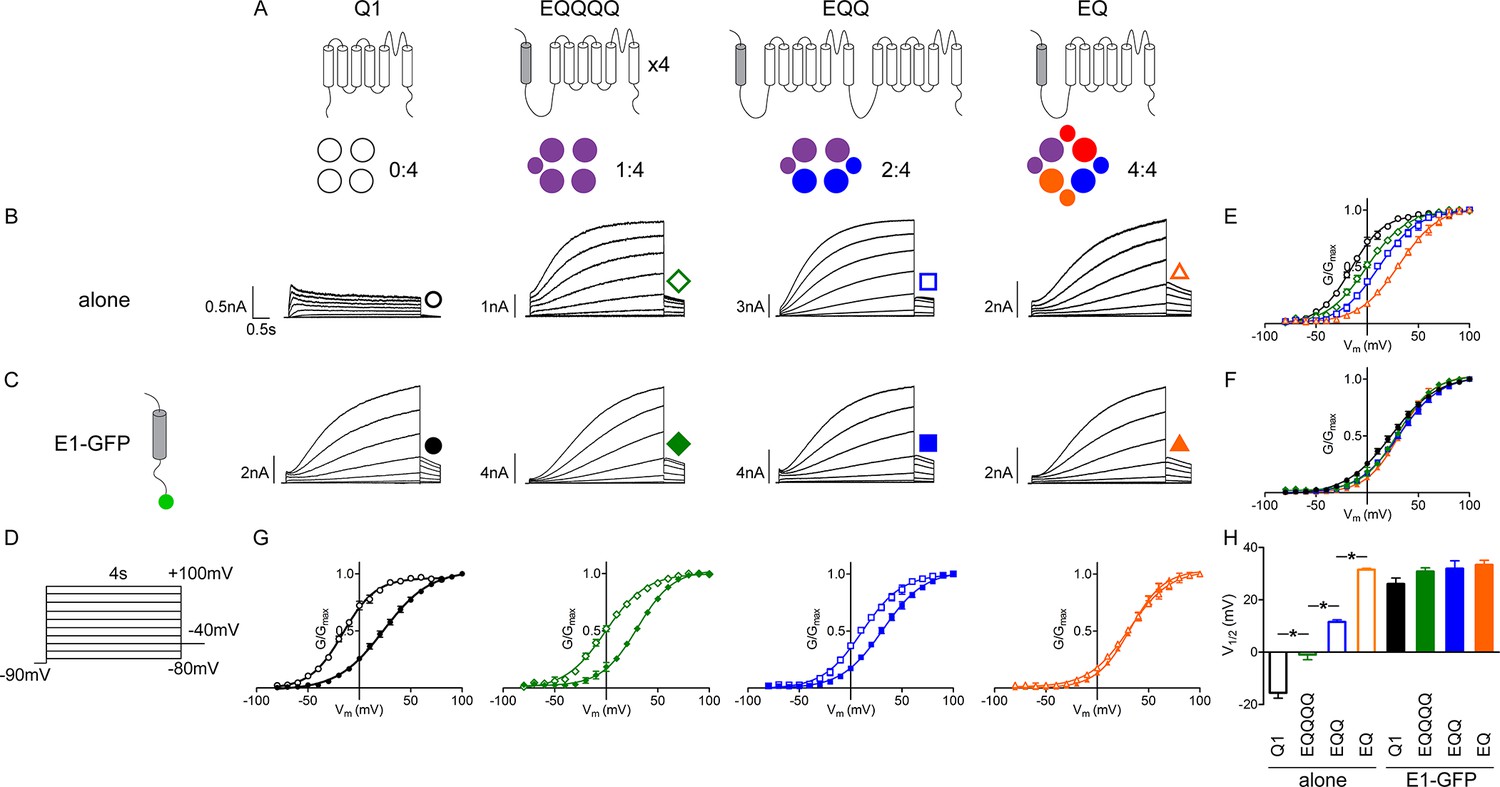
Additional β-subunits can alter IKs channel complex gating properties.
(A) Channel topology diagrams indicate the configuration and proposed stoichiometry of the channels. The KCNE1 sequences are shaded. Representative whole cell patch clamp recordings are shown for KCNQ1 (black circle), EQQQQ (green diamond), EQQ (blue square) and EQ (orange triangle), expressed alone (B; open symbols) or in combination with wild type KCNE1-GFP (C; filled symbols). (D) Currents were elicited using a 4 s isochronal activation protocol. Only odd numbered sweeps are shown for clarity. Tail current G-V plots are shown comparing the response to increasing number of β-subunits either by fusion (E) or by co-expression with KCNE1 (F). (G) G-V plots comparing each channel complex with and without co-expression of KCNE1. (H) Summary of each channel’s V1/2 of activation (n = 3–11; *p<0.05). See Figure 1—source data 1.
-
Figure 1—source data 1
V1/2 of activation for IKs channel complexes
- https://doi.org/10.7554/eLife.11815.004
Figure 2 with 2 supplements
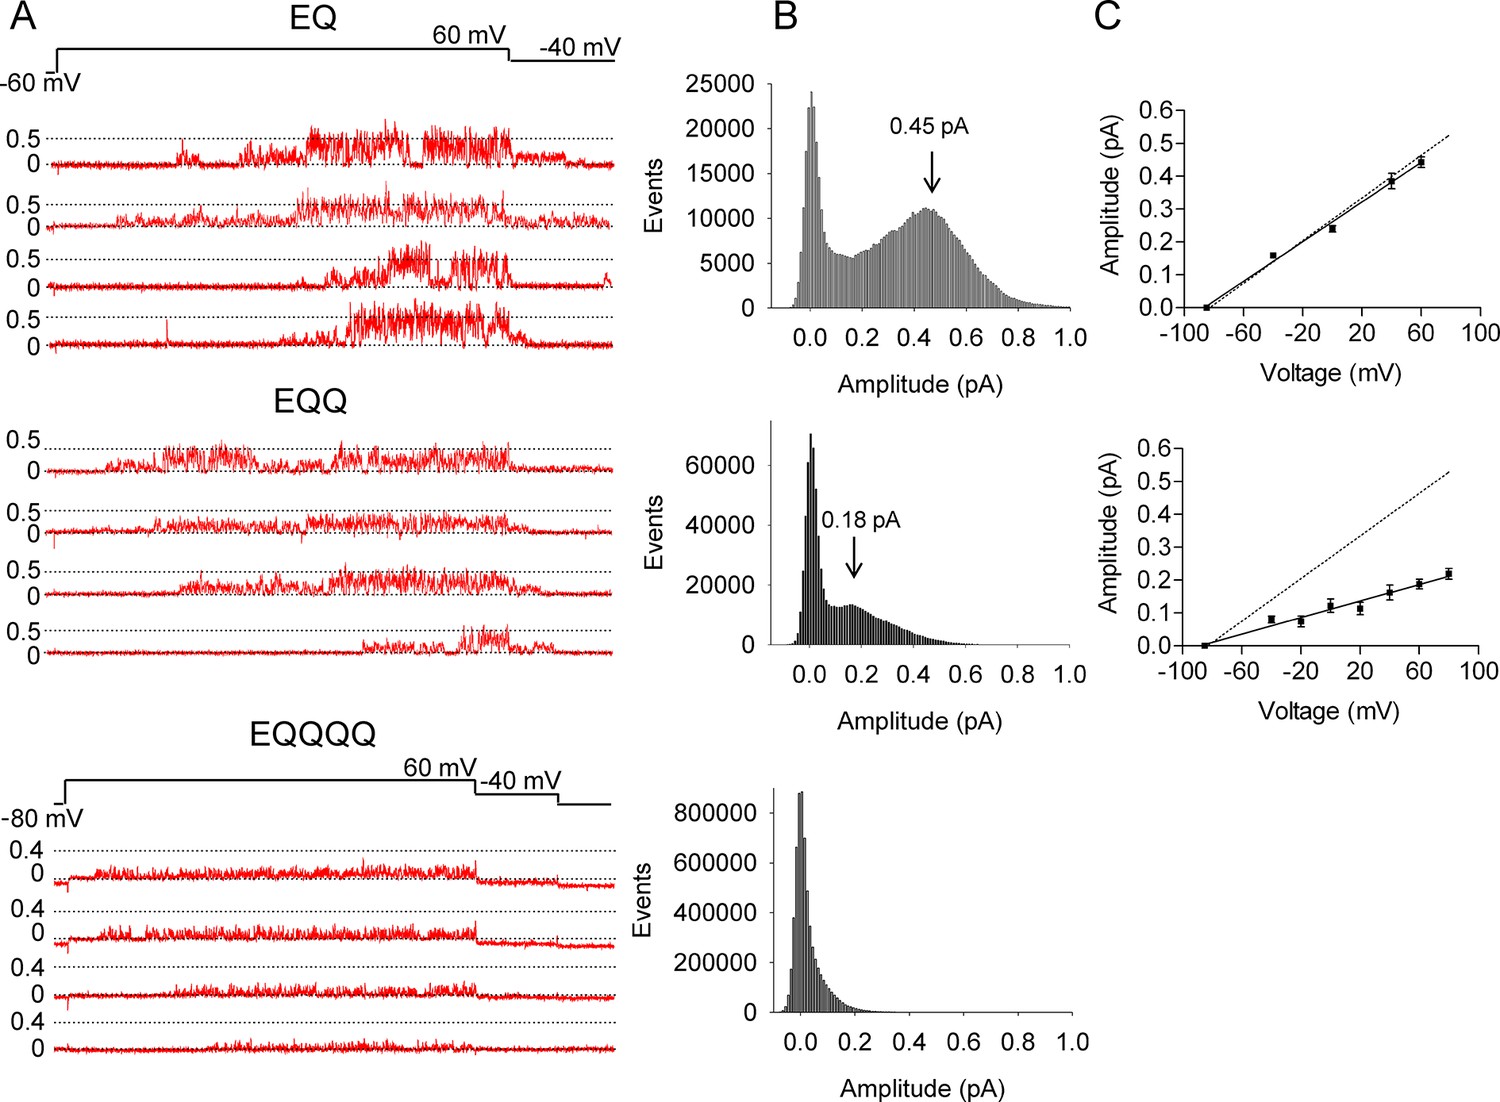
EQ, EQQ and EQQQQ show clear differences in single channel behavior.
Membrane patches containing a single IKs channel made up of EQ, EQQ, or EQQQQ were stepped from a holding potential of -60 mV (-80 mV for EQQQQ) to 60 mV for 4 s and then to -40 mV for 0.75 s as indicated in the protocol at top. (A) Representative traces of single channel recordings from cells expressing EQ (top), EQQ (middle) or EQQQQ (bottom). (B) All-points amplitude histograms of only the active single channel sweeps from a file of 100 sweeps, blank sweeps were removed to limit the 0 amplitude peak. All-points amplitude histograms containing all the blank sweeps are presented in Figure 2—figure supplement 1. For EQQQQ the histogram represents data from 3 cells. Arrows indicate the peak conductance as determined by Gaussian fits using Clampfit. (C) The peak open amplitudes for several voltages were plotted with an extrapolated K+ channel reversal potential to derive a slope conductance for each construct. The slope conductance for IKs made up of unlinked KCNE1 and KCNQ1, as previously published, (Werry et al., 2013) is indicated by a dashed line. Amplitudes for EQQQQ were too small to make analysis of conductance meaningful.
Figure 2—figure supplement 1
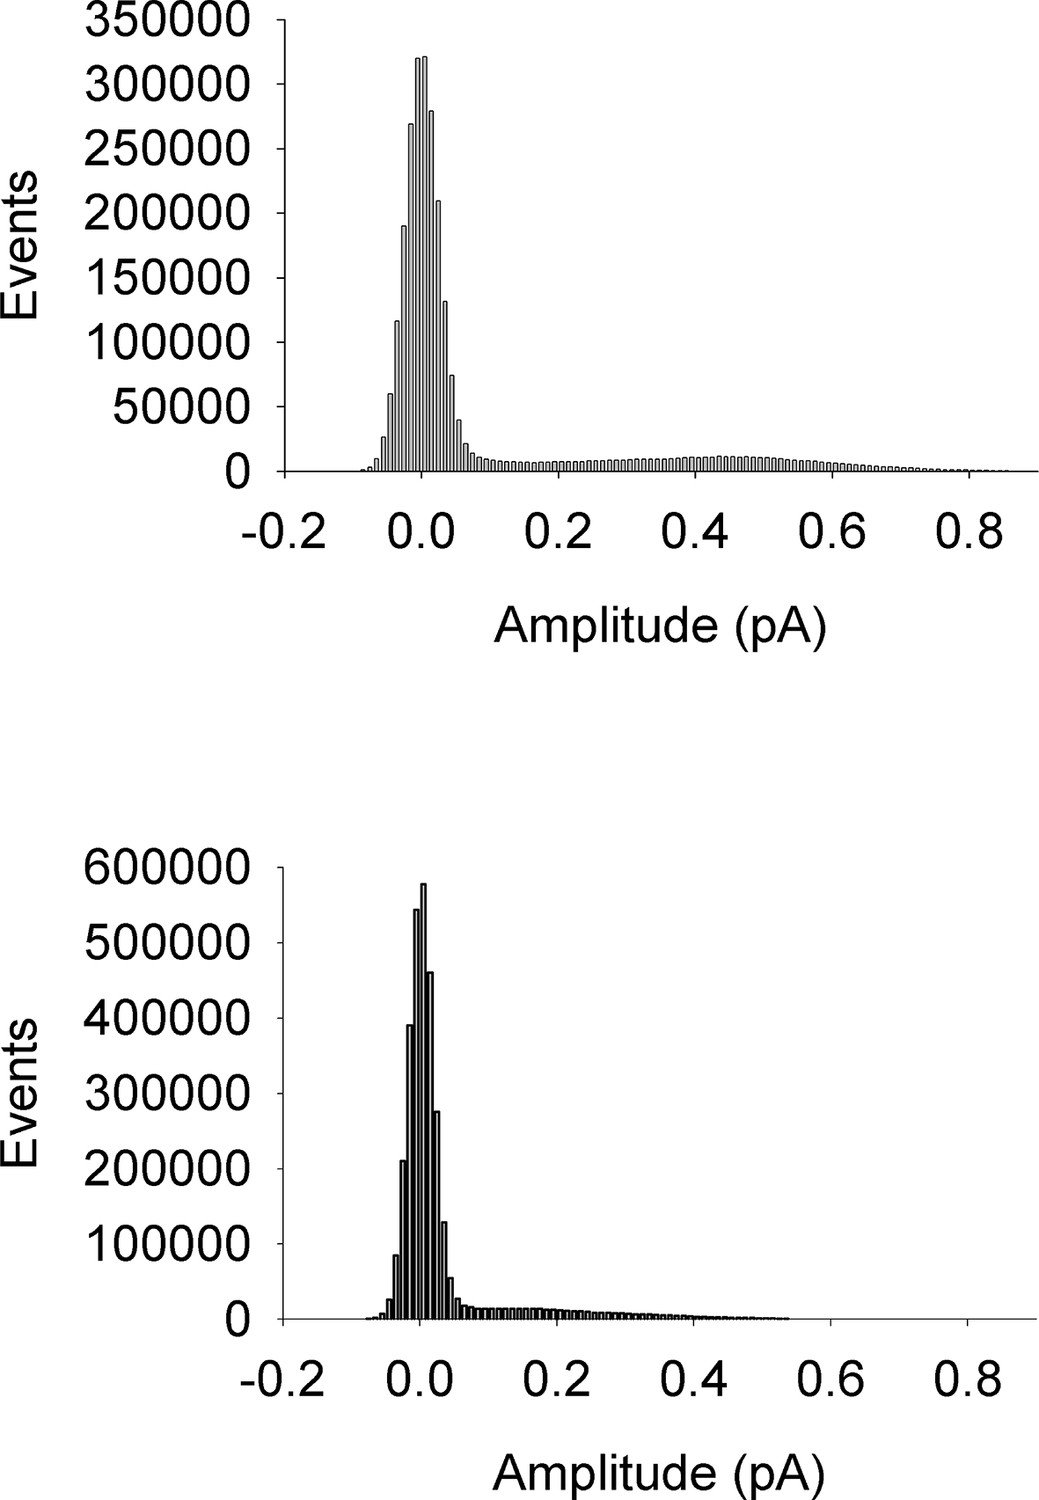
All-points amplitude histograms.
All-points amplitude histograms of single channel records during a 60 mV step, filtered at 200 Hz for EQ (upper) and EQQ (lower) including sweeps with no channel activity. These are the same single channel current records as shown in Figure 2B.
Figure 2—figure supplement 2
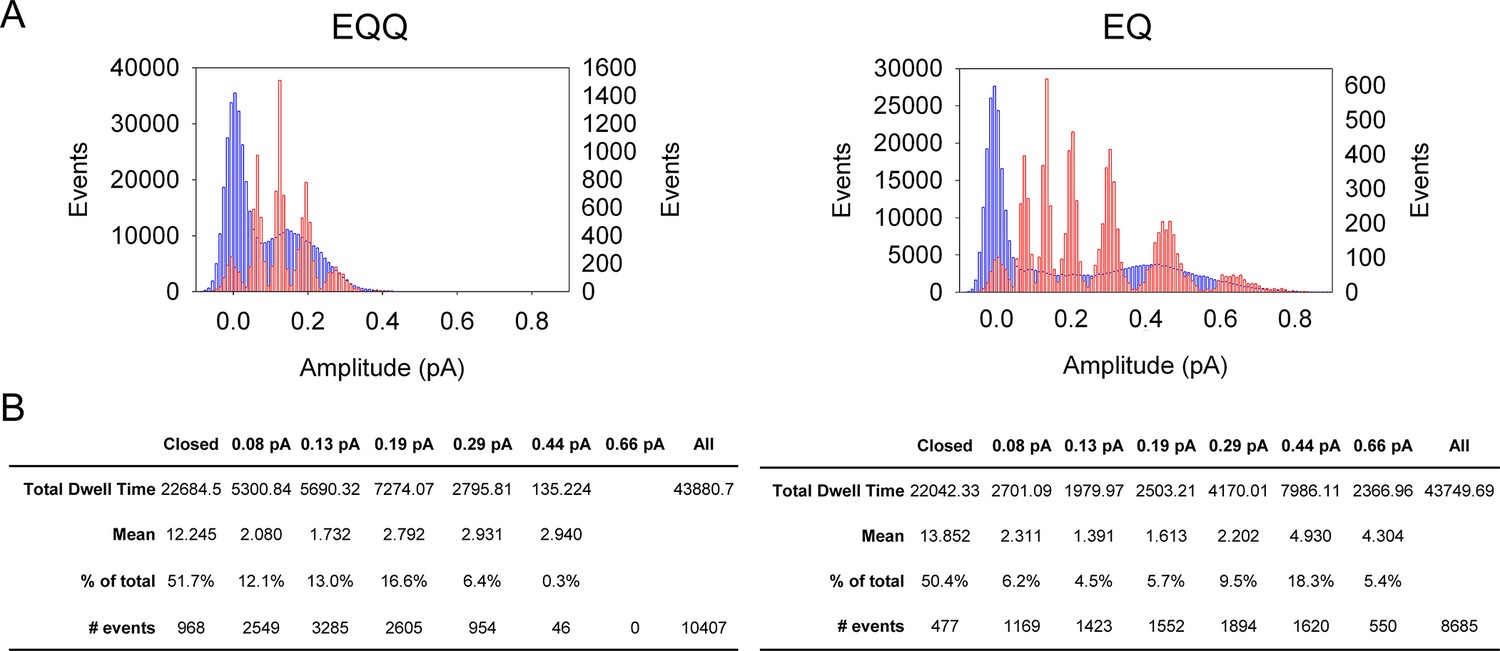
Subconductance analysis of EQQ and EQ demonstrates that as the number of KCNE1 subunits decreases so does higher conductance state occupancy.
(A) All-points amplitude histograms, filtered at 200 Hz, from 11 active sweeps of EQQ (left) and EQ (right) are plotted in blue with idealized histograms of the same data superimposed in red. The left axis represents number of events for the all-points amplitude histogram and right axis for the idealized histogram. Events were idealized using six separate thresholds (0.08, 0.13, 0.19, 0.29, 0.44 and 0.66 pA) as indicated in the tables below and are set based on our earlier work (Werry et al., 2013) and the 3/2 rule for subconductance behavior (Pollard et al., 1994). (B) Total and average dwell times (ms) in each sublevel were calculated as well as the percent dwell time and event numbers. The mean dwell time from the closed state does not include the first latency.
Figure 3
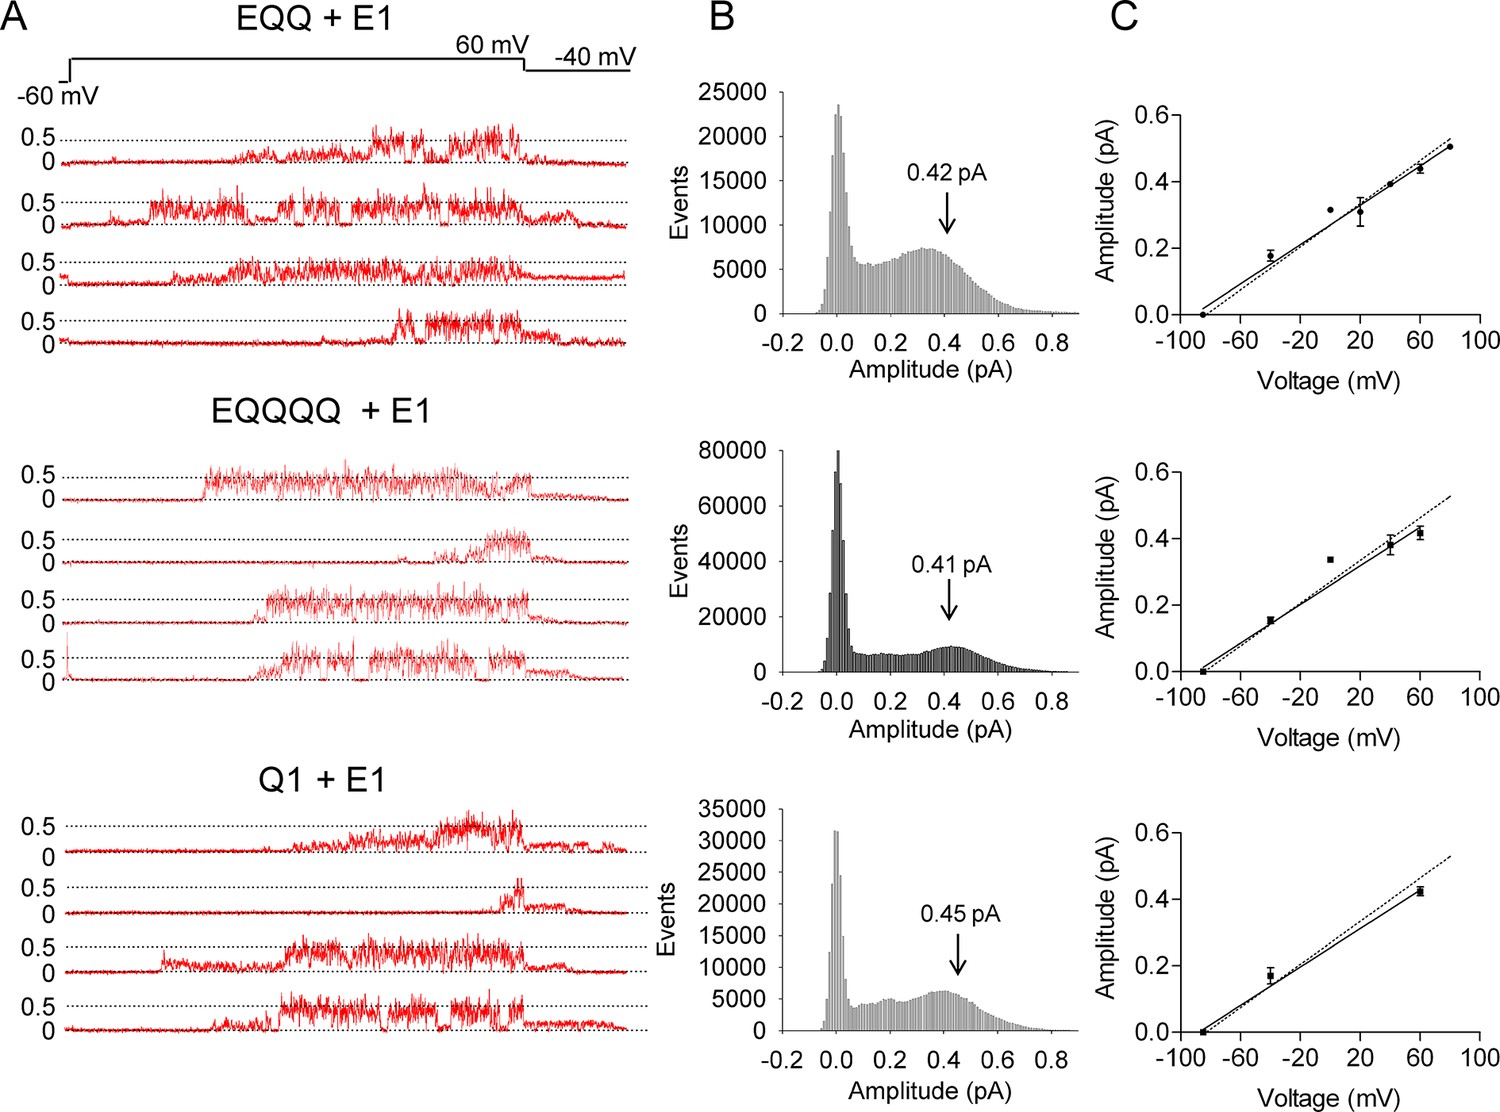
Co-expression of additional KCNE1 subunits restores wild type IKs single channel behavior to EQQ and EQQQQ.
(A) Representative traces of single channel recordings from cells expressing EQQ + KCNE1-GFP (top), EQQQQ + KCNE1-GFP (middle) or KCNQ1 + KCNE1-GFP (bottom). (B) All-points amplitude histograms of only the active single channel sweeps as described in Figure 2. Arrows indicate the peak conductance as determined by Gaussian fits using Clampfit. (C) The peak open amplitudes for several voltages were plotted as in Figure 2.
Figure 4 with 2 supplements
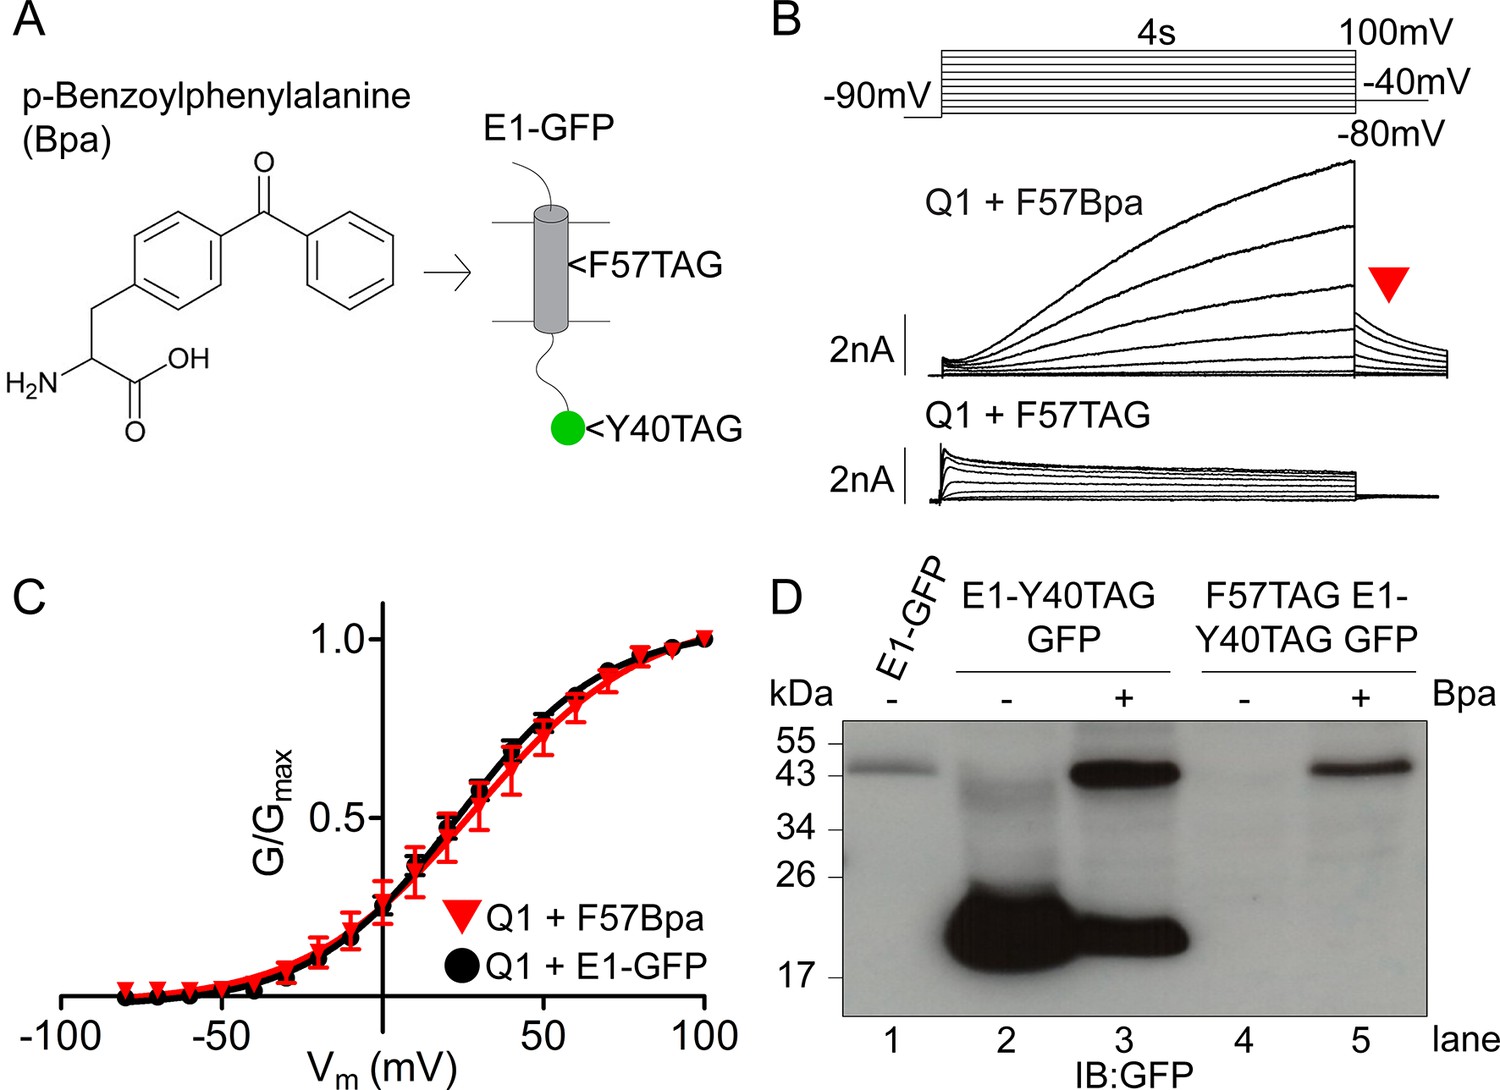
Expression and characterization of F57Bpa KCNE1 in IKs.
(A) Schematic showing the structure of the UV- activated crosslinking amino acid, Bpa, and the position of F57 within the transmembrane domain of KCNE1. Bpa was also incorporated at position 40 in the GFP sequence. (B) Currents were obtained using the isochronal activation protocol from F57TAG/M62W KCNE1-Y40TAG GFP constructs cultured in the presence (upper) or absence (lower) of 1 mM Bpa. Only odd numbered sweeps are presented for clarity. (C) G-V relations are shown from wild type (black circles) and F57Bpa KCNE1 IKs (red triangles) (n = 3–11). (D) Western blot depicting the expression of wild type KCNE1-GFP, KCNE1-Y40TAG GFP and F57TAG/M62W KCNE1- Y40TAG GFP constructs in the presence and absence of 1 mM Bpa.
-
Figure 4—source data 1
V1/2 of activation for IKs channel complexes using 31 aa (sub S) or 52 aa (sub L) linker
- https://doi.org/10.7554/eLife.11815.011
Figure 4—figure supplement 1
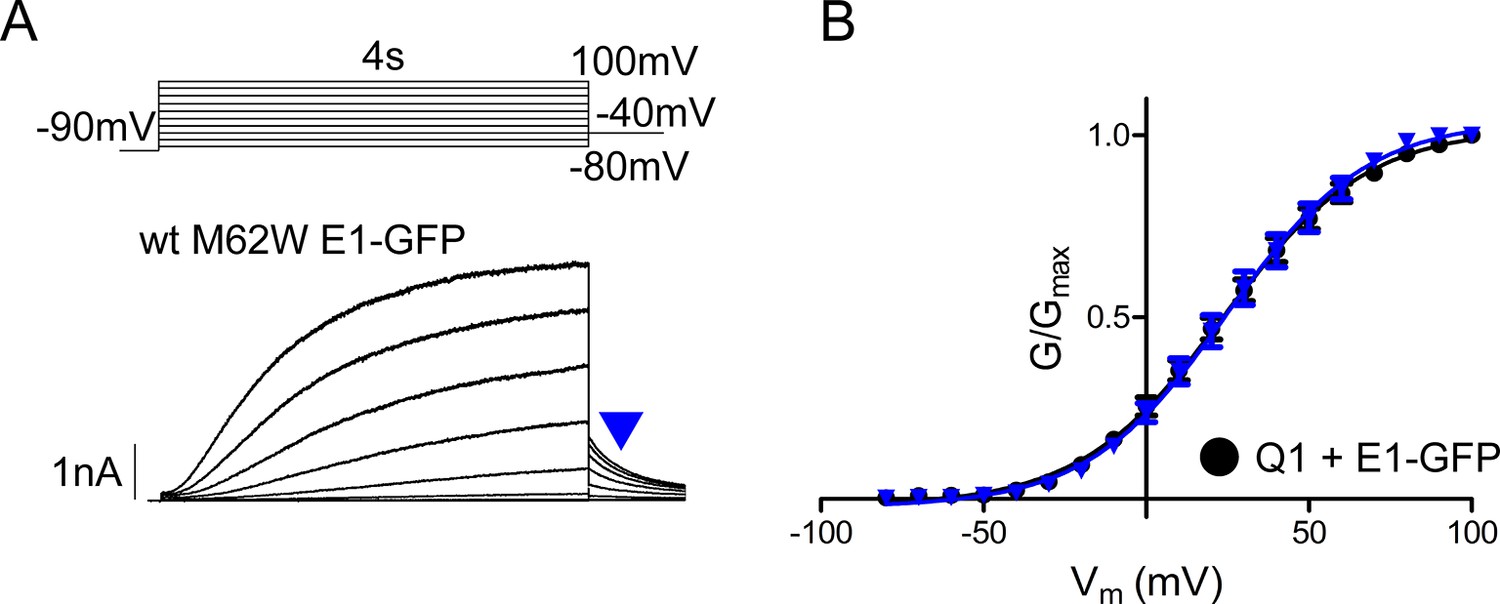
M62W KCNE1 does not alter IKs channel activation compared to wild type.
(A) Representative whole cell patch clamp recording is shown of M62W KCNE1 co-expressed with KCNQ1. Current-voltage relations were elicited using a 4 s isochronal activation protocol. Only odd numbered sweeps are presented for clarity. (B) Plot of the tail current G-V relations for KCNQ1 + M62W (blue triangle) or wild type (black circle) KCNE1 (n = 9–10).
Figure 4—figure supplement 2

F57Bpa KCNE1 does not alter channel gating of KCNQ1, EQQ and EQ compared to wild type KCNE1.
(A) Channel diagrams indicate the configuration and proposed stoichiometry of the channels. Representative currents are shown of KCNQ1 (black circle), EQQQQL (green diamond), EQQS (blue square) and EQS (orange triangle) (sub-S or –L denotes the 31 aa or 52 aa linker between KCNE1 and KCNQ1 in the fusion proteins) alone (B; open), co-expressed with KCNE1- GFP (C; filled) or F57Bpa KCNE1-GFP (D; light filled). (E) Currents were elicited using a 4s isochronal activation protocol. Only odd numbered sweeps are shown for clarity. (F) Tail current G-V plots are shown comparing the response to increasing number of β-subunits either by fusion (top) or by co-expression of KCNE1/F57Bpa KCNE1 (middle and bottom). (G) G-V plots comparing each channel complex with and without co-expression of KCNE1/F57Bpa KCNE1. (H) Summary of each channel’s V1/2 of activation with and without KCNE1 (n = 3–16). See Figure 4—source data 1.
Figure 5 with 2 supplements
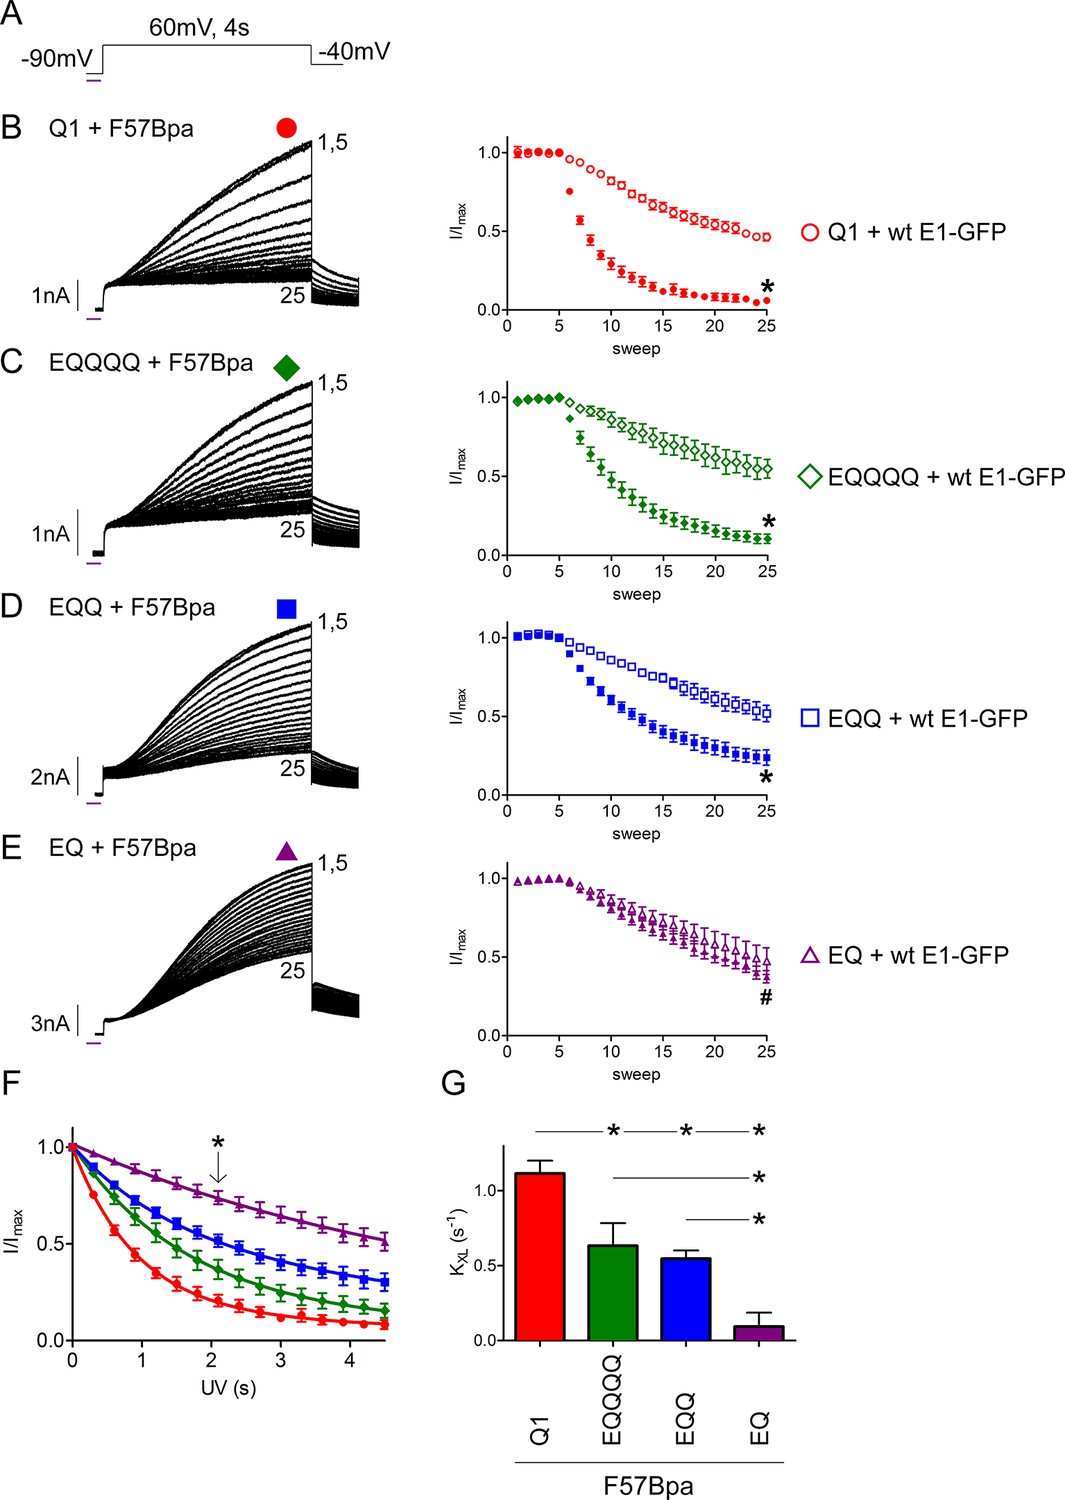
The IKs channel complex does not have a restricted β-subunit stoichiometry.
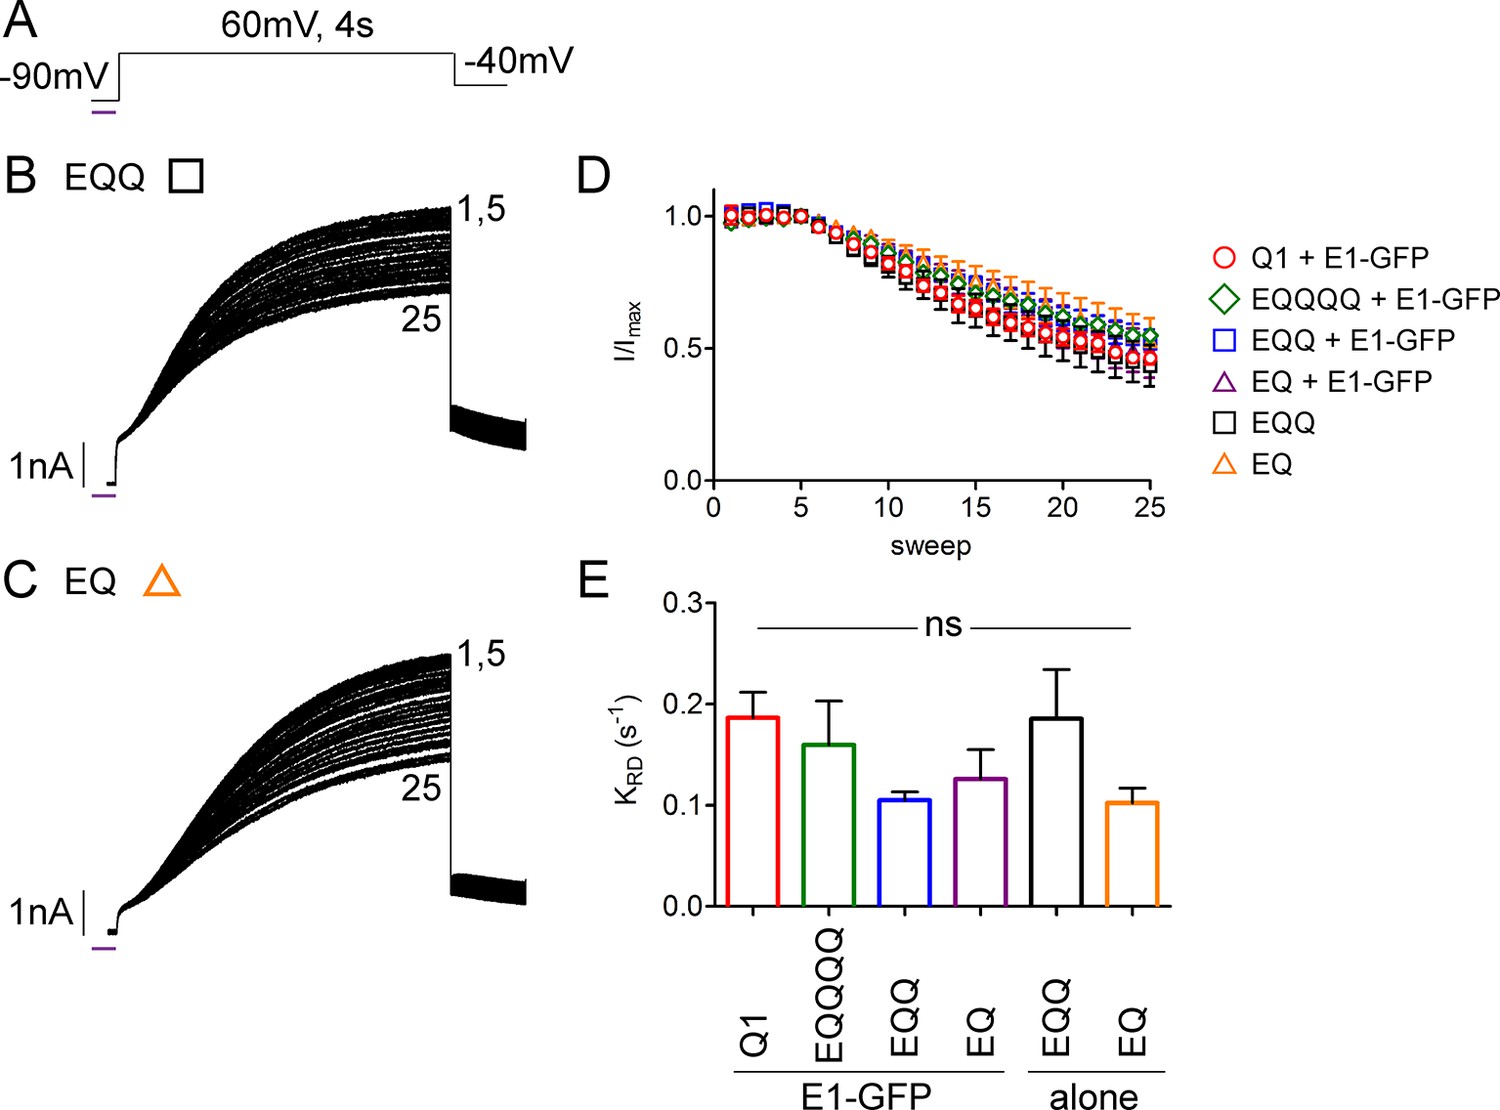
(A) Schematic of the UV-voltage protocol. A flash of UV light (purple line) is applied once per sweep for 300 ms at -90 mV before a 4s activation step to +60 mV. Representative currents are shown for KCNQ1 (B), EQQQQ (C), EQQ (D) and EQ (E) co-expressed with F57Bpa KCNE1 (left). For all recordings, UV was applied at sweep 6 after a stable baseline had been established. Sweeps 1 and 5–25 are presented. Diary plots (right) of the UV treated normalized peak currents for each channel construct co-expressed with F57Bpa KCNE1 (filled symbols) or wild type KCNE1 (open symbols) (n = 3–7; *p<0.01; #p>0.05). (F) Plots of the normalized peak current vs. cumulative UV exposure for KCNQ1 + F57Bpa KCNE1 (red circle), EQQQQ + F57Bpa KCNE1 (green diamond), EQQ + F57Bpa KCNE1 (blue square) and EQ + F57Bpa KCNE1 (purple triangle). *p<0.05 comparing normalized peak currents after 2.1 s of UV exposure (n = 5–7). (G) Summary of the crosslinking rates obtained from each cell (See Figure 5—source data 1) (n = 5–7; *p<0.05).
-
Figure 5—source data 1
Crosslinking rate constants for IKs channel complexes.
- https://doi.org/10.7554/eLife.11815.015
-
Figure 5—source data 2
Rate constants for IKs channel complex rundown.
- https://doi.org/10.7554/eLife.11815.016
Figure 5—figure supplement 1
UV-rundown is consistent across all the IKs channel configurations.
(A) Schematic of the UV-voltage protocol. Representative currents depicting UV-rundown are shown for EQQ (B) and EQ (C). (D) Combined diary plot of UV-treated normalized peak currents for EQQ (green square), EQ (orange triangle), as well as the data presented in Figure 5; KCNQ1 (red circle), EQQQQ (green diamond) EQQ (blue square) and EQ (purple triangle) all co-expressed with wild type KCNE1. (E) Summary of the rundown rates obtained from each cell (See Figure 5—source data 2) (n = 3–5).
Figure 5—figure supplement 2
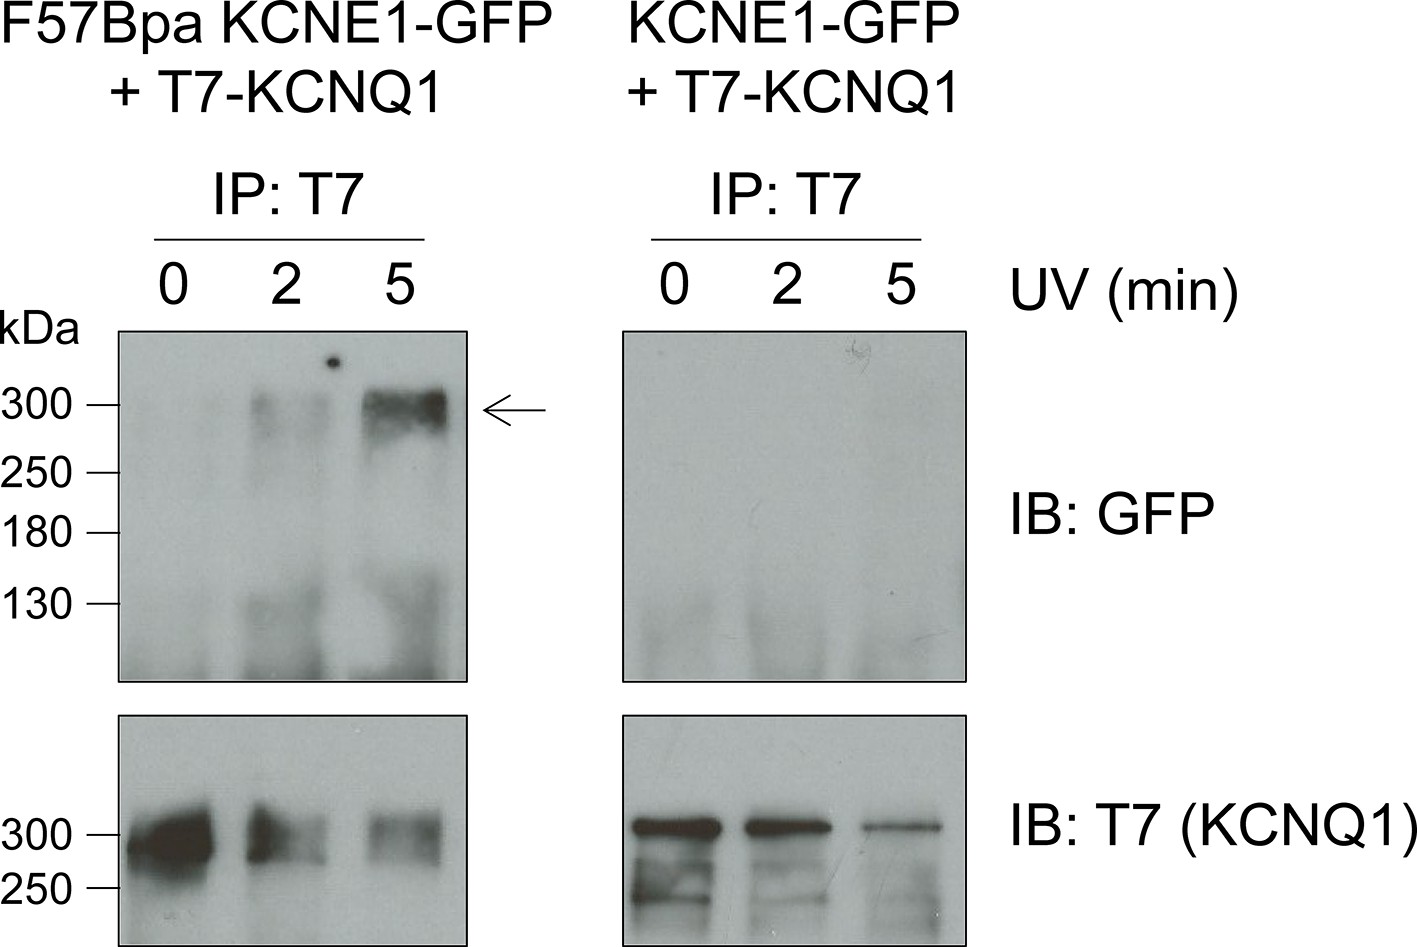
F57Bpa KCNE1 covalently crosslinks with KCNQ1.
Western blot of the immunoprecipitation of KCNQ1 co-expressed with F57Bpa KCNE1-GFP (left) or wild type KCNE1-GFP (right) after 0, 2 or 5 min of UV-irradiation. Western blots of the immunoprecipitation elution fractions were probed for GFP (upper) or T7-KCNQ1 (lower) (n = 2). Arrow indicates the crosslinked KCNE1-KCNQ1 complex.
Figure 6
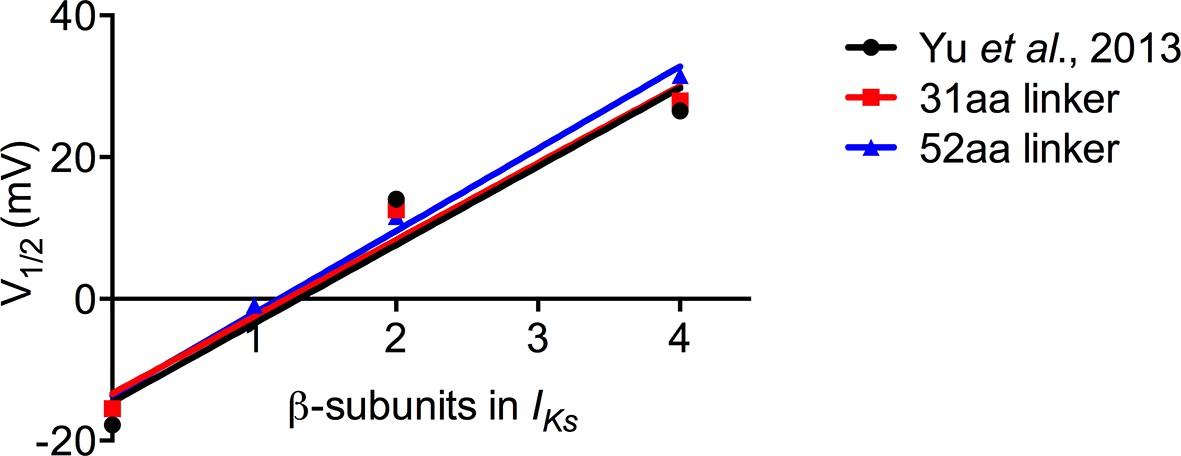
Increasing KCNE1 has linear effect on depolarizing shift in the V1/2 of activation.
Plot of the mean tail current G-V relations comparing KCNQ1 alone (0:4), EQQQQ (1:4), EQQ (2:4) and EQ (4:4) for fusion proteins with 31 amino acid and 52 amino acid linker as well as mean data obtained from Yu et al. (2013). R2 values: Yu et al, 0.94; 31aa, 0.97; 52aa, 0.99.
Author response image 1
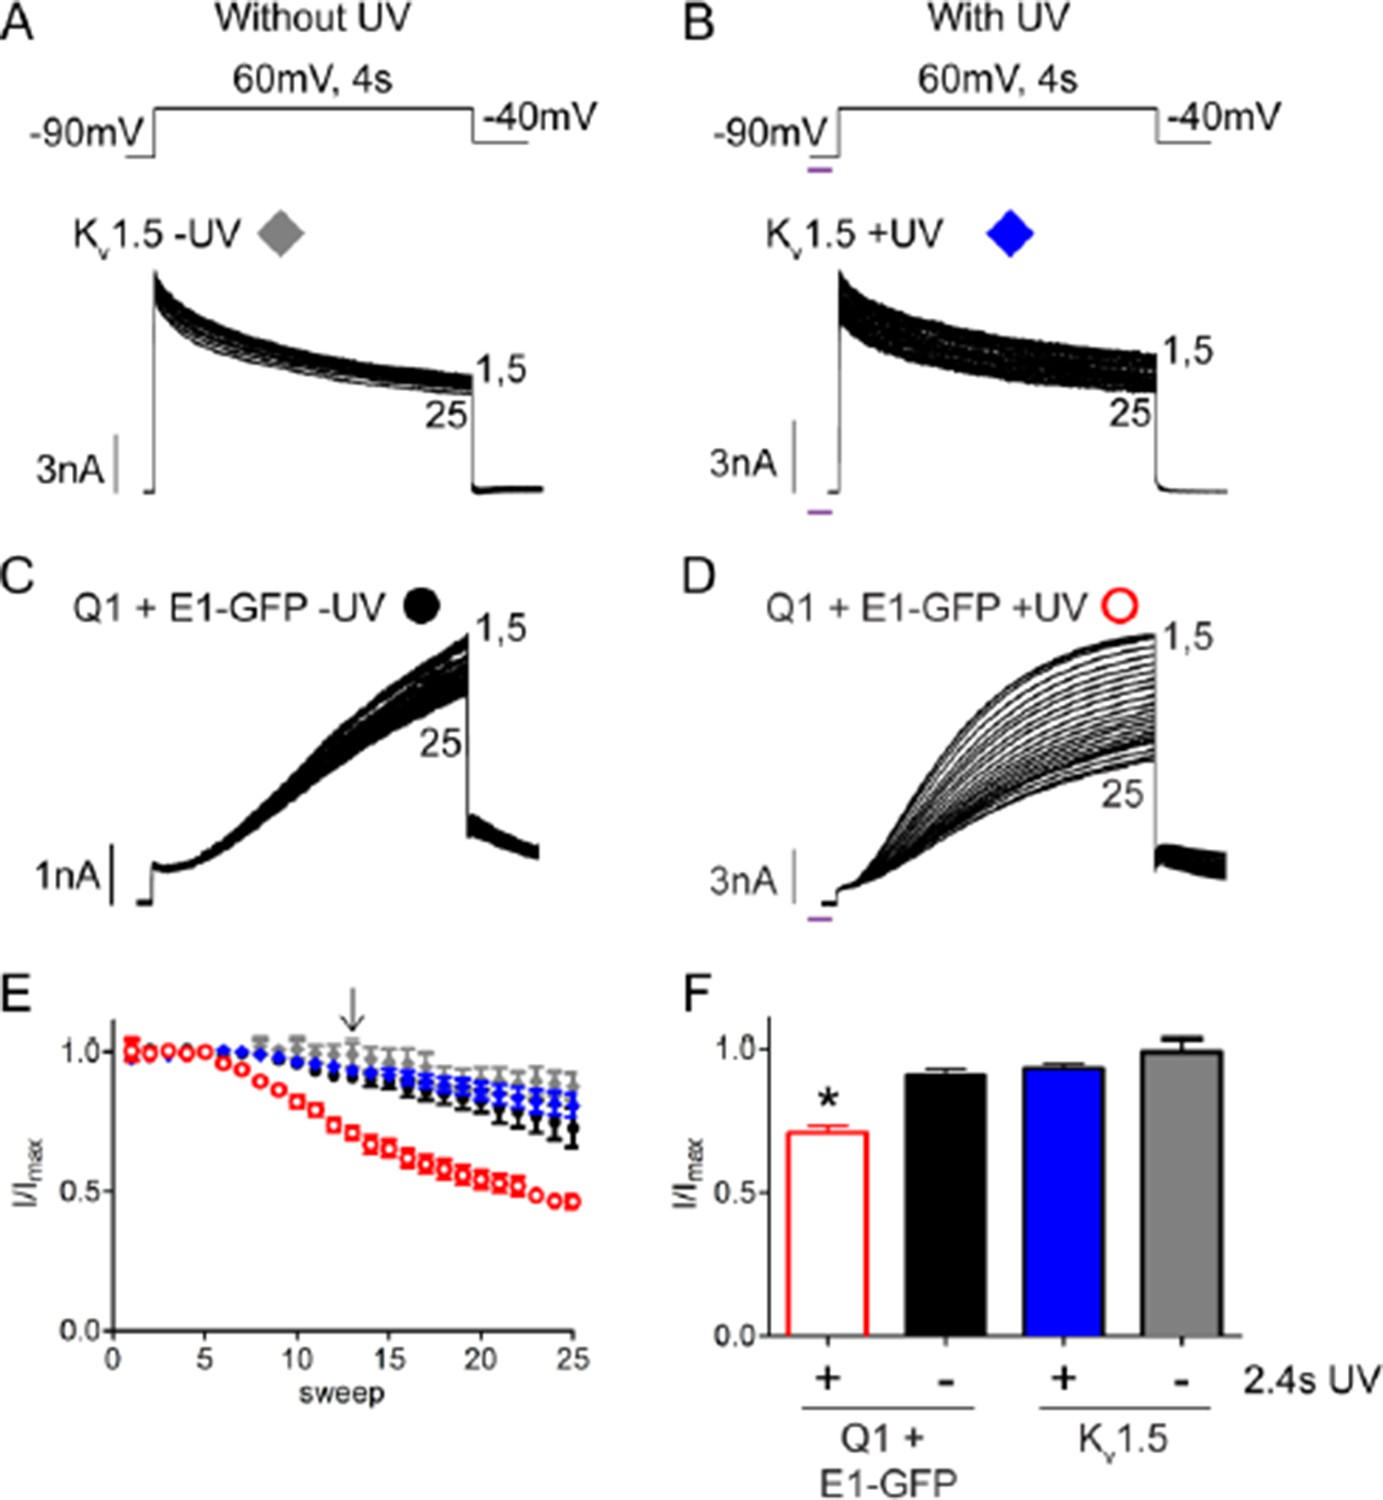
UV-rundown is not present in Kv1.5 channels.
Schematic of the voltage protocols in the absence (A) and presence (B) of UV application. Below are representative Kv1.5 currents showing rundown response with and without UV exposure. Current trace for KCNQ1 + wt KCNE1 showing rundown in the absence (C) and presence (D) of UV. (E) Combined diary plot is shown of normalized peak currents for Kv1.5 – UV (grey diamonds), +UV (blue diamonds), and KCNQ1 + wt KCNE1 – UV (black circles), +UV (red circles; data from Figure 5). (F) Comparison of normalized peak currents after 2.4 s of cumulative UV exposure (indicated by arrow in panel D) (n = 3-5; * = p<0.001).
Tables
Table 1
Summary of single channel parameters.
| Construct | First latency (s) | n (cells) | # Active sweeps | Conductance (pS) | n (cells) |
|---|---|---|---|---|---|
| KCNQ1 + KCNE1 | 1.50 ± 0.12 | 3 | 71 | 2.9 ± 0.12 | 2 |
| EQQQQ | 0.81 ± 0.07 | 3 | 124 | n.d. | |
| EQQ | 0.94 ± 0.07 | 3 | 128 | 1.3 ± 0.01 | 3-6 |
| EQ | 1.48 ± 0.18 | 3 | 36 | 3.0 ± 0.11 | 2-4 |
| EQQ + KCNE1 | 1.43 ± 0.08 | 4 | 178 | 3.0 ± 0.18 | 2-5 |
| EQQQQ + KCNE1 | 1.44 ± 0.14 | 3 | 52 | 2.9 ± 0.15 | 1-4 |
-
P values for first latency: EQQ vs. E1+Q1, EQ, EQQQQ+E1 and EQQ+E1 p<0.05; EQQQQ vs. E1+Q1, EQ, EQQQQ+E1 and EQQ+E1 p<0.05. P values for conductance: EQQ vs. Q1+E1, EQQQQ+E1, EQ and EQQ+E1 p<0.001. Not determined (n.d.).
Download links
A two-part list of links to download the article, or parts of the article, in various formats.
Downloads (link to download the article as PDF)
Open citations (links to open the citations from this article in various online reference manager services)
Cite this article (links to download the citations from this article in formats compatible with various reference manager tools)
Unnatural amino acid photo-crosslinking of the IKs channel complex demonstrates a KCNE1:KCNQ1 stoichiometry of up to 4:4
eLife 5:e11815.
https://doi.org/10.7554/eLife.11815


