Time-resolved multimodal analysis of Src Homology 2 (SH2) domain binding in signaling by receptor tyrosine kinases
- University of Connecticut School of Medicine, United States
- Massachusetts Institute of Technology, United States
Figures
Figure 1
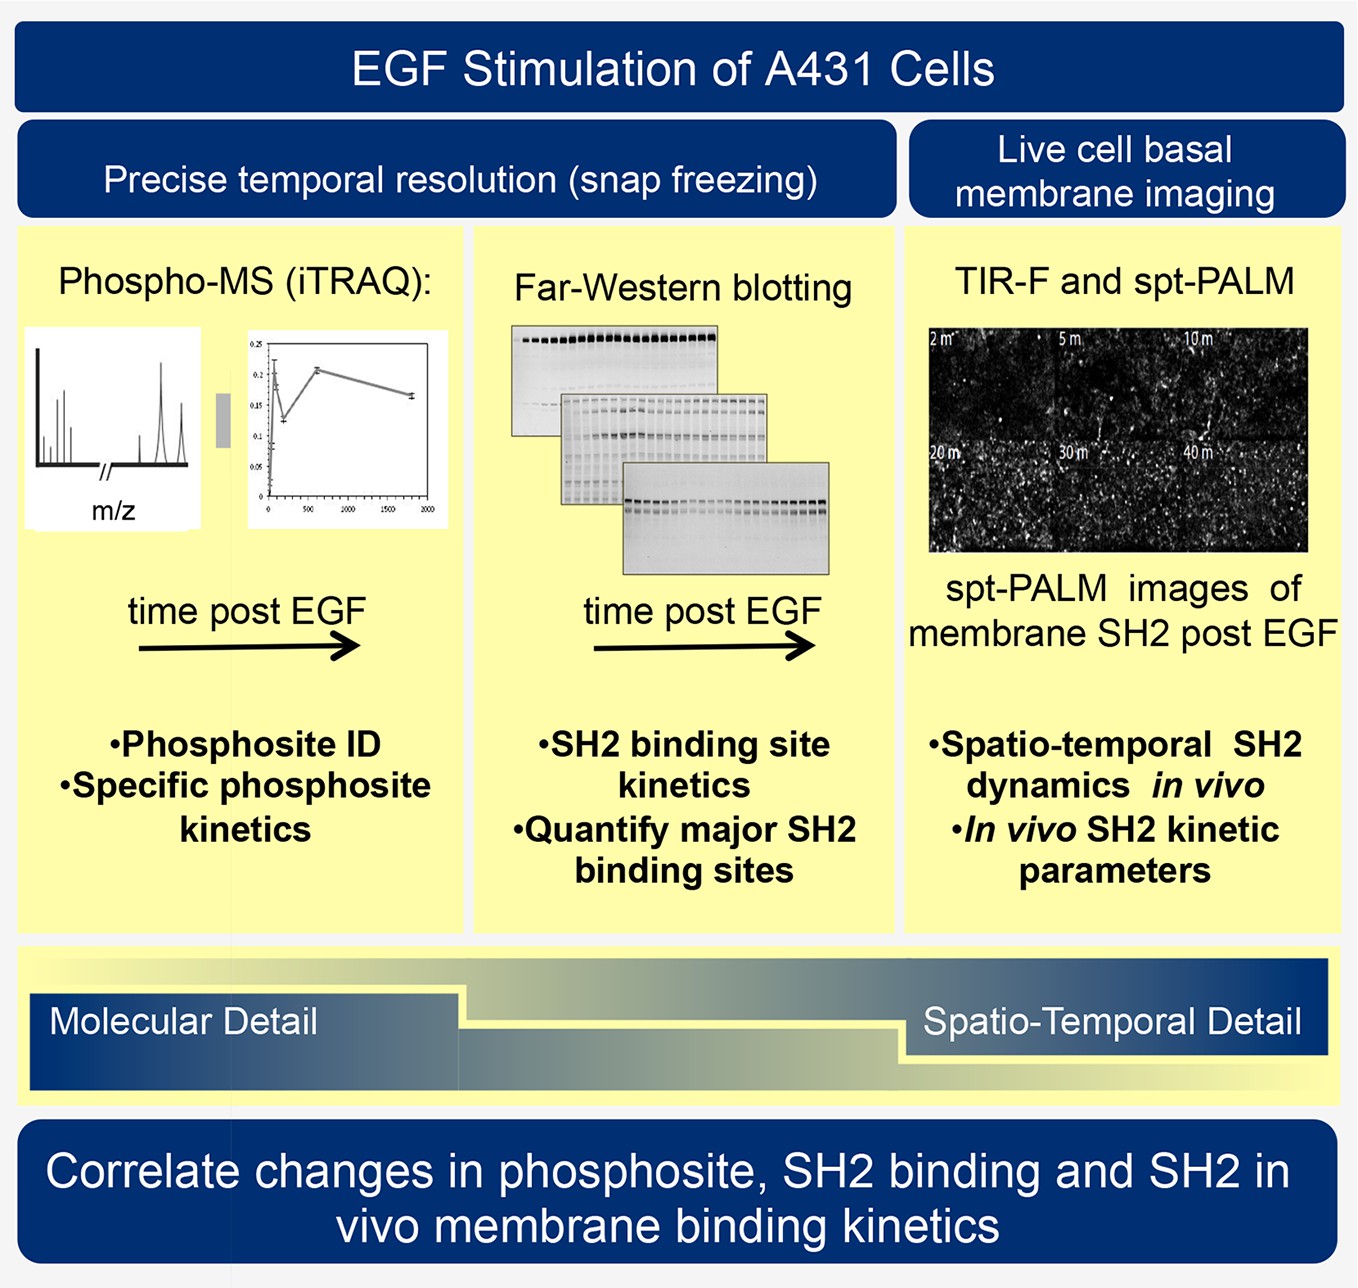
Experimental outline.
Human A431 cells were stimulated with EGF and dynamic responses analyzed using three complementary methods. Samples snap-frozen at different time-points after EGF treatment were analyzed by mass spectrometry (MS) to detect relative changes over time in abundance of specific tyrosine-phosphorylated peptides. Parallel samples were analyzed by far-western blotting with a panel of SH2 domain probes to visualize changes over time in binding sites for each SH2 domain. Finally, living cells expressing fluorescent SH2 domains were imaged to quantify membrane binding dynamics for each SH2 domain.
Figure 2 with 3 supplements
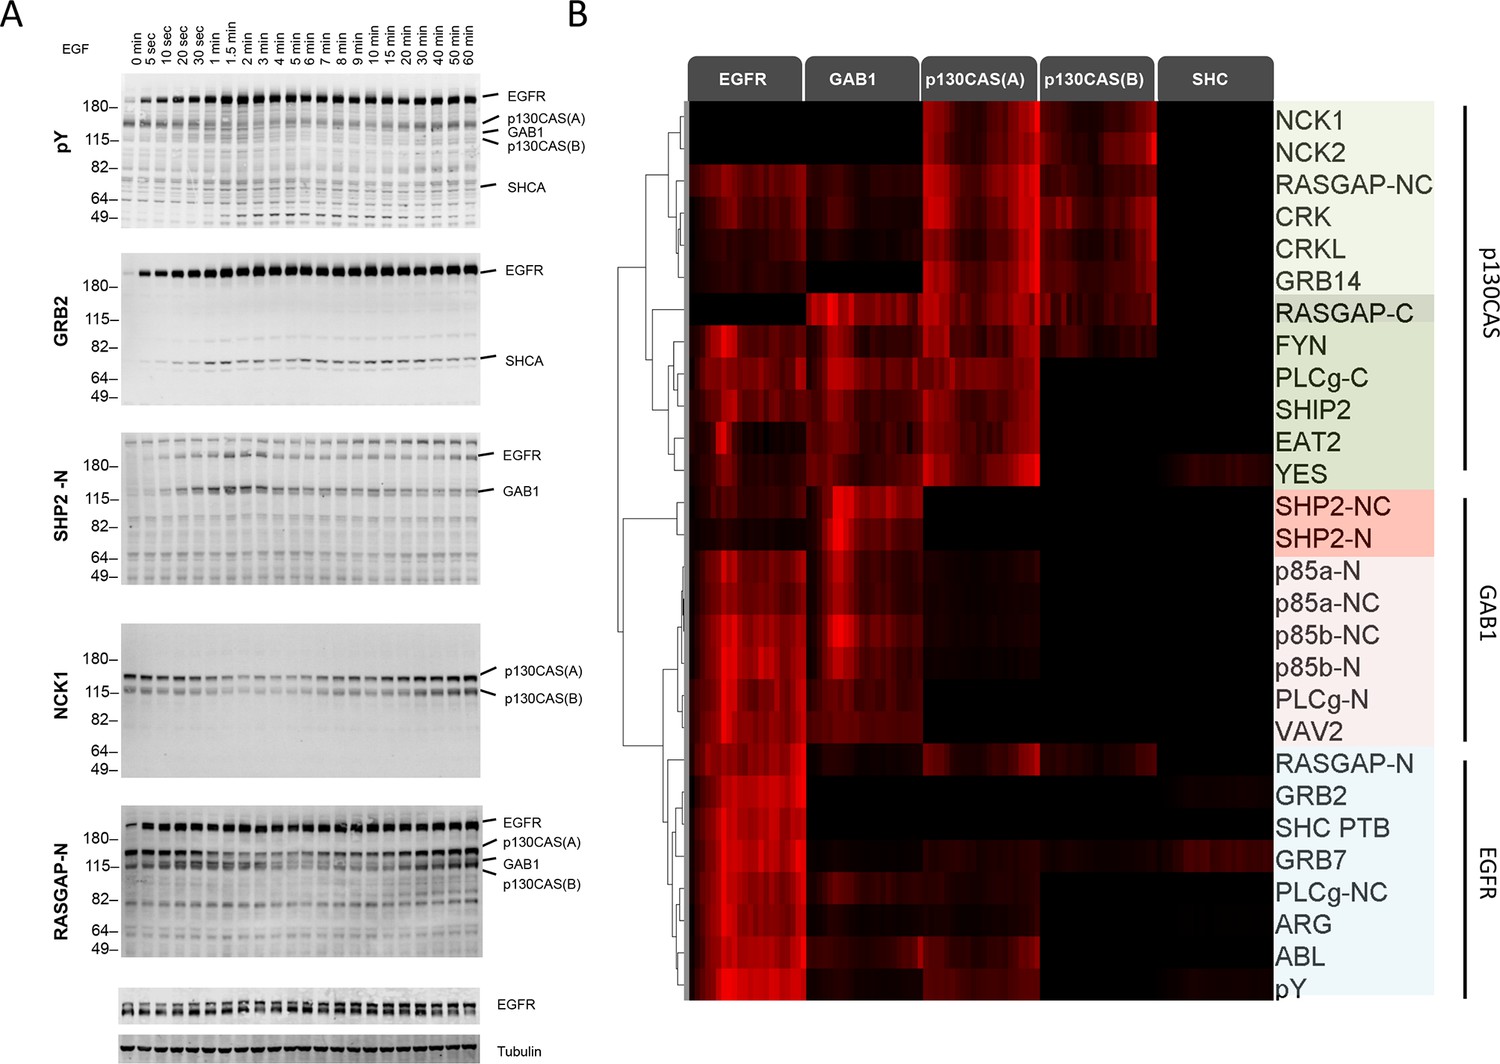
Dynamic EGF-dependent changes in tyrosine phosphorylation patterns revealed by SH2 domain far-Western analysis.
(A) Representative anti-pY Western (upper panel) and far-Western blots (next four panels) of 60-min EGF stimulation time-course. Far-Westerns using GRB2, SHP2-N, NCK1 and RASGAP-N are shown to illustrate major binding patterns identified (see B). Additional SH2 blot data are provided in Figure 2—figure supplement 1. Immunoblotting with antibodies to EGFR and tubulin was used to confirm equal loading. (B) Hierarchical clustering of SH2 domains on the basis of binding to four major phosphoproteins (EGFR, GAB1, p130CAS, and SHCA). Signal was normalized to maximum band intensity across all time points and all bands for each probe replicate. Then data for each phosphoprotein was averaged in a probe specific manner (red represents greater percentage of total signal, max = 1, min = 0). Names of SH2/PTB domain probes are indicated on the right. Colored boxes represent SH2 clusters defined by un-centered correlation coefficient >0.85.
Figure 2—figure supplement 1

Representative far-western blots using 1 PTB and 26 SH2 domain probes for EGF-stimulated A431 cells.
Protein names are labeled on the left and stimulation times are on top. For probe names, '-N, -C, or -NC' indicates the use of N-terminal, C-terminal, or natural tandem SH2 domain probes. See Supplementary file 1 for construct information.
Figure 2—figure supplement 2
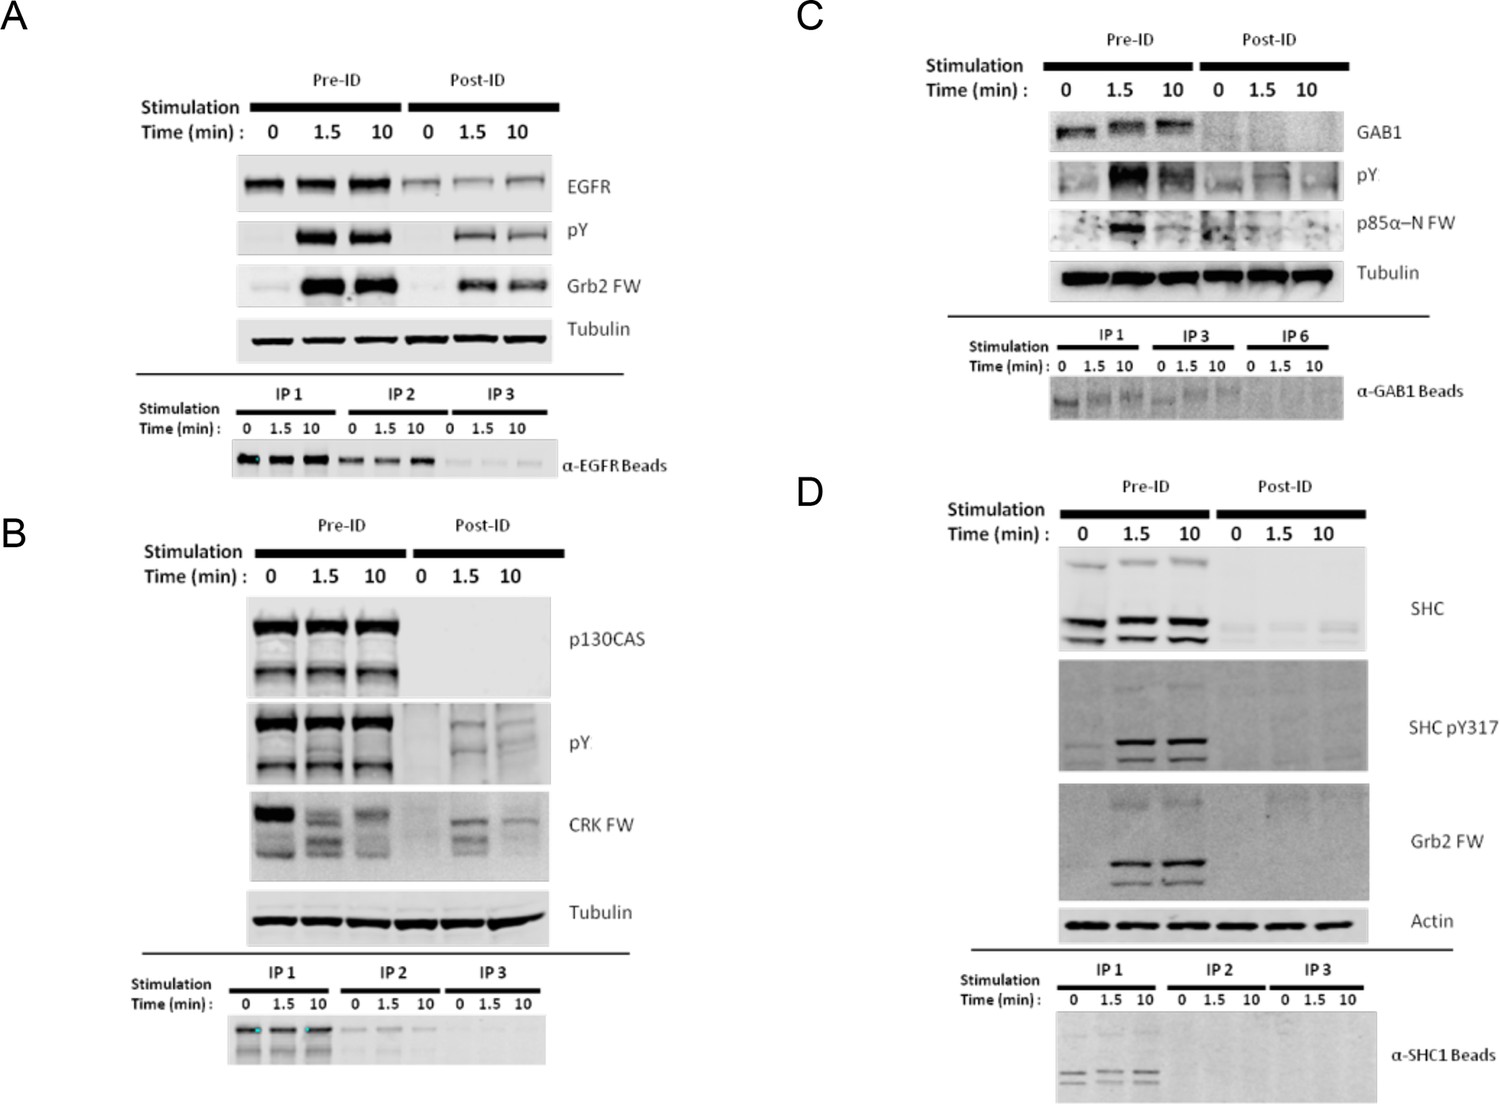
Identification of major SH2 domain binding bands by immunodepletion.
(A) EGFR, (B) p130CAS, (C) GAB1, and
Figure 2—figure supplement 3
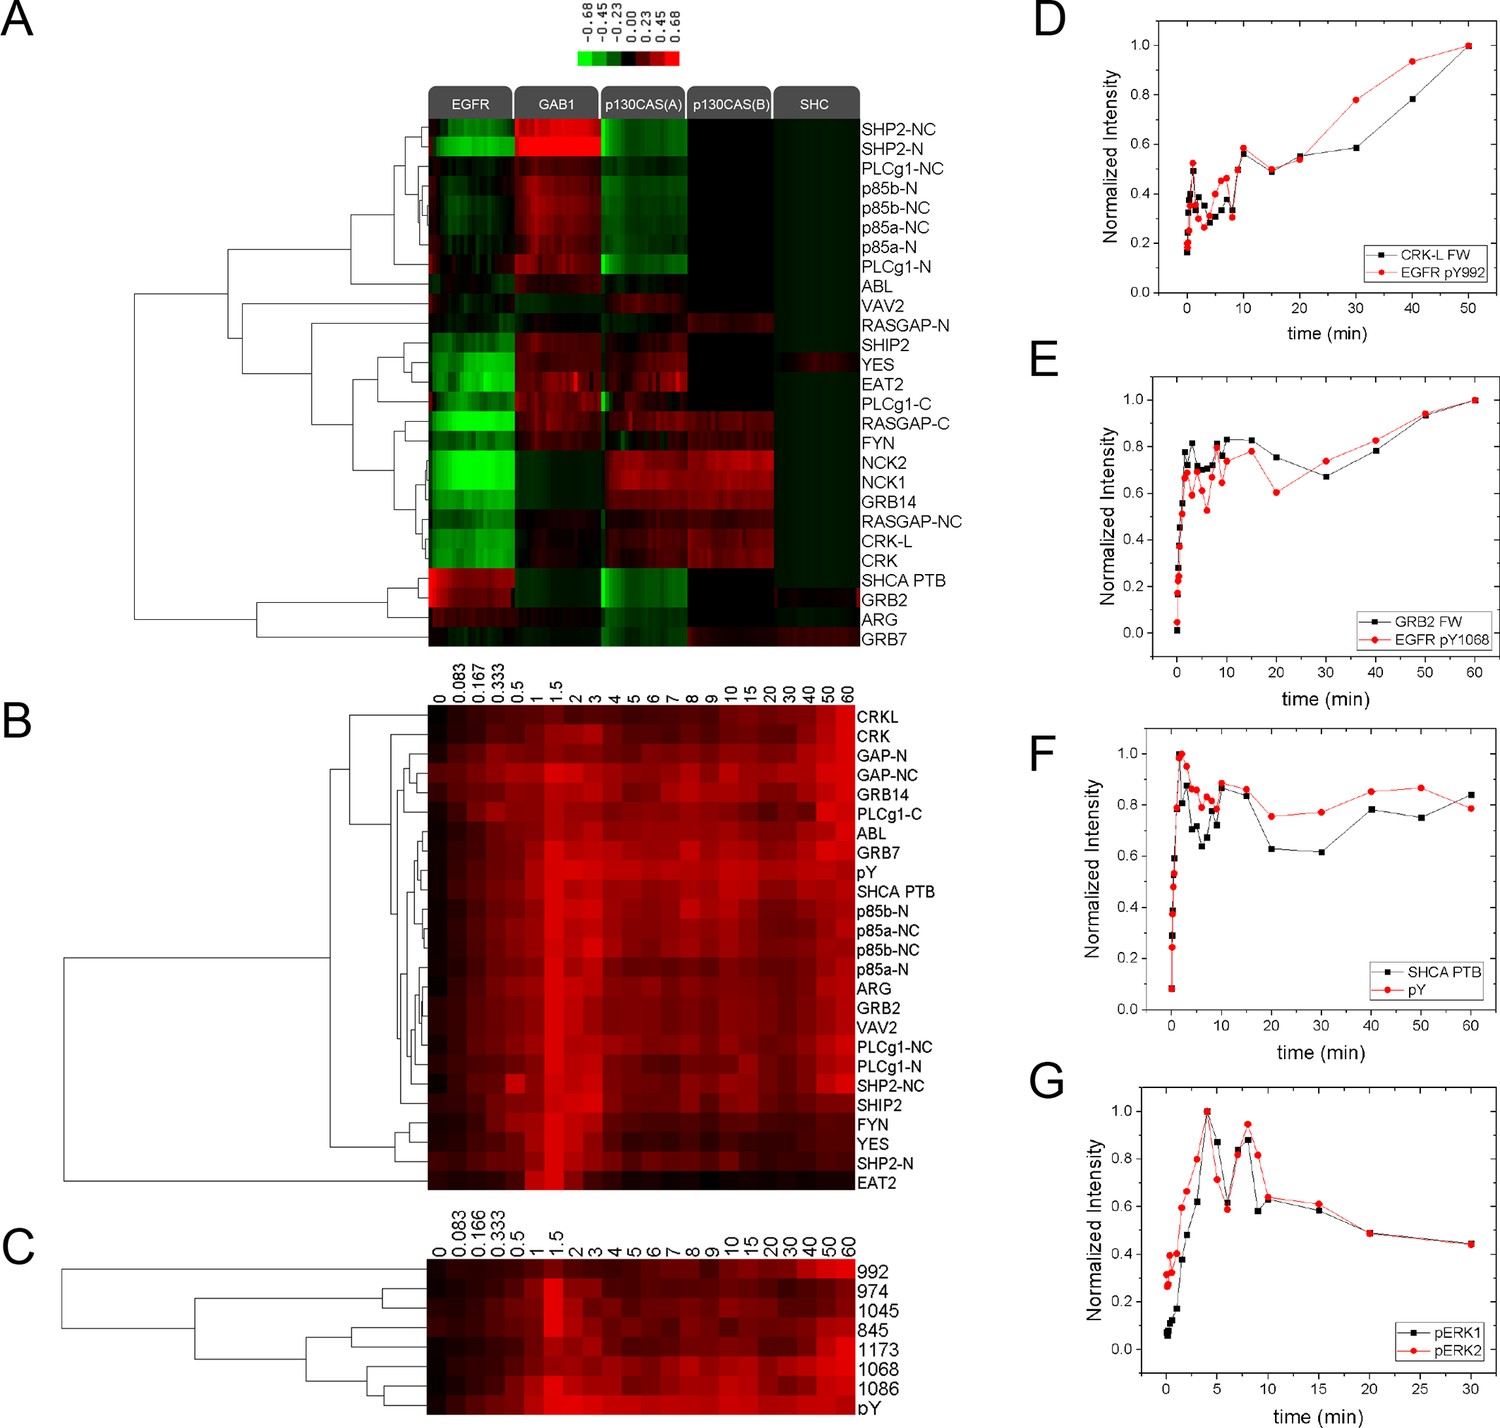
Relative SH2 binding specificity and pY EGFR-SH2 interaction kinetics.
(A) Hierarchical clustering of relative SH2 specificity. Values were obtained by subtracting percent bound by pY from percent bound by each SH2 for each time point. Red represents binding greater than pY and green represents binding less than pY. Relative SH2 specificity value = %Band intensitySH2 at time x - %Band intensityanti-pY at time x. (B) Hierarchical clustering of SH2 binding to EGFR band (normalized to maximum, max=1, min=0) for 60-min time-course. (C) Hierarchical clustering of EGFR phosphosite-specific Western blotting quantifications (normalized to maximum, max=1, min=0) for 60-min time-course. (D) and (E) Plots comparing the EGFR phosphosite kinetics and SH2 binding kinetics for SH2 domains and their canonical binding motifs (D, CRKL and pY992, R2=0.81; E, GRB2 and pY1168, R2=0.91). (F) Plot comparing total EGFR phosphorylation (pY EGFR band) with SHCA PTB binding (R2=0.89). R-squared values were calculated by plotting normalized pY Western intensity against normalized SH2 binding FW intensity. pY EGFR quantifications consist of data from a single experiment.(G) pERK1 and pERK2 pY/pT activation site phosphorylation kinetics following stimulation with EGF. Lines represent average of two technical replicates.
Figure 3 with 1 supplement
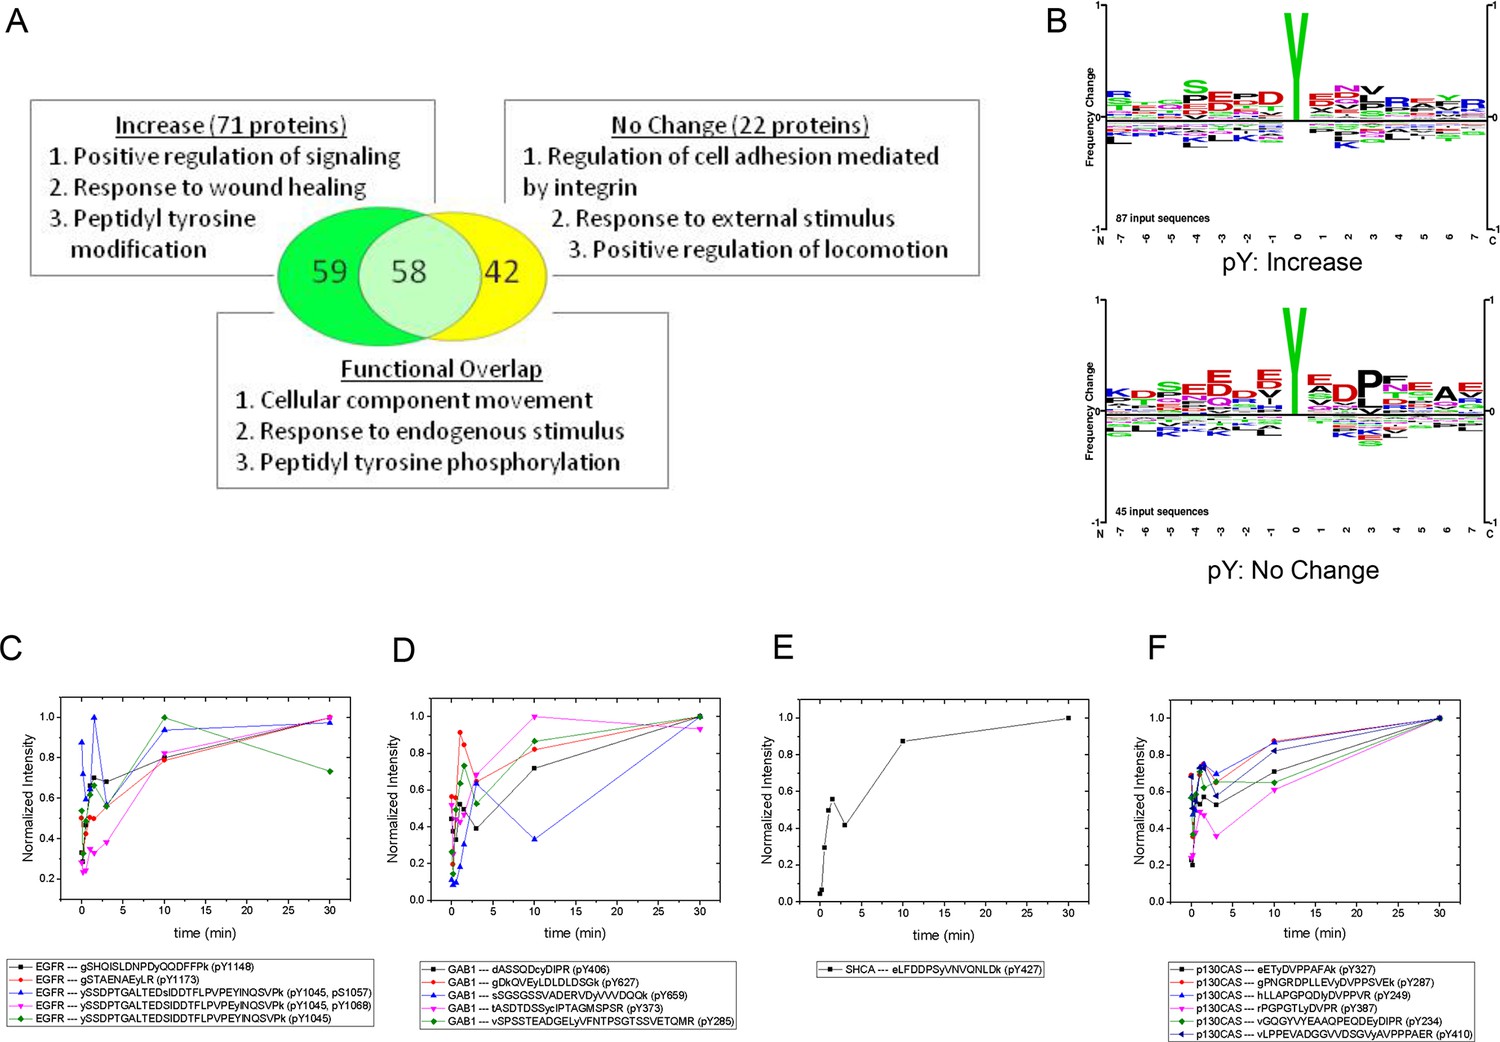
MS analysis of tyrosine-phosphorylated peptides in EGF-treated cells.
(A) Venn diagram showing overlap of significant gene ontologies for proteins containing peptides whose phosphorylation was enhanced or unchanged by EGF (p<0.05, Bonferroni corrected). The number of unique or overlapping ontologies observed for each protein set is indicated within the diagram. GO terms listed represent the three largest GO parent terms returned by REVIGO (Supek et al., 2011). (B) Amino acid frequency logos for sites whose phosphorylation was enhanced (upper) and unchanged (lower) by EGF stimulation. Background data is PhosphoSitePlus pY database. (C–F) Relative phosphopeptide abundance for peptides derived from EGFR (C), GAB1 (D), SHCA (E) and p130CAS (BCAR1) (F). Specific phosphopeptide sequences are listed. Results are average of three biological replicates.
Figure 3—figure supplement 1
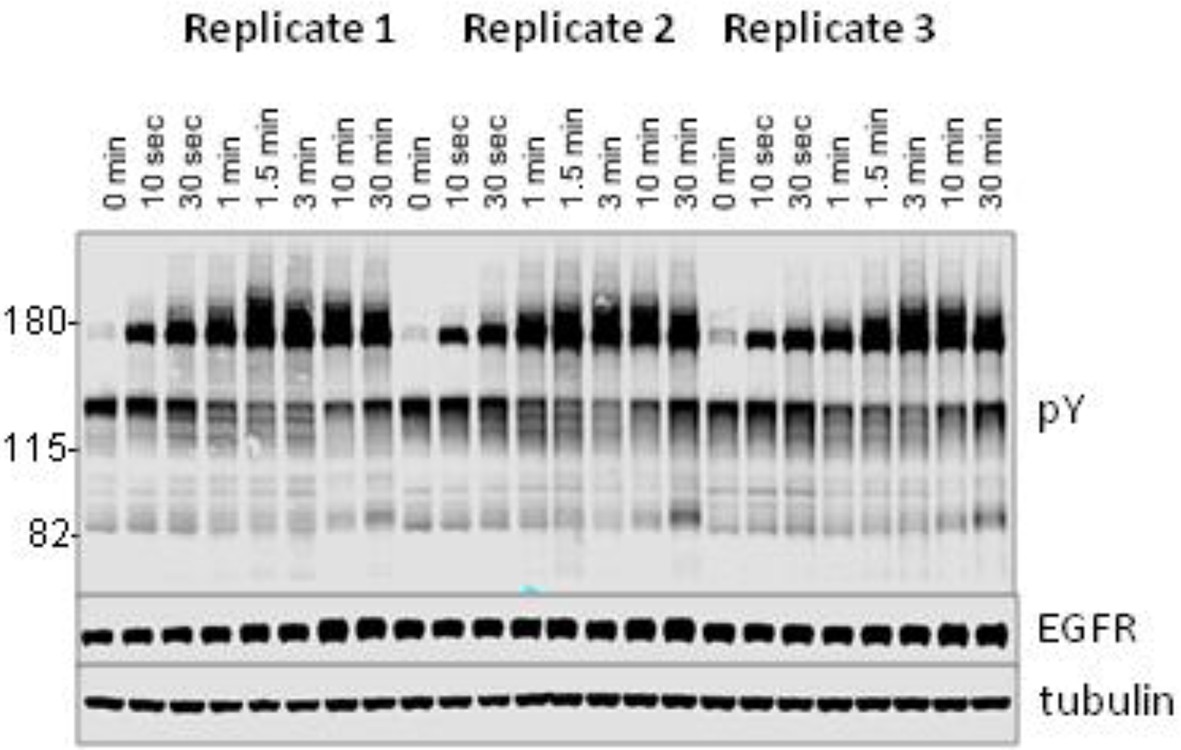
Anti-pY blot of three biological replicates analyzed by iTRAQ phospho-specific MS.
Eight time points; 0, 0.167, 0.5, 1, 1.5, 3, 10 and 30 min post-EGF were analyzed. Immunoblotting with antibodies to EGFR and tubulin was used to confirm equal loading.
Figure 4 with 8 supplements
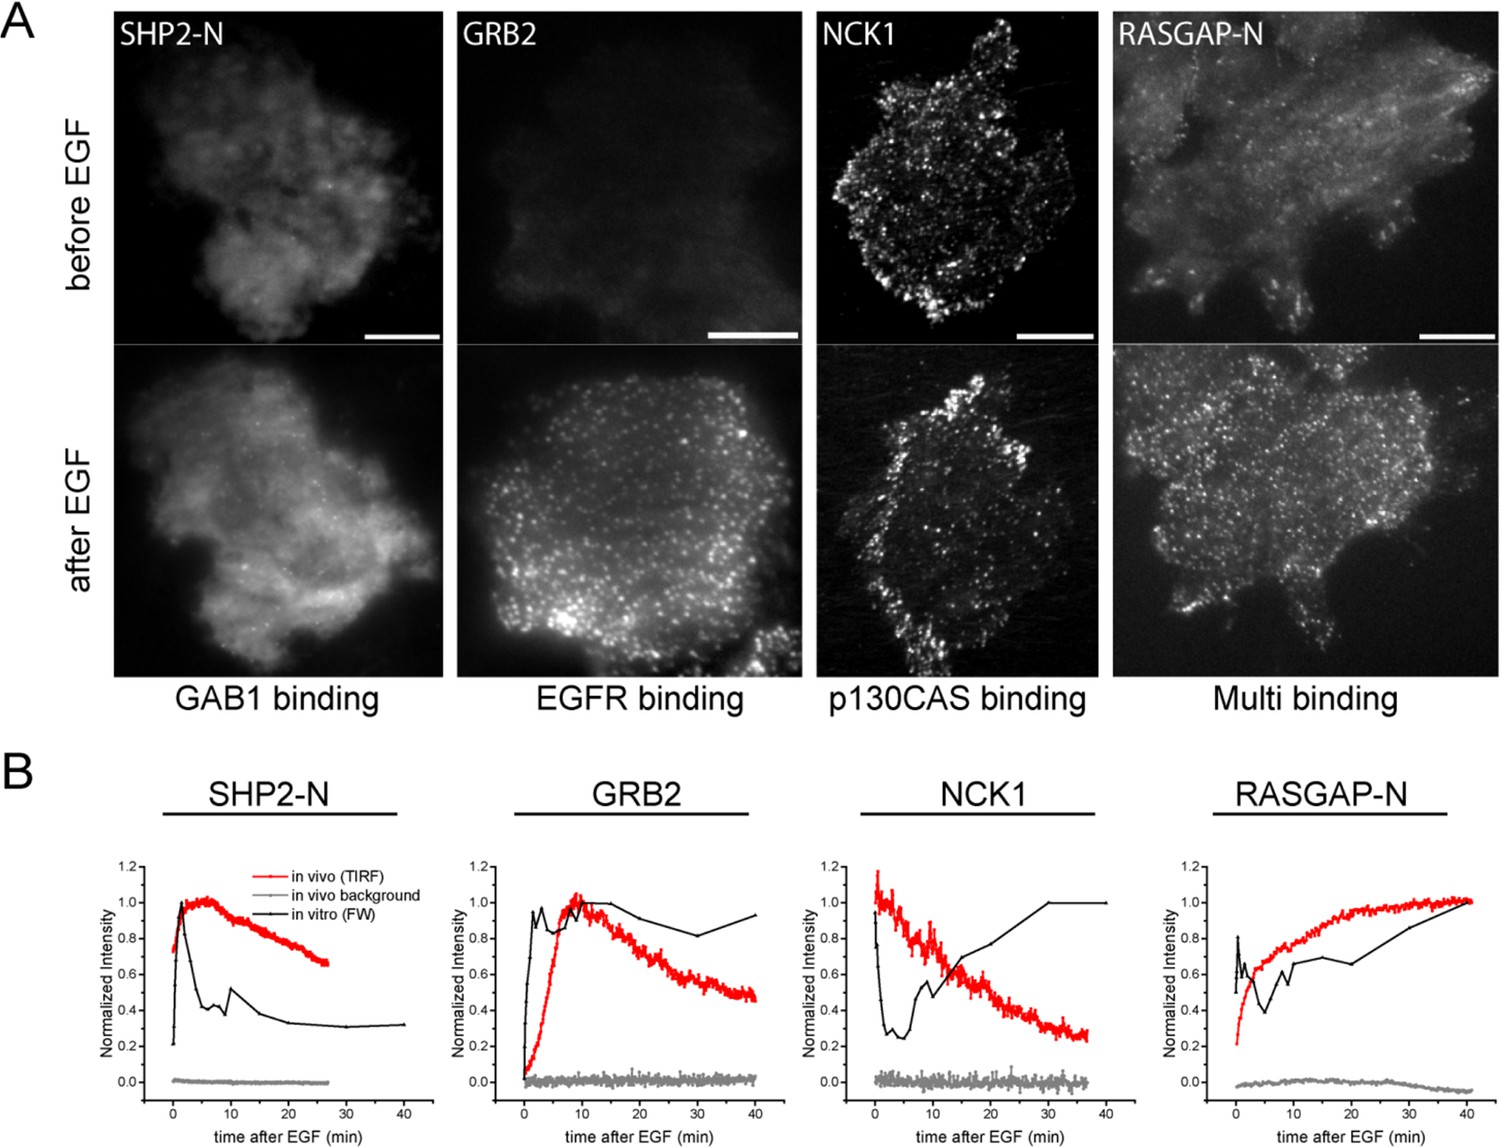
In vivo localization and recruitment kinetics of SH2 domains.
(A) Representative total internal reflection fluorescence (TIRF) microscopy images of fluorescently tagged SH2 domains before and 40 min after EGF stimulation, for SHP2-N, GRB2, NCK1 and RASGAP-N SH2 domains. Scale bars = 10 μm. (B) Comparison of change in total membrane SH2 fluorescence from imaging live cells (red) and change in FW-based SH2 binding (black) following EGF stimulation. Gray lines indicate TIRF background signal. Data is normalized to maximum. See Supplementary file 2 for complete dataset. FW data represent average of multiple technical replicates; in vivo data are from single representative experiments.
Figure 4—figure supplement 1
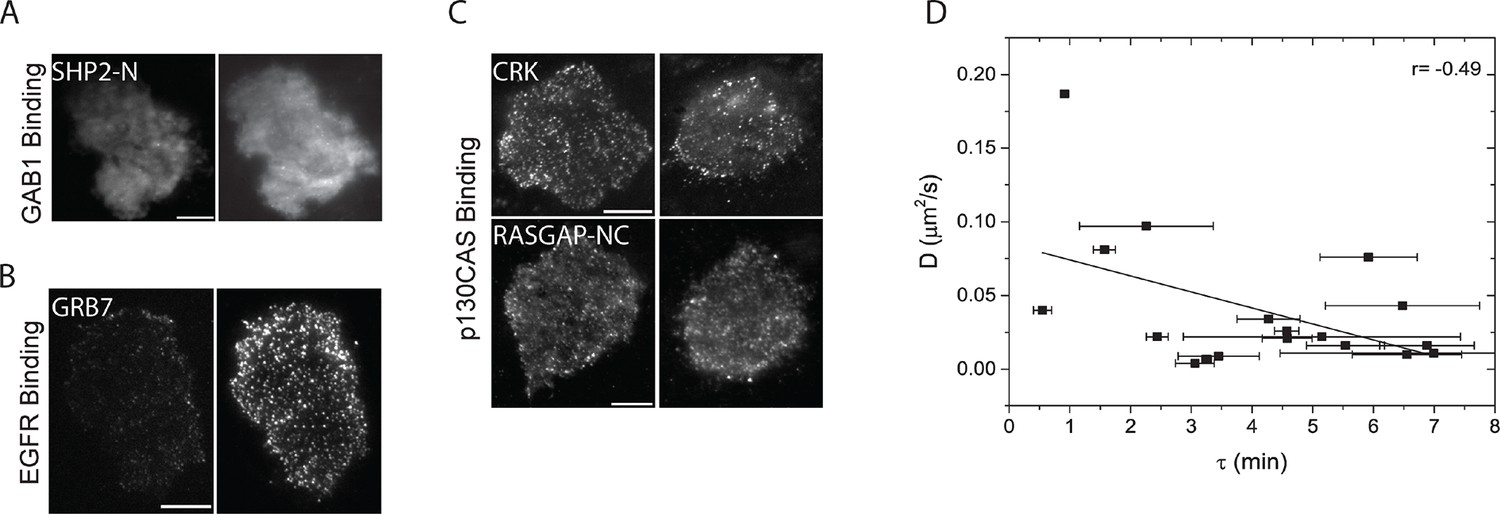
Analysis of in vivo SH2 domain localization and membrane binding.
(A-C) TIRF images of additional fluorescently tagged SH2 domains before and after EGF stimulation. A) GAB1 binding domains (SHP2-NC) (B) EGFR binding domains (GRB7) and (C) p130CAS binding domains (CRK, RASGAP-NC). Domains are labeled according to clustering results from Figure 2B. Post-EGF images were taken ~40min after stimulation. Scale bars = 10 μm (D) Correlation plot of SH2 domain probe diffusion rate (D, y-axis) and recruitment time constant (τ, x-axis). Data for SHP2-C was an outlier and was removed from the plot for clarity. Error bars for τ values represent SEM (see Table 1).
Figure 4—figure supplement 2
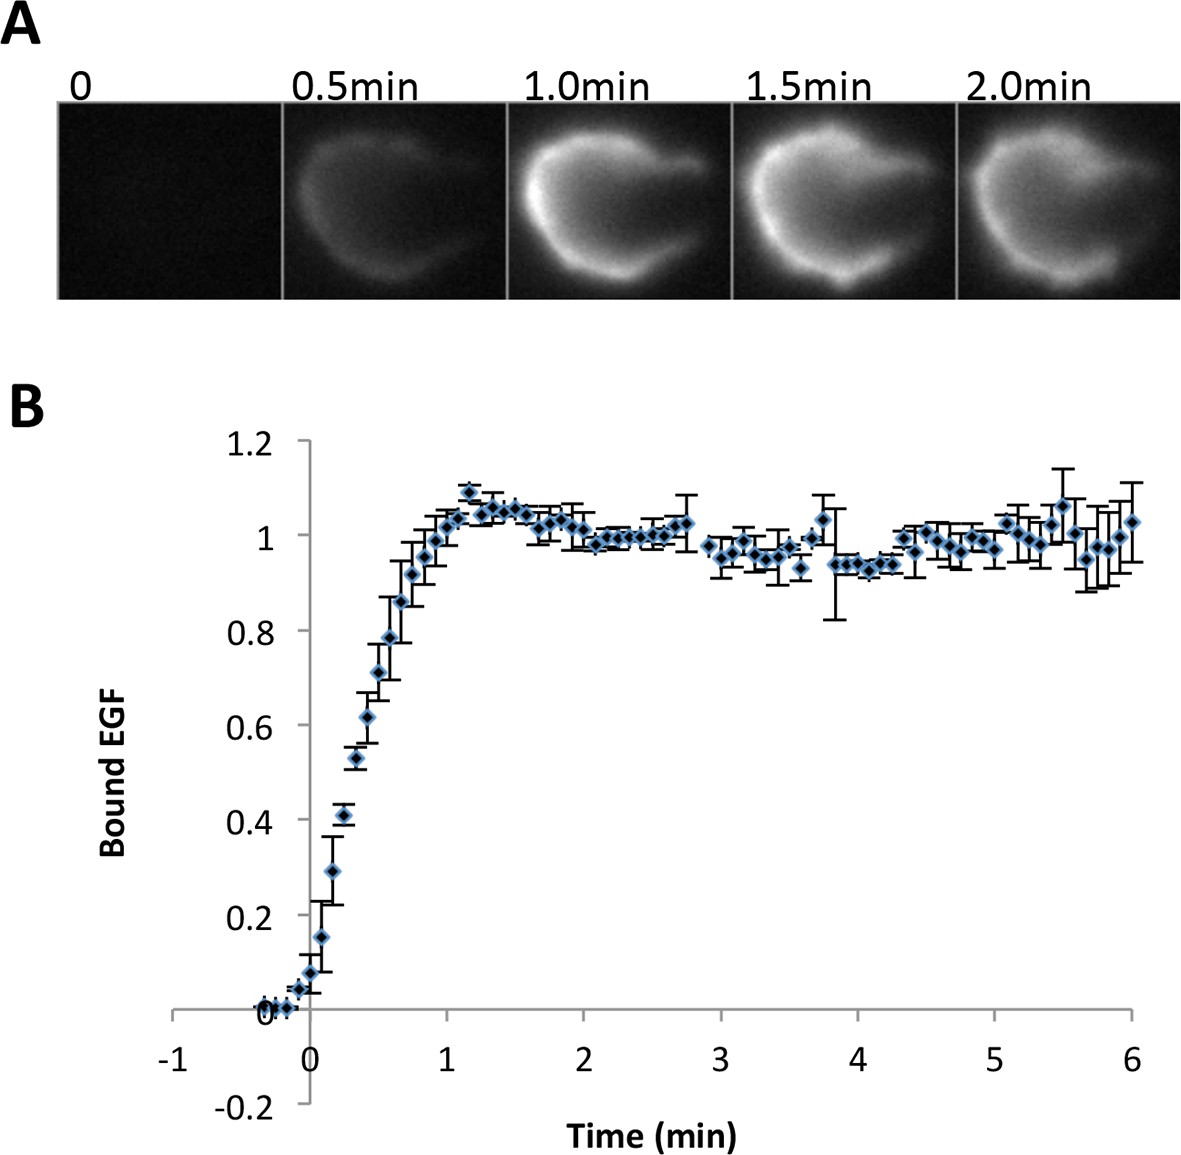
Quantification of EGF binding.
(A) Representative images of fluorescent EGF (labeled with tetramethylrhodamine) binding to A431 cells at various times after treatment with EGF (25 ng/ml, corrected for the extra molecular weight due to the dye motif). Fluorescence images were captured with a highly inclined and laminated optical sheet (HILO) excitation in order to minimize background signal from soluble EGF. Signal is brighter at cell periphery because the plane of focus is set close to the bottom of the cell. (B) Quantification of the binding kinetics of EGF (two biological replicates, total fluorescence per cell).
Figure 4—figure supplement 3
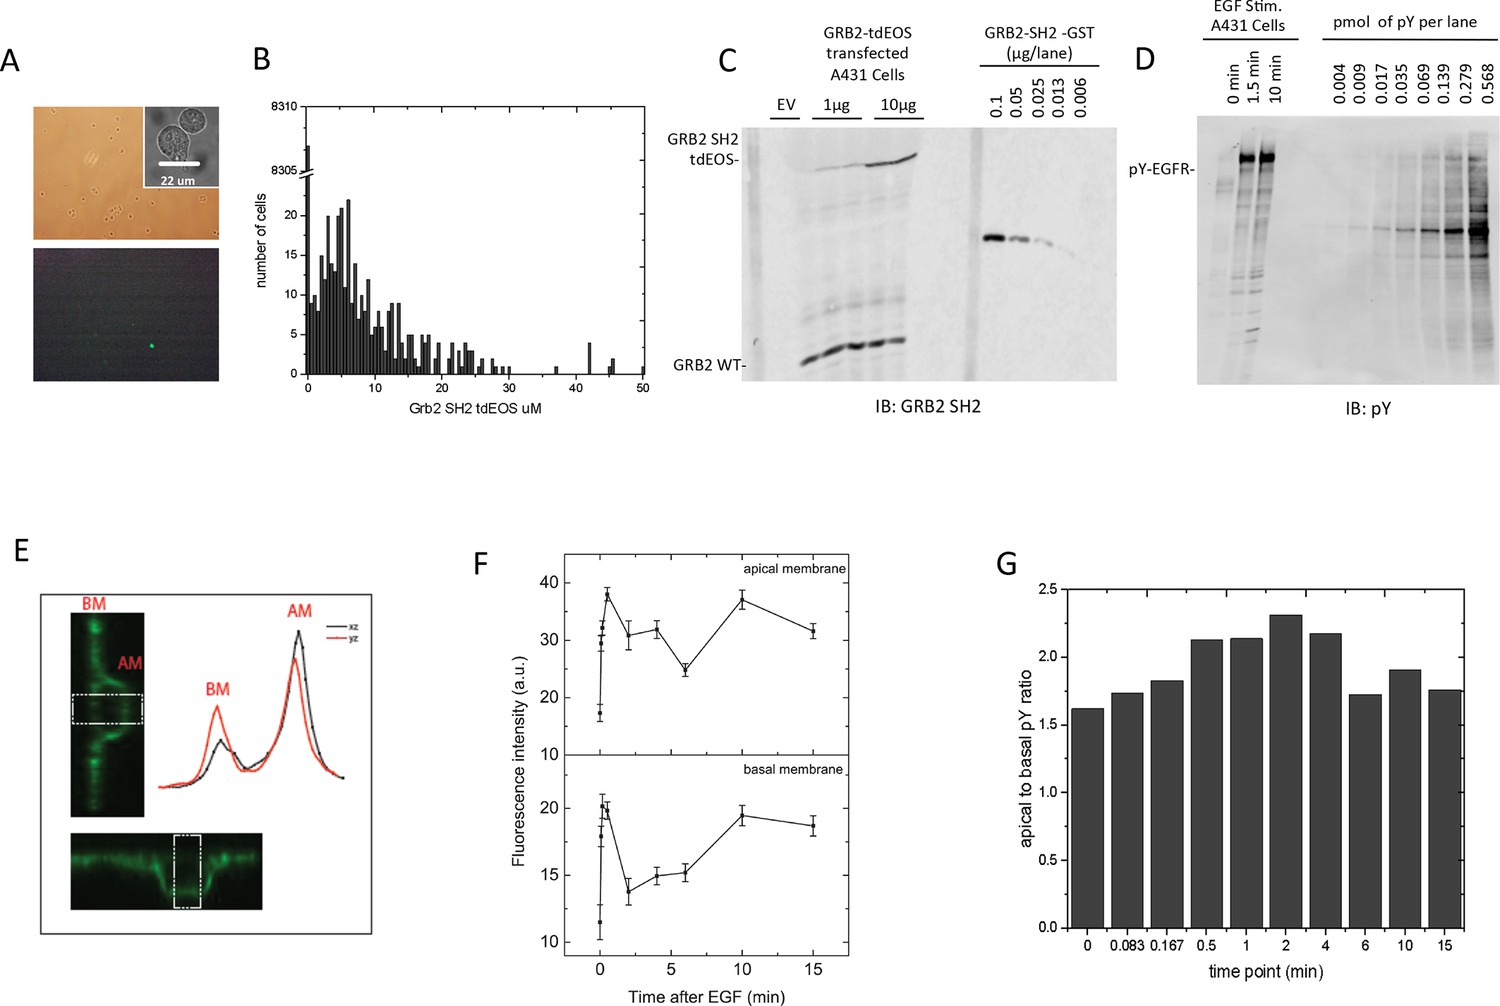
Quantification of GRB2 SH2-tdEOS and pY-EGFR in A431 cells.
(A) Representative white light (top panel) and epifluorescence images (lower panel) of GRB2 SH2-tdEOS transfected A431 cells that were used to determine total cell number, transfection efficiency and relative expression level. Insert (upper panel) shows representative DIC image of nonadherent cells used to determine cell volume. (B) Histogram of individual cell GRB2 SH2-tdEOS expression levels. Left skew in expression was compensated for in the final calculation. (C) Anti-GRB2 SH2 blot used to calculate the average concentration of GRB2 SH2-tdEOS (6.5 μM) and endogenous GRB2 (1.5 μM). Concentrations were determined by using bacterially produced GST-GRB2 SH2 fusion as standard (right side of the blot). (D) Anti-pY blot showing EGF-induced EGFR phosphorylation and phosphorylation standard titration used to calculate the cellular concentration of phosphorylated EGFR sites. Concentrations were determined using a highly phosphorylated recombinant ABL standard with a known pY concentration (right side of the blot). (E) Representative z-axis cross-sections of fixed A431 cells immunostained with anti-pY. The images and traces were obtained from the same cell along the x- and y-axes. White block indicates the quantified area. Curves represent an average of multiple line scan quantifications across an individual cell membrane. (F) Apical and basal pY levels following EGF stimulation as measured by immunofluorescence. Intensity measurements were averaged from two independent experiments; a total of at least seven cells were quantified for each time point. Error is SEM for all data points. (G) Ratio of apical to basal phosphorylation following stimulation with EGF.
Figure 4—figure supplement 4
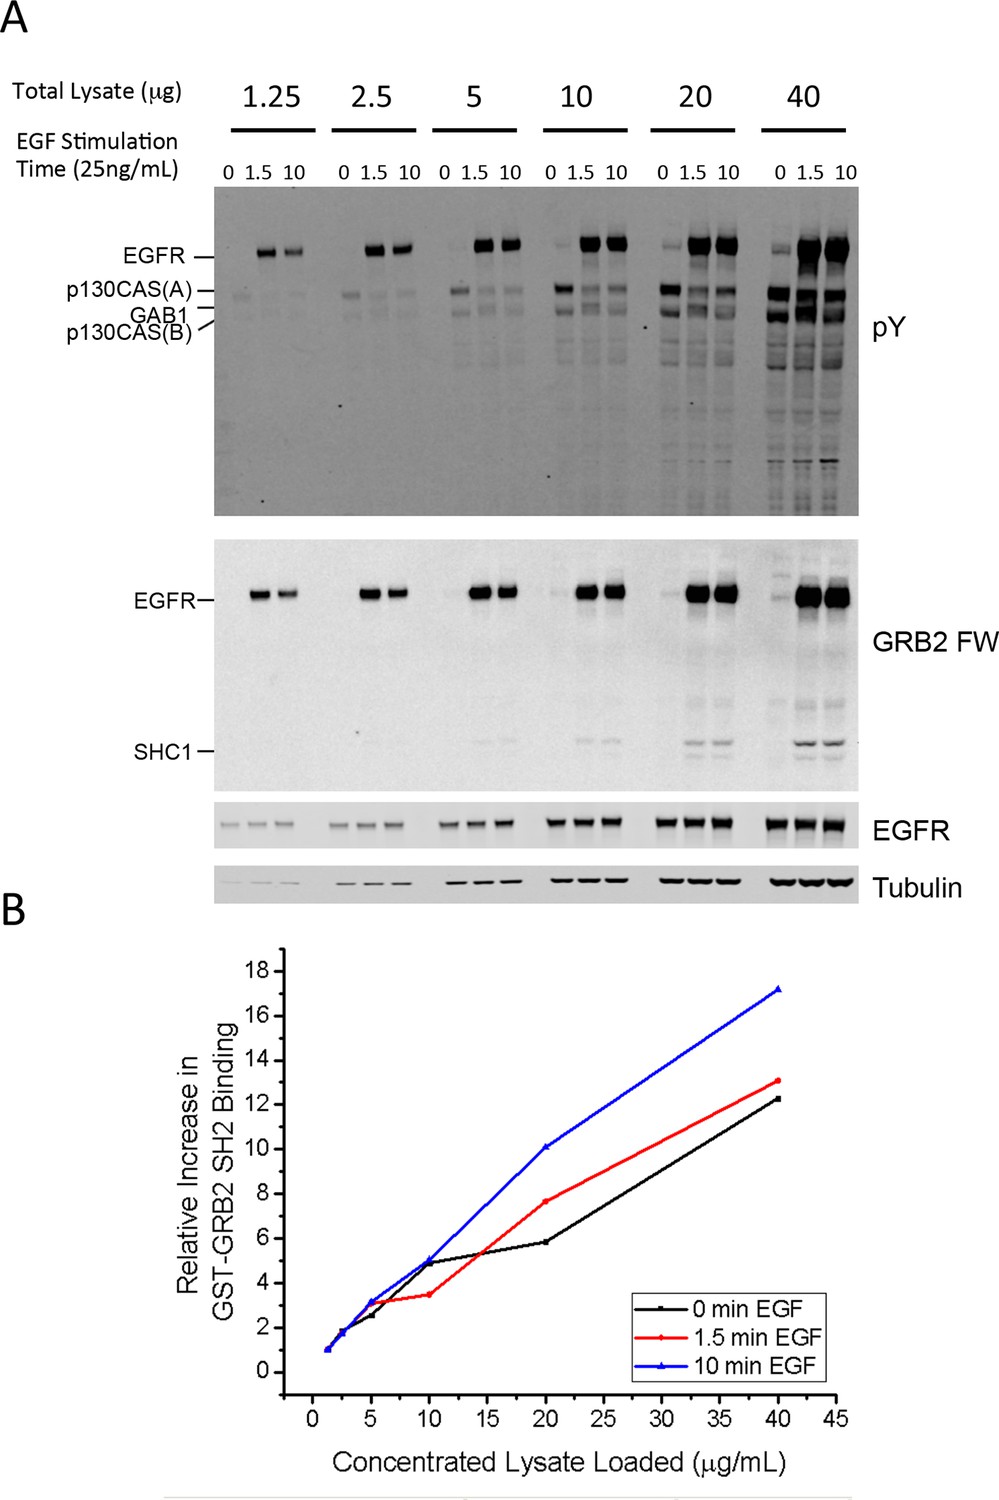
Linear response of FW assay.
(A) Anti-pY Western and GRB2 FW of serially diluted lysates from A431 cells stimulated with 25ng/mL EGF for 0, 1.5 and 10 min. Total micrograms of lysate protein run for each lane is listed above the lane. (B) Fold increase in quantified GRB2 FW signal for each amount of lysate (compared to signal at 1.25 μg of lysate). For reference, all pY and FW values shown in Supplementary file 2 were quantified from blots run at 20 μg/lane.
Figure 4—figure supplement 5
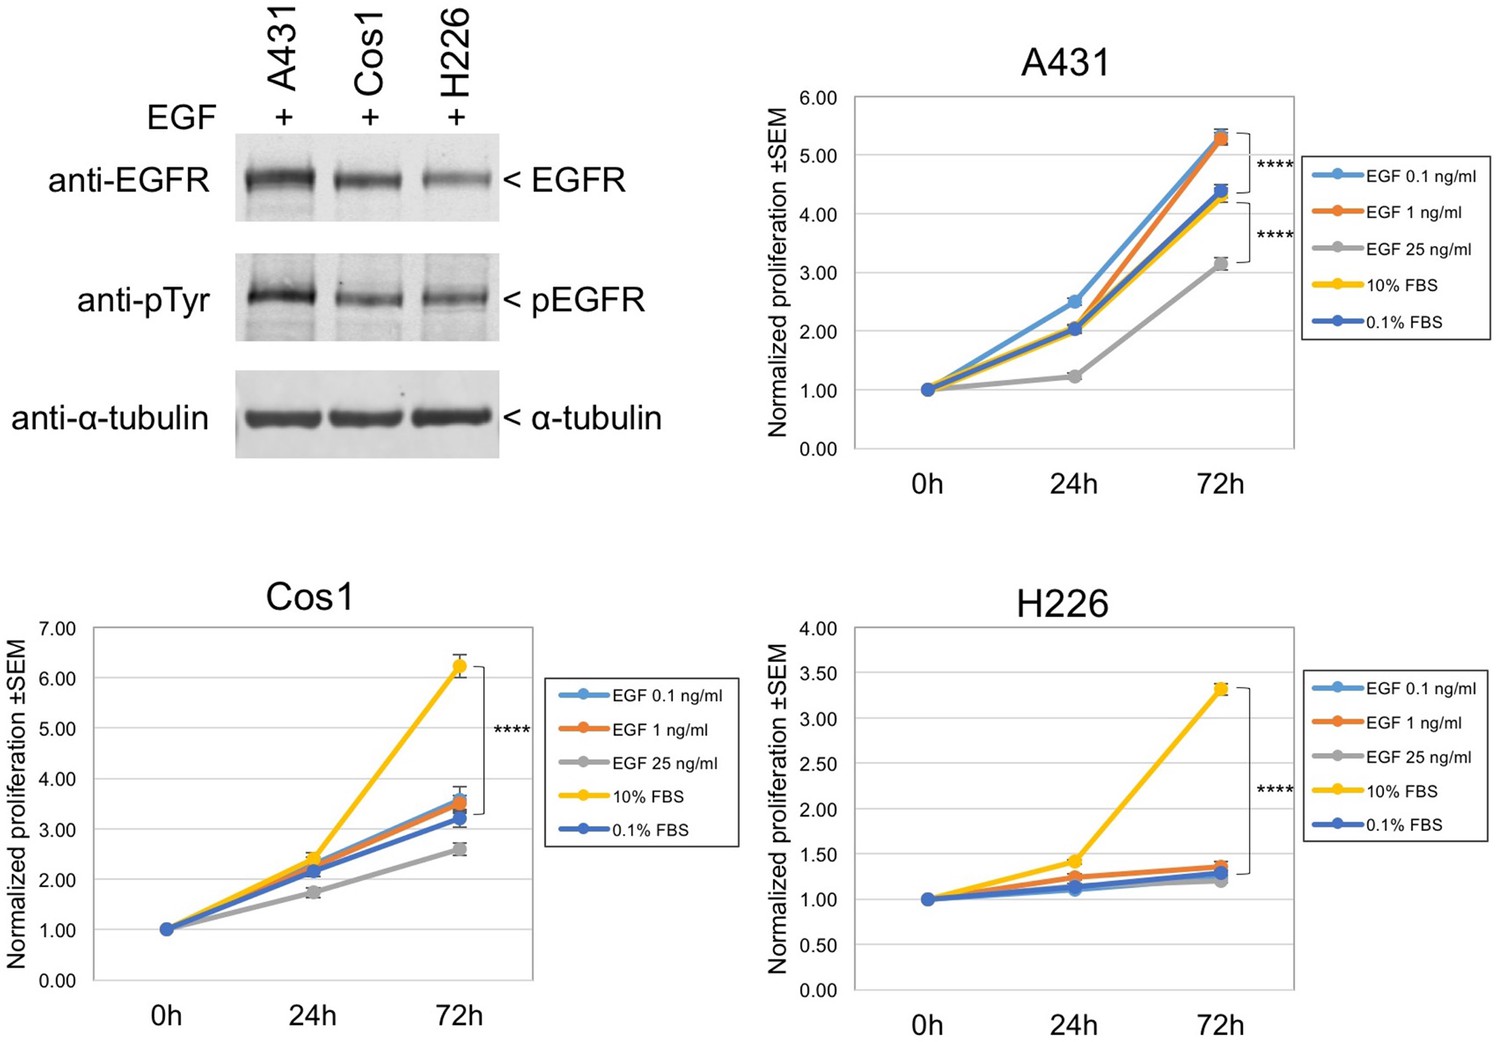
EGF-induced cell growth of A431, Cos1, and H226 cells.
Upper left: three cell lines expressing wt EGFR (A431; Cos1 African green monkey kidney fibroblast cells; H226 human lung squamous cell carcinoma cells) were stimulated with 1 ng/ml EGF for 10 min. Expression and tyrosine phosphorylation of EGFR were determined by immunoblotting with anti-EGFR and anti-pY antibodies. Upper right and lower panels: proliferation assay results for A431, Cos1, and H226 cells. Cells in 96-well plates were incubated with control (0.1% FBS), 0.1–25 ng/ml EGF, or 10% FBS medium up to 72 hr as indicated in the inset. Cell proliferation was determined with CYQUANT direct reagents as described in Methods. Fold changes in normalized fluorescence values at 0 hr, 24 hr, and 72 hr after treatment are shown. Asterisks indicate a significant difference between treatments at 72 hr (p<0.0001, one-way ANOVA). Note that in A431 cells, 1 ng/ml EGF is mitogenic while 25 ng/ml EGF suppresses growth/survival. EGF is not mitogenic in Cos1 or H226 cells under conditions used here.
Figure 4—figure supplement 6
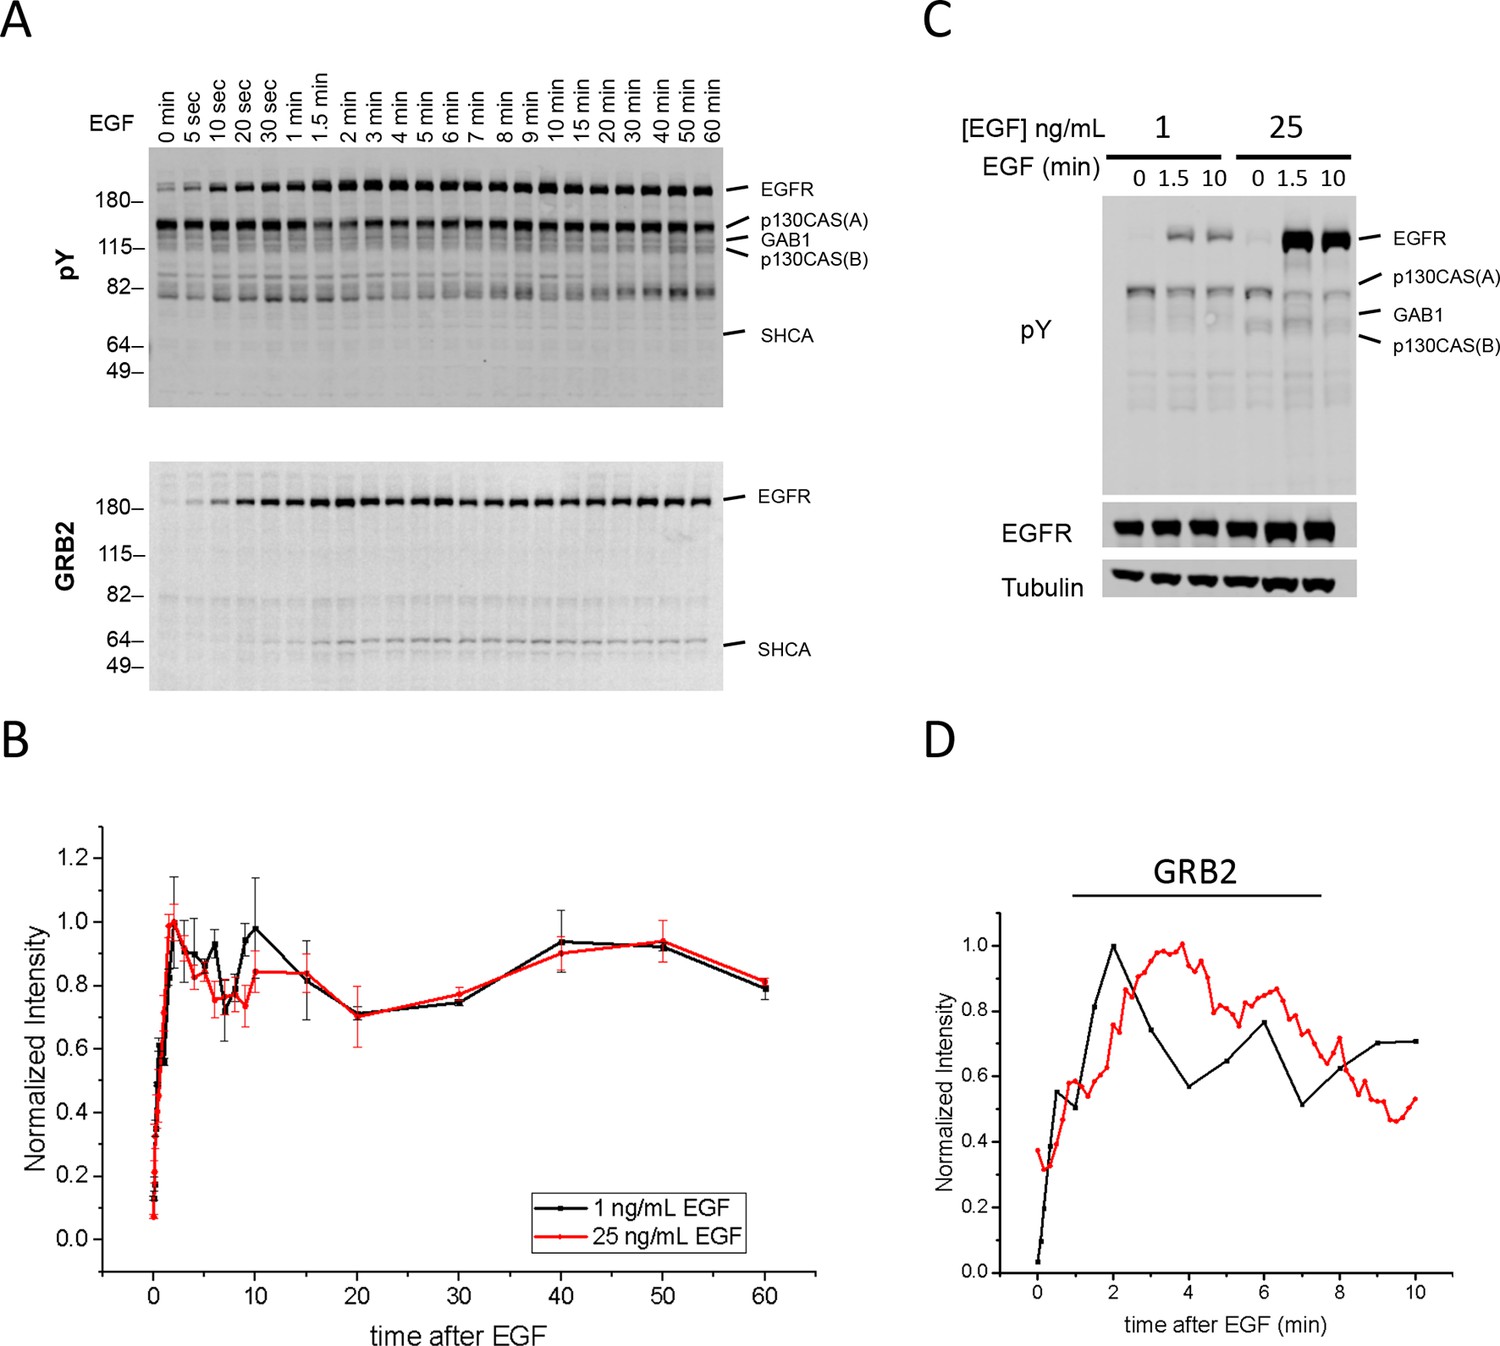
Quantification of Grb2 binding sites and in vivo Grb2 SH2 recruitment in A431 cells stimulated with 1 ng/ml EGF.
(A) Representative anti-pY immunoblot (upper panel) and Grb2 SH2 far-western blot (lower panel) of A431 cells stimulated with 1 ng/mL EGF and flash frozen at 22 discrete time points. (B) Quantification of EGFR tyrosine phosphorylation kinetics (from anti-pY immunoblot) in A431 cells treated with 1 ng/mL EGF (n=2 biological replicates) and 25 ng/mL EGF (n=3 biological replicates). (C) Anti-pY immunoblot of A431 cells stimulated with 1 ng/mL and 25 ng/mL EGF at 0, 1.5 and 10 min. EGFR phosphorylation was 5.4 +/- 0.4 fold greater in cells stimulated with 25 ng/mL (normalized for EGFR expression, error = SEM). No difference was observed in prestimulation EGFR phosphorylation after normalization. (D) Comparison of Grb2 SH2 binding site phosphorylation kinetics (GST-Grb2 SH2 FW, black; time constant τ = 54.6 +/- 1.4 s, n=2 biological replicates) and Grb2 SH2 in vivo membrane recruitment kinetics (tdEOS-GRB2 SH2 TIRF, red; time constant τ = 116.7 +/- 2.3 s, n=2 biological replicates).
Figure 4—figure supplement 7
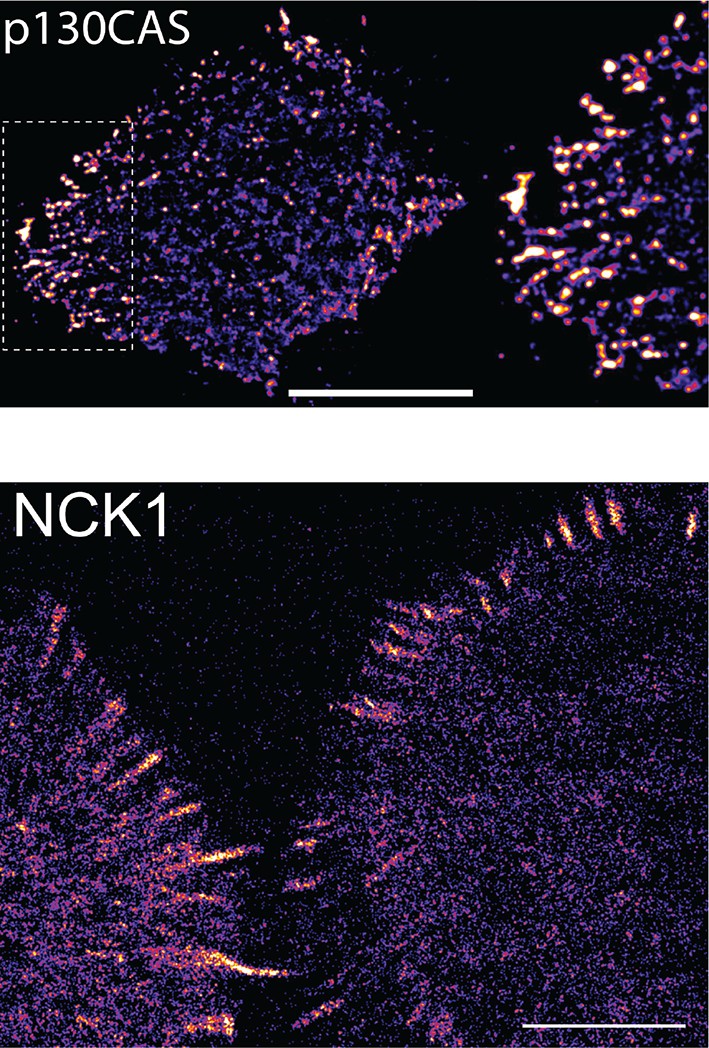
NCK SH2 and p130CAS display similar localization patterns.
sptPALM images of tdEOS-labeled p130CAS and NCK1 SH2-tdEOS in A431 cells before EGF stimulation. Scale bars = 10 μm
Figure 4—figure supplement 8

CRK FW time-course blots from A431 and COS1 cells simulated in parallel with 10 ng/mL EGF.
CRK SH2 shows little or no binding to the EGFR band in COS1 cells.
Figure 5

Quantification of Grb2 SH2 membrane recruitment rate in EGF-stimulated cells.
(A) SptPALM measurement of apparent membrane recruitment rate (γon, black line) and apparent membrane dissociation rate (λoff, red line) following stimulation with EGF. γon is computed as the total number of observed recruitment events divided by the timespan (0.8 min). λoff is computed based on the membrane dwell-times of the observed molecules as previously described (Oh et al., 2012). Errorbars on λoff represent statistical sampling errors due to the finite numbers of single-molecule trajectories used for this calculation. (B) SH2 membrane binding curve calculated using experimentally determined γon and λoff values. (C) Kinetics of GRB2 SH2 binding site clustering (cluster size x cluster number) after EGF treatment. (D) Number of newly recruited GRB2 SH2 molecules (black, whole), and those within clusters (red, cluster) and outside of clusters (blue, non-cluster) after EGF stimulation. Dotted lines show fit with exponential recovery function.
Figure 6
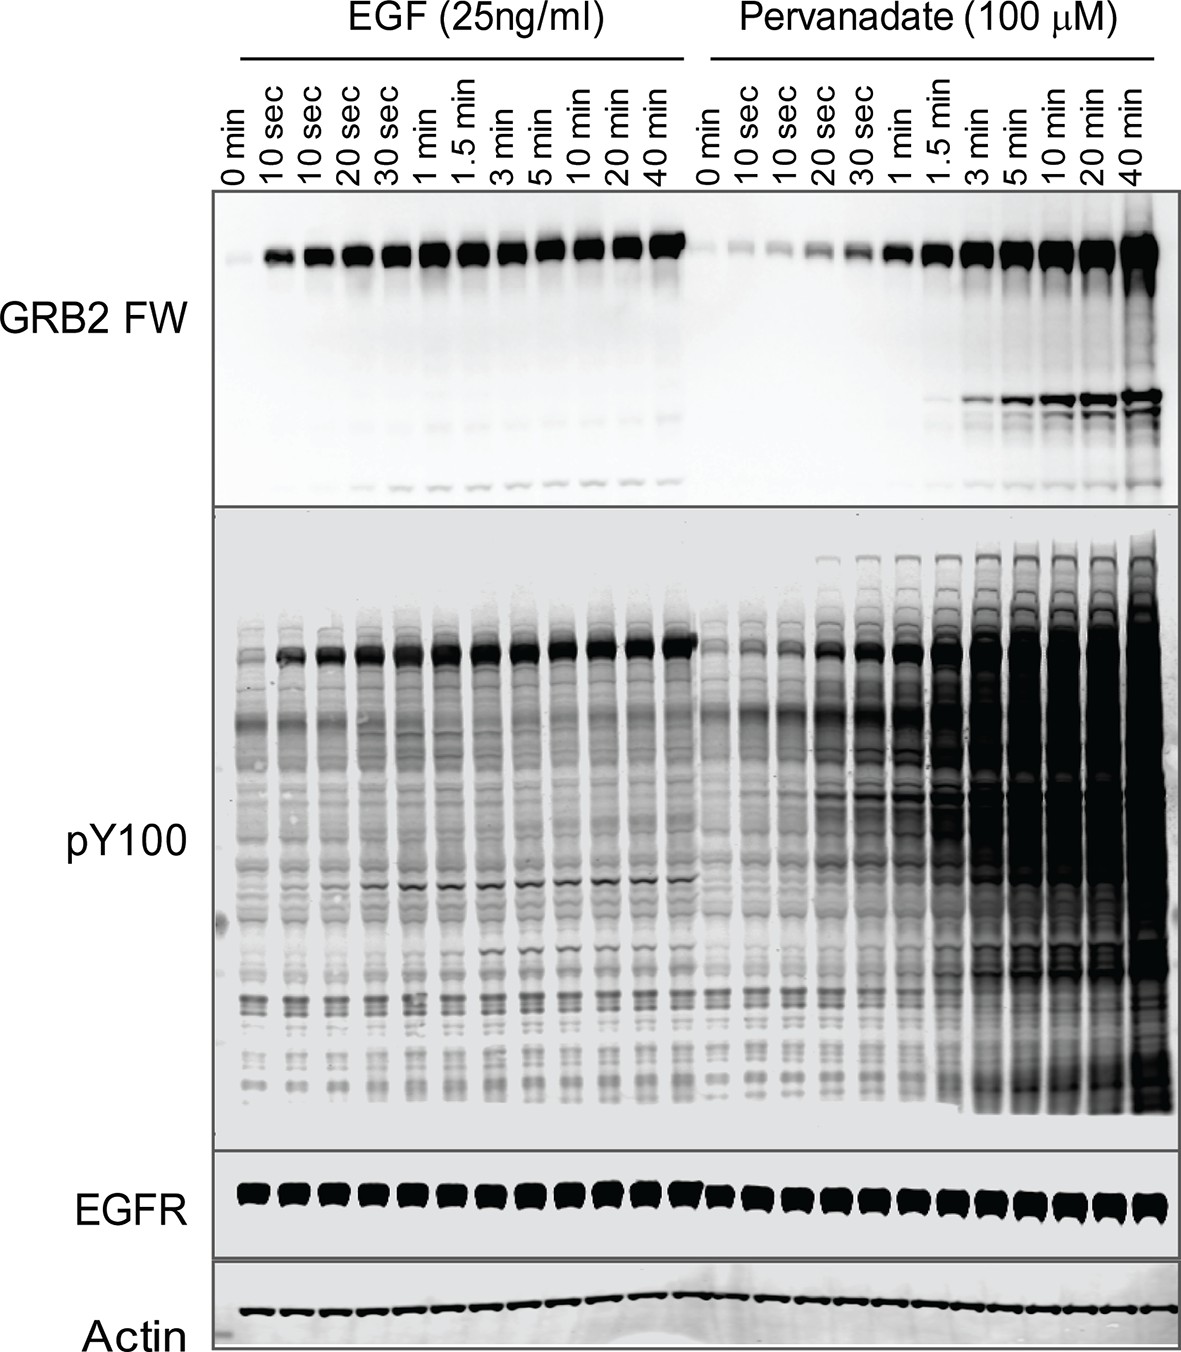
Tyrosine phosphorylation in EGF treated vs.
pervanadate (PV) treated cells. Representative GRB2 SH2 far-Western and anti-pY (PY100) immunoblots for EGF and PV treated cells. Immunoblotting with antibodies to EGFR and actin was used to confirm equal loading.
Figure 7
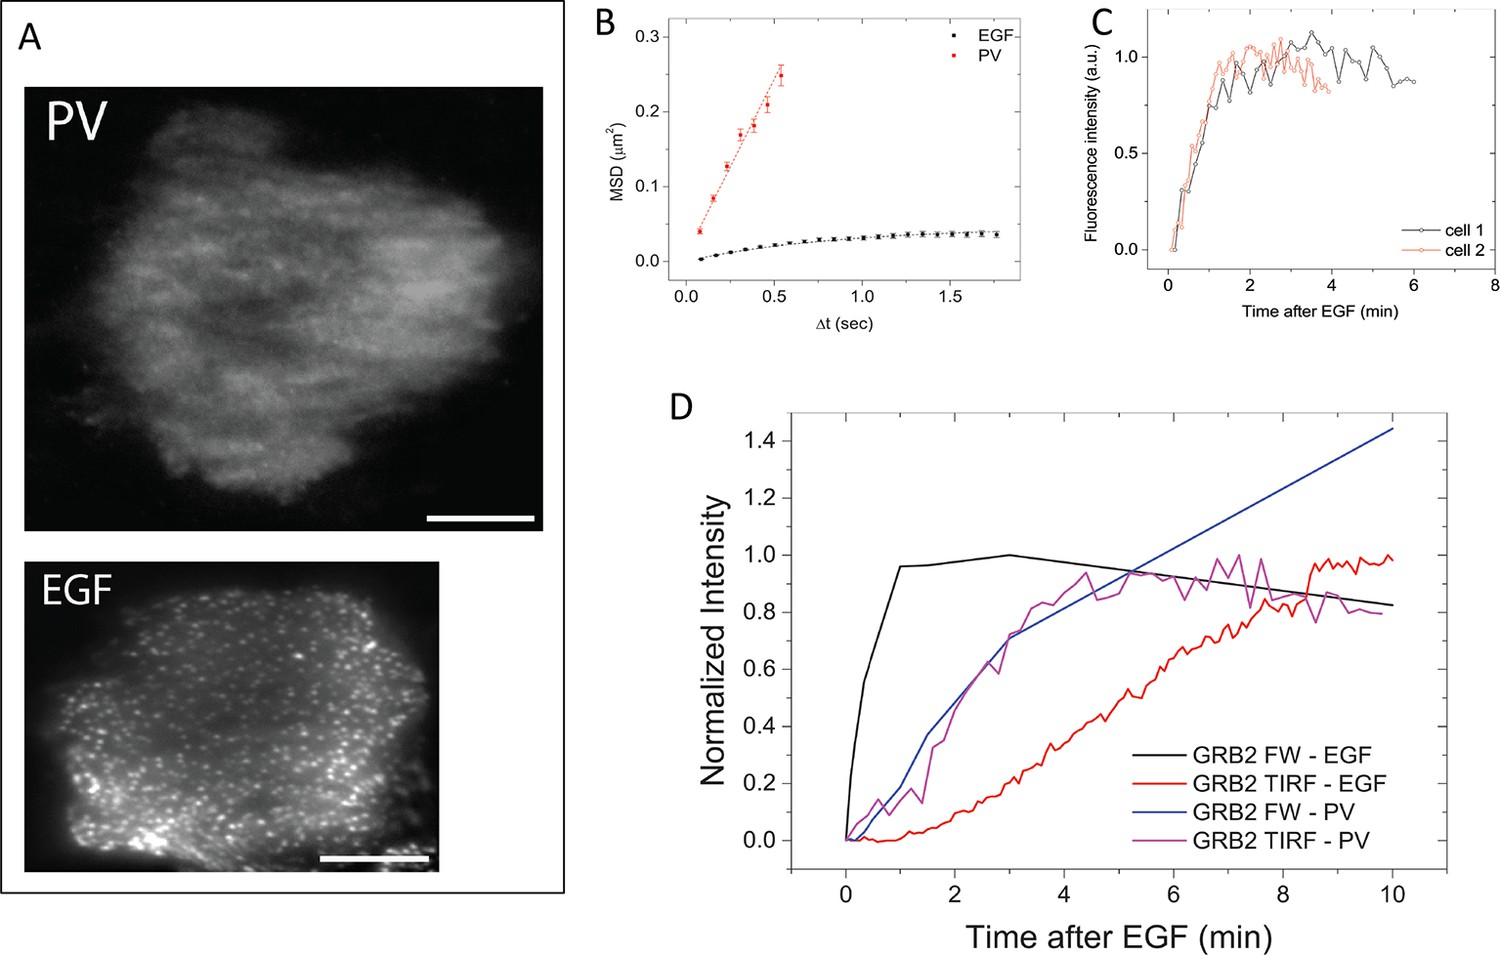
GRB2 SH2 recruitment dynamics in pervanadate (PV) treated cells.
(A) TIRF microscopy images of fluorescently tagged GRB2 SH2 in pervanadate-treated (PV)- and EGF-stimulated cells (40 min post-stimulation). Scale bars = 10 μm. (B) Mean square displacement (MSD) of GRB2 SH2 in EGF- (black) and PV-treated cells (red). Results based on ~8000 (PV) and ~10,000 (EGF) pooled single-molecule trajectories from two cells. Error bars represent SEM. (C) Temporal progression of Grb2 SH2 recruitment rates (apparent on-rate) for two PV-treated cells. (D) Comparison of GRB2 SH2 recruitment kinetics (TIRF fluorescence imaging, n=2, and GRB2 FW (n=2) total binding, in either EGF-treated (in vivo) or PV-treated cells (in vivo). FW data is normalized so that the maximum signal in EGF treated cells equals 1.
Videos
Video 1
Real time imaging of GRB2 SH2-tdEOS membrane recruitment under TIR microscopy using 488 nm excitation.
GRB2 SH2-tdEOS recruitment to the basal membrane of A431 cells begins immediately following EGF. The total number of recruited molecules reaches equilibrium at ~10 min, as indicated by the fluorescence intensity profile (right, 1 frame = ~10 s).
Video 2
GRB2 SH2-tdEOS mobility in EGF- and PV-treated cells following EGF stimulation.
GRB2 SH2-tdEOS molecules on the basal membrane of A431 cells treated with 25 ng/ml EGF (left) and 100 μM PV (right). Videos were recorded 40 min after addition of EGF or PV at 0.1 Hz. GRB2 SH2-tdEOS can be seen diffusing significantly faster in PV treated cells and its movement along the membrane is not constrained.
Tables
Table 1
Quantification of in vivo SH2 binding dynamics and binding site kinetics. To compare in vivo imaging and FW data directly, for each SH2 domain in vivo membrane recruitment kinetics and timecourse of total binding (to all bands) by FW were fit to the first order exponential recovery function (1-e-t/τ), where τ is the time constant and t is time after EGF. *denotes data that fit poorly to the recovery function (R-square <0.5). n = number of biological replicates used for calculation of τ from in vivo imaging. SEM of τ values from multiple replicates shown in parentheses. D is the diffusion constant of SH2 molecules on the membrane in cells stimulated by EGF, measured by single-molecule tracking technique 40 min post-EGF (see Materials and methods). For each SH2, data from >3000 trajectories in a single cell were used to calculate D. ND = not determined.
| in vivo (single molecule and TIRF imaging) | in vitro (FW) | |||
|---|---|---|---|---|
| SH2 Domain | Rcruitment time τ (min) | n | D (μm2/s) | Phosphorylation time τ (min) |
| SHIP2 | 0.55 (0.15) | 3 | 0.040 | 1.13 (0.81)* |
| SHP2-N | 0.91 (0.02) | 2 | 0.187 | 0.60 (0.01) |
| GRB14 | 0.99 (0.47) | 2 | ND | -1.50 (0.08) |
| SHP2-NC | 1.57 (0.18) | 5 | 0.081 | 1.57 (0.18) |
| SHP2-C | 1.85 (0.49) | 8 | 0.759 | ND |
| EAT2 | 2.26 (1.10) | 2 | 0.097 | 0.64 (0.51)* |
| PLCγ1-NC | 2.44 (0.18) | 2 | 0.022 | 0.62 (0.19) |
| p85α-NC | 3.06 (0.32) | 2 | 0.004 | 0.51 (0.09) |
| SHC PTB | 3.25 (0.08) | 4 | 0.007 | 0.69 (0.08) |
| GRB7 | 3.45 (0.67) | 3 | 0.009 | 0.77 (0.05) |
| VAV2 | 4.27 (0.52) | 2 | 0.034 | 0.80 (0.17) |
| SHC SH2 | 4.57 (0.20) | 4 | 0.026 | ND |
| GRB2 | 4.58 (0.41) | 11 | 0.021 | 0.59 (0.03) |
| PLCγ1-N | 5.15 (2.28) | 2 | 0.022 | 0.75 (0.33) |
| CRK | 5.54 (0.64) | 2 | 0.016 | -2.80 (0.29) |
| RASGAP-NC | 5.92 (0.80) | 2 | 0.076 | -1.27 (0.54)* |
| PLCγ1-C | 6.48 (1.27) | 5 | 0.043 | 0.30 (0.03) |
| ARG | 6.55 (0.90) | 2 | 0.010 | 0.54 (0.20) |
| p85α-N | 6.88 (0.78) | 2 | 0.016 | 0.67 (0.10) |
| RASGAP-N | 6.99 (2.53) | 2 | 0.011 | -2.51 (0.98) |
| FYN | constant | 2 | 0.008 | 0.43 (0.04) |
| NCK1 | decrease | 2 | 0.009 | -0.83 (0.03) |
| RASGAP-C | constant | 2 | ND | 1.27 (0.54)* |
| ABL | constant | 3 | ND | 0.70 (0.40) |
| YES | ND | ND | -3.62 (1.48)* | |
Additional files
-
Supplementary file 1
SH2 domain constructs.
Cloning information and amino acid sequences for all cDNA constructs used in this analysis are listed.
- https://doi.org/10.7554/eLife.11835.025
-
Supplementary file 2
Normalized FW, MS and in vivo imaging kinetics data.
Normalized Data-Interactive tab provides a graph, which allows for the comparison of data from FW, MS, imaging and pY EGFR immunoblotting. To use, select the desired data from drop down menu. To remove data select 'Blank' located at the top of the menu. Normalized Data provides source data for the interactive chart (top) and all normalized data (below). Errors for FW and MS are shown as standard error of the mean and standard deviation, respectively. In vivo imaging and phosphosite specific western data are from single representative experiments. The interactive graph on the Normalized Data-Interactive tab and the data in Normalized Data tab are linked. The specific data sets used to plot curves of selected probes on the interactive graph can be found at the top of the Normalized Data tab. FW Data tab displays averaged binding quantifications for each SH2 probe. Data for each probe was normalized to the highest intensity band on each blot (Data used for Figure 2B). Error used is SEM. The number of (technical) replicate blots used is listed. MS Data tab provides sequence, Uniprot protein abbreviation and protein description for each peptide identified; indication of EGF dependence (two time points with Student’s t-test p<0.05 and one time point with at least a two-fold increase compared to untreated samples); indication of sites not associated with EGF stimulation in PhosphoSitePlus database; and the number of biological replicates in which the peptides was detected. Phosphosite abundance data is normalized to sum of signal for all eight time points. Error is represented as standard or average deviation.
- https://doi.org/10.7554/eLife.11835.026
Download links
A two-part list of links to download the article, or parts of the article, in various formats.
Downloads (link to download the article as PDF)
Open citations (links to open the citations from this article in various online reference manager services)
Cite this article (links to download the citations from this article in formats compatible with various reference manager tools)
Time-resolved multimodal analysis of Src Homology 2 (SH2) domain binding in signaling by receptor tyrosine kinases
eLife 5:e11835.
https://doi.org/10.7554/eLife.11835


