Serotonin modulates insect hemocyte phagocytosis via two different serotonin receptors
- Zhejiang University, China
Figures
Figure 1
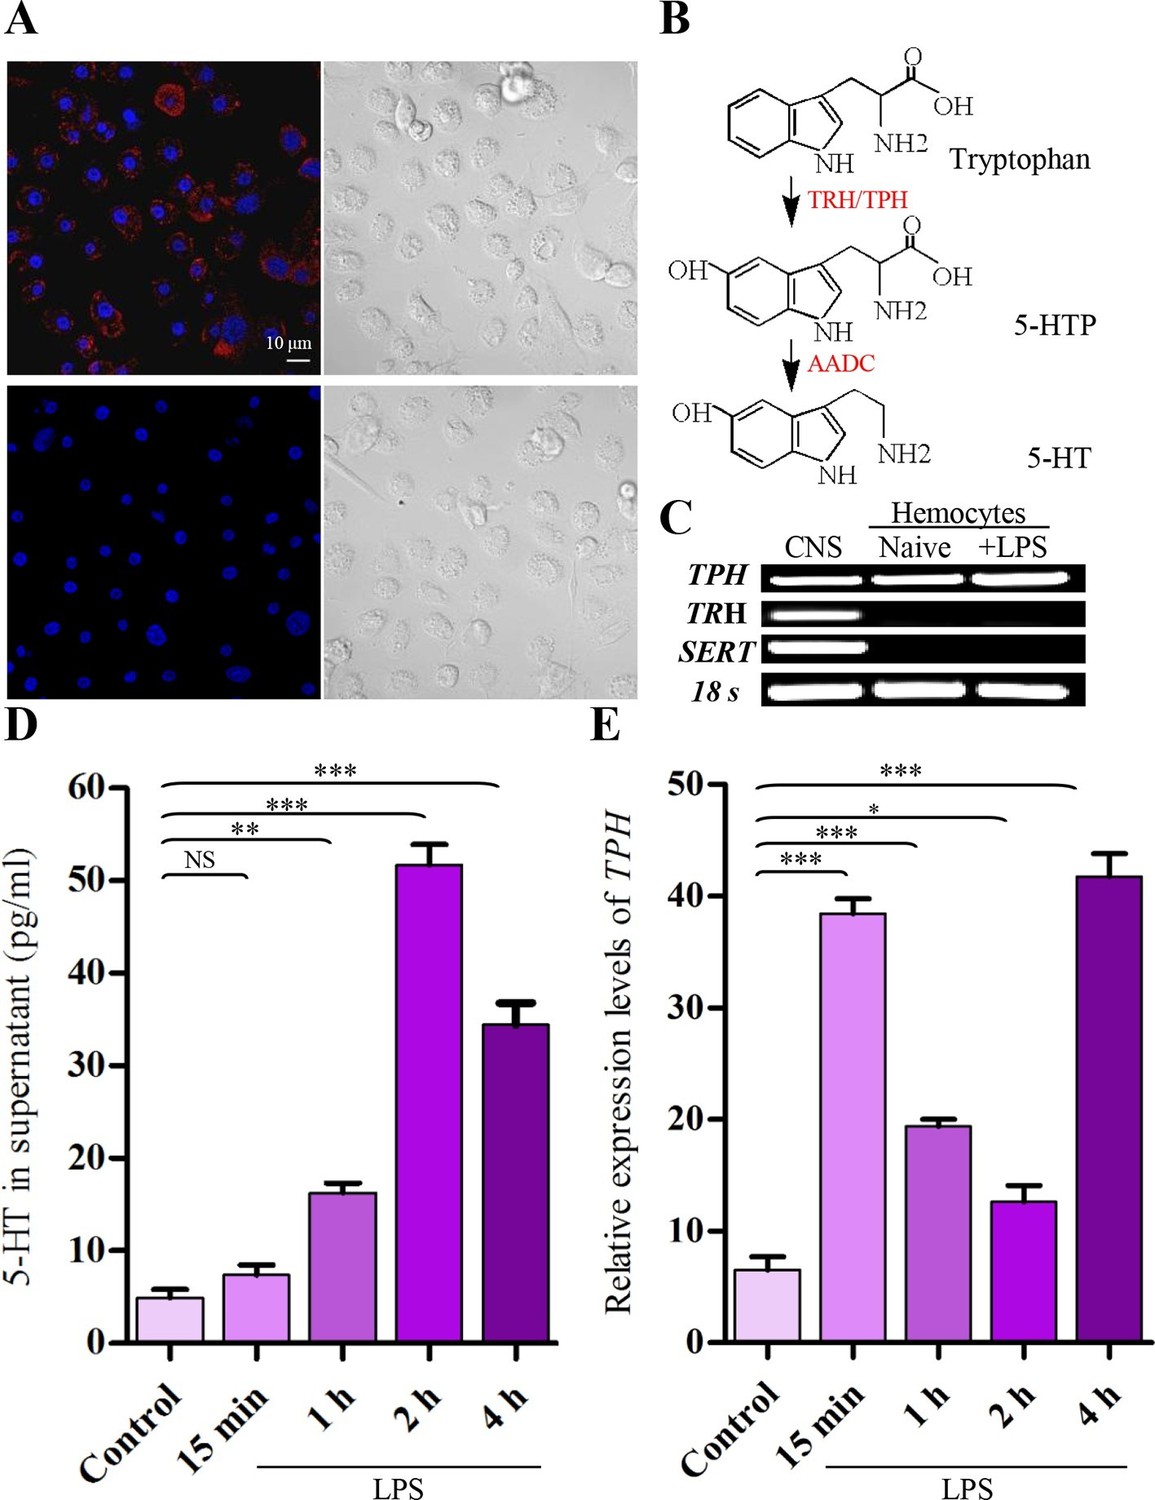
Activated hemocytes are capable of 5-HT synthesis.
(A) 5-HT was visualized by confocal microscopy in hemocytes activated with 100 ng/ml LPS by labeling with 5-HT antisera (Alexa Fluor 546; red) (upper left). 5-HT antisera was preabsorbed with 5-HT as the negative control (lower left). Nuclei were counterstained with DAPI (blue). Scale bar represents 10 μM. Data are representatives of two independent experiments. (B) Serotonin biosynthetic pathway. Tryptophan- phenylalanine hydroxylase (TRH/TPH), aromatic L-amino acid decarboxylase (AADC), 5-hydroxy tryptophan (5-HTP). (C) Expression of gene transcripts for TPH, TRH, and SERT were determined by RT-PCR from naive hemocytes and from hemocytes activated with 100 ng/ml LPS for 2 hr, central nervous system (CNS) as positive control. Data are representatives of three independent experiments. (D) 5-HT concentrations in hemocytes supernatants were determined by ELISA. Hemocytes were activated with 100 ng/ml LPS. Naive hemocytes treated with PBS are as control (n = 4). (E) Relative expression of TPH was quantified by real-time PCR. Hemocytes were activated with 100 ng/ml LPS. Naive hemocytes treated with PBS is as control (n = 3). One-way ANOVA followed by Tukey’s multiple comparison test for D and E. Error bars indicate ± s.e.m., ***p<0.001, **p<0.01, *p<0.05 and NS means no significant difference.
Figure 2 with 1 supplement
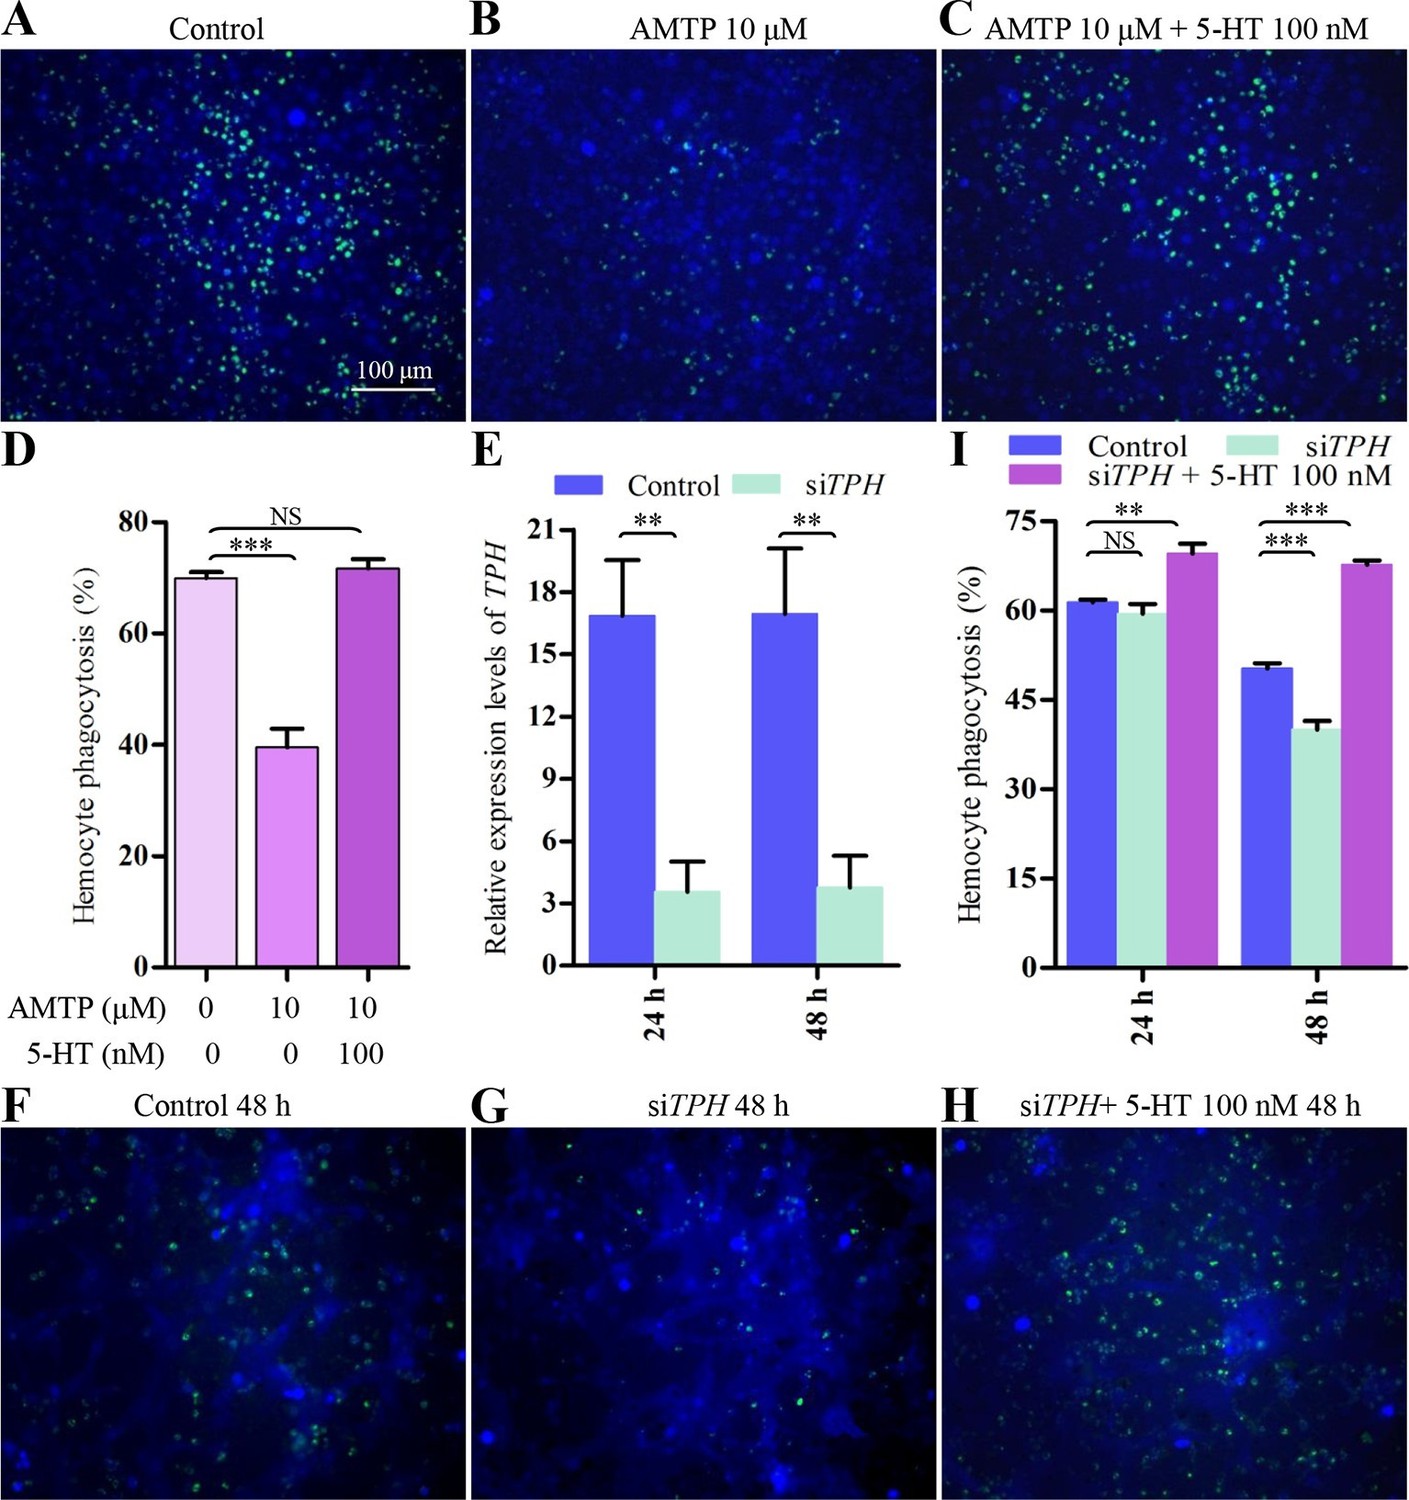
Inhibition of endogenous 5-HT synthesis impairs hemocyte phagocytosis.
(A-C) Hemocyte phagocytosis was visualized by florescence microscope. Hemocytes were stained with Cell Tracker Blue CMAC (blue), green represent the phagocytosed pHrodo E. coli. (D) Quantification of phagocytosis of E. coli by hemocytes (n = 3). (E) Confirmation of knock-down effect of TPH by real-time qPCR. The P. rapae18s rRNA gene was used as an internal reference gene (n = 4). (F-H) Effect of siTPH on hemocyte phagocytosis was visualized by florescence microscope. (I) Quantification of siTPH effect on hemocyte phagocytosis (n = 3). One-way ANOVA followed by Tukey’s multiple comparison test for D and I; two-tailed t-test for E. Error bars indicate ± s.e.m., ***p<0.001, **p<0.01 and NS means no significant difference.
Figure 2—figure supplement 1

Inhibition of 5-HT synthesis by AMTP.
Both PBS treated hemocytes (control) and 10 μM AMTP-treated hemocytes were incubated with 100 ng/ml LPS for 2 hr. Error bars indicate ± s.e.m., n = 3, the statistical analysis is based on two-tailed t-test, ***p<0.001.
Figure 3 with 2 supplements
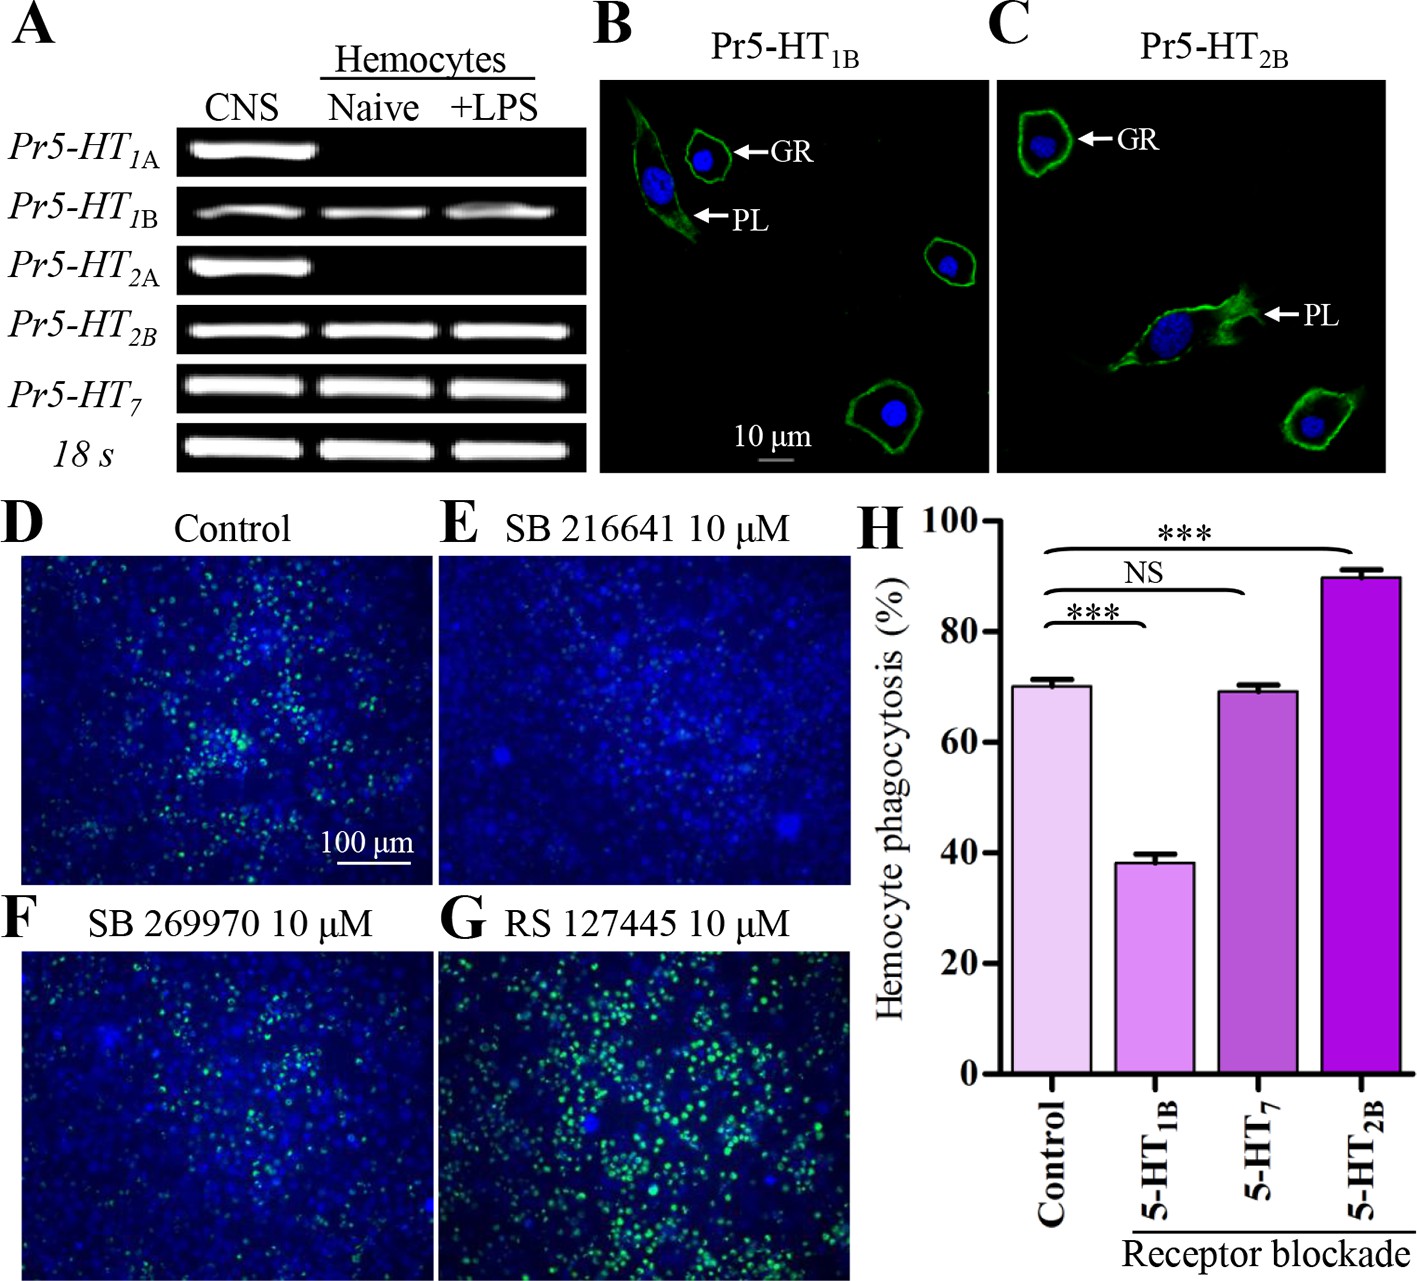
5-HT receptor subtypes expressed in naïve and LPS-activated hemocytes.
(A) Hemocytes were negatively purified and activated with 100 ng/ml LPS for 2 hr. The gene expression for 5-HTR subtype was examined by RT-PCR. Data are representatives of three independent experiments. (B) Gene expression for Pr5-HT1B was examined by immunofluorescence. The scale bar represents 10 μM. Data are representatives of two independent experiments. (C) Gene expression for Pr5-HT2B was examined by immunofluorescence. PL, plasmatocytes; GR, granulocytes. Data are representatives of two independent experiments. (D-G) The effect of different antagonist on hemocyte phagocytosis was visualized by florescence microscope. SB216641 is an antagonist of 5-HT1B. SB269970 is an antagonist of 5-HT7 and RS127445 is a human 5-HT2B antagonist. (H) Quantification of different antagonist on hemocyte phagocytosis. Data are from three independent experiments that each consists of cells from ten fifth-instar larvae. One-way ANOVA followed by Tukey’s multiple comparison test for H. Error bars indicate ± s.e.m., ***p<0.001, **p<0.01 and NS means no significant difference.
Figure 3—figure supplement 1
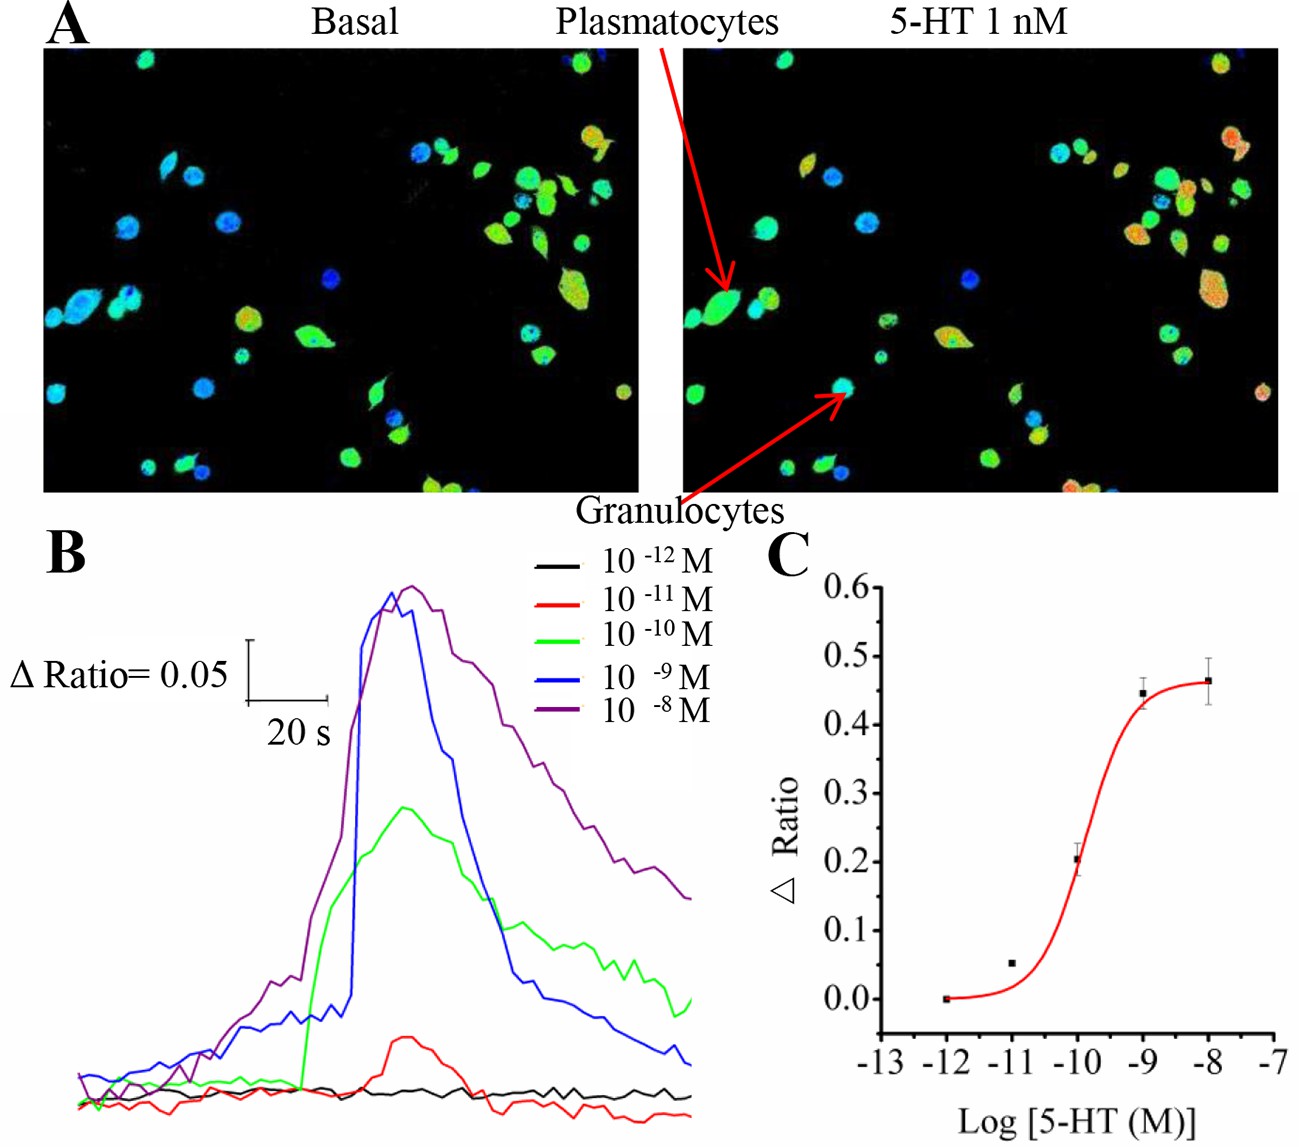
Representative Ca2+ responses and dose-response profiles for 5-HT in hemocytes.
(A) Pseudocolored images of hemocytes before and after application of 1 nM 5-HT. Red cells indicate high levels of intracellular Ca2+ measured by fluorescent ratio intensities, and blue cells represent the basal levels. Two major kinds of hemocytes, plasmatocytes and granulocytes, are indicated by arrows. (B) Increasing concentrations of 5-HT dose-dependently induced changes in the fluorescence ratio of hemocytes. (C) Dose-response curve for 5-HT in hemocytes, as obtained from Ca2+ imaging. Each point represents the mean ± s.e.m. from three to five replicates.
Figure 3—figure supplement 2
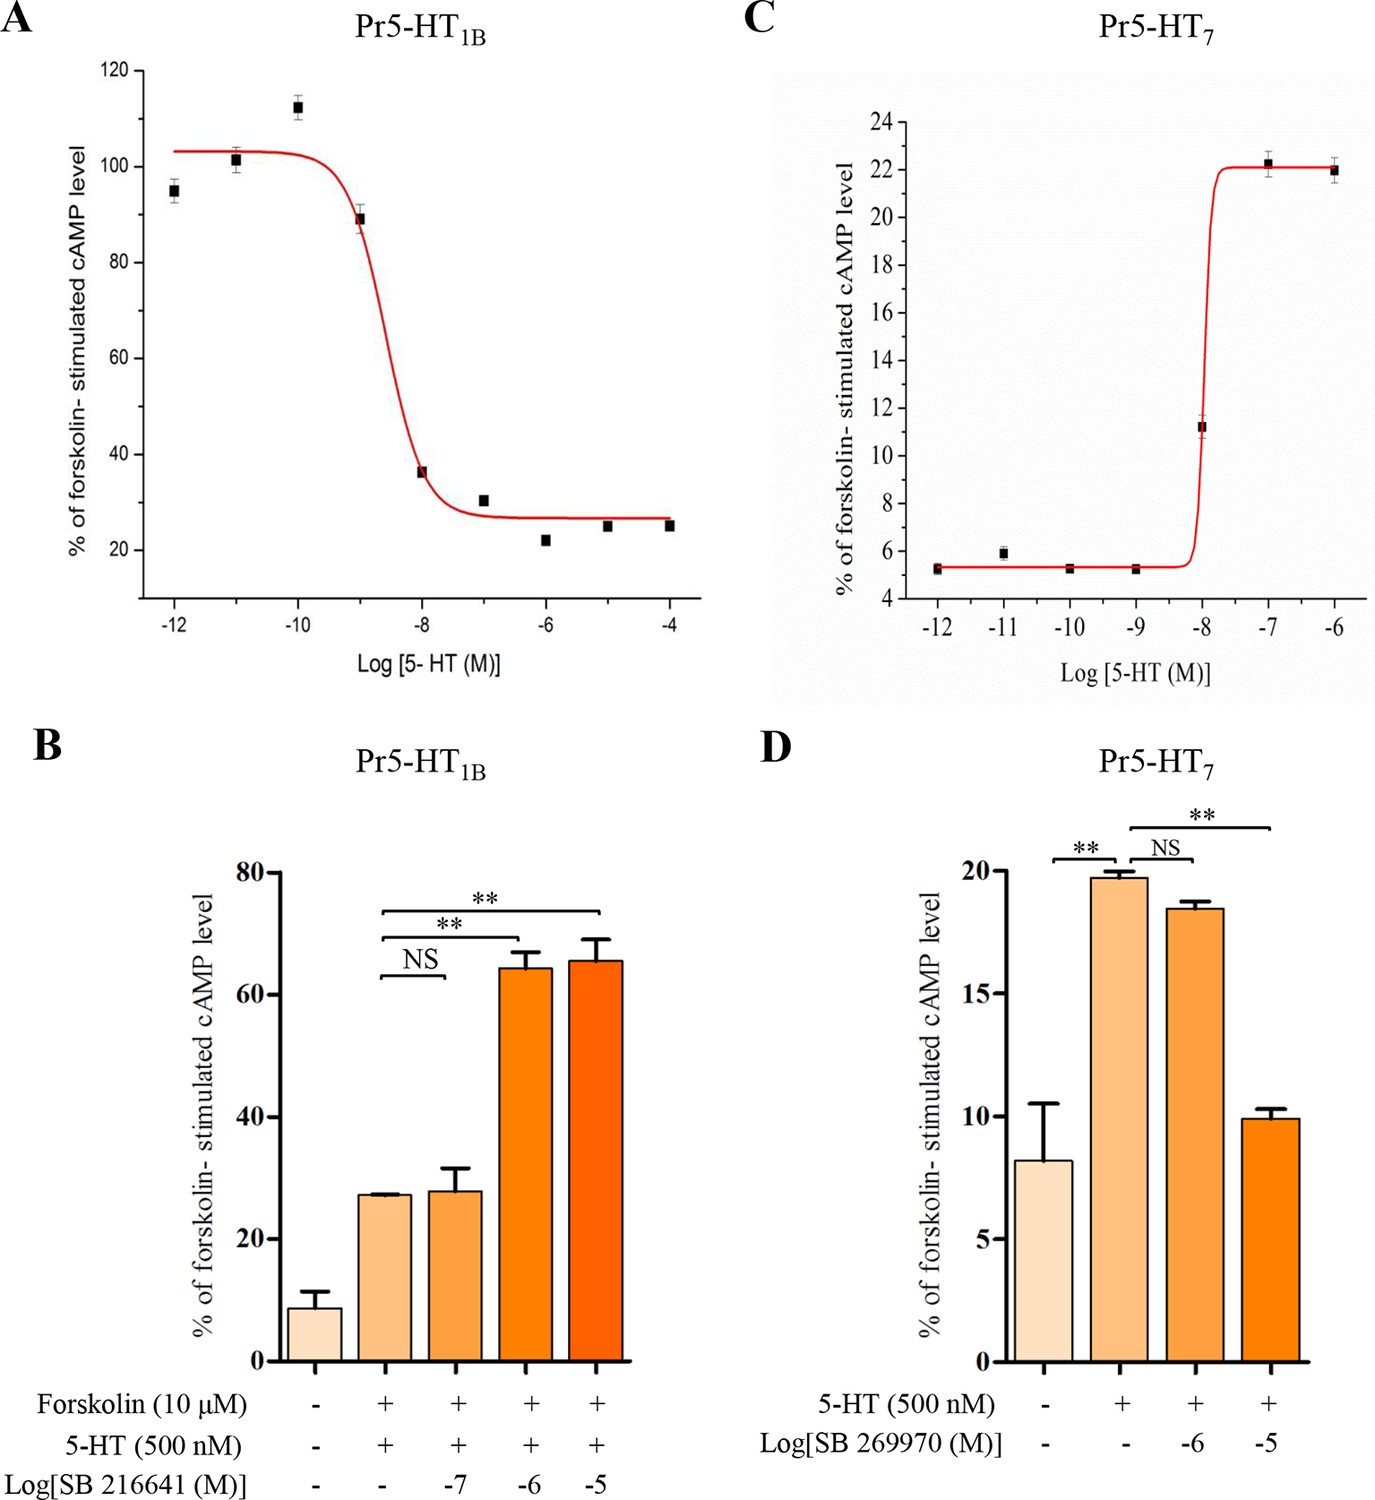
Modulation of intracellular cAMP levels in HEK 293 cells stably expressing the Pr5-HT1B and Pr5-HT2B.
To characterize the pharmacological properties of Pr5-HT1B and Pr5-HT7, We use HEK 293 cell line to stably express Pr5-HT1B and Pr5-HT7. (A) Dose-response relationships of the effects of 5-HT on intracellular cAMP levels in HEK 293 cells stably transfected with pcDNA3/Pr5-HT1B (n = 3). (B) Effects of 5-HT and the antagonist SB 216641 on intracellular cAMP levels in HEK 293 cells stably transfected with pcDNA3/Pr5-HT1B (n = 3). (C) Dose-response relationships of the effects of 5-HT on intracellular cAMP levels in HEK 293 cells stably transfected with pcDNA3/Pr5-HT7 (n = 3). (D) Effects of 5-HT and the antagonist SB 269970 on intracellular cAMP levels in HEK 293 cells stably transfected with pcDNA3/Pr5-HT7 (n = 3). One-way ANOVA followed by Tukey’s multiple comparison test for A and B. Error bars indicate ± s.e.m., ***p<0.001, **p<0.01, and NS means no significant difference.
Figure 4 with 1 supplement

Pr5-HT1B mediates hemocyte phagocytosis.
(A) Dose-response profiles for the effects of Pr5-HT1B blocker SB 216641 on hemocyte phagocytosis. Data are from three independent experiments that each consists of cells from ten fifth-instar larvae. (B) Confirmation of knock-down effect of Pr5-HT1B by real-time PCR. The P. rapae 18s rRNA gene was used as an internal reference gene (n = 4). (C) Western blot analysis of knock-down effect of Pr5-HT1B. β-actin was used to show equal protein loading. (D-E) Effect of siPr5-HT1B on hemocyte phagocytosis was visualized by florescence microscope. (F) Quantification of siPr5-HT1B effect on hemocyte phagocytosis. Data are from three independent experiments that each consists of cells from ten fifth-instar larvae. One-way ANOVA followed by Tukey’s multiple comparison test for A; two-tailed t-test for B and F. Error bars indicate ± s.e.m., ***p<0.001, **p<0.01.
Figure 4—figure supplement 1
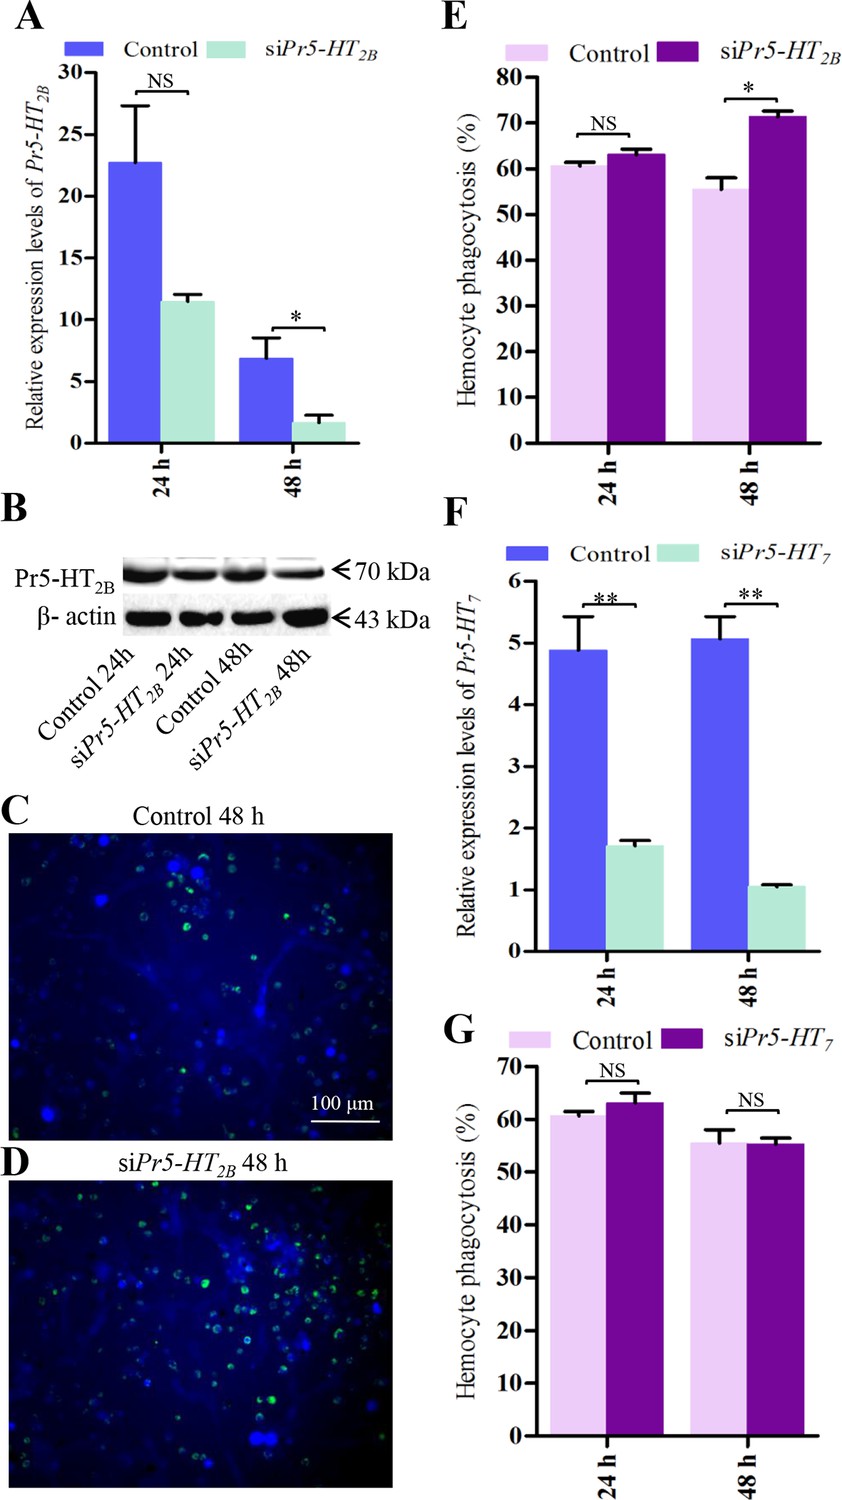
Effect of siPr5-HT2B and siPr5-HT7 on hemocyte phagocytosis.
(A) Confirmation of knock-down effect of Pr5-HT2B by real-time PCR. The P. rapae 18s rRNA gene was used as an internal reference gene (n = 3). (B) Western blot analysis of knock-down effect of Pr5-HT2B. β-actin was used to show equal protein loading. (C-D) Effect of siPr5-HT2B on hemocyte phagocytosis was visualized by florescence microscope. (E) Quantification of siPr5-HT2B effect on hemocyte phagocytosis (n = 3). (F) Confirmation of knock-down effect of Pr5-HT7 by real-time PCR. The P. rapae 18s rRNA gene was used as an internal reference gene (n= 3). (G) Quantification of siPr5-HT7 effect on hemocyte phagocytosis (n = 3). Two-tailed t-test for A, E, F and G. Error bars indicate ± s.e.m., ***p<0.001, **p<0.01, *p<0.05, and NS means no significant difference.
Figure 5
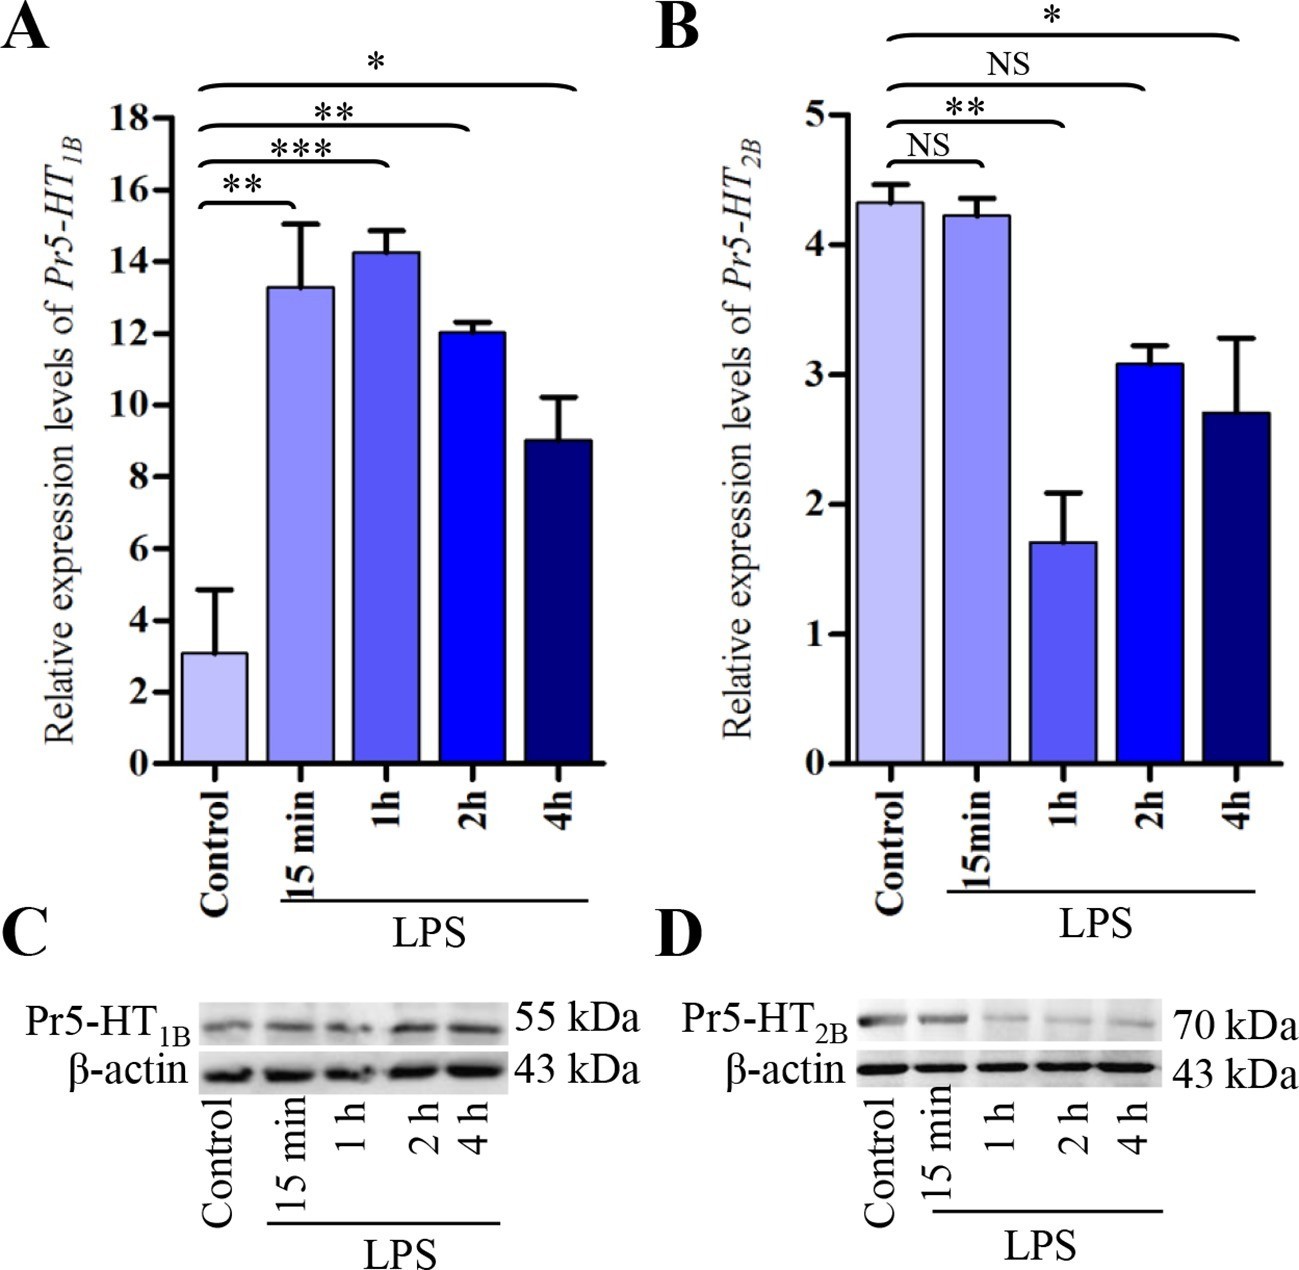
Expression analysis of Pr5-HT1B and Pr5-HT2B in naïve and LPS-induced hemocytes.
(A–B) Relative expression of Pr5-HT1B and Pr5-HT2B were quantified by q-PCR. The P. rapae 18s rRNA gene was used as an internal reference (n = 3). (C–D) Western blot analysis of Pr5-HT1B and Pr5-HT2B in naive and LPS-induced hemocytes. β-actin was used to show equal protein loading. One-way ANOVA followed by Tukey’s multiple comparison test for A and B. Error bars indicate ± s.e.m., ***p<0.001, **p<0.01, *p<0.05, and NS means no significant difference.
Figure 6
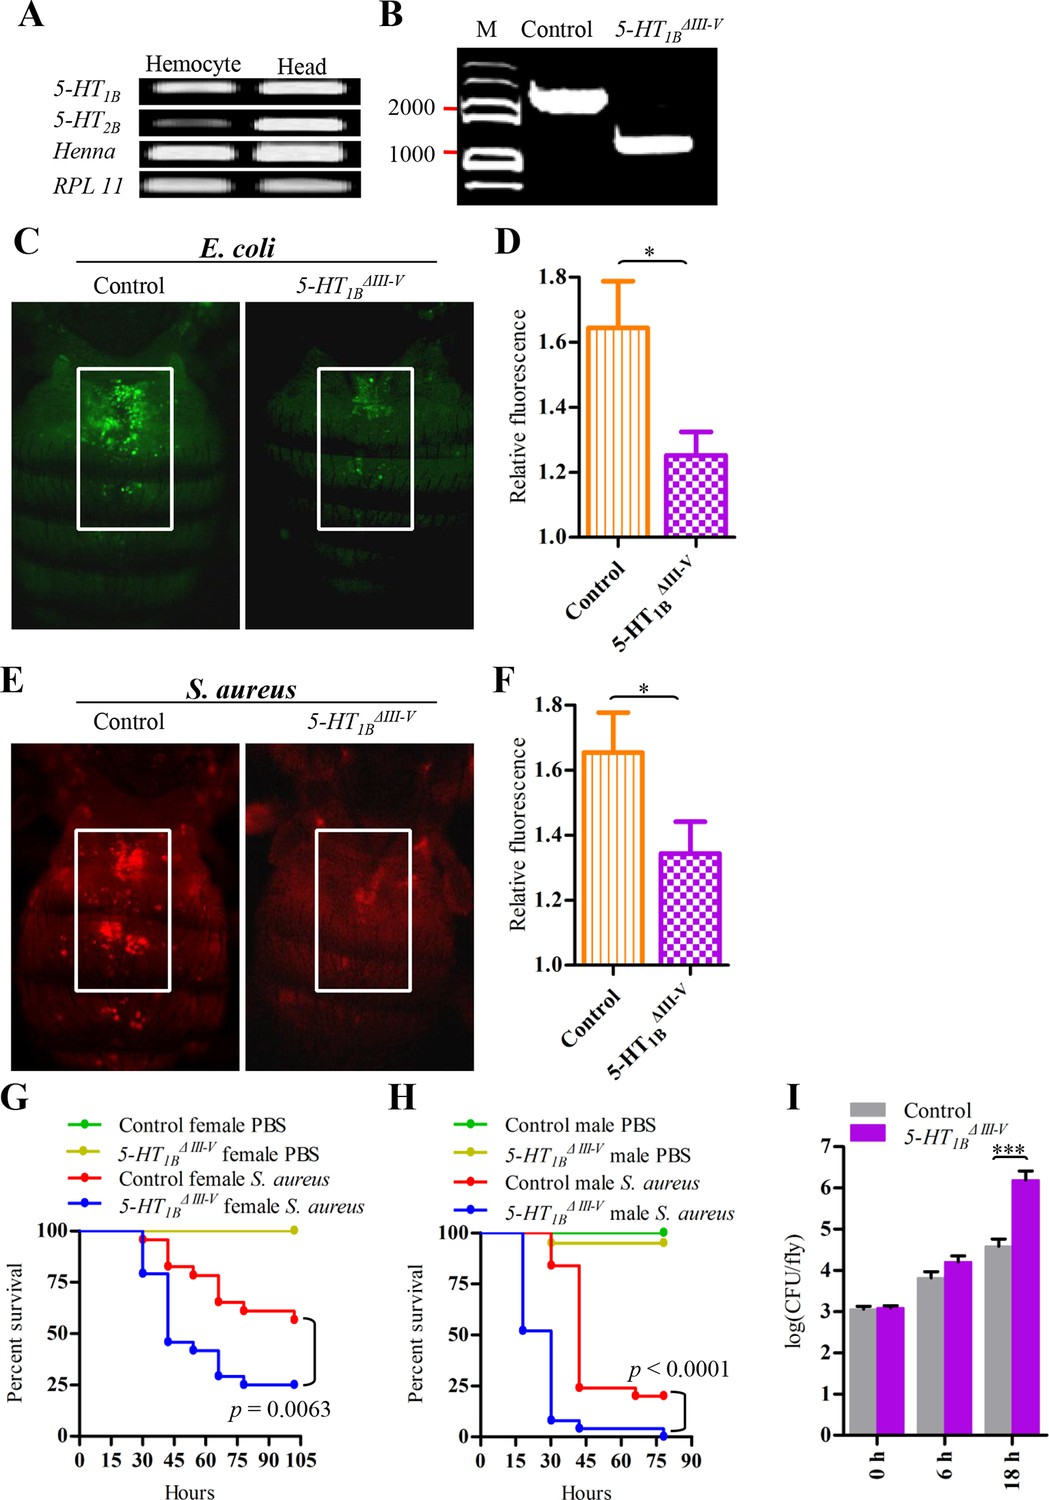
5-HT1B is required for microbial phagocytosis and plays an important role in the Drosophila defense against S. aureus infection.
(A) 5-HT1B, 5-HT2B and TPH are expressed in Drosophila naive hemocytes. RPL11 was used as an internal reference gene. Data are representatives of three independent experiments. (B) Genomic PCR of 5-HT1B control and 5-HT1BΔIII-V flies. Data are representatives of three independent experiments. (C) Representative pictures depicting phagocytosis in 5-HT1B control and 5-HT1BΔIII-V flies of fluorescein-labeled E. coli bioparticles. (D) Quantification of in vivo phagocytosis of E. coli. Approximately 10 flies per genotype were used in each experiment. Data are representatives of three independent experiments. (E) Representative pictures depicting phagocytosis in 5-HT1B control and 5-HT1BΔIII-V flies of fluorescein-labeled S. aureus bioparticles. (F) Quantification of in vivo phagocytosis of S. aureus. Approximately eight flies per genotype were used in each experiment. Data are representatives of three independent experiments. (G-H) Representative survival curves of female (G) and male (H) 5-HT1B control and 5-HT1BΔIII-V flies after injection of S. aureus (optical density [OD] 0.4). n = 20–25 flies. Experiments were performed in triplicate. (I) Comparison of the S. aureus (OD 0.4) recovered in 5-HT1B control and 5-HT1BΔIII-V flies 0, 6, and 18 hr post infection. Bacterial load was measured in eight individual female flies per genotype at each time point in each experiment. Two-tailed t-test for D, F and I. Error bars indicate ± s.e.m., ***p<0.001, **p<0.01, *p<0.05.
Figure 7
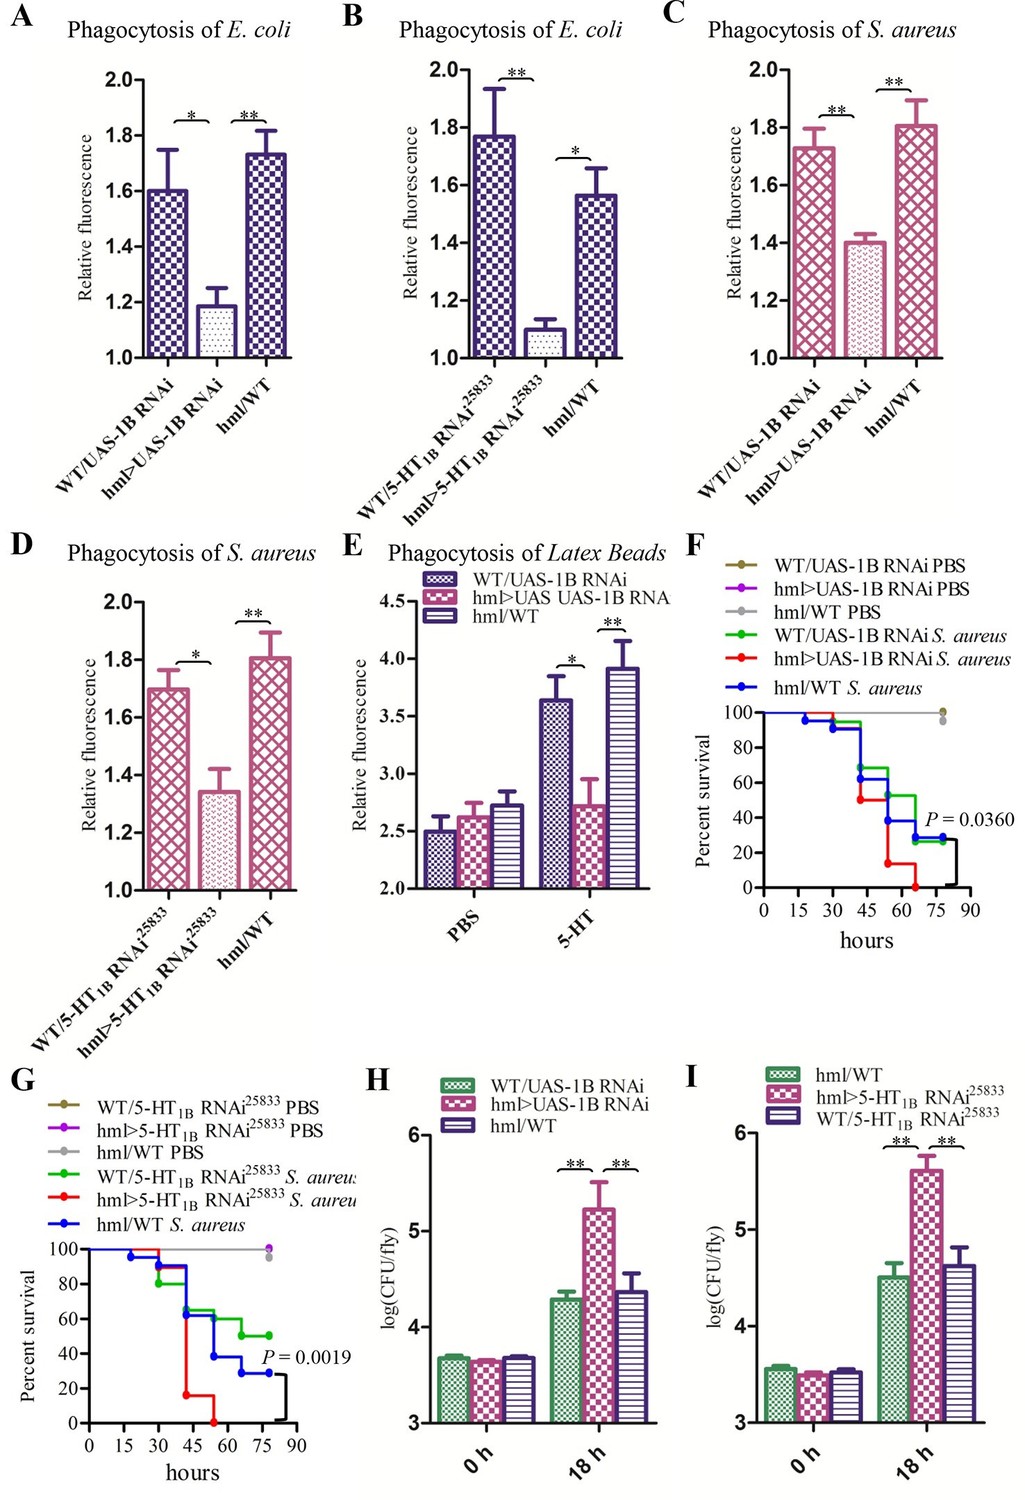
Knockdown of 5-HT1B in hemocytes affects Drosophila phagocytosis and survival.
(A) Quantification of in vivo phagocytosis of E. coli in WT/UAS-1B RNAi, hml> UAS-1B RNAi and hml/WT flies. Approximately six flies per genotype were used in each experiment. Experiments were performed twice, (B) Quantification of in vivo phagocytosis of E. coli in WT/UAS-5-HT1B RNAi25833, hml>UAS-5-HT1B RNAi25833, and hml/WT flies. Approximately six flies per genotype were used in each experiment. Experiments were performed twice. (C) Quantification of in vivo phagocytosis of S. aureus in WT/UAS-1B RNAi, hml> UAS-1B RNAi, and hml/WT flies. Approximately six flies per genotype were used in each experiment. Experiments were performed twice, (D) Quantification of in vivo phagocytosis of S. aureus in WT/UAS-5-HT1B RNAi25833, hml>UAS-5-HT1B RNAi25833, and hml/WT flies. Approximately six flies per genotype were used in each experiment. Experiments were performed twice. (E) Quantification of in vivo phagocytosis of red fluorescently labeled latex beads in WT/UAS-1B RNAi, hml>UAS-1B RNAi, and hml/WT flies after a 30 min preinjection of either PBS or 1μg/μl 5-HT. Approximately six flies per genotype were used in each experiment. Experiments were done twice, (F) Representative survival curves of WT/UAS-1B RNAi, hml>UAS-1B RNAi, and hml/WT male flies after injection of S. aureus. n=19–22 flies. Data are representatives of three independent experiments. Each experiment was performed in triplicate. (G) Representative survival curves of WT/UAS-5-HT1B RNAi25833, hml>UAS-5-HT1B RNAi25833, and hml/WT male flies after injection of S. aureus. n=19–21 flies. Data are representatives of two independent experiments. Each experiment was performed in triplicate. (H) Comparison of the S. aureus (OD 0.4) recovered in WT/UAS-1B RNAi, hml>UAS-1B RNAi and hml/WT flies 0, and 18 hr post infection. Bacterial load was measured in eight individual male flies per genotype at each time point in each experiment. Experiments were performed in triplicate. (I) Comparison of the S. aureus (OD 0.4) recovered in WT/UAS-5-HT1B RNAi25833, hml>UAS-5-HT1B RNAi25833, and hml/WT flies 0 and 18 hr post infection. Bacterial load was measured in eight individual male flies per genotype at each time point in each experiment. Experiments were performed in triplicate. One-way ANOVA followed by Tukey’s multiple comparison test for A, B, C, D, E, H, and I. Error bars indicate ± s.e.m., ***p<0.001, **p<0.01, *p<0.05.
Figure 8
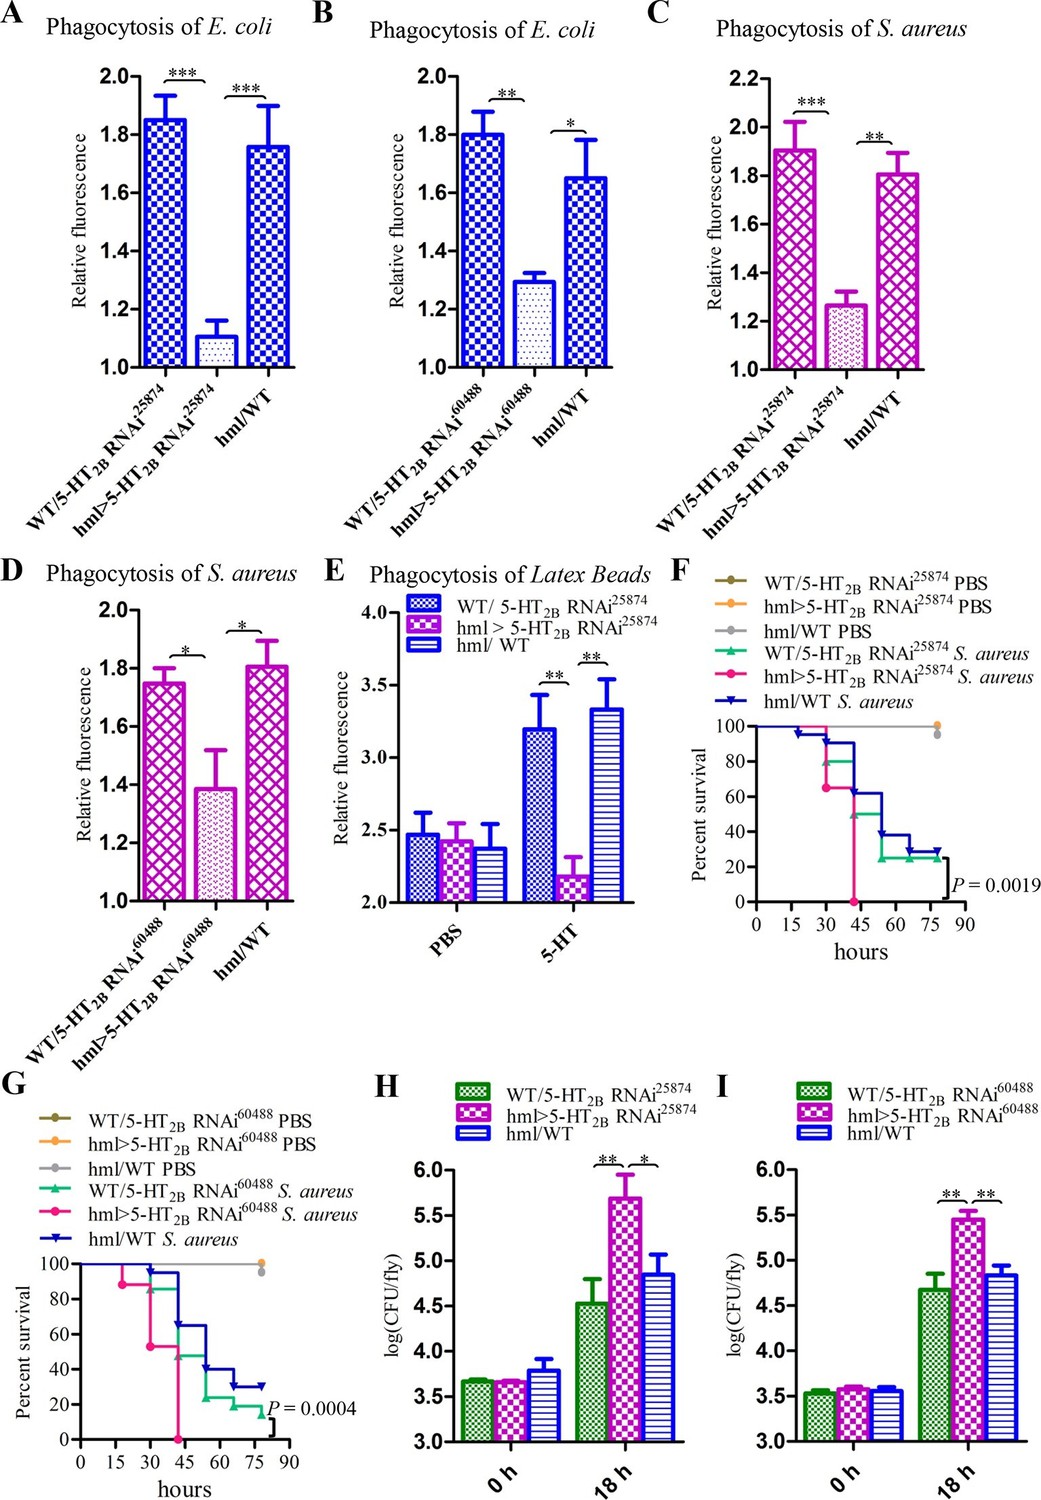
Knockdown of 5-HT2B in hemocytes affects Drosophila phagocytosis and survival.
(A) Quantification of in vivo phagocytosis of E. coli in WT/UAS-5-HT2B RNAi25874, hml>UAS-5-HT2B RNAi25874, and hml/WT flies. Approximately six flies per genotype were used in each experiment. Experiments were performed twice, (B) Quantification of in vivo phagocytosis of E. coli in WT/UAS-5-HT2B RNAi60488, hml>UAS-5-HT2B RNAi60488, and hml/WT flies. Approximately six flies per genotype were used in each experiment. Experiments were performed twice. (C) Quantification of in vivo phagocytosis of S. aureus in WT/UAS-5-HT2B RNAi25874, hml>UAS-5-HT2B RNAi25874, and hml/WT flies. Approximately six flies per genotype were used in each experiment. Experiments were performed twice, (D) Quantification of in vivo phagocytosis of S. aureus in WT/UAS-5-HT2B RNAi60488, hml> UAS-5-HT2B RNAi60488, and hml/WT flies. Approximately six flies per genotype were used in each experiment. Experiments were performed twice. (E) Quantification of in vivo phagocytosis of red fluorescently labeled latex beads in WT/UAS-5-HT2B RNAi25874, hml> UAS-5-HT2B RNAi25874, and hml/WT flies after a 30 min preinjection of either PBS or 1μg/μl 5-HT. Approximately six flies per genotype were used in each experiment. Experiments were done twice. (F) Representative survival curves of WT/UAS-5-HT2B RNAi25874, hml> UAS-5-HT2B RNAi25874, and hml/WT male flies after injection of S. aureus. n=20–21 flies. Data are representatives of two independent experiments. Each experiment was performed in triplicate. (G) Representative survival curves of WT/UAS-5-HT2B RNAi60488, hml>UAS-5-HT2B RNAi60488, and hml/WT male flies after injection of S. aureus. n=19–21 flies. Data are representatives of two independent experiments. Each experiment was performed in triplicate. (H) Comparison of the S. aureus (OD 0.4) recovered in WT/UAS-5-HT2B RNAi25874, hml>UAS-5-HT2B RNAi25874, and hml/WT flies 0, and 18 hr post infection. Bacterial load was measured in eight individual male flies per genotype at each time point in each experiment. Experiments were performed in triplicate. (I) Comparison of the S. aureus (OD 0.4) recovered in WT/UAS-5-HT2B RNAi60488, hml>UAS-5-HT2B RNAi60488, and hml/WT flies 0, and 18 hr post infection. Bacterial load was measured in eight individual male flies per genotype at each time point in each experiment. Experiments were performed in triplicate. One-way ANOVA followed by Tukey’s multiple comparison test for A, B, C, D, E, H, and I. Error bars indicate ± s.e.m., ***p<0.001, **p<0.01, *p<0.05.
Figure 9

A schematic diagram of serotonin signaling on hemocyte phagocytosis.
LPS enhances the expression of TPH, which catalyzes tryptophan into 5-HT via 5-HTP. 5-HT, which secreted from hemocytes, activates the hemocyte-membrane receptor 5-HT1B and 5-HT2B. The immune responses of P. rapae are labeled in purple: activation of 5-HT1B promotes hemocyte phagocytosis and activation of 5-HT2B lead to opposite effects. LPS increases 5-HT1B expression but decreases that of 5-HT2B. The immune responses of Drosophila are labeled in green arrows: activation of 5-HT1B promotes hemocyte phagocytosis and activation of 5-HT2B lead to the same effects.
Additional files
-
Supplementary file 1
Primers used in this research article and siRNA sequence are presented.
- https://doi.org/10.7554/eLife.12241.016
Download links
A two-part list of links to download the article, or parts of the article, in various formats.
Downloads (link to download the article as PDF)
Open citations (links to open the citations from this article in various online reference manager services)
Cite this article (links to download the citations from this article in formats compatible with various reference manager tools)
Serotonin modulates insect hemocyte phagocytosis via two different serotonin receptors
eLife 5:e12241.
https://doi.org/10.7554/eLife.12241


