Mutation in ATG5 reduces autophagy and leads to ataxia with developmental delay
- University of Michigan, United States
- St Jude Children's Research Hospital, United States
- Howard Hughes Medical Institute, St. Jude Children's Research Hospital, United States
- Boğaziçi University, Turkey
- Hungarian Academy of Sciences, Hungary
- Eötvös Loránd University, Hungary
- Istanbul University, Turkey
Figures
Figure 1
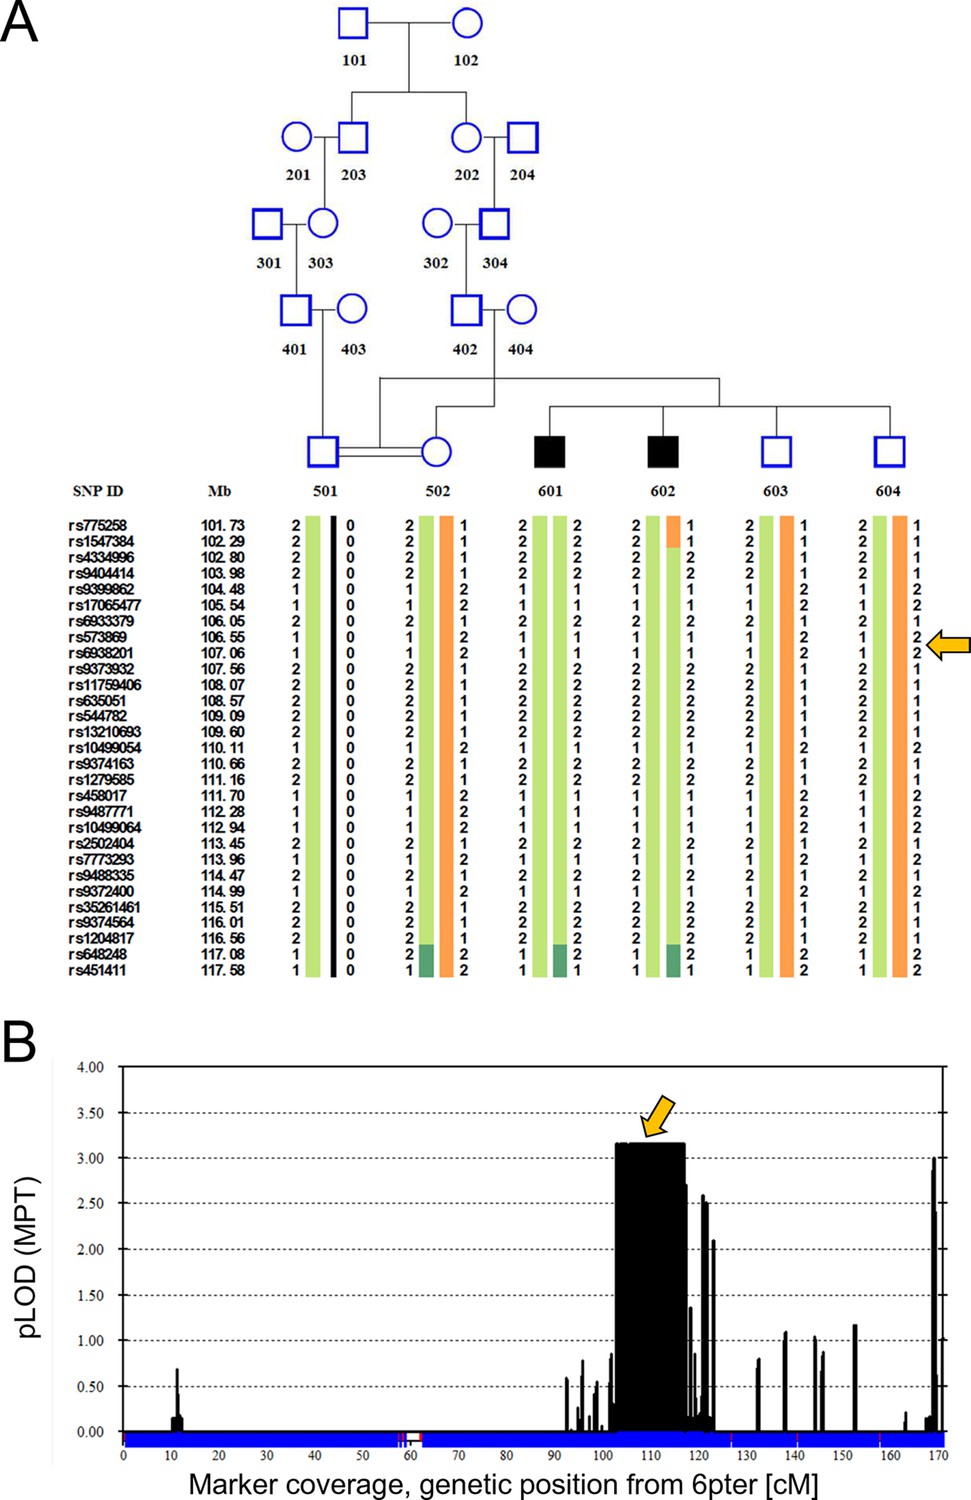
Linkage analysis in consanguineous family with two siblings with ataxia, mental retardation and developmental delay maps defect to chromosomal interval containing ATG5.
Remote consanguinity was detected between parents of two previously described siblings having ataxia (Yapici and Eraksoy, 2005), illustrated here as third cousins. SNP and linkage results for chromosome 6 (B) are illustrated below the pedigree (A). The shared homozygous region lies between rs4334996 and rs1204817, encompassing ATG5 at 106.6 Mb. Father (501)’s alleles were inferred, 0 denotes unknown alleles. Affected siblings, 601 and 602, are denoted by black squares and unaffected family members by open symbols. The proximal boundary is defined by a recombination event between rs1547384 and rs4334996 in affected individual 602, while the distal boundary is defined as an ancestral recombination event (lack of homozygosity, dark green) between rs1204817 and rs648248. Orange arrows indicate the position of ATG5.
Figure 2
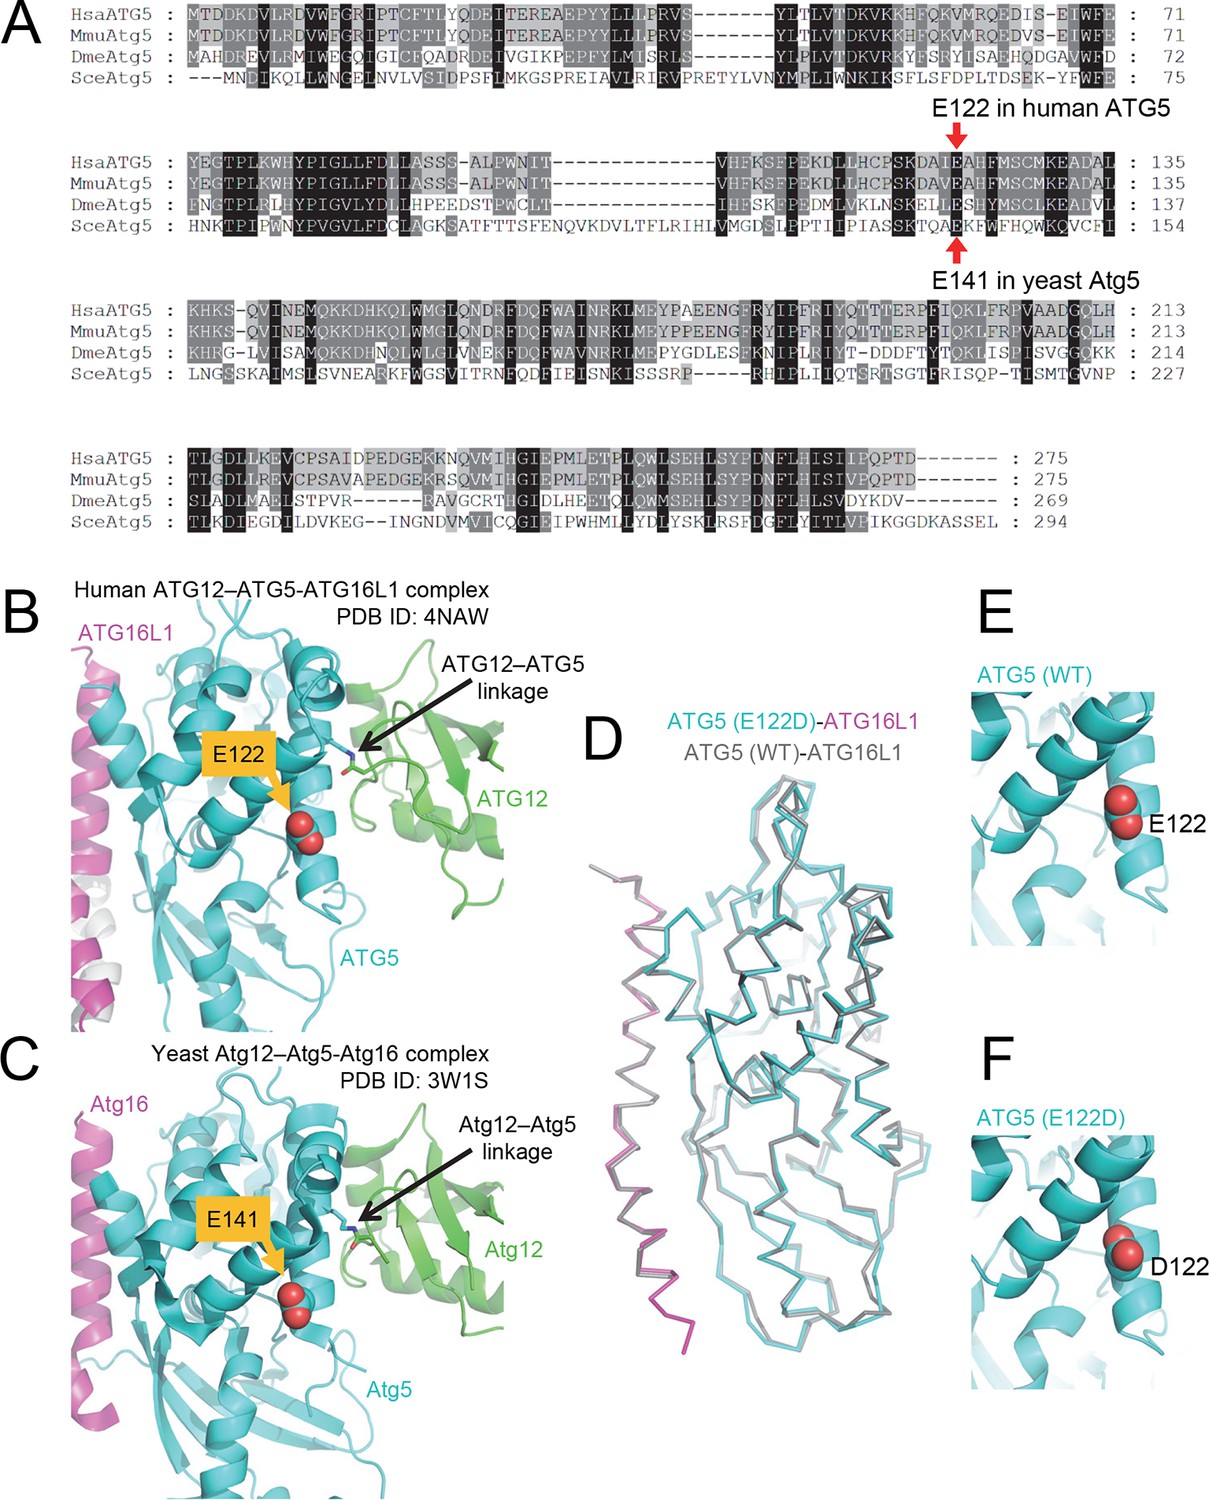
The primary sequence of ATG5, including the mutant E122 residue, as well as the protein structure is highly conserved across eukaryotic species.
(A) Amino acid sequence alignment between ATG5 orthologs from human (HsaATG5), mouse (MmuAtg5), Drosophila melanogaster (DmeAtg5) and Saccharomyces cerevisiae (SceAtg5) was constructed at GenomeNet (Kyoto University Bioinformatics Center) through CLUSTALW and rendered in Genedoc v.2.7 using default settings. E122 in human ATG5 and E141 in yeast Atg5, which are homologous residues, are indicated by red arrows. (B) Location of E122 residue is highlighted in yellow on the crystal structure of a human ATG12 (residues 53–140)–ATG5 -ATG16L1 (residues 11–43) complex (PDB ID: 4NAW). ATG5 is shown in cyan, ATG16L1 in magenta, and ATG12 in green (Otomo et al., 2013). (C) Location of the E141 residue in yeast Atg5, which corresponds to the E122 in human ATG5, is indicated in yellow on the crystal structure of a yeast Atg12 (100–186)–Atg5 -Atg16 (1–46) complex, colored as for the human counterparts as in panel B (PDB ID: 3W1S) (Noda et al., 2013). (D) Superimposition of crystal structure of ATG5E122D-ATG16L1 with ATG5WT-ATG16L1 (PDB: 4TQ0) (Kim et al., 2015a). Close-up view of ATG5 structure around WT (E) and E122D (F) mutation.
Figure 3

Cells from ataxia patients with ATG5E122D/E122D mutation exhibit autophagy defects.
(A) Decreased expression of ATG12–ATG5 conjugates in cells from ataxia patients with ATG5E122D/E122D mutation. ATG5 immunoblotting (IB) of ATG12–ATG5 conjugates of LCLs from individuals whose ATG5 genotype corresponds to wild type (A to I) or E122D (J and K). (B) Decreased autophagic flux in ATG5E122D/E122D LCL cells. A subset of LCLs from (A) were treated with 0.1 μM bafilomycin A1 (Baf) for the indicated hours and analyzed by IB. LC3-II is an autophagosome marker, and LC3-I is a precursor for LC3-II. Baf inhibits lysosomal degradation of LC3-II. Actin is shown as a loading control. (C) Decreased autophagic flux and increased expression of SQSTM1, an autophagy substrate, in ATG5E122D/E122D LCL cells. A subset of LCLs from (A) were treated with 250 nM Torin 1 or 0.1 μM Baf, for 2 hr and analyzed by IB. Torin 1 is an autophagic flux activator.
Figure 4
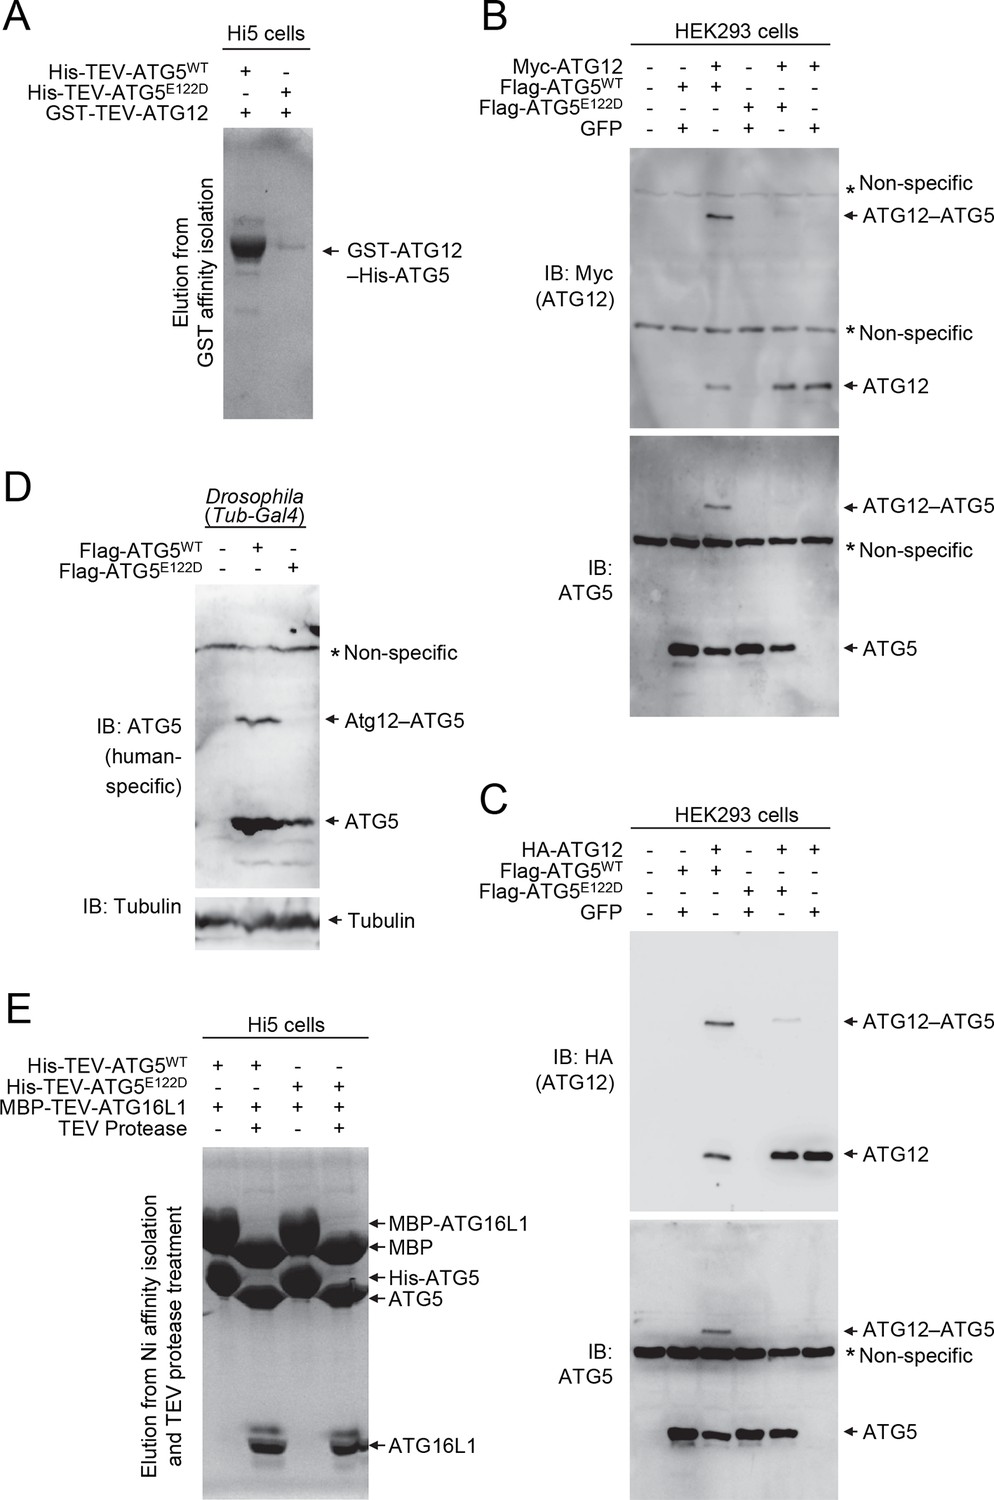
E122D mutation interferes with formation of the ATG12–ATG5 conjugate.
(A) Coomassie Blue-stained SDS-PAGE gel following glutathione affinity purification from lysates of Hi5 cells infected with baculoviruses expressing GST-ATG12 and either WT or E122D mutant ATG5. (B and C) HEK293 cells expressing the indicated proteins were analyzed by IB. (D) Drosophila whole bodies expressing the indicated transgenes under the control of Tub-Gal4 were analyzed by IB. (E) Lysates from Hi5 cells expressing the indicated proteins were subjected to His/Ni-NTA purification and subsequent TEV protease treatment. Proteins were analyzed by Coomassie Blue staining.
Figure 5
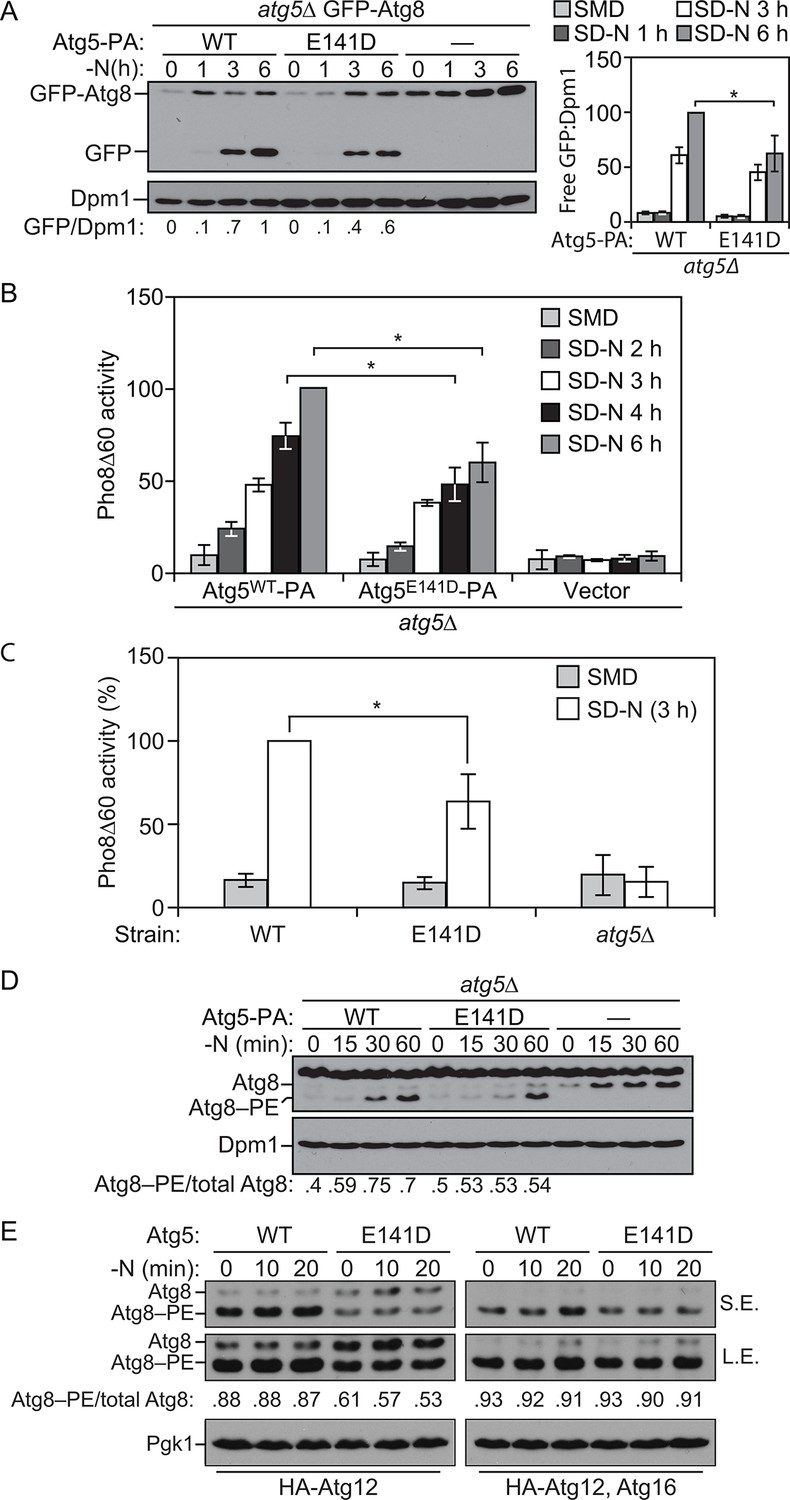
E141D mutation of yeast Atg5 attenuates autophagy.
(A-D) Yeast cells were grown in SMD to mid-log phase and nitrogen starved for the indicated times. (A) WLY176 atg5∆ yeast cells expressed GFP-Atg8 through its endogenous promoter and plasmid-based Atg5WT-PA, Atg5E141D-PA or an empty vector. Protein extracts were analyzed for GFP-Atg8 processing by western blot. The ratio of free GFP to Dpm1 (loading control) is presented below the blots, and quantification is presented on the right (Student’s t test, n=4; *p < 0.05); the value for Atg5WT at 6 hr was set to 1.0 and other values were normalized. (B) WLY176 atg5∆ yeast cells expressed either plasmid-based Atg5WT-PA, Atg5E141D-PA or an empty vector. Protein extracts were used to measure autophagy through the Pho8Δ60 assay (Student’s t test, n=6; *p < 0.05). (C) WLY176 cells with genomic integrated Atg5WT or Atg5E141D were used to generate protein extracts and autophagy was monitored through the Pho8Δ60 assay (Student’s t test, n=3; *p < 0.05). (D) WLY176 atg5∆ yeast cells expressing plasmid-based Atg5WT-PA, Atg5E141D-PA or an empty vector were used to generate protein extracts. The ratio of Atg8–PE to total Atg8 is presented below the blots based on western blot using antiserum to Atg8. Dpm1 was used as a loading control. (E) MKO ATG3 (YCY137) cells were co-transformed with pATG8∆R-ATG7-ATG10(414), and either pATG5WT-HA-ATG12(416), pATG5E141D-HA-ATG12(416), pATG5WT-HA-ATG12-ATG16(416), or pATG5E141D-HA-ATG12-ATG16(416). Overnight cultures were diluted to OD=0.02 in SMD -Ura -Trp. The cells were incubated at 30°C for 18 hr to mid-log phase before they were shifted to SD-N for nitrogen starvation. Samples at the corresponding time points were collected, TCA precipitated and subsequently analyzed by western blot. S.E., short exposure; L.E., long exposure.
Figure 6
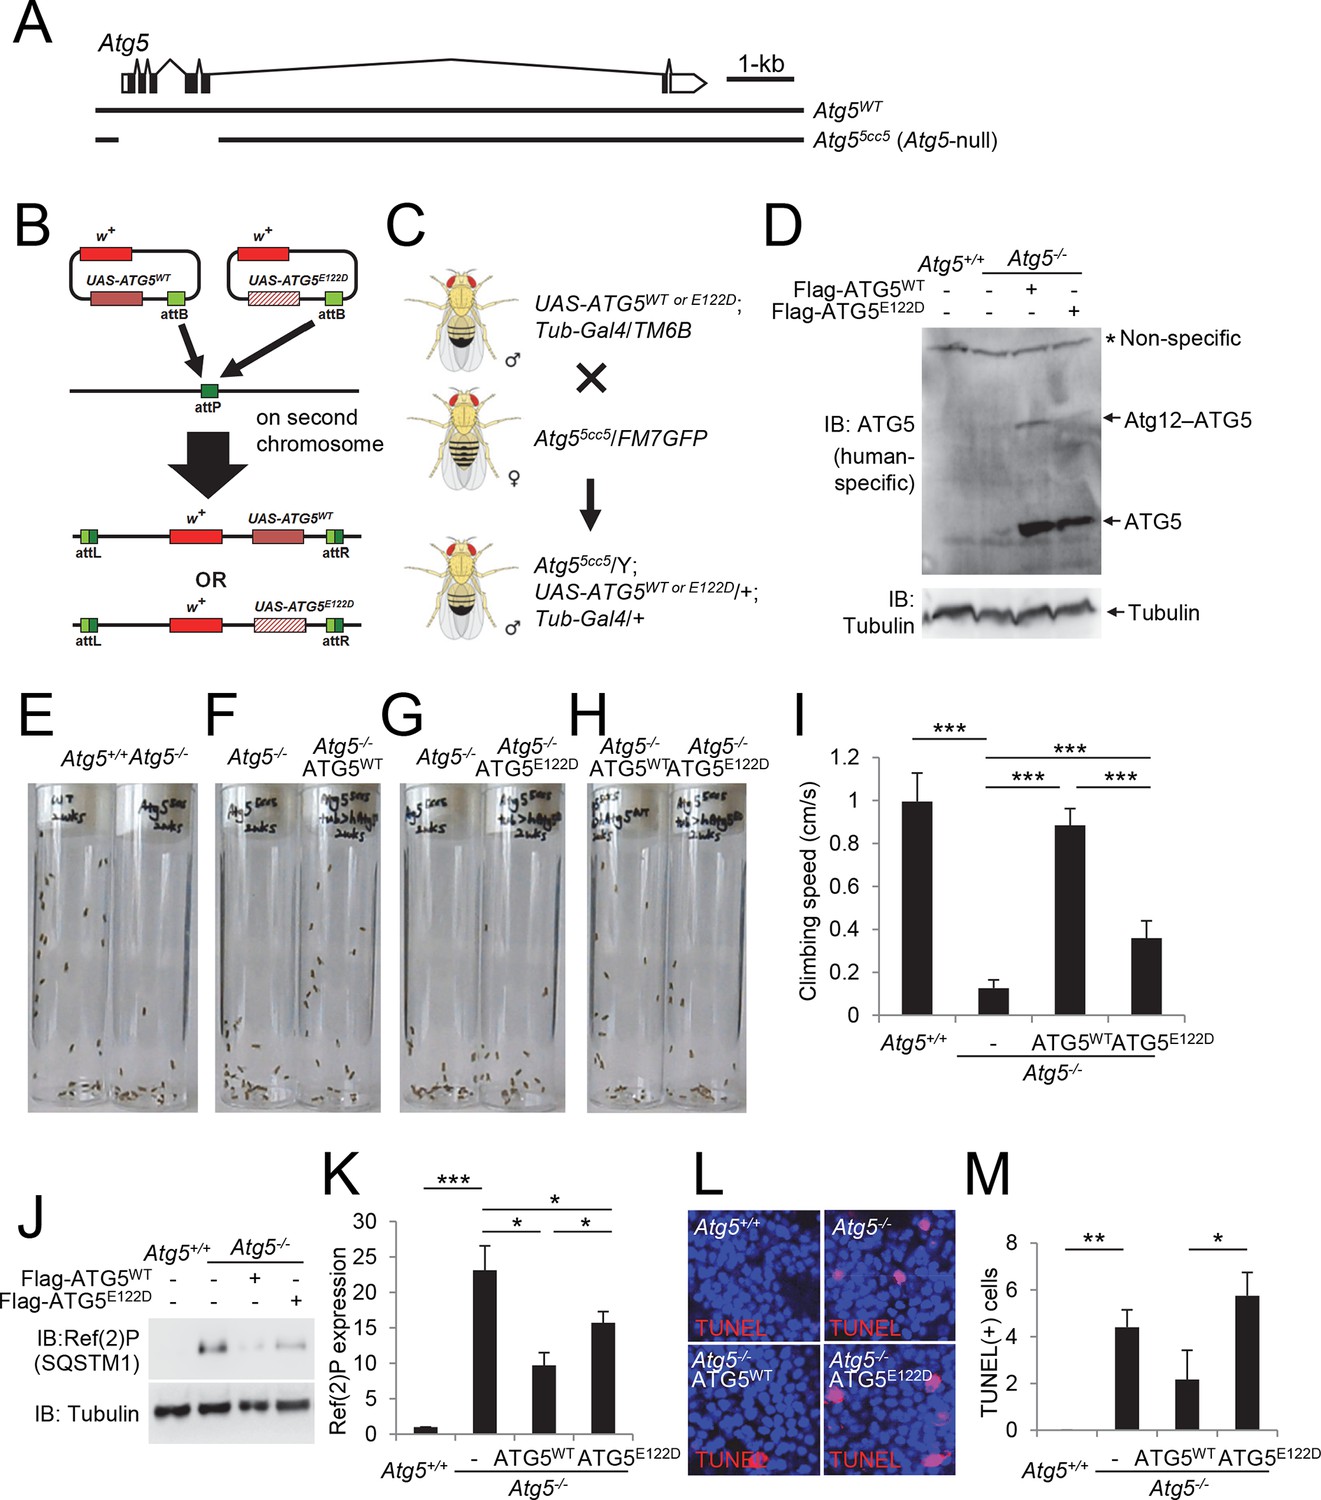
Ataxic phenotype of Atg5-null flies is suppressed by human ATG5WT but not by ATG5E122D.
(A) Genomic organization of the Atg5 locus and the Atg5-null mutant (Atg55cc5). Atg55cc5 mutants have a CRISPR-Cas9-mediated deletion in approximately 1.5 kb residues that eliminate more than 85% of Atg5-coding sequences including the translation start site. Open boxes, untranslated exons; closed boxes, protein-coding exons. Scale bar, relative length of 1 kb genomic span. (B) Schematic representation of how ATG5 transgenic flies were made. Plasmid which can express wild-type or E122D-mutated human ATG5 was inserted into an identical genomic location (the attP site) through phiC31-mediated recombination (Bateman et al., 2006; Bischof et al., 2007; Venken et al., 2006). The scheme was adapted from a previous publication (Kim and Lee, 2015). (C) Genetic scheme of how ATG5 transgenes were placed into the Atg5-null mutant flies. Atg5, UAS-ATG5 and Tub-Gal4 loci are on the X-chromosome, second chromosome and third chromosome, respectively. (D) Whole flies of indicated genotypes were analyzed by IB. (E to H) Photographs of the vials containing 2-week-old adult male flies of indicated genotypes taken at 3 sec after negative geotaxis induction: (E) Atg5-null flies exhibit severely impaired mobility. (F) Ataxic phenotype of Atg5-null flies is complemented by human ATG5WT expression. (G and H) Human ATG5E122D is less capable than human ATG5WT in suppressing the fly ataxia phenotype. (I) Quantification of the climbing speeds of 2-week-old adult male flies (n≥20) of the indicated genotype. Climbing speed is presented as mean ± standard deviation (n=5). P values were calculated using the Student’s t test (***p<0.001). (J) Drosophila heads from two-weeks-old flies of the indicated genotypes were analyzed by IB. (K) Ref(2)P [p62] is an autophagy substrate. Relative protein expression was measured by densitometry and presented in a bar graph (mean ± standard error; n=4). (L) Terminal deoxynucleotidyl transferase dUTP nick end labeling (TUNEL) of Drosophila brain (middle layer of the medial compartment). (M) TUNEL-positive cells per field were quantified and presented in a bar graph (mean ± standard error; n≥5). K and M: P values were calculated using the Student’s t test (*p<0.05, **p<0.01, ***p<0.001).
Videos
Video 1
Climbing assay in 2 weeks-old wild-type flies (left) and Atg5-null flies (right).
https://doi.org/10.7554/eLife.12245.010
Video 2
Climbing assay in 2 weeks-old Atg5-null flies (left) and Atg5-null flies expressing ATG5WT (right).
https://doi.org/10.7554/eLife.12245.011
Video 3
Climbing assay in 2 weeks-old Atg5-null flies (left) and Atg5-null flies expressing ATG5E122D (right).
https://doi.org/10.7554/eLife.12245.012
Video 4
Climbing assay in 2 weeks-old Atg5-null flies expressing ATG5WT (left) or ATG5E122D (right).
https://doi.org/10.7554/eLife.12245.013Tables
Table 1
Crystallography data collection and refinement statistics.
| Data collection | |
|---|---|
| Beam line | APS 24-ID-C |
| Space group | C2 |
| Unit cell parameters | |
| a, b, c (Å) | 217.1, 84.5, 151.9 |
| α, β, γ (°) | 90, 133.8, 90 |
| Resolution (Å) (highest shell) | 50–3.0 (3.12-3.0) |
| Wavelength (Å) | 0.9792 |
| Number of measured reflections | 179,310 |
| Number of unique refections | 39,496 |
| Overall Rsym | 0.057 (0.645) |
| Completeness (%) | 98.9 (99.3) |
| Overall I/σI | 14.3 (2.3) |
| Multiplicity | 4.5 |
| Refinement | |
| Resolution (Å) | 50–3.0 |
| Rwork/Rfree | 0.198/0.244 |
| rmsd bond lengths (Å) | 0.008 |
| rmsd bond angles (°) | 0.994 |
| Number of protein atoms | 9403 |
| Ramachandran statistics | |
| Preferred (%) | 97.69 |
| Allowed (%) | 2.22 |
| Disallowed (%) | 0.09 |
Download links
A two-part list of links to download the article, or parts of the article, in various formats.
Downloads (link to download the article as PDF)
Open citations (links to open the citations from this article in various online reference manager services)
Cite this article (links to download the citations from this article in formats compatible with various reference manager tools)
Mutation in ATG5 reduces autophagy and leads to ataxia with developmental delay
eLife 5:e12245.
https://doi.org/10.7554/eLife.12245


