Structural basis for activation, assembly and membrane binding of ESCRT-III Snf7 filaments
- Cornell University, United States
Figures
Figure 1 with 3 supplements
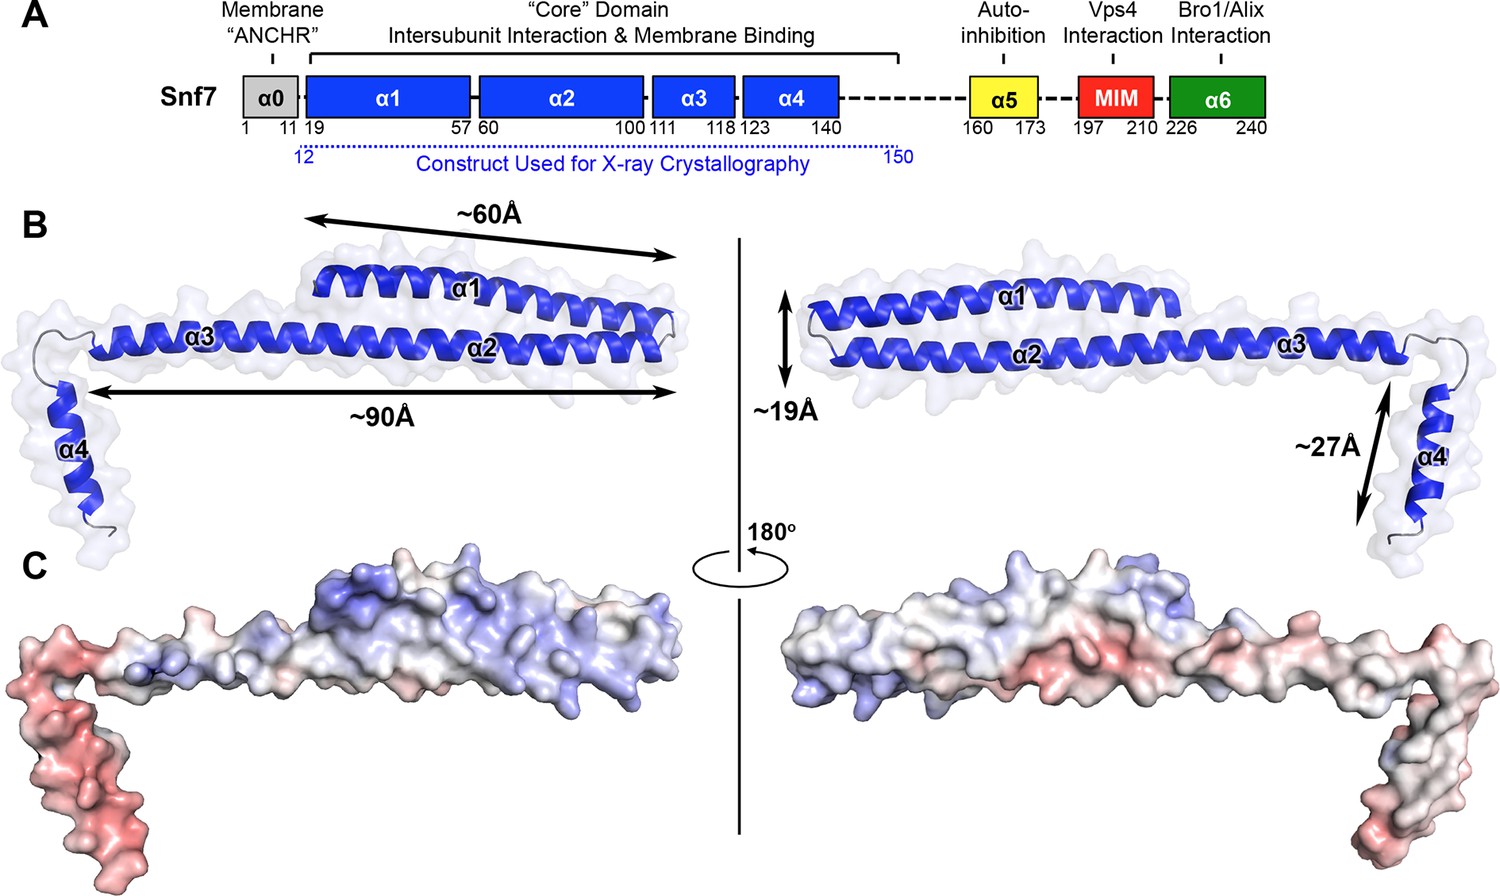
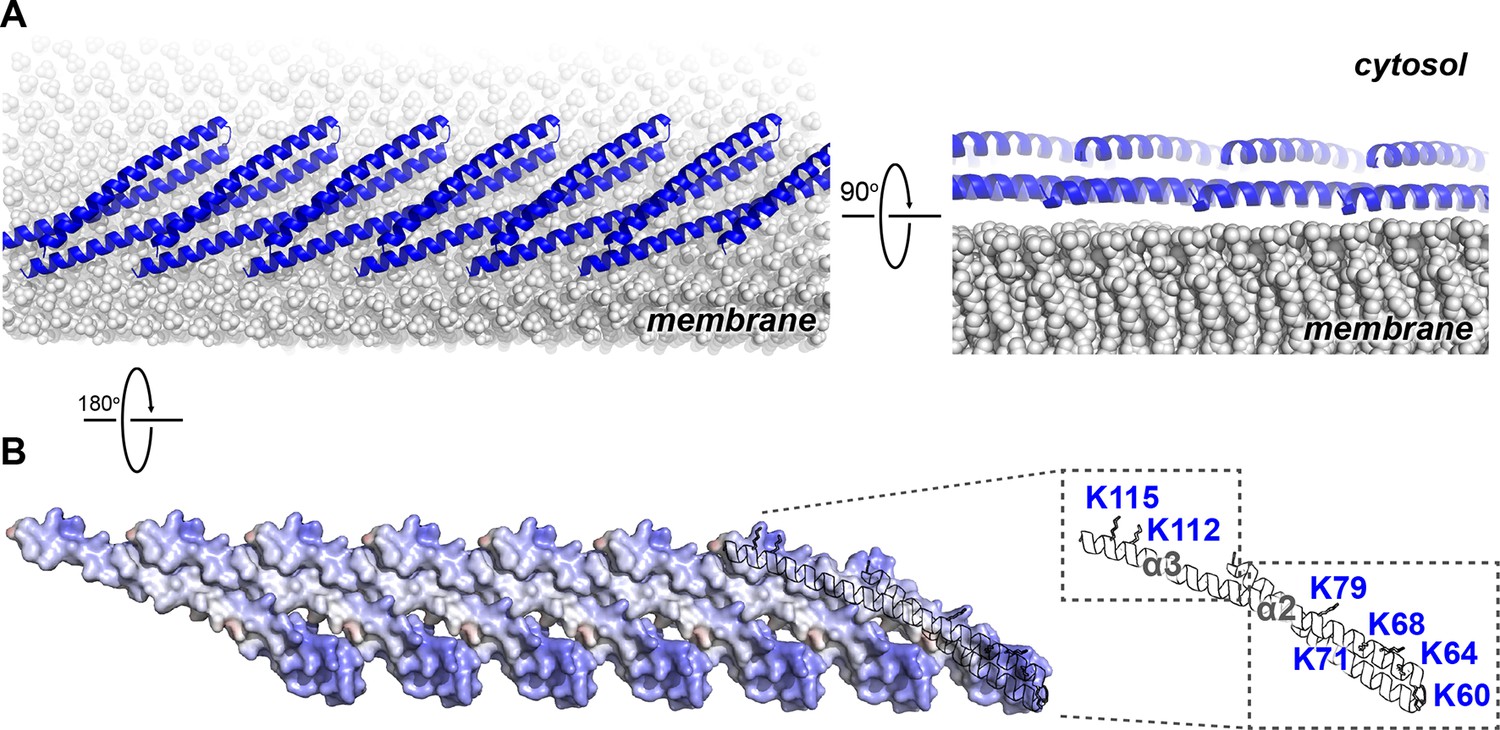
X-ray Crystal Structure of Snf7core
(A) The domain organization of Snf7. The core domain used for X-ray crystallography is shown in blue. (B) Overlay of ribbon and space-filling models of the X-ray crystal structure of Snf7core. (C) Electrostatic surface potential of Snf7core with positively charged regions in blue (+10kcal/e-) and negatively charged regions in red (-10kcal/e-). See also Table 1.
Figure 1—figure supplement 1
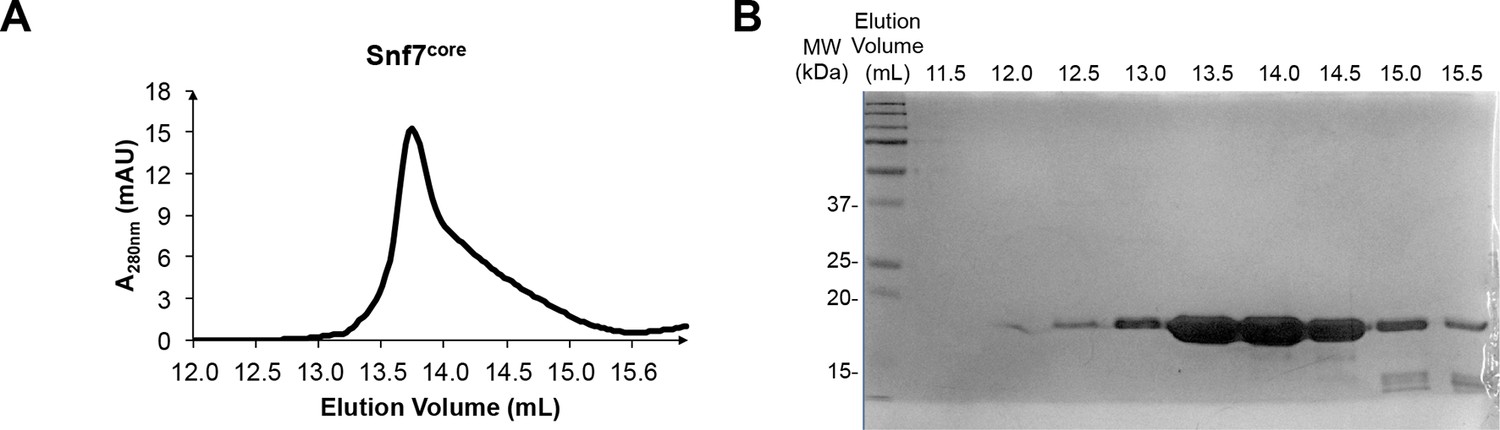
Protein purification of Snf7core
(A) A superdex-200 gel filtration size exclusion chromatogram of Snf7core. (B) A SDS-PAGE Coomassie brilliant blue staining of the gel filtration fractions corresponding to Snf7core.
Figure 1—figure supplement 2
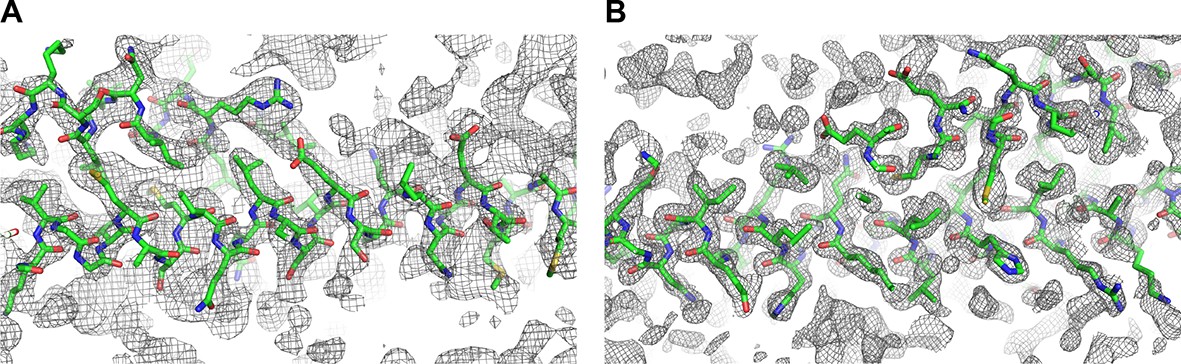
2Fc-Fo simulated-annealing composite-omit electron density maps contoured at 1.0σ of Snf7core open conformations (A) A and (B) B.
https://doi.org/10.7554/eLife.12548.005
Figure 1—figure supplement 3
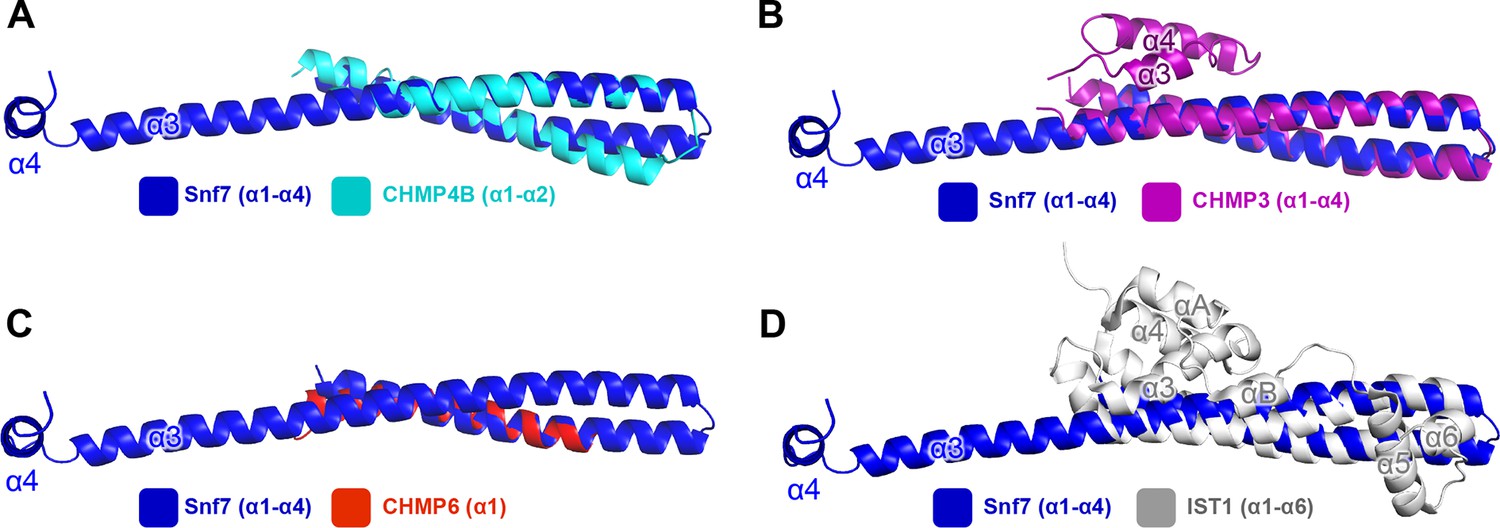
Superimposing Snf7core (blue) with (A) CHMP4Bα1-α2 (cyan) (PDB: 4ABM), with (B) CHMP3α1-α4 (purple) (PDB: 3FRT), with (C) CHMP6α1 (red) (PDB: 3HTU) Snf7core, and with (D) IST1α1-α6 (grey) (PDB: 3FRR).
https://doi.org/10.7554/eLife.12548.006
Figure 2 with 3 supplements

Conformational Rearrangement of Snf7
(A–B) Ribbon diagrams of (A) a homology model of closed Snf7core (Henne et al., 2012) and (B) the X-ray crystal structure of open Snf7core. (C) A close-up view of the side chain interaction between Gln90 and Met130. (D) Western blotting and subcellular fractionation of snf7Δ yeast exogenously expressing SNF7 or snf7Q90C M130Cwith and without copper(II) 1,10-phenanthroline. (E) Schematic showing closed and open Snf7core with cysteines (red dots) before and after SDS-denaturing. (F) Snf7 site-directed spin-labeling with MTSL (red). (G–H) Distance between Glu88 and His118 of (G) closed and (H) open Snf7 shown in ribbon. (I and K) Time domain signals and distance distributions from DEER spectroscopy of (I) Snf7R52E E88C H118C in solution, and simulated closed and open Snf7core E88C H118C using MMM, and (K) Snf7R52E E88C H118C: Snf7R52E (1:0, 1:1, 1:2, and 1:8) with liposomes. (J) Schematic showing liposome sedimentation for DEER. MTSL-labeled Snf7 proteins (blue oval) and liposomes (grey circle).
Figure 2—figure supplement 1
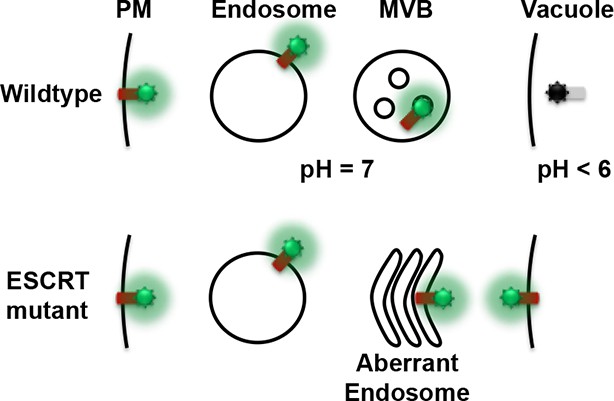
Conceptual model for the Mup1-pHluorin MVB sorting assay.
https://doi.org/10.7554/eLife.12548.009
Figure 2—figure supplement 2
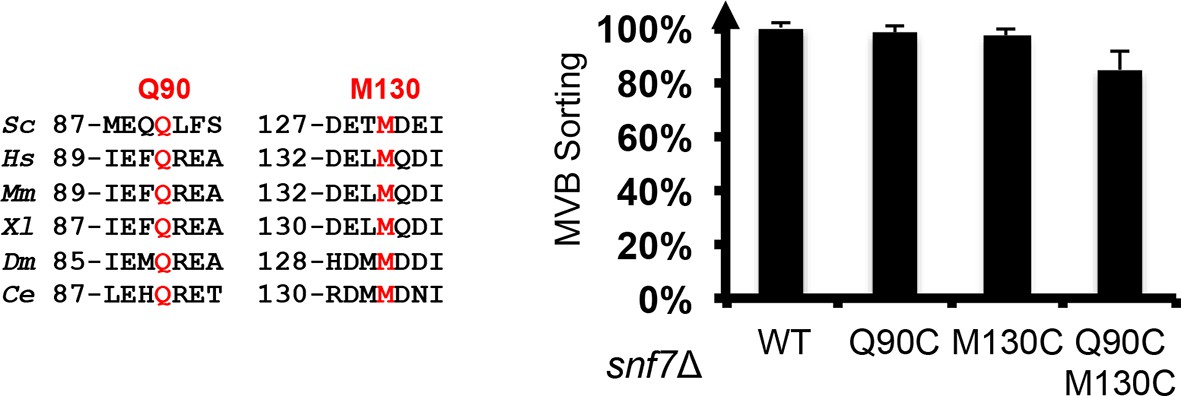
Sequence alignments of Snf7 α2 and α4, with conserved Gln90 and Met130 shown in red, and quantitative MVB sorting data for snf7Δ yeast exogenously expressing SNF7, snf7Q90C, snf7M130C, and snf7Q90C M130C.
Error bars represent standard deviations.
Figure 2—figure supplement 3

Time domain signals and distance distributions from DEER spectroscopy of full-length Snf7R52E E88C H118C, Snf7R52E H118C G140C and Snf7R52E E88C G140C.
(A) Ribbon models of closed and open Snf7core showing inter-residue distances between E88, H118 and G140. (B–D) Time domain signals and distance distributions from DEER spectroscopy of (B) full-length Snf7R52E E88C H118C, and full-length Snf7R52E E88C H118C:Snf7R52E (1:1) in solution, (C) full-length Snf7R52E H118C G140Cin solution and simulated closed and open Snf7core H118C G140C using MMM, and (D) full-length Snf7R52E E88C G140C in solution and simulated closed and open Snf7core E88C G140C using MMM. Blue shaded portions of the distributions indicate distance ranges that can be attributed to open and closed conformations.
Figure 3 with 4 supplements
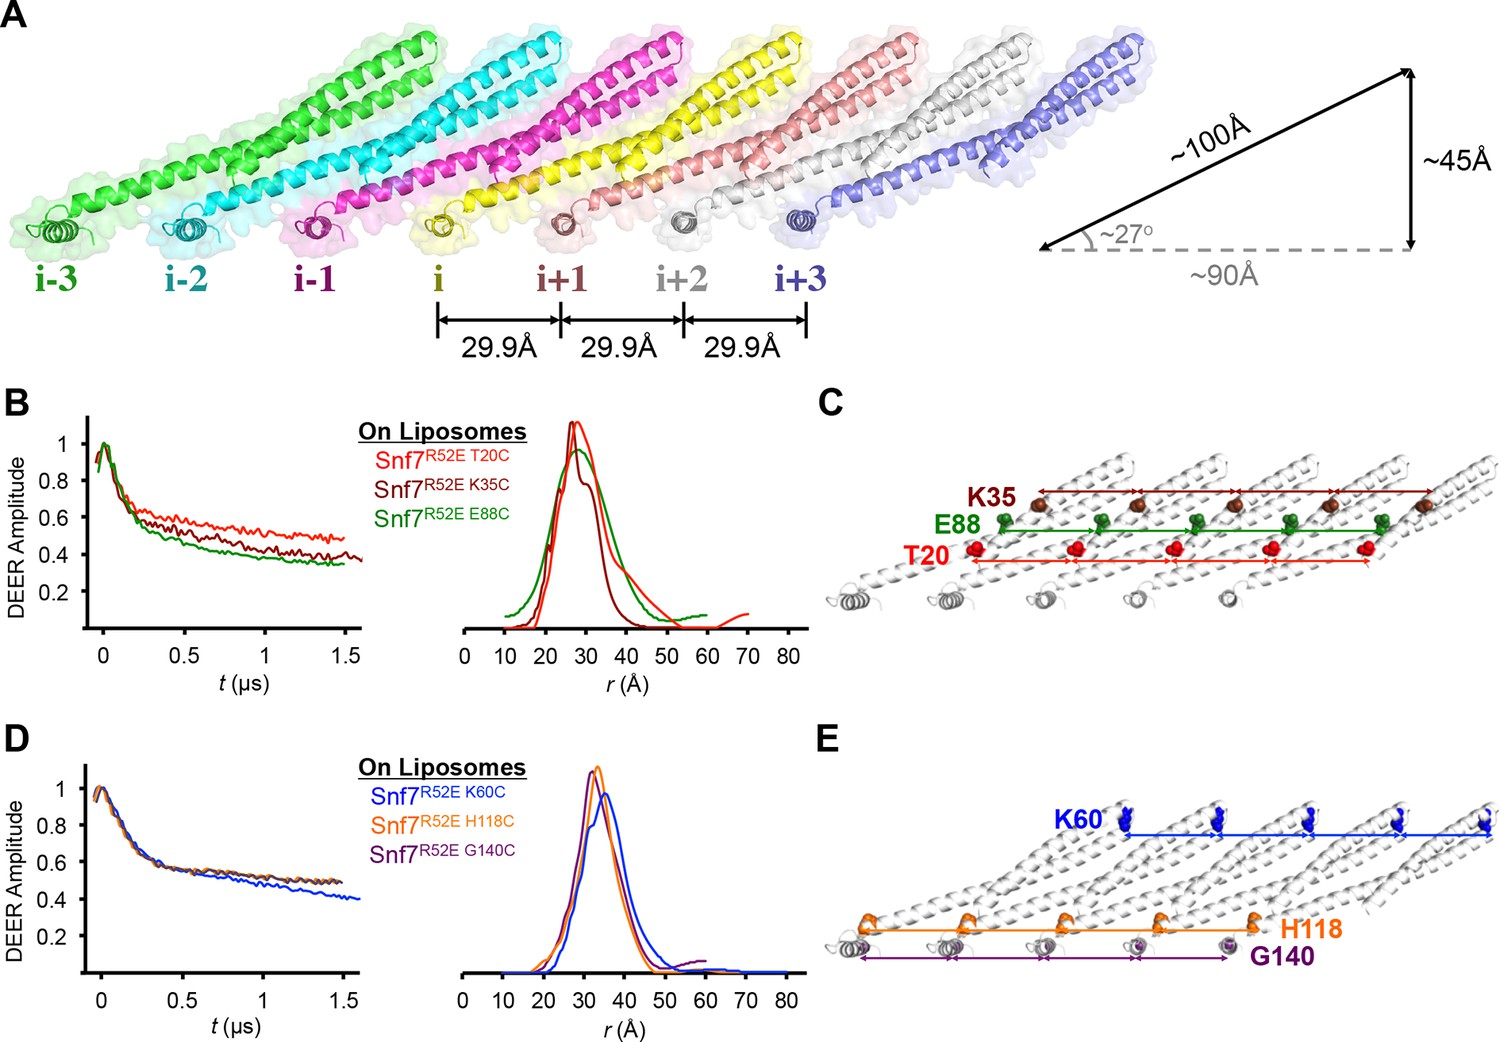
Membrane-bound Snf7 Protofilament with ~30 Å Periodicity
(A) Overlay of ribbon and space-filling models of a 7-mer Snf7 protofilament with measured dimensions. (B and D) Time domain signals and distance distributions from DEER spectroscopy of (B) full-length Snf7R52E T20C, Snf7R52E K35C, and Snf7R52E E88C with liposomes, (D) full-length Snf7R52E K60C, Snf7R52E H118C, and Snf7R52E G140C with liposomes. (C and E) Schematic showing the spin label positions in a Snf7 protofilament.
Figure 3—figure supplement 1
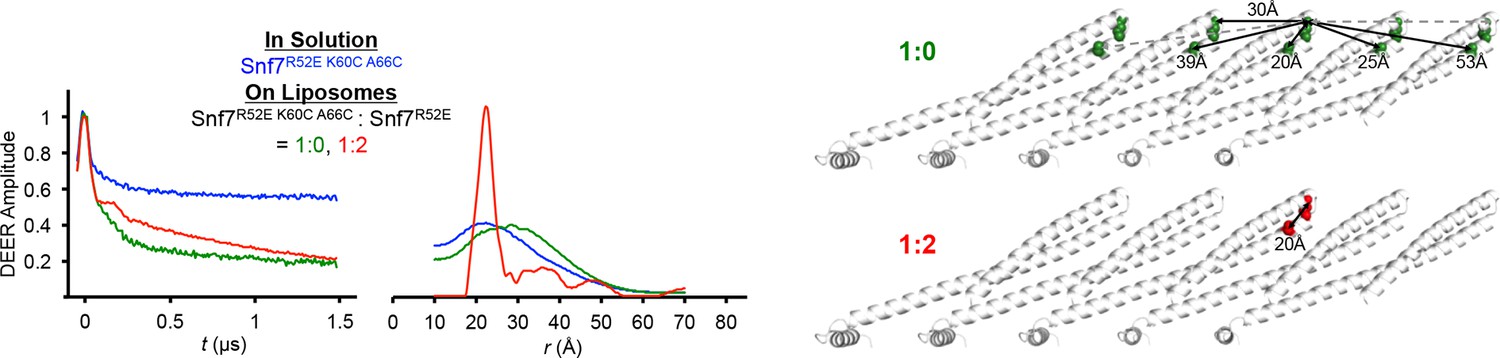
Time domain signals and distance distributions from DEER spectroscopy of full-length Snf7R52E K60C A66C in solution and full-length Snf7R52E K60C A66C: Snf7R52E (1:0, 1:2) with liposomes, and schematic showing the locations of the spin label positions in a Snf7 protofilament.
https://doi.org/10.7554/eLife.12548.013
Figure 3—figure supplement 2
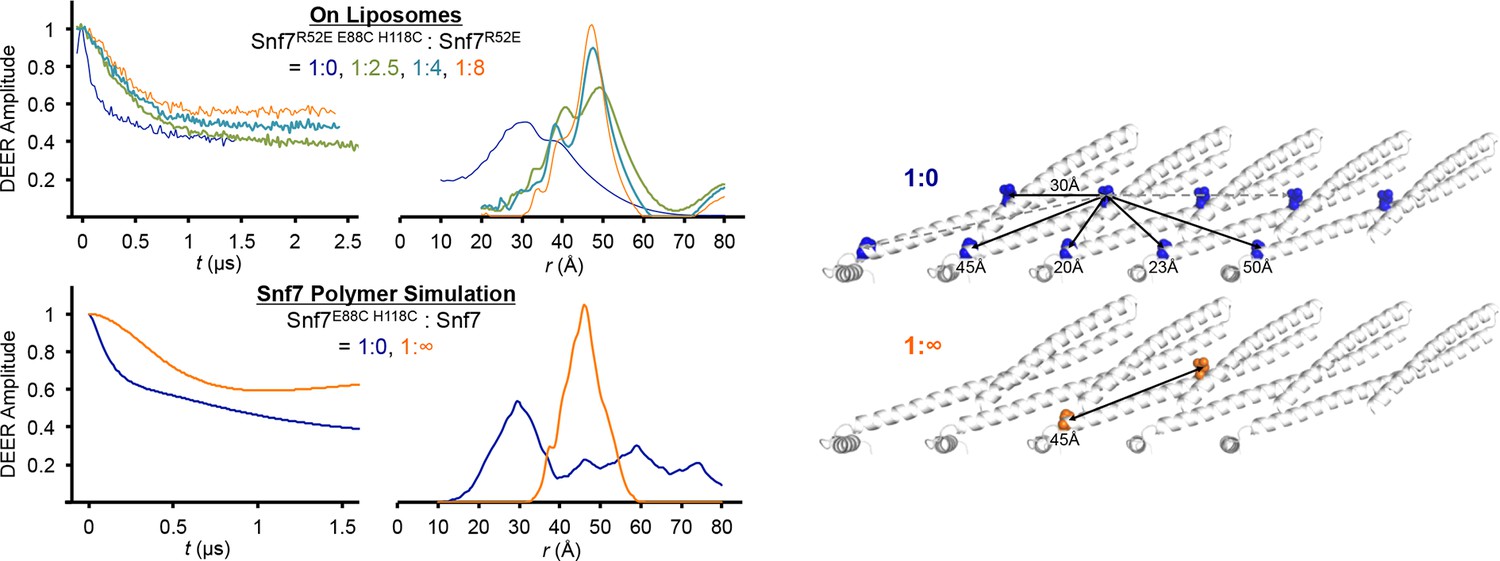
Time domain signals and distance distributions from DEER spectroscopy of full-length Snf7R52E E88C H118C: Snf7R52E (1:0, 1:2.5, 1:4, 1:8) with liposomes and simulated Snf7core E88C H118C: Snf7core (1:0, 1: ∞) polymers using MMM, and schematic showing the locations of the spin label positions in a Snf7 protofilament.
The full-length Snf7R52E E88C H118C: Snf7R52E (1:0 and 1:8) with liposomes datasets are re-plotted from Figure 2K as shown in fine lines.
Figure 3—figure supplement 3
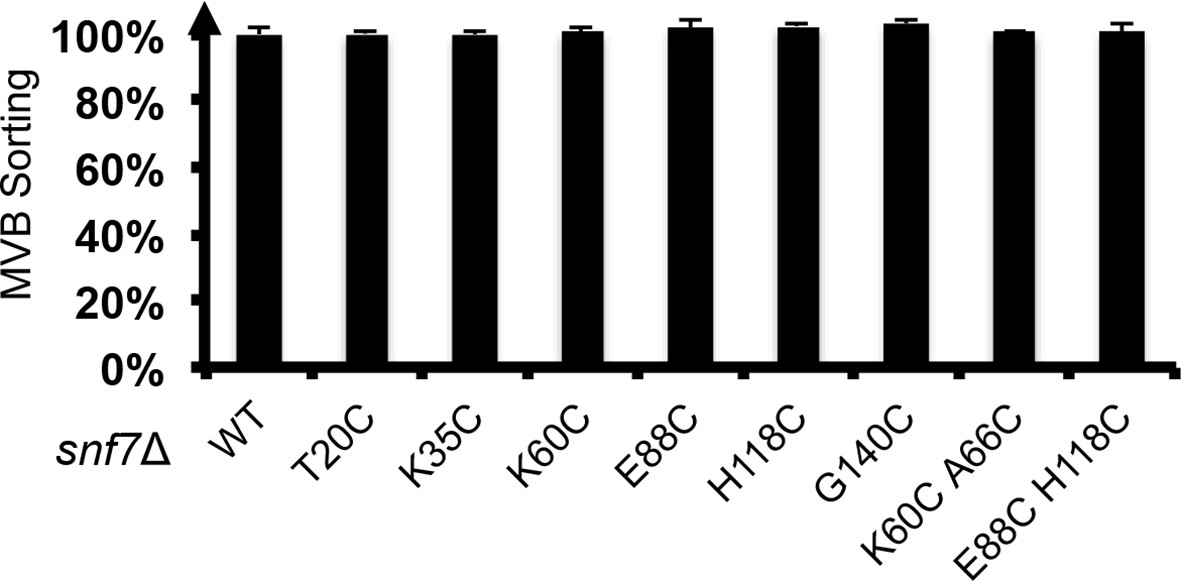
Quantitative MVB sorting data for snf7Δ yeast exogenously expressing SNF7, snf7T20C, snf7K35C, snf7K60C, snf7E88C, snf7H118C, snf7G140C, snf7K60C A66C and snf7E88C H118C.
Error bars represent standard deviations.
Figure 3—figure supplement 4
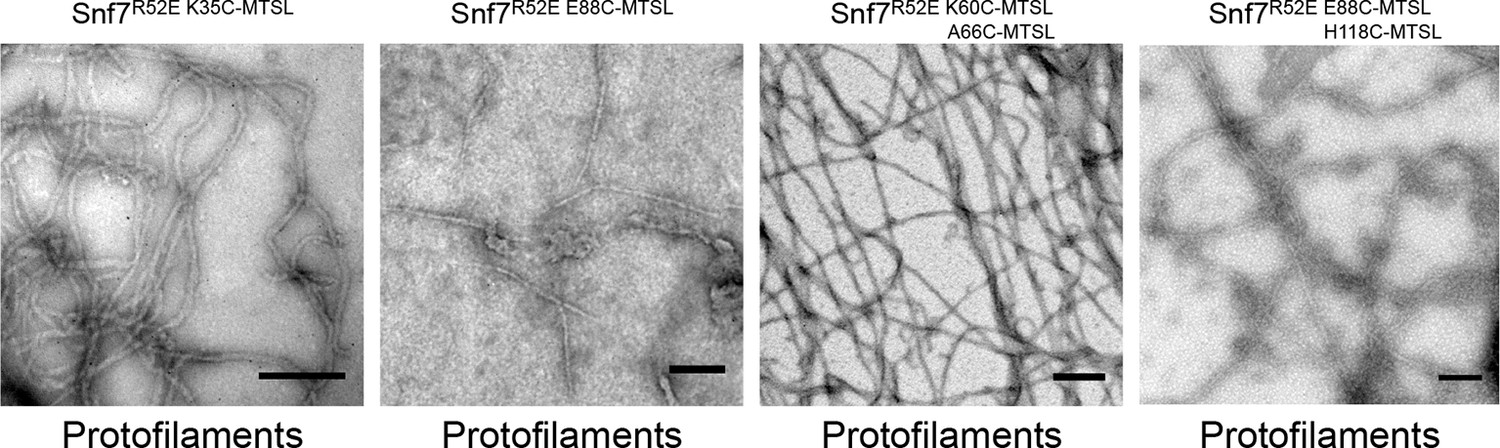
Representative TEM images of recombinant full-length Snf7R52E K35C, Snf7R52E E88C, Snf7R52E K60C A66C, and Snf7R52E E88C H118C labeled with MTSL.
Scale bars, 200 nm.
Figure 4 with 5 supplements
Hydrophobic and Electrostatic Interactions in a Snf7 Filament
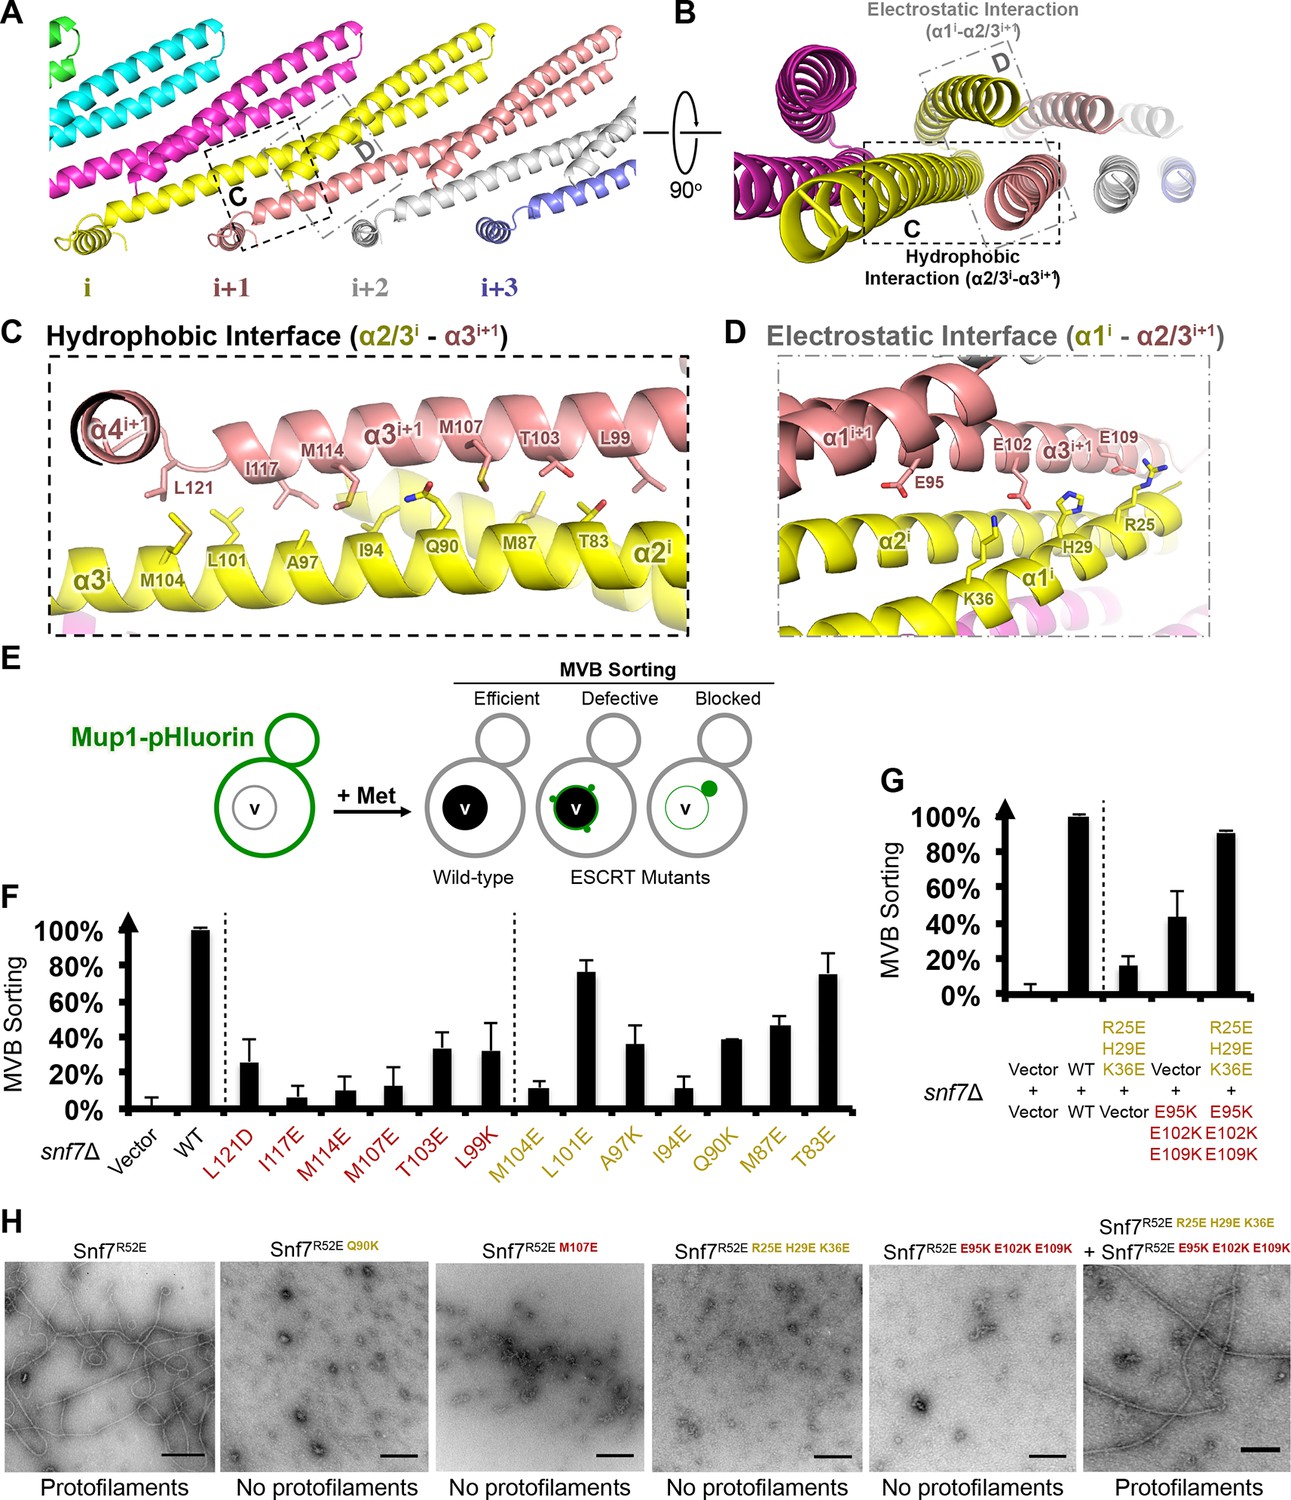
(A–B) Ribbon models of a Snf7 protofilament. The hydrophobic protein interface is shown in black dash-line and the electrostatic interface in grey dash-dot line. (C–D) Close-up views of the hydrophobic interface between α2/3i and α3i+1 and the electrostatic interface between α1i and α2/3i+1. Protomer (i) shown in yellow and protomer (i+1) in red. (E) Conceptual model for the Mup1-pHluorin MVB sorting assay. Vacuole (v). (F) Quantitative MVB sorting data for snf7Δ yeast exogenously expressing empty vector, SNF7, snf7L121D, snf7I117E, snf7M114E, snf7M107E, snf7T103E, snf7L99K, snf7M104E, snf7L101E, snf7A97K, snf7I94E, snf7Q90K, snf7M87E, and snf7T83E. Error bars represent standard deviations. (G) Quantitative MVB sorting data for snf7Δ yeast exogenously expressing empty vectors, SNF7, snf7R25E H29E K36Eand empty vector, empty vector and snf7E95K E102K E109K, and snf7R25E H29E K36E and snf7E95K E102K E109K. Error bars represent standard deviations. (H) Representative TEM images of recombinant full-length Snf7R52E, Snf7R52E Q90K, Snf7R52E M107E, Snf7R52E R25E H29E K36E, Snf7R52E E95K E102K E109K, and Snf7R52E R25E H29E K36E and Snf7R52E E95K E102K E109K (1:1). Scale bars, 200 nm.
Figure 4—figure supplement 1
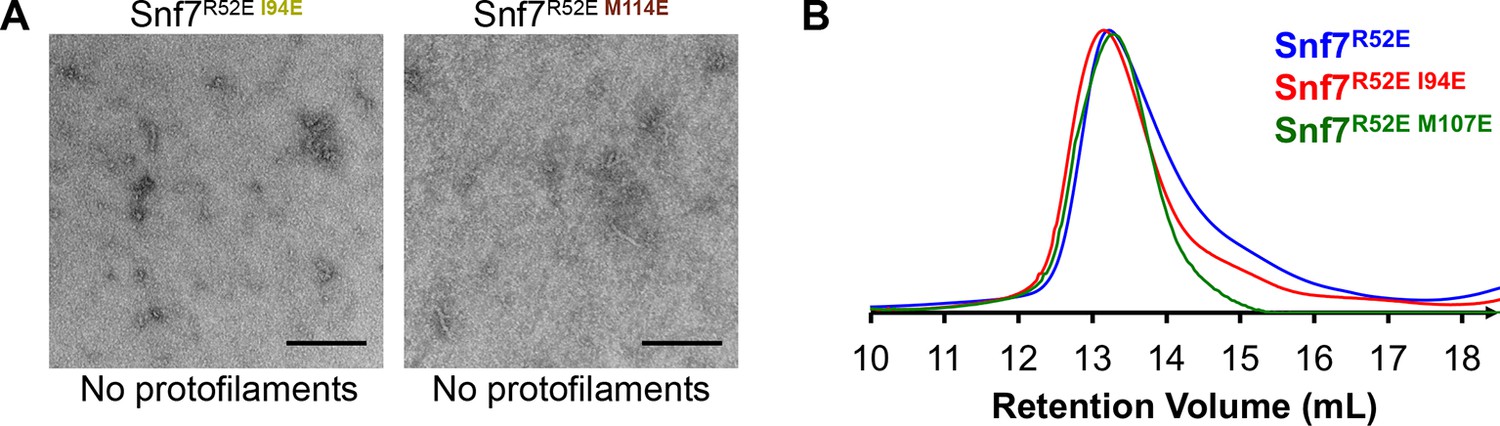
Hydrophobic Interface Mutant Analysis.
(A) Representative TEM images of recombinant full-length Snf7R52EI94E and Snf7R52EM114E. Scale bars, 200nm. (B) Superdex-200 gel filtration size exclusion chromatograms of Snf7R52E, Snf7R52EI94E and Snf7R52E M107E. Related to Figure 4H.
Figure 4—figure supplement 2
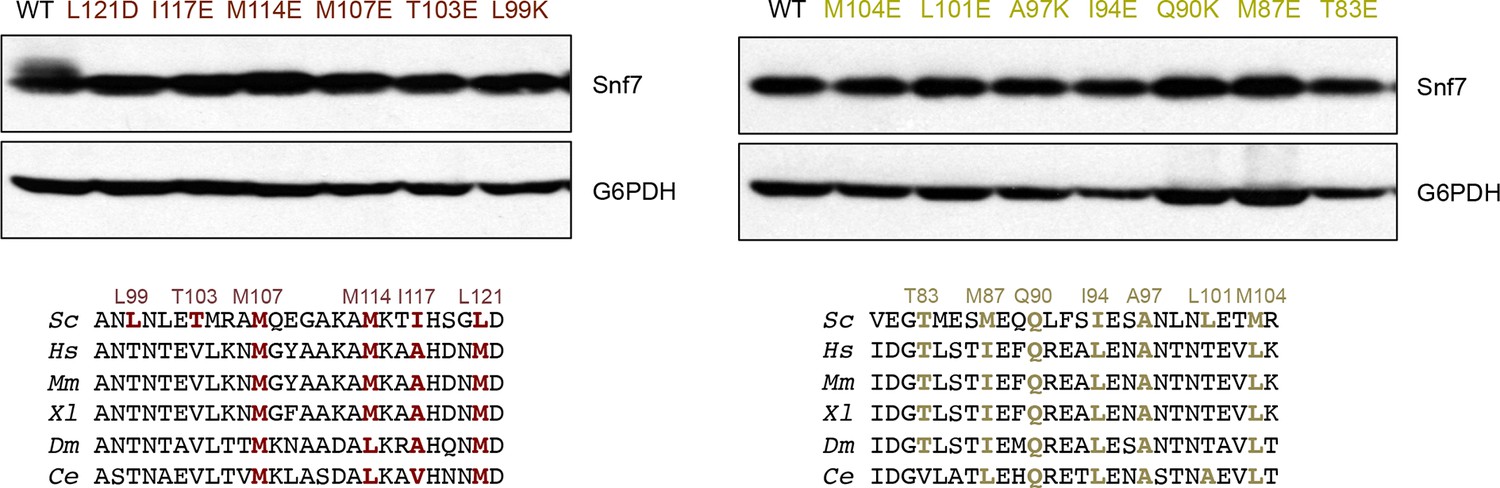
Western blotting analyses of snf7Δ yeast expressing SNF7, snf7L121D, snf7I117E, snf7M114E, snf7M107E, snf7T103E, and snf7L99K, and SNF7, snf7M104E, snf7L101E, snf7A97K, snf7I94E, snf7Q90K, snf7M87E, and snf7T83E.
G6PDH used as loading controls.
Sequence analyses of Snf7 α2/3 with conserved residues shown in gold and dark red.
Figure 4—figure supplement 3
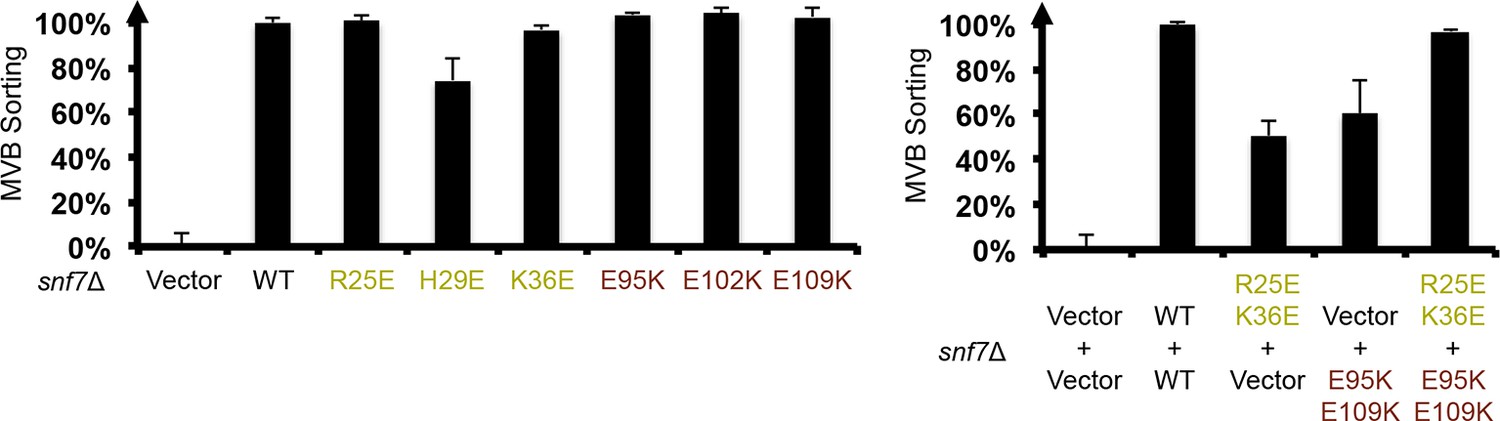
Quantitative MVB sorting data for snf7Δ yeast exogenously expressing empty vector, SNF7, snf7R25E, snf7H29E, snf7K36E, snf7E95K, snf7E102K, and snf7E109K, and empty vector, SNF7, snf7R25E K36Eand vector, vector and snf7E95K E109K, snf7R25E K36Eand snf7E95K E109K.
Error bars represent standard deviations.
Figure 4—figure supplement 4
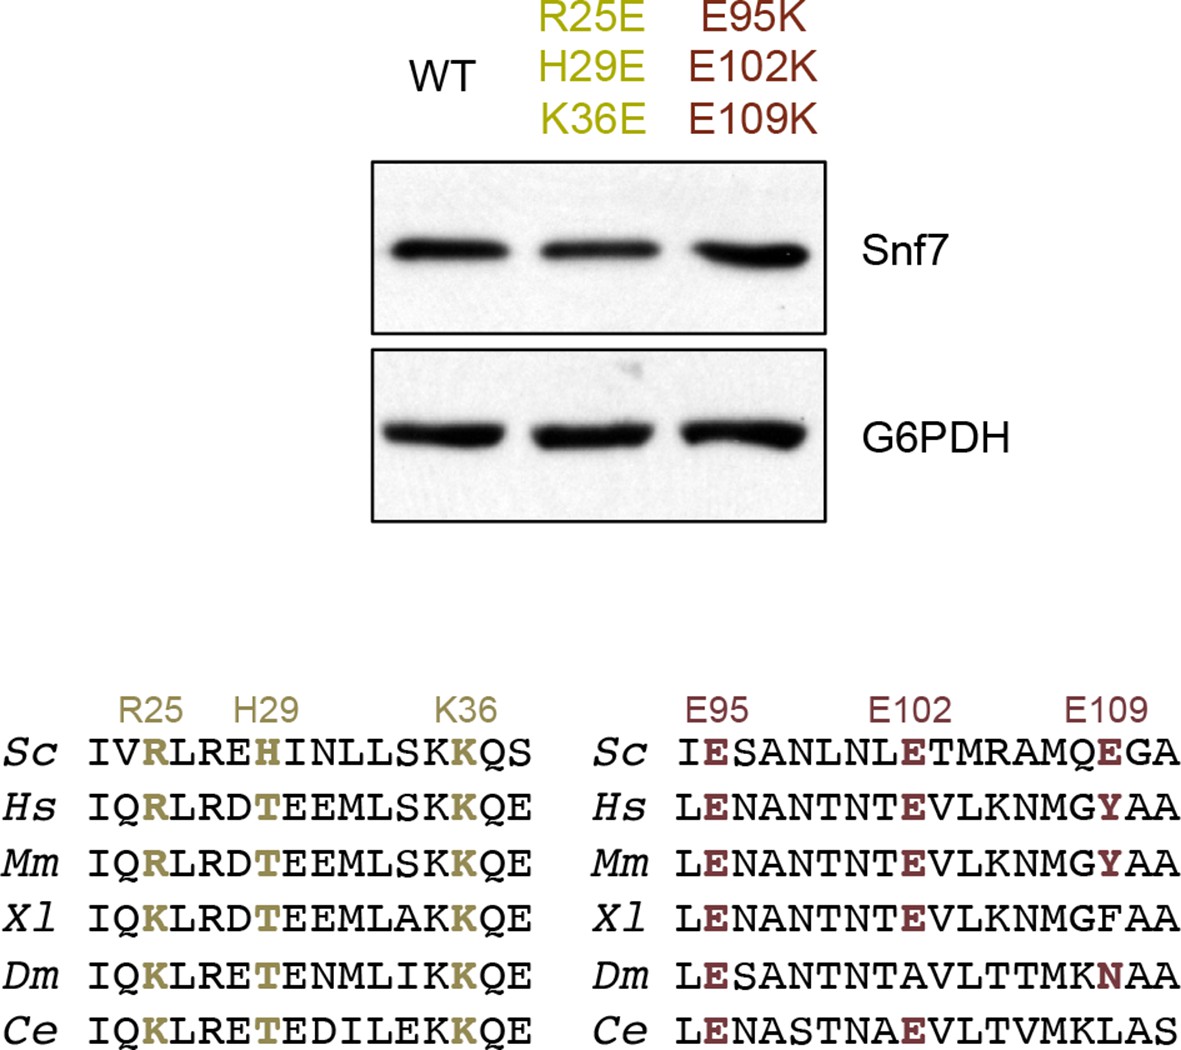
Western blotting analyses of snf7Δ yeast expressing SNF7, snf7R25E H29E K36E, and snf7E95K E102K E109K.
Sequence analyses of Snf7 α2/3 with conserved residues shown in gold and dark red.
Figure 4—figure supplement 5
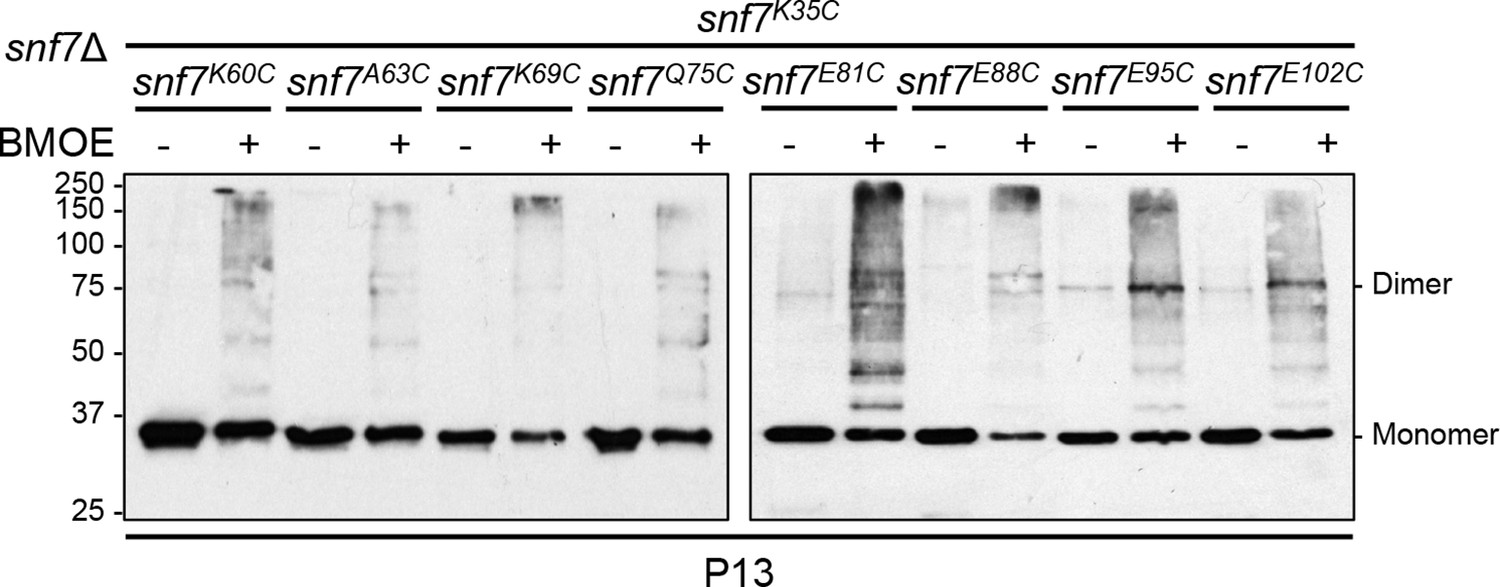
Western blotting analyses of ex vivo P13 fractions BMOE crosslinking by Snf7K35C with Snf7K60C, Snf7A63C, Snf7K69C, Snf7Q75C, Snf7E81C, Snf7E88C, Snf7E95C, and Snf7E102C.
https://doi.org/10.7554/eLife.12548.022
Figure 5
Electrostatic Protein-membrane Interactions in a Snf7 Filament
(A) A Snf7 protofilament in ribbons placed on a lipid membrane in spheres (grey) (Heller et al., 1993). (B) Electrostatic surface potential showing the membrane interacting surface of a Snf7protofilament with positively charged regions in blue (+10kcal/e-) and negatively charged regions in red (-10kcal/e-).
Figure 6 with 5 supplements

Snf7 α4 in Inter-Filament Interactions
(A–B) Snf7core conformations A (green) and B (blue) superimposed. (B) 90° rotation and superimposing with a closed CHMP3 (purple) using its α3 as a reference. (C) Overlay of ribbon and space-filling models of the Snf7core crystal packing of the open conformation A. The dash-line box represents the interfilament contacts. Arrows represent inter-protofilament orientations. (D–E) Close-up views of the hydrophobic interface between α1/2i (blue) and α4j (yellow) of open conformations (D) A and (E) B. (F) Quantitative MVB sorting data for snf7Δ yeast exogenously expressing empty vector, SNF7, snf7V126E, snf7M130E, snf7I133E, snf7A51E, snf7L55E, and snf7L67E. Error bars represent standard deviations. See also Table 1.
Figure 6—figure supplement 1
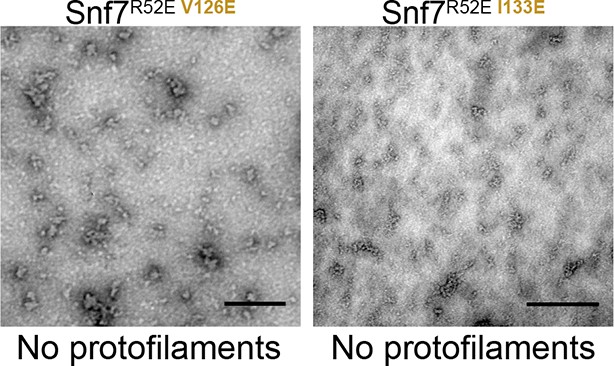
Representative TEM images of recombinant full-length Snf7R52E V126E and Snf7R52E I133E.
Scale bars, 200nm.
Figure 6—figure supplement 2
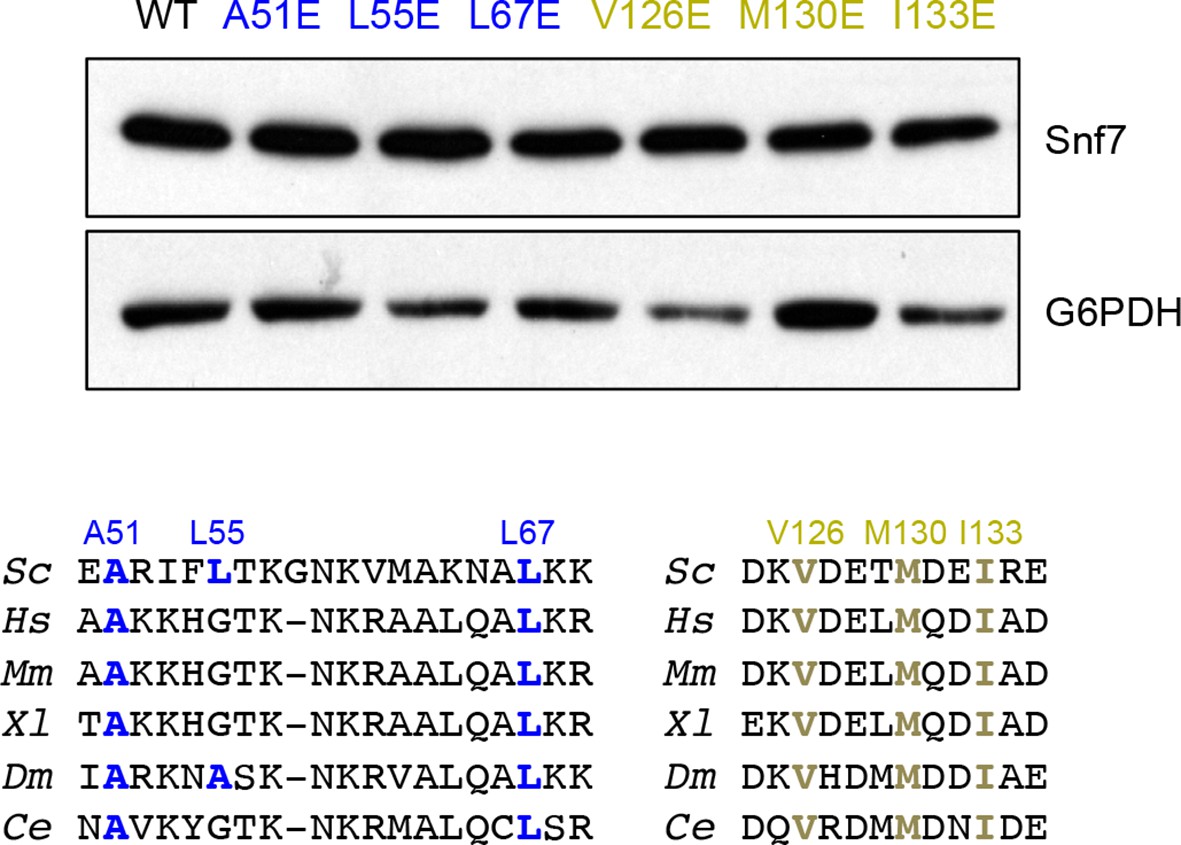
Western blotting analyses of snf7Δ yeast expressing SNF7, snf7A51E, snf7L55E, snf7L67E, snf7V126E, snf7M130E, and snf7I133E.
G6PDH as a loading control.
Sequence analyses of Snf7 α1/2 and α4 with conserved residues shown in blue or gold.
Figure 6—figure supplement 3

Quantitative MVB sorting data for snf7Δ yeast exogenously expressing SNF7, snf7E102P, snf7N59P, and snf7L121P.
Error bars represent standard deviations. Overlay ribbon models of (upper right) closed (purple) and open (blue) Snf7core with Glu102 shown in sticks, and (lower right) open conformation A (green) and B (blue) with Asn59 and Leu121 shown in sticks. Arrows represent conformational rearrangements.
Figure 6—figure supplement 4

An overlay of ribbon and space-filling models of the Snf7core crystal packing of the open conformation B.
The dash-line box represent the interfilament contacts shown in Figure 6E.
Figure 6—figure supplement 5

Superimposing of Snf7core subunit (i) (blue), (j) (yellow) and CHMP3α1-α5 (purple) of open conformations A (upper) and B (lower).
https://doi.org/10.7554/eLife.12548.029
Figure 7 with 3 supplements
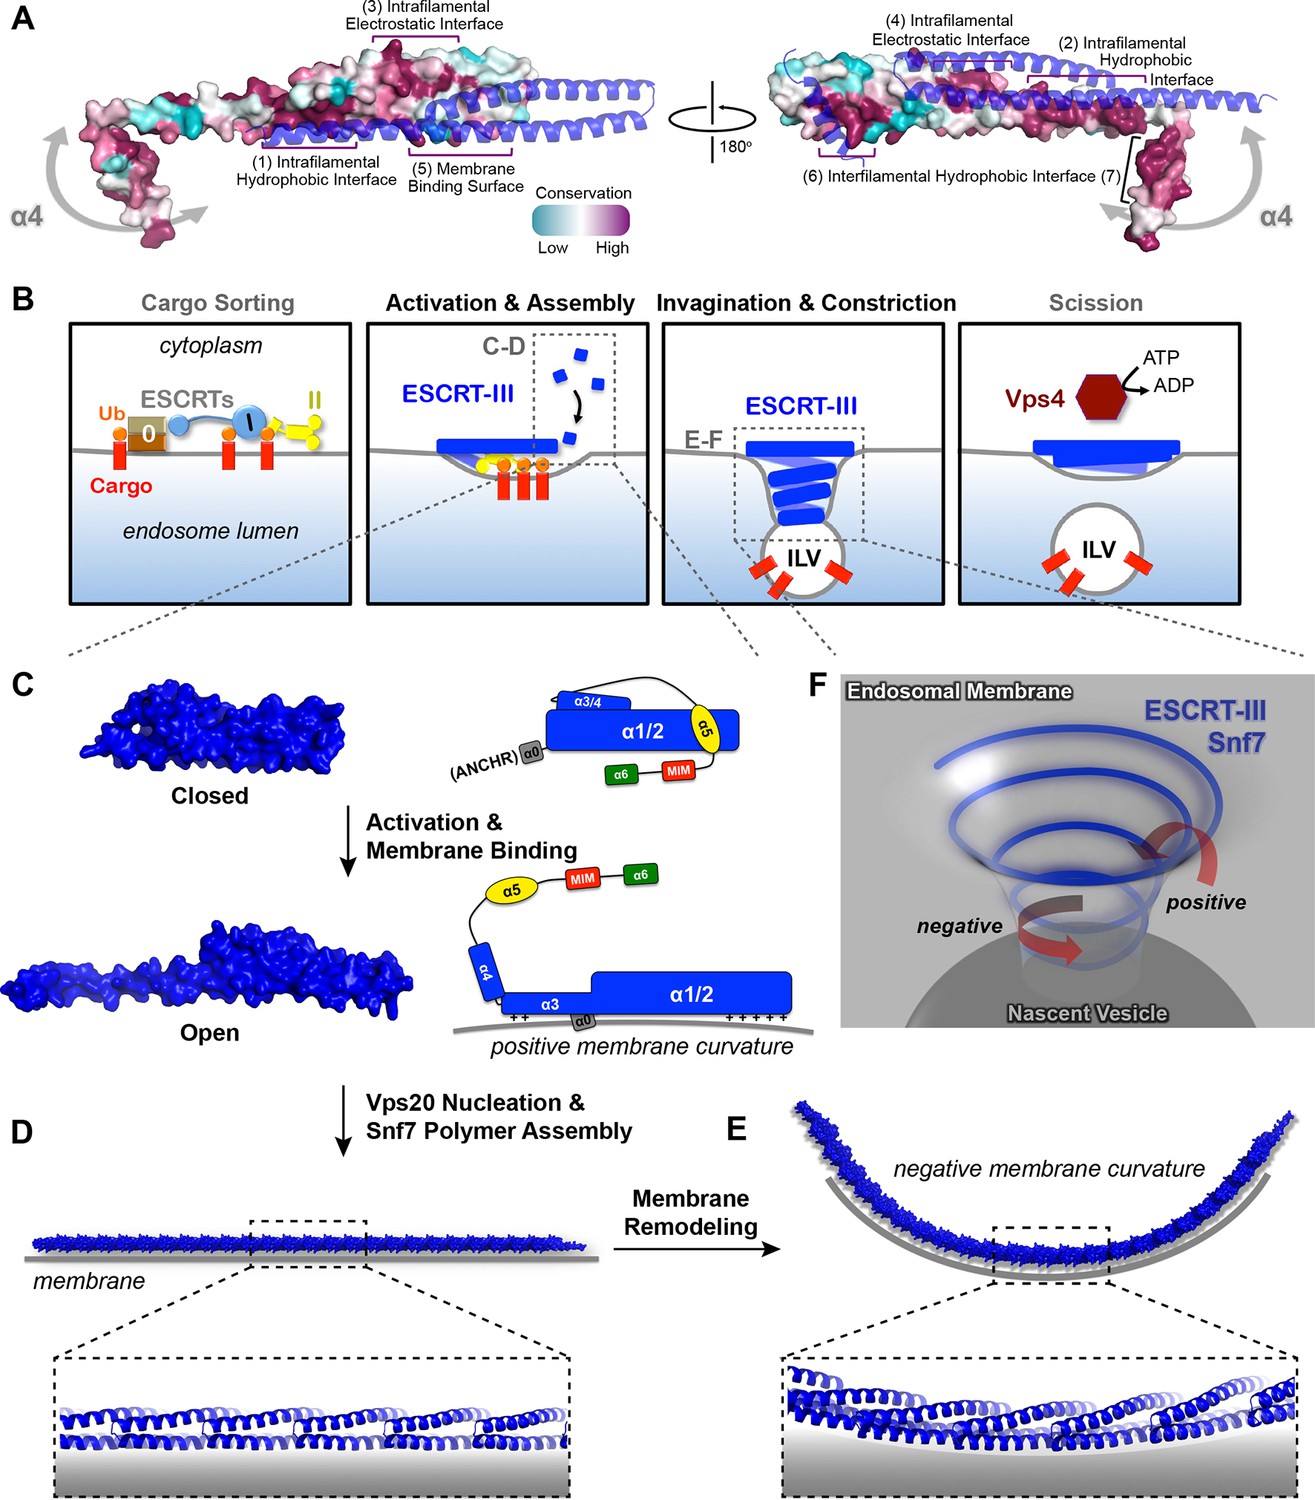
Models of Snf7 activation, polymer assembly and membrane remodeling
(A) Space-filling CONSURF models with high conservation (purple) and low conservation (cyan). Interacting protomers shown in ribbon (blue). Seven conserved regions with assigned functions labeled. Gray arrows indicate the flexibility of α4. (B) Speculative cartoons illustrating four stages in ESCRT-mediated vesicle budding. (C) Space-filling models and schematic cartoons of Snf7core in closed and open states with membrane (grey). (D) Space-filling and close-up ribbon models of a 25-mer Snf7 single filament with membrane. (E) Space-filling and close-up ribbon models of a 23-mer Snf7 normal mode analysis filament with membrane (grey). (F) Schematic of a Snf7 homo-polymer in the neck of a nascent ILV with positive and negative membrane curvatures.
Figure 7—figure supplement 1
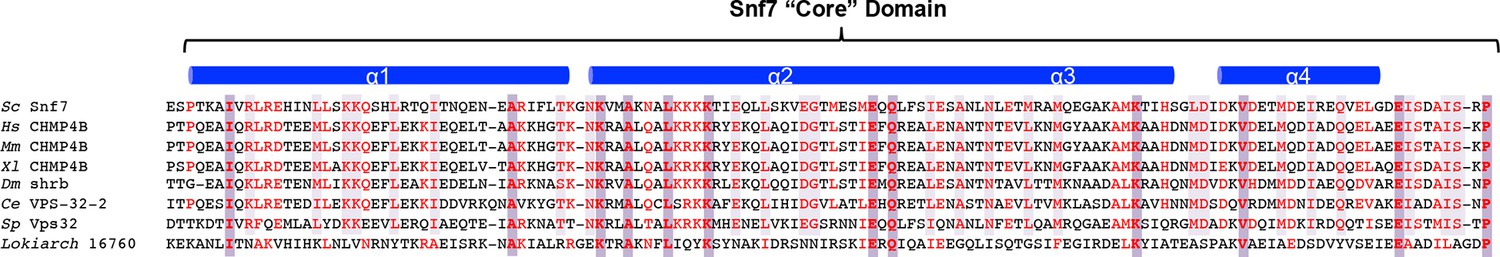
Alignment of Snf7core protein sequences from Saccharomyces cerevisiae (Sc), Homo sapiens (Hs), Mus musculus (Mm), Xenopus laevis (Xl), Drosophila melanogaster (Dm), Caenorhabditis elegans (Ce), Schizosaccharomyces pombe (Sp) and Lokiarchea (Spang et al., 2015).
https://doi.org/10.7554/eLife.12548.031
Figure 7—figure supplement 2
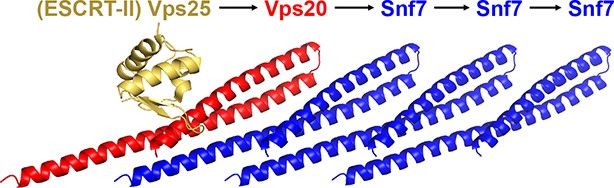
A ribbon model of a supercomplex of Vps25-Vps20-Snf7.
The first Snf7’s α1 was used for superimposing with the Vps20 α1 (Im et al., 2009) (PDB: 3HTU) for molecular docking.
Figure 7—figure supplement 3
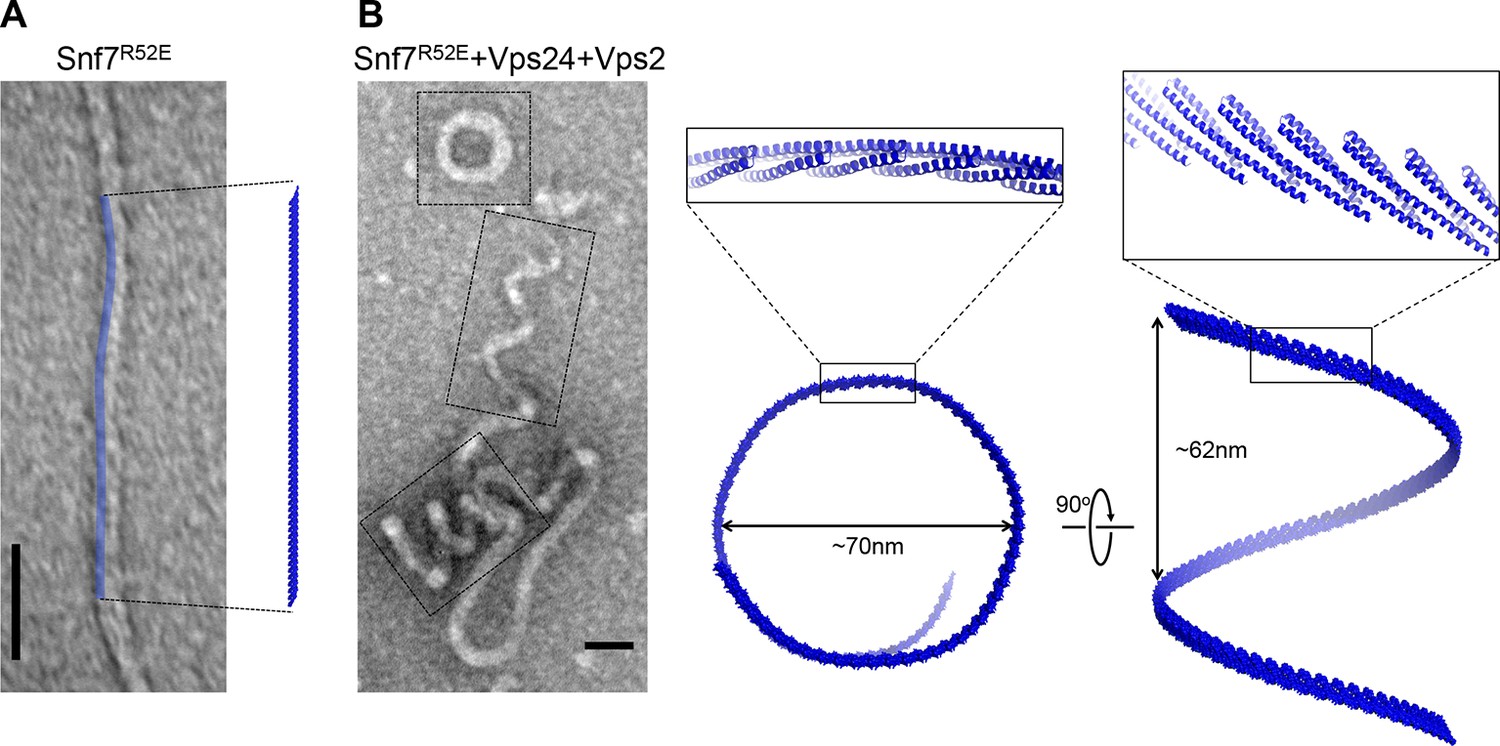
Architectures of Snf7 protofilaments
(A) A representative TEM image of recombinant Snf7R52E (left) and a space-filling model of a 61-mer Snf7α1-3 straight filament shown in the same scale (right). (B) A representative TEM image of recombinant full-length Snf7R52E, Vps24 and Vps2 (2:1:1) (left), and space-filling and close-up view of ribbon models of a 97-mer Snf7α1-3 superhelix generated by normal mode analysis with measured dimensions (right). TEM scale bars, 50nm.
Author response image 1
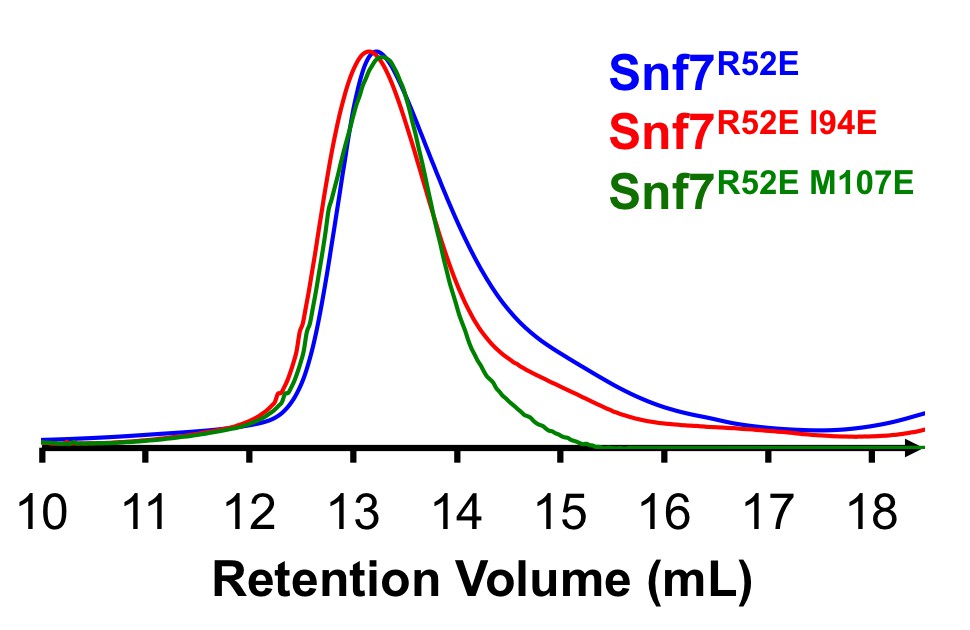
Size Exclusion Chromatograms of full-length Snf7R52E, Snf7R52E I94E and Snf7R52E M107E by Superdex-200 gel filtration.
https://doi.org/10.7554/eLife.12548.035Tables
Table 1
Crystallographic Data Collection and Refinement Statistics
Snf7core | ||
|---|---|---|
| Conformation A | Conformation B | |
| Wavelength (Å) | 0.978 | 0.978 |
| Resolution range (Å) | 50 - 2.4 (2.49 - 2.40) | 50 - 1.6 (1.6 - 1.55) |
| Space group | P21 | P21 |
| Unit cell | a = 29.5Å b = 52.2Å c = 54.5Å α = 90°β = 97.5°γ = 90° | a = 29.9Å b = 46.2Å c = 44.6Å α = 90°β = 98.5°γ = 90° |
| Total reflections | 23263 (1946) | 73723 (6034) |
| Unique reflections | 6376 (612) | 16849 (1581) |
| Multiplicity | 3.6 (3.2) | 4.4 (3.8) |
| Completeness (%) | 97.99 (93.72) | 95.77 (90.65) |
| Mean I/sigma(I) | 8.04 (2.91) | 8.85 (1.35) |
| Wilson B-factor | 54.03 | 25.39 |
| Rmerge | 0.0884 (0.249) | 0.0782 (0.997) |
| CC1/2 | 0.988 (0.968) | 0.995 (0.590) |
| CC* | 0.997 (0.992) | 0.999 (0.861) |
| Rwork | 0.259 (0.398) | 0.210 (0.330) |
| Rfree | 0.262 (0.533) | 0.225 (0.356) |
| Number of non-hydrogen atoms | 982 | 1097 |
| macromolecules | 975 | 992 |
| water | 7 | 105 |
| Protein residues | 123 | 125 |
| RMS(bonds) (Å) | 0.015 | 0.006 |
| RMS(angles) (o) | 1.24 | 0.81 |
| Ramachandran favored (%) | 95 | 99 |
| Ramachandran outliers (%) | 1.7 | 0 |
| Clashscore | 21.56 | 9.9 |
| Average B-factor | 91.1 | 39.7 |
| macromolecules | 91.2 | 38.9 |
| solvent | 69.2 | 47.2 |
Additional files
-
Supplementary file 1
Plasmids and yeast strains used in this study.
A list of plasmids for Saccharomyces cerevisiae expression, Escherichia coli expression for protein purification, and Saccharomyces cerevisiae strains.
- https://doi.org/10.7554/eLife.12548.034
Download links
A two-part list of links to download the article, or parts of the article, in various formats.
Downloads (link to download the article as PDF)
Open citations (links to open the citations from this article in various online reference manager services)
Cite this article (links to download the citations from this article in formats compatible with various reference manager tools)
Structural basis for activation, assembly and membrane binding of ESCRT-III Snf7 filaments
eLife 4:e12548.
https://doi.org/10.7554/eLife.12548


