Mouse models of human PIK3CA-related brain overgrowth have acutely treatable epilepsy
- Seattle Children's Research Institute, United States
- Dana Farber Cancer Institute, United States
- St. Jude Children's Research Hospital, United States
- The University of Texas MD Anderson Cancer Center, United States
Figures
Figure 1 with 3 supplements
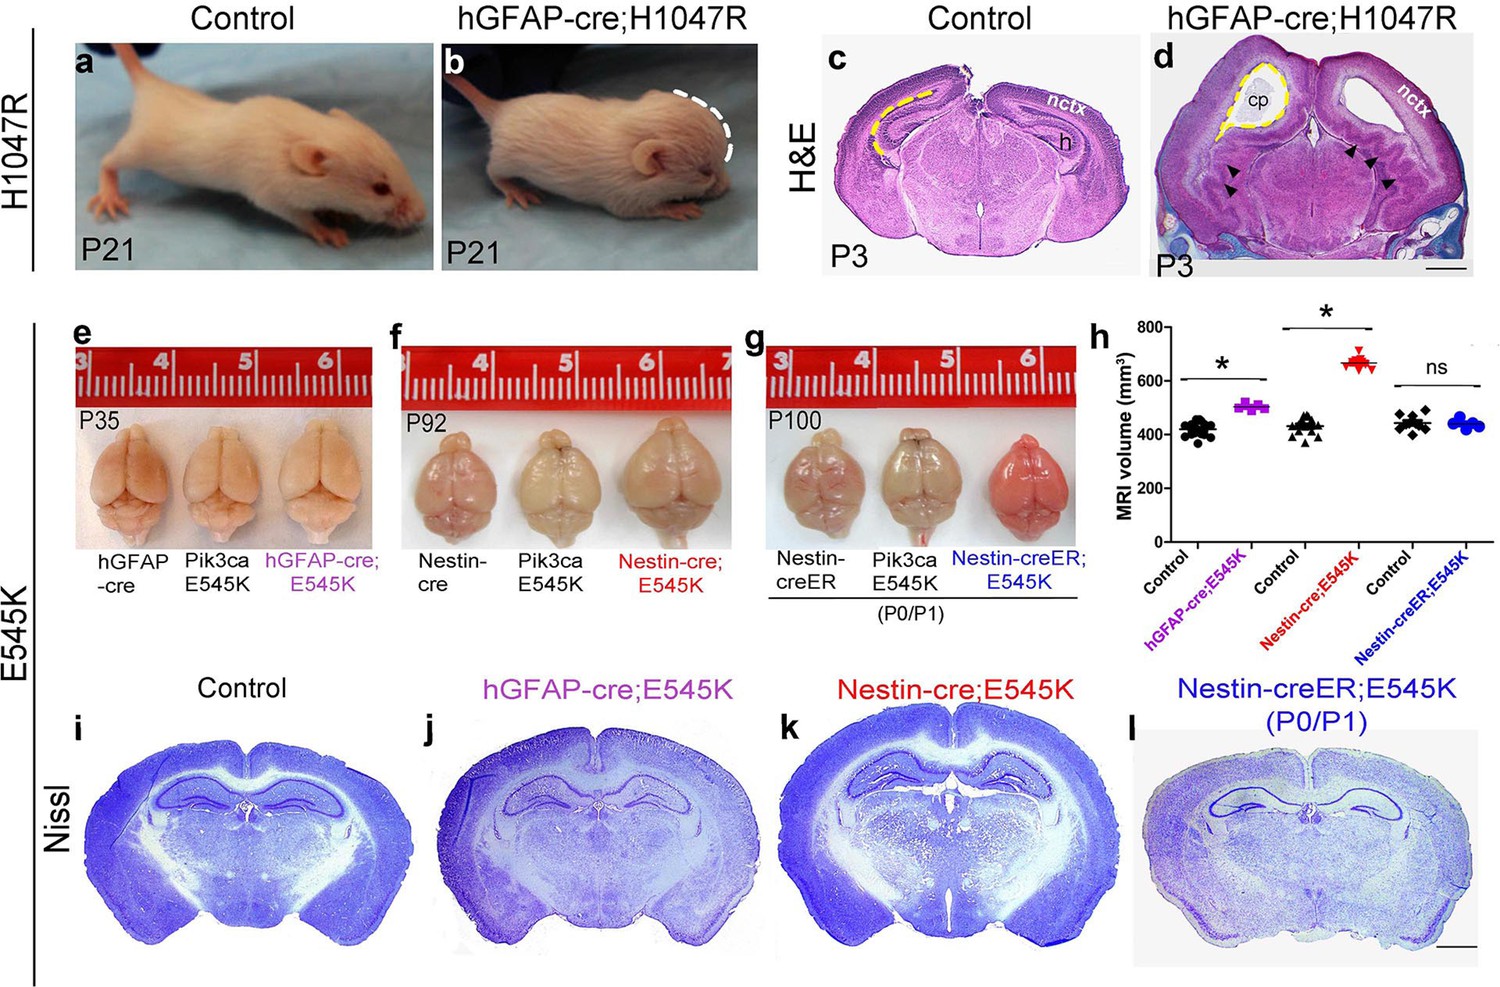
Embryonic Pik3ca overactivation in mice causes MEG.
(a,b) Compared to control, P21 hGFAP-cre;H1047R mutants had domed foreheads. (c,d) Coronal section of H&E-stained P3 H1047R mutant showed bigger brain and enlarged lateral ventricles compared to control. Mutant neocortex (nctx) was dysplastic and medial tissue highly infolded (arrowhead; d). (e–g) P35 hGFAP-cre;E545K and Nestin-cre;E545K brains were noticeably larger than controls, while Nestin-creER;E545K mutants had normal-sized brains compared to controls. Red color of Nestin-creER;E545K brain is due to presence of a lox-stop-lox-Tomato reporter allele, and shows successful induction of cre activity. Controls for e,f and g are of genotypes Pik3ca E545K, hGFAP-cre, Nestin-cre and Nestin-creER. (h) MRI volumetric analyses of mutant and corresponding control brains. *p<0.0001; ns, not significant. Each data point in the graph represents 1 mouse. (i–l) Nissl-stained coronal sections of representative control and mutant brains. Scale bars: 1 mm (c,d); 2 mm (i-l). See also Figure 1—figure supplements 1–3.
Figure 1—figure supplement 1
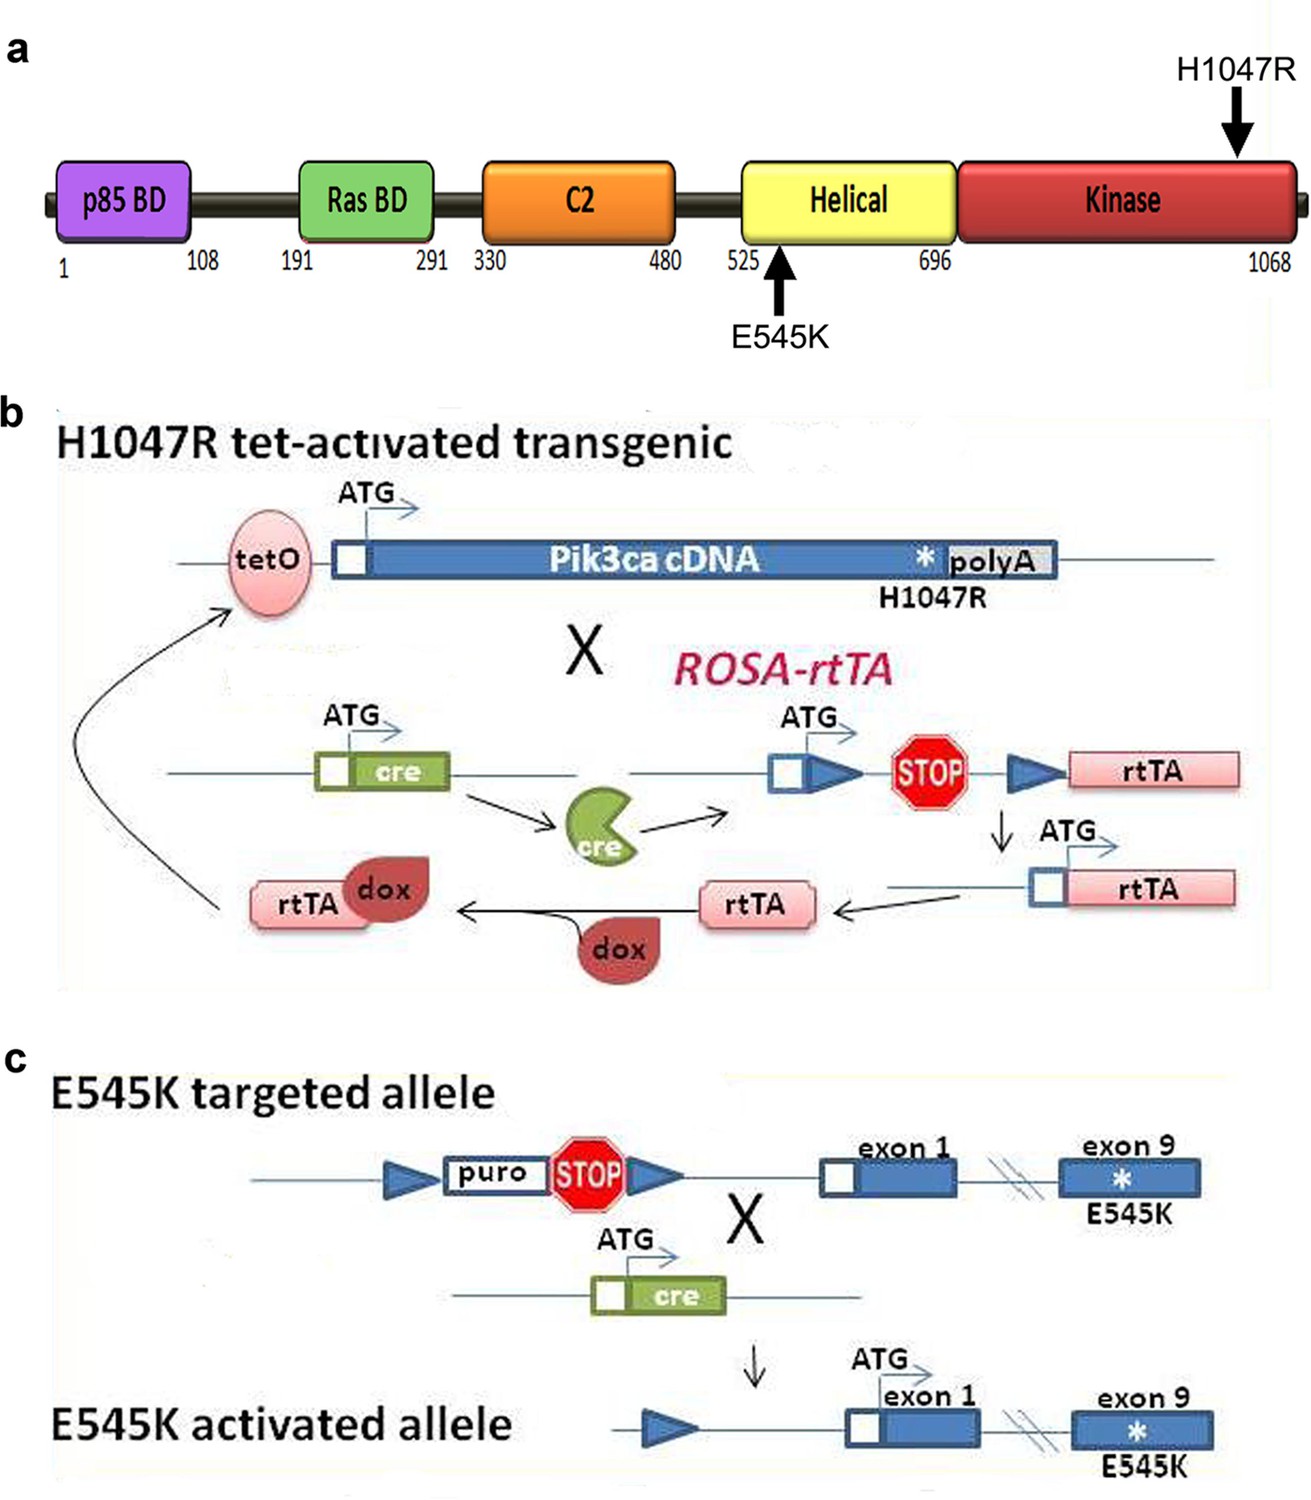
Genetic strategy for Pik3ca mouse models.
(a) Schematic of PIK3CA functional domains, highlighting positions of E545K and H1047R activating mutations. (b) Genetic strategy for tet-activated H1047R transgenic mice (Liu et al., 2011): the human H1047R mutation was activated in the combined presence of cre recombinase and doxycycline (dox). rtTA, reverse tetracycline-controlled transactivator. (c) Genetic strategy for E545K conditional knock-in mice (Robinson et al., 2012): exon 9 of PIK3CA gene was replaced by an exon containing E545K mutation; and a STOP cassette flanked by loxP recombination sites is introduced in the intron immediately upstream of the exon encoding the transcription initiation site. Cre recombination resulted in removal of STOP cassette, allowing the transcription of the mutant E545K allele.
Figure 1—figure supplement 2
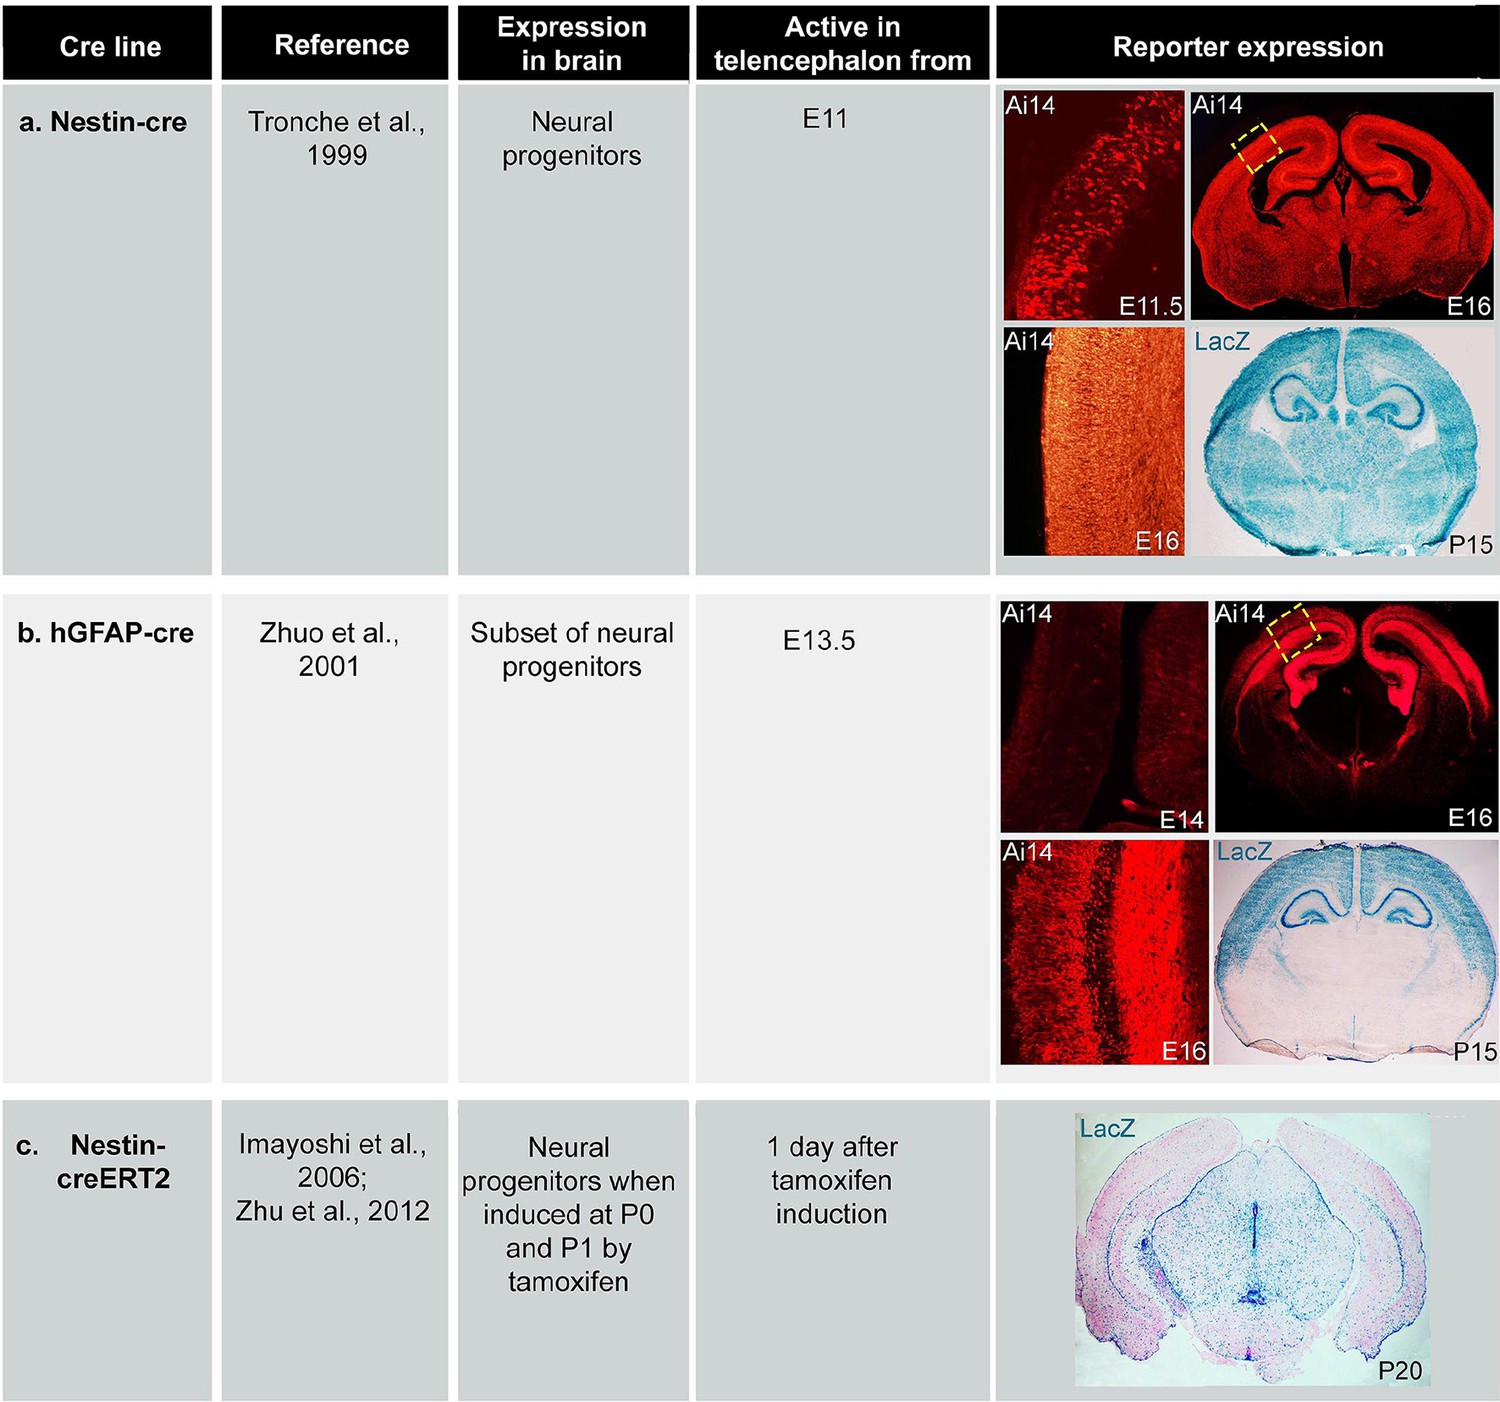
Expression of cre lines.
Table of cre expression for (a) Nestin-cre, (b) hGFAP-cre and (c) Nestin-creER induced by tamoxifen at P0 and P1, using Ai14 and Rosa26-LacZ reporter lines.
Figure 1—figure supplement 3
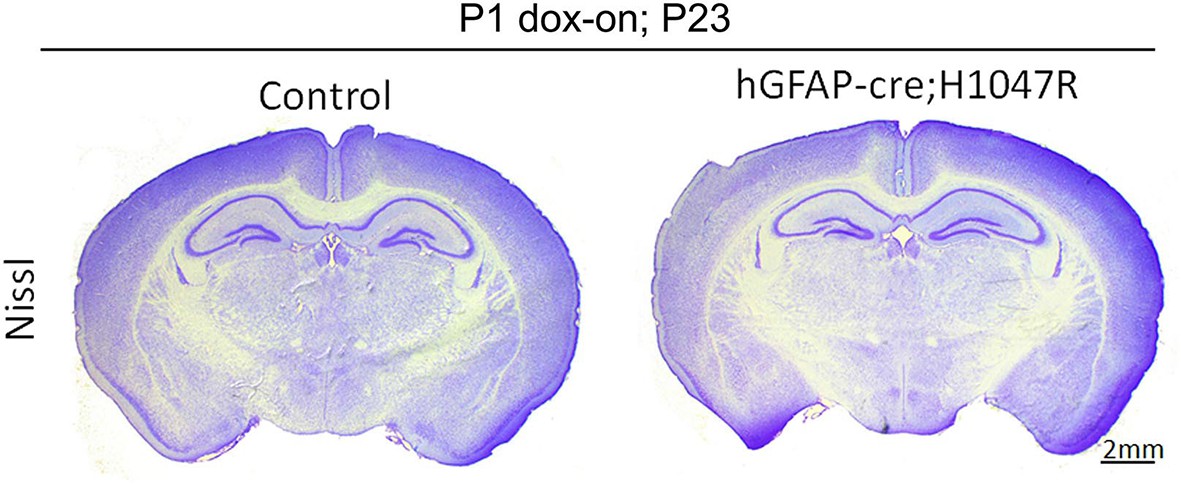
Neonatal activation of H1047R mutation show no effect on brain morphology
hGFAP-cre;H1047R mutant display normal brain morphology, when doxycycline was administered postnatally from P1. Scale bar: 2 mm.
Figure 2
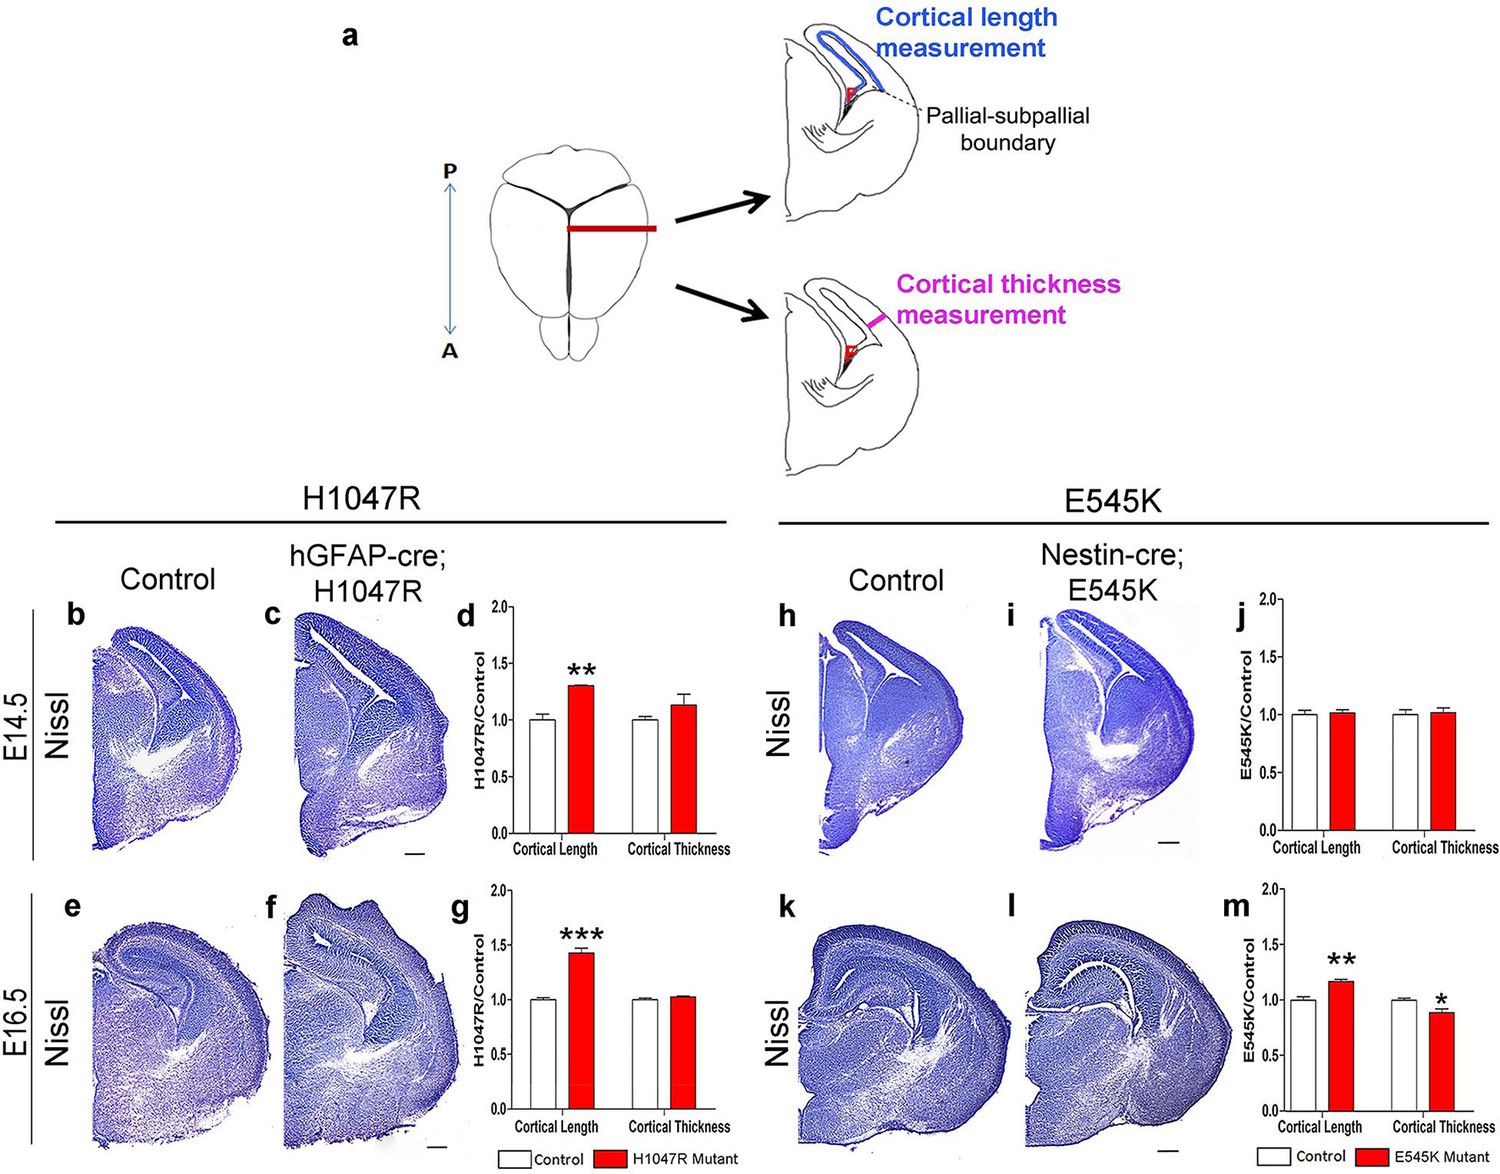
Pik3ca activating mutations lead to increased embryonic cortical length.
(a) Schematic shows how cortical length and thickness were measured. F, fimbria/cortical hem. Nissl-stained coronal sections of control (b,e,h,k) and mutant (c,f,I,l) brains. (b–g) Cortical length of hGFAP-cre;H1047R mutant at E14.5 and E16.5 was longer than control; cortical thickness was not different. (h–m) Cortical length of Nestin-cre;E545K mutant was longer than control at E16.5 but not at E14.5; thickness was not different at E14.5 but was smaller than control at E16.5. Data are represented as mean ± SEM. *p<0.05; **p<0.01; ***p<0.001. Scale bars: 300 μm (b,c,e,f,h,i,k,l).
Figure 3 with 2 supplements

H1047R and E545K mutations differentially affect proliferation, cell density and size in neocortex.
(a) Schematic shows area of interest (red box) in E16.5 mouse coronal section, as depicted in c,d,k,m,n,u. (b) Experimental outline of the proliferation and cell cycle exit assays. For labeling index, E14.5 and E16.5 control and mutant brains, harvested after a 1hr BrdU pulse, were processed for BrdU and DAPI staining (c,m). For quit fraction analysis, E16.5 control and mutant brains, pulsed with BrdU at E15.5, were processed for BrdU and Ki67 (k,u). Magnified view of DAPI-stained cortical nuclei shows differences in size and density between controls and mutants (d,n). (e-j,l) E14.5 and E16.5 H1047R mutants had similar labeling indices (BrdU+ cells/total DAPI+ cells); E16.5 H1047R mutant neocortex displayed reduced cell density (x105 DAPI+ cells/mm3 volume), larger nuclear and cell size (μm2) and similar quit fraction (BrdU+Ki67- cells/total BrdU+ cells). (o-q) E14.5 E545K mutant neocortex was similar to control in labeling index, cell density and nuclear size. (r-t,v) E16.5 E545K mutant showed significantly higher labeling index and quit fraction, reduced cell density, and enlarged cell and nuclear size, compared to controls. Data are represented as mean ± SEM (e,f,h,i,I,o,p,r,s,v) or as median-centered box-and-whisker plots (g,j,q,t); *p<0.05; **p<0.001; ***p<0.0001. Scale bars: 50 μm (c,d,m,n); 100 μm (k,u). See also Figure 3—figure supplements 1–2.
Figure 3—figure supplement 1
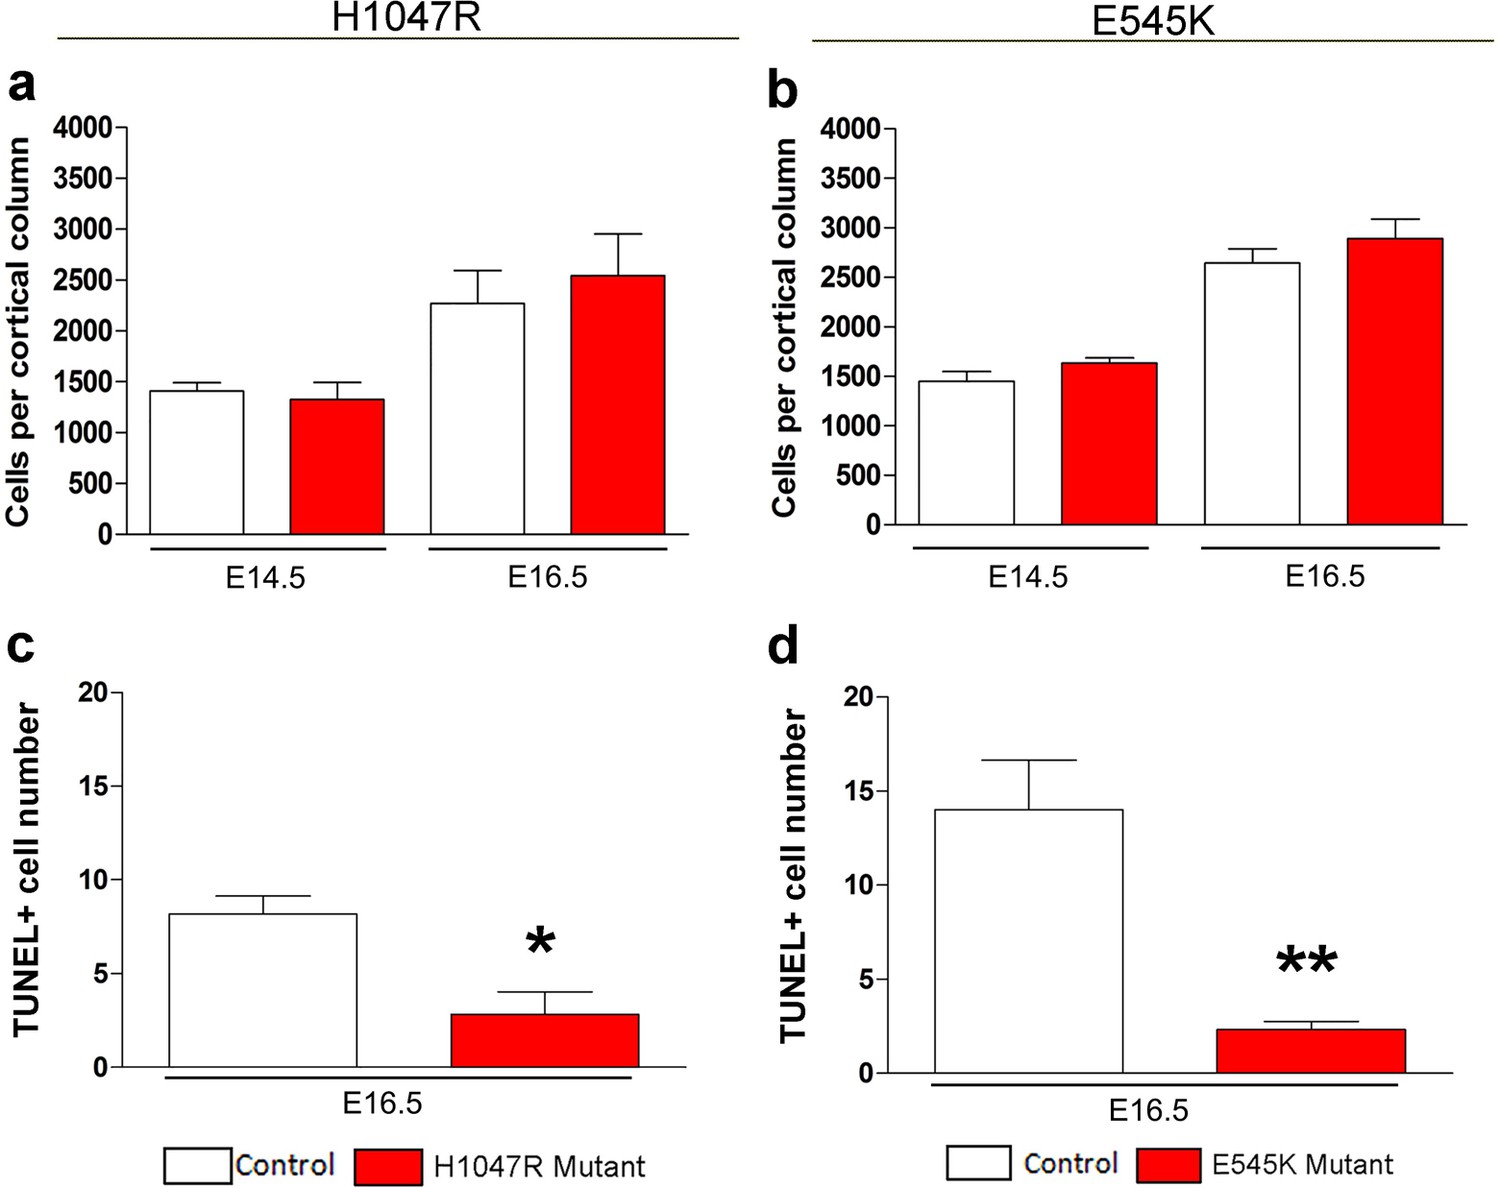
Effect of PIK3CA mutations on total cell numbers and apoptosis.
(a,b) No significant differences in the total cell numbers per cortical column length were observed in Nestin-cre;E545K and hGFAP-cre;H1047R mutants when compared with their respective control littermates, both at E14.5 and E16.5. (c,d) TUNEL-positive cell number at E16.5 is significantly lower in Nestin-cre;E545K and hGFAP-cre;H1047R mutants than the respective controls. *p<0.01; **p<0.001.
Figure 3—figure supplement 2
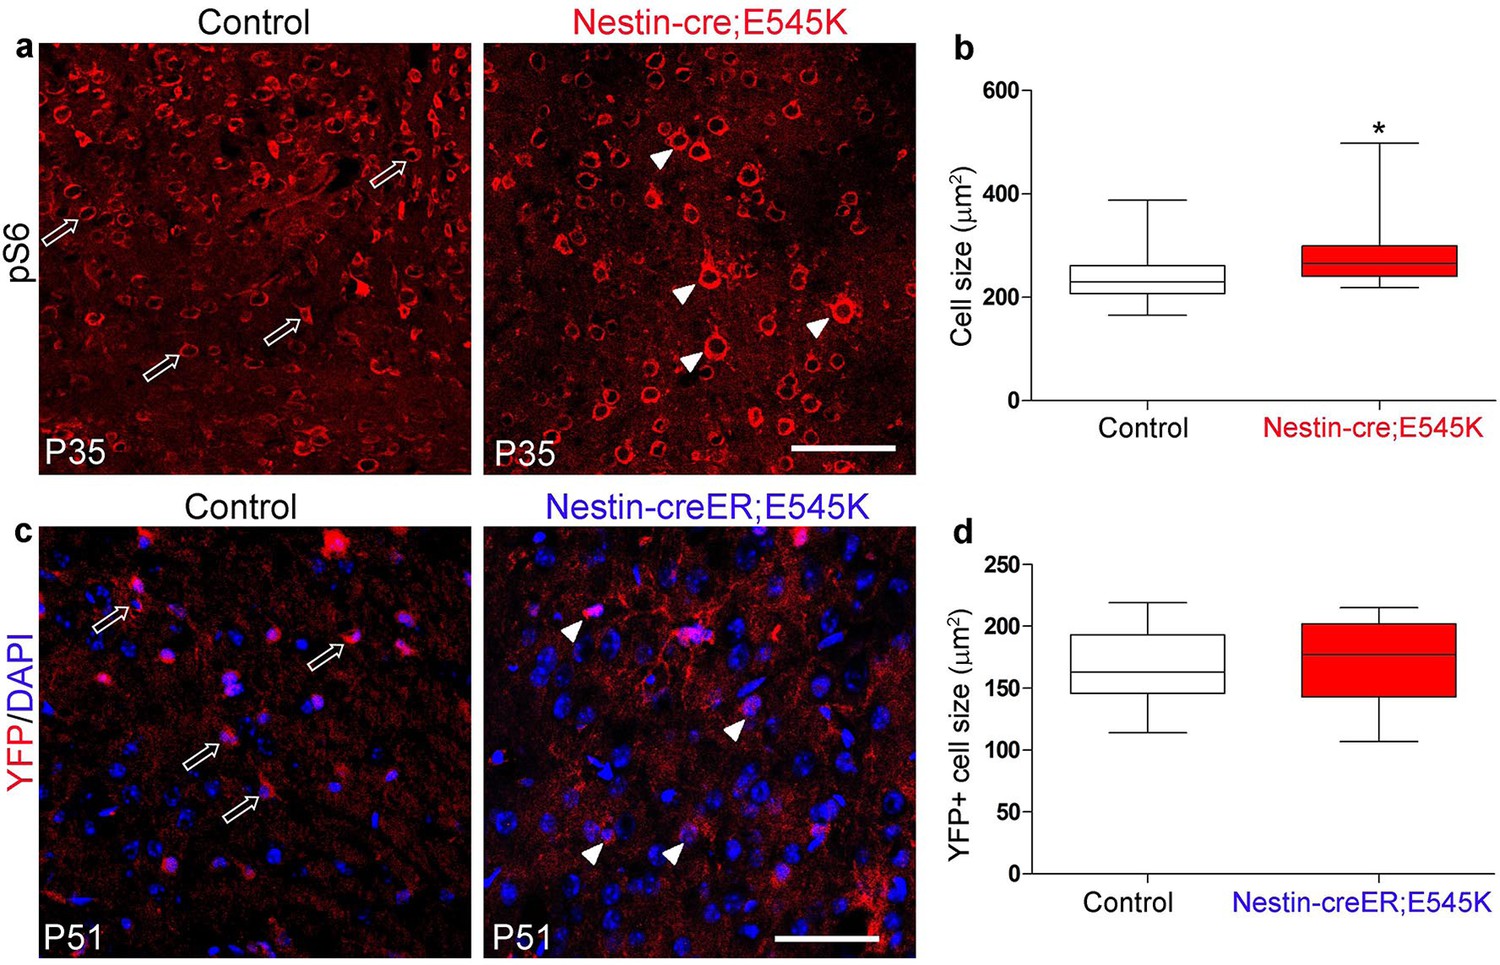
E545K mutation affects cell size when activated embryonically but not postnatally.
(a) Cells of P35 control and Nestin-cre;E545K mutant neocortex are marked by pS6. (b) Cell size of P35 E545K mutant was significantly larger than that of control littermate. (c) YFP-positive cells of P51 control (Nestin-creER;YFP) and mutant (Nestin-creER; E545K;YFP), induced by tamoxifen at P0 and P1 are the cre-recombined cells, DAPI stains the nuclei. (d) Size of these cells was not significantly different between the control and Nestin-creER;E545K mutants. Data are represented as median-centered box-and-whisker plot (b,d). white open arrows, control cells; white arrowheads, mutant cells. Scale bars: 100 μm (a,c).
Figure 4 with 2 supplements
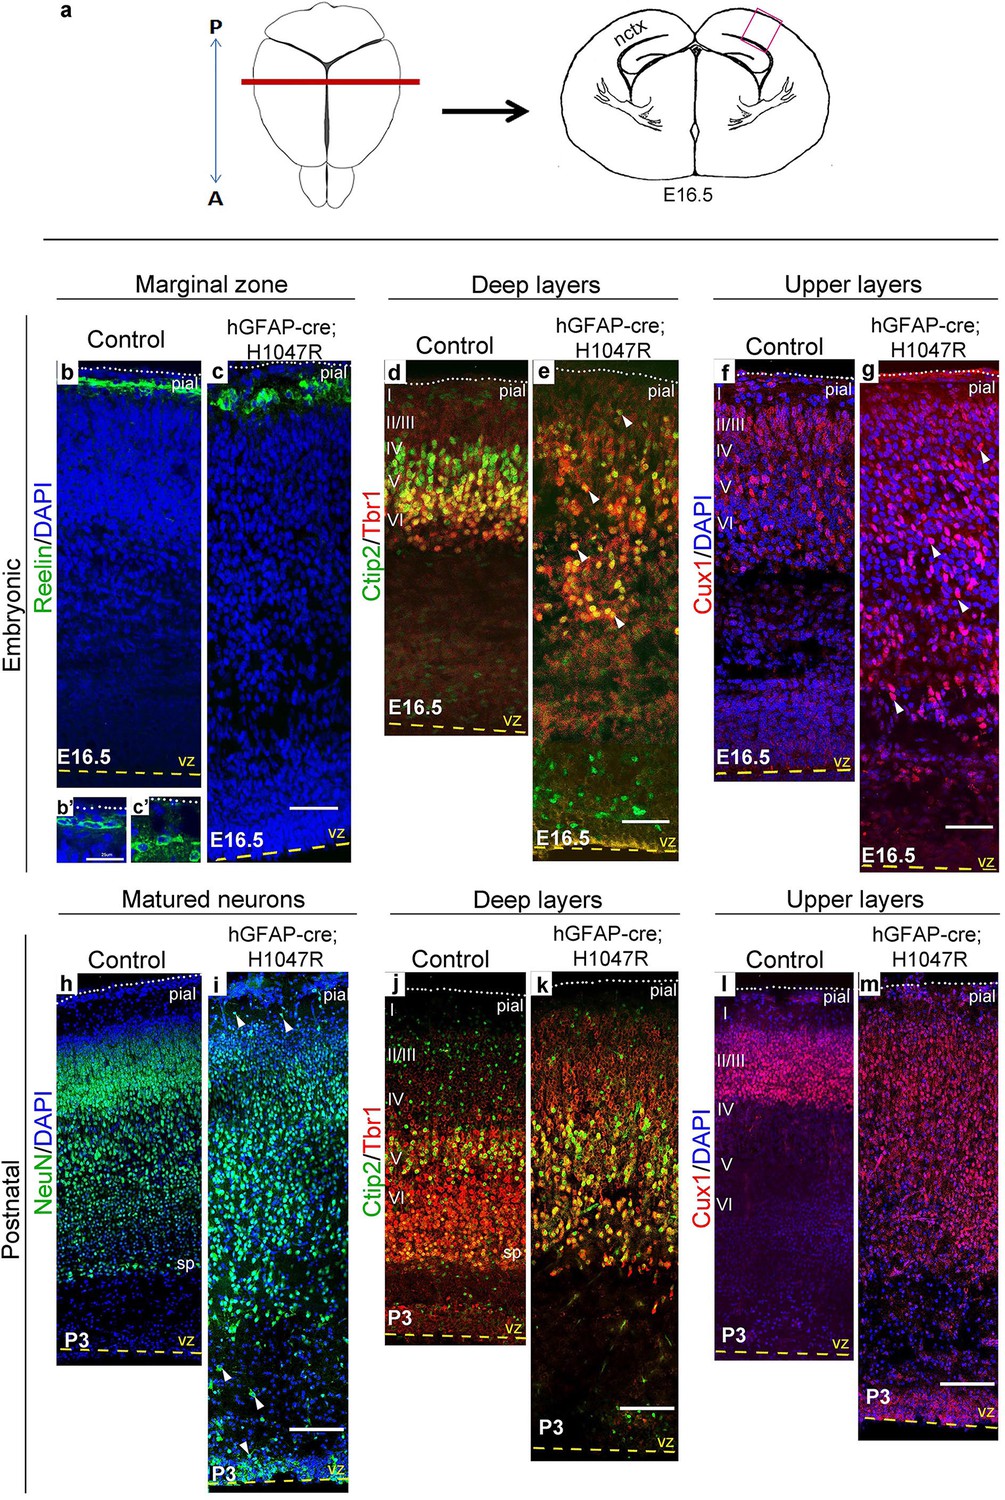
H1047R mutant mice display abnormal neocortical layering.
(a) Schematics of mouse brain and section; section corresponds to the marked coronal plane; red box in the section marks the area of neocortex (nctx) depicted in the images below. (b–g) and (h–m) correspond to ages E16.5 and P3 respectively. In control cortex, Reelin is in layer I (b), Ctip2 and Tbr1 in deep layers VI and V (d,j), Cux1 in upper layers II-IV (f,l) and NeuN in all matured neurons (h). H1047R mutants displayed abnormal distribution of cells for all neocortical layers, observed at E16.5 and P3 (c,e,g,i,k,m). (b’,c’) Magnified view of Reelin-positive cells in control and H1047R mutant. P3 H1047R mutant showed enlarged area between ventricular zone (vz) and cortical plate and absence of clear subplate (sp) boundary (h-k). A, anterior; P, posterior; yellow dashed lines, lateral ventricular lining; white dotted lines, pial surface; I-VI, neocortical layers; arrowheads, mispositioned mutant cells. Scale bars: 25 μm (b’,c’), 50 μm (b-i), 150 μm (j-o). See also Figure 4—figure supplements 1–2.
Figure 4—figure supplement 1
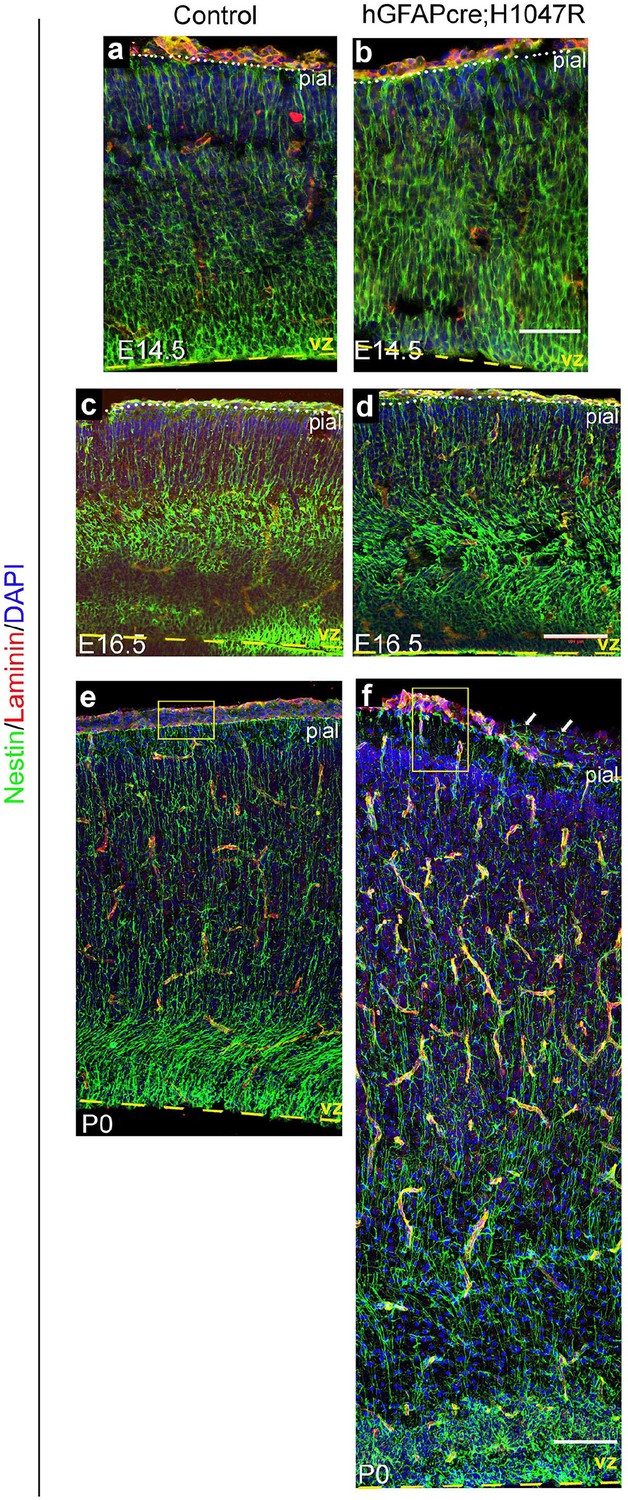
Nestin expression in hGFAP-cre; H1047R mutant.
Nestin-positive radial glial fibres appeared slightly irregular and hyperfasciculated in E14.5 H1047R mutant (b) but show progressively dysplastic morphology at E16.5 (d) and P0 (f), compared to respective controls (a,c,e). Yellow boxes (e,f) show broken pia and disrupted radial glial end-feet in the P0 H1047R mutant (f). Arrows indicate Nestin-fibers crossed the broken pial surface in the mutant. Scale bars: 50 μm (a,b), 150 μm (c-f).
Figure 4—figure supplement 2
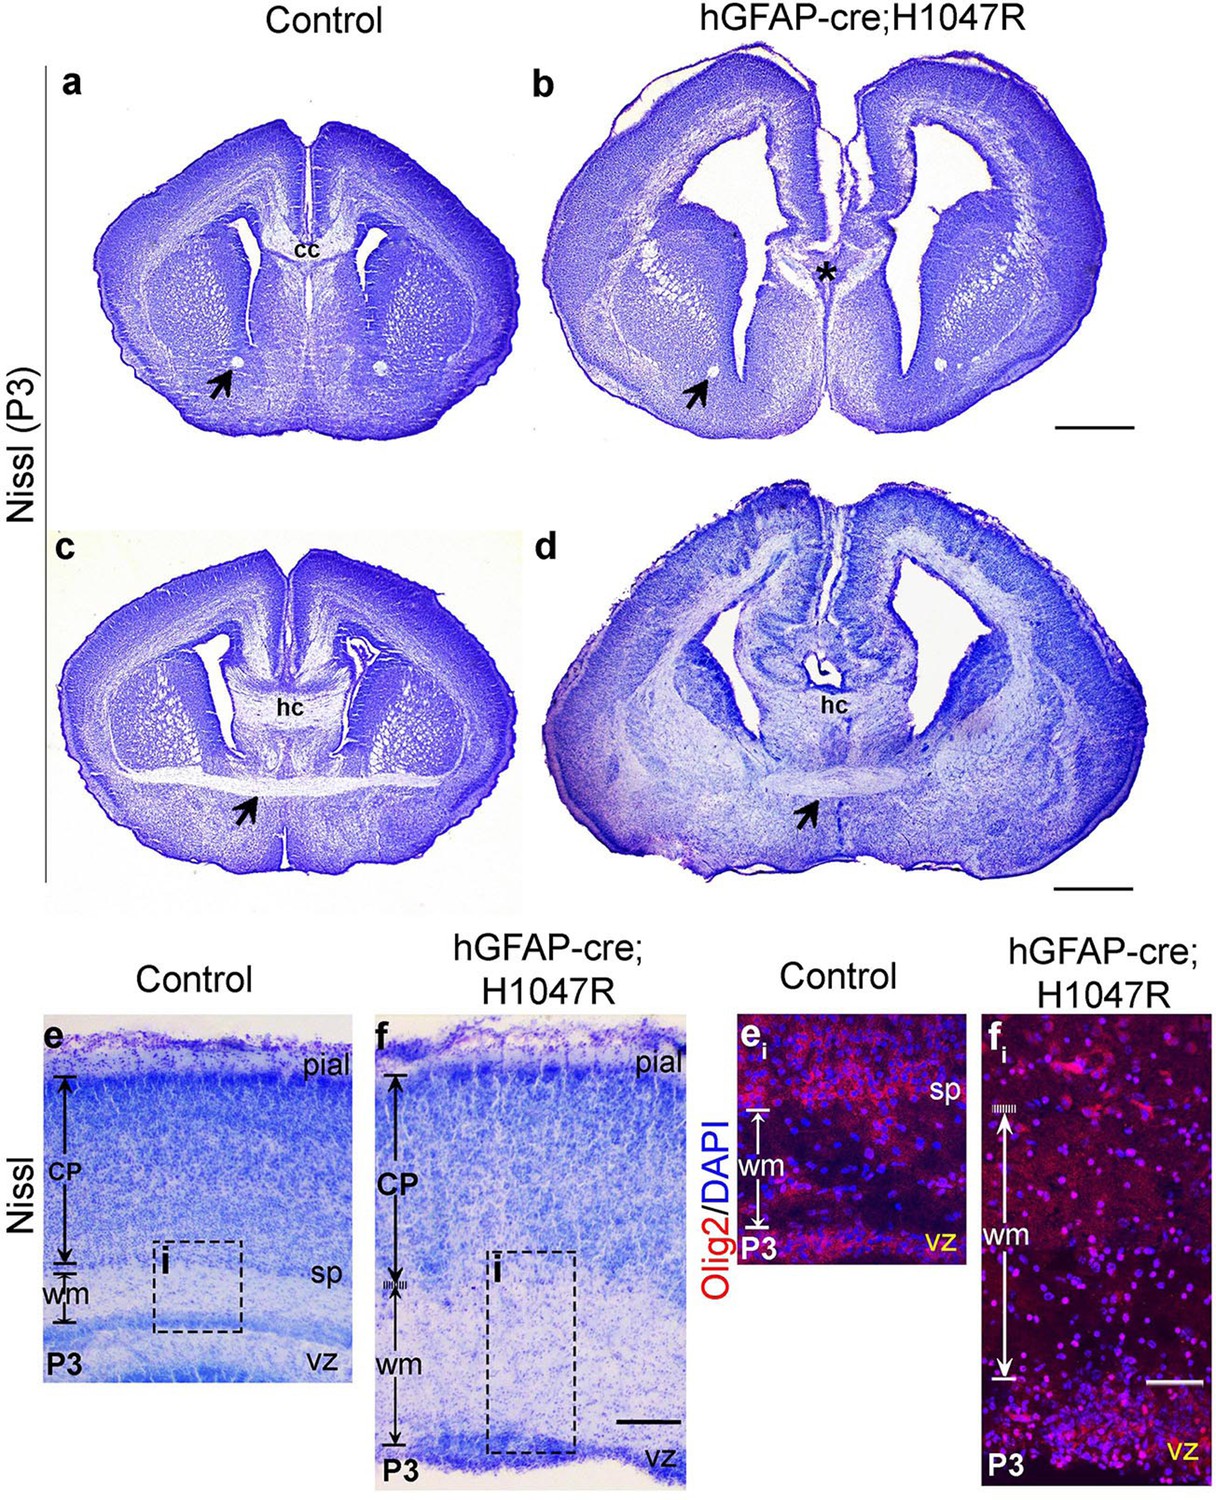
hGFAP-cre;H1047R mutant displays distinct white matter dysplasia.
Nissl-stained coronal sections of P3 control (a,c,e) and mutant (b,d,f) brains; areas with faint or absence of Nissl stain consist of axon fibre tracts. (a,b) and (c,d) show two comparable antero-posterior planes of section between control and H1047R (hGFAP-cre;H1047R) mutant. (a,c) P3 Control sections showed presence of anterior commissure (black arrow), corpus callosum (cc) and hippocampal commissure (hc). H1047R mutants lacked corpus callosum (asterisk, b) while other commissures were present (d). Magnified view of neocortex showed expansion of white matter (wm) areas in H1047R mutant compared to control (e,f). (ei) and (fi) correspond to the dotted boxes in e and f respectively, illustrating presence of increased number of Olig2-positive cells in the expanded white matter area of H1047R mutant. The mutant also had an unclear subplate boundary (white dotted line; f, fi), which is normally seen in the control (sp; e, ei). CP, cortical plate; vz, ventricular zone. Scale bars: 50 μm (ei,fi); 300 μm (e,f); 1 mm (a-d).
Figure 5 with 3 supplements
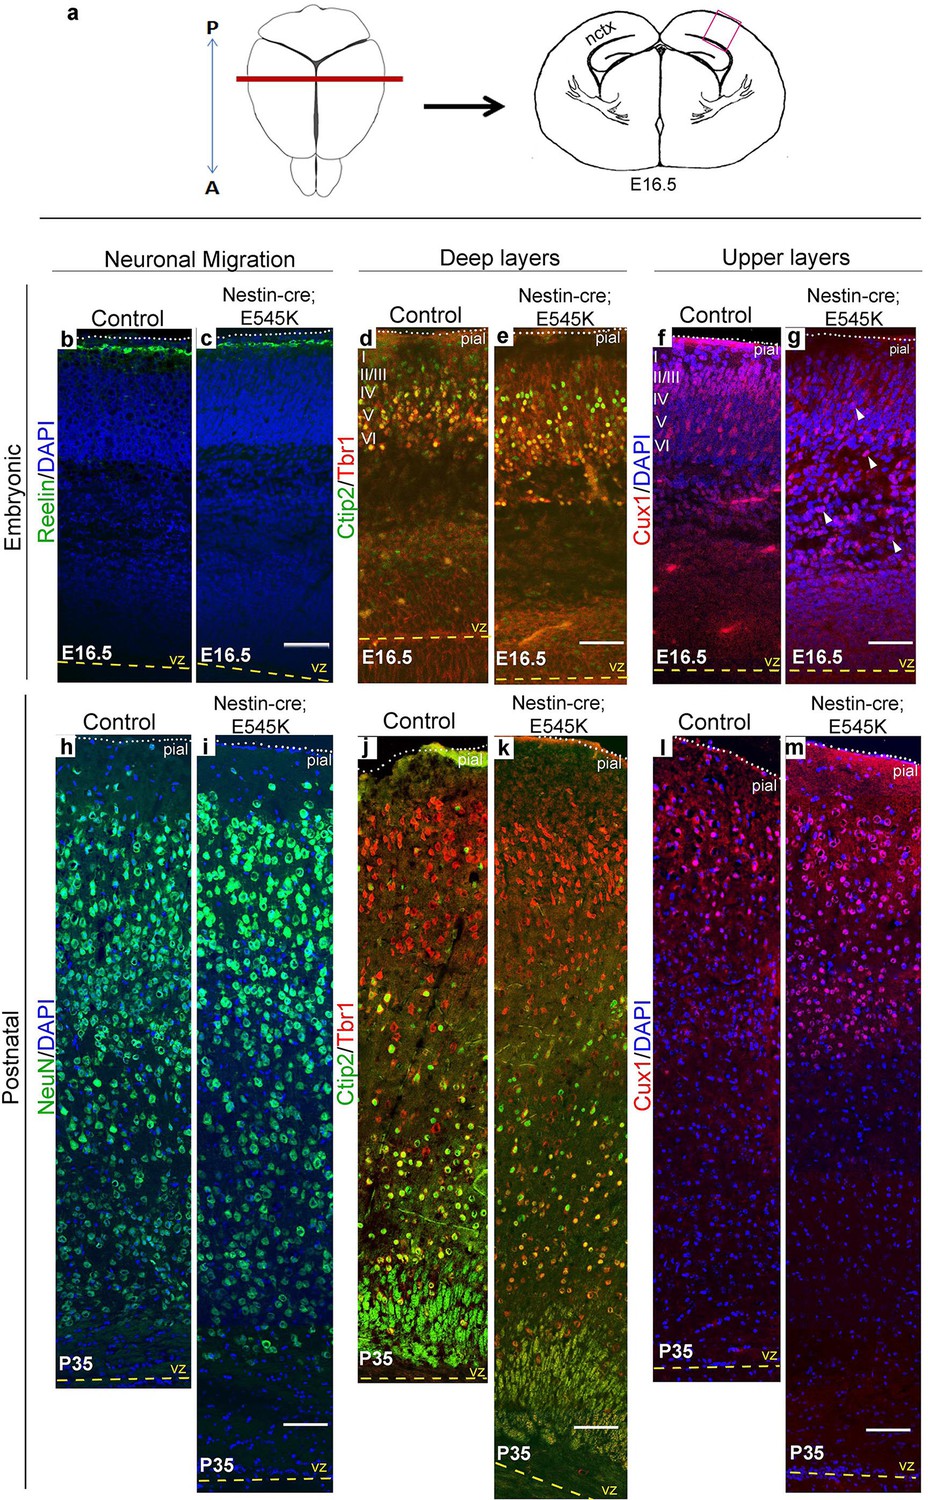
E545K mutant mice display abnormal neocortical upper layers.
(a) Schematics of mouse brain and section; section corresponds to the marked coronal plane; red box marks the area of neocortex (nctx) depicted in the images below. (b-g) and (h-m) correspond to ages E16.5 and P35 respectively. (b-g) Compared to control, in E16.5 E545K mutant, layer I appeared normal; deep layers lacked normal arrangement while Cux1-positive cells were dispersed throughout the cortical plate. Extent of dispersion was reduced postnatally (h-m). vz, ventricular zone; yellow dashed lines, lateral ventricular lining; white dotted lines, pial surface; I-VI, neocortical layers; arrowheads, mispositioned mutant cells. Scale bars: 50 μm (b-g), 150 μm (h-m). See also Figure 5—figure supplements 1–3.
Figure 5—figure supplement 1
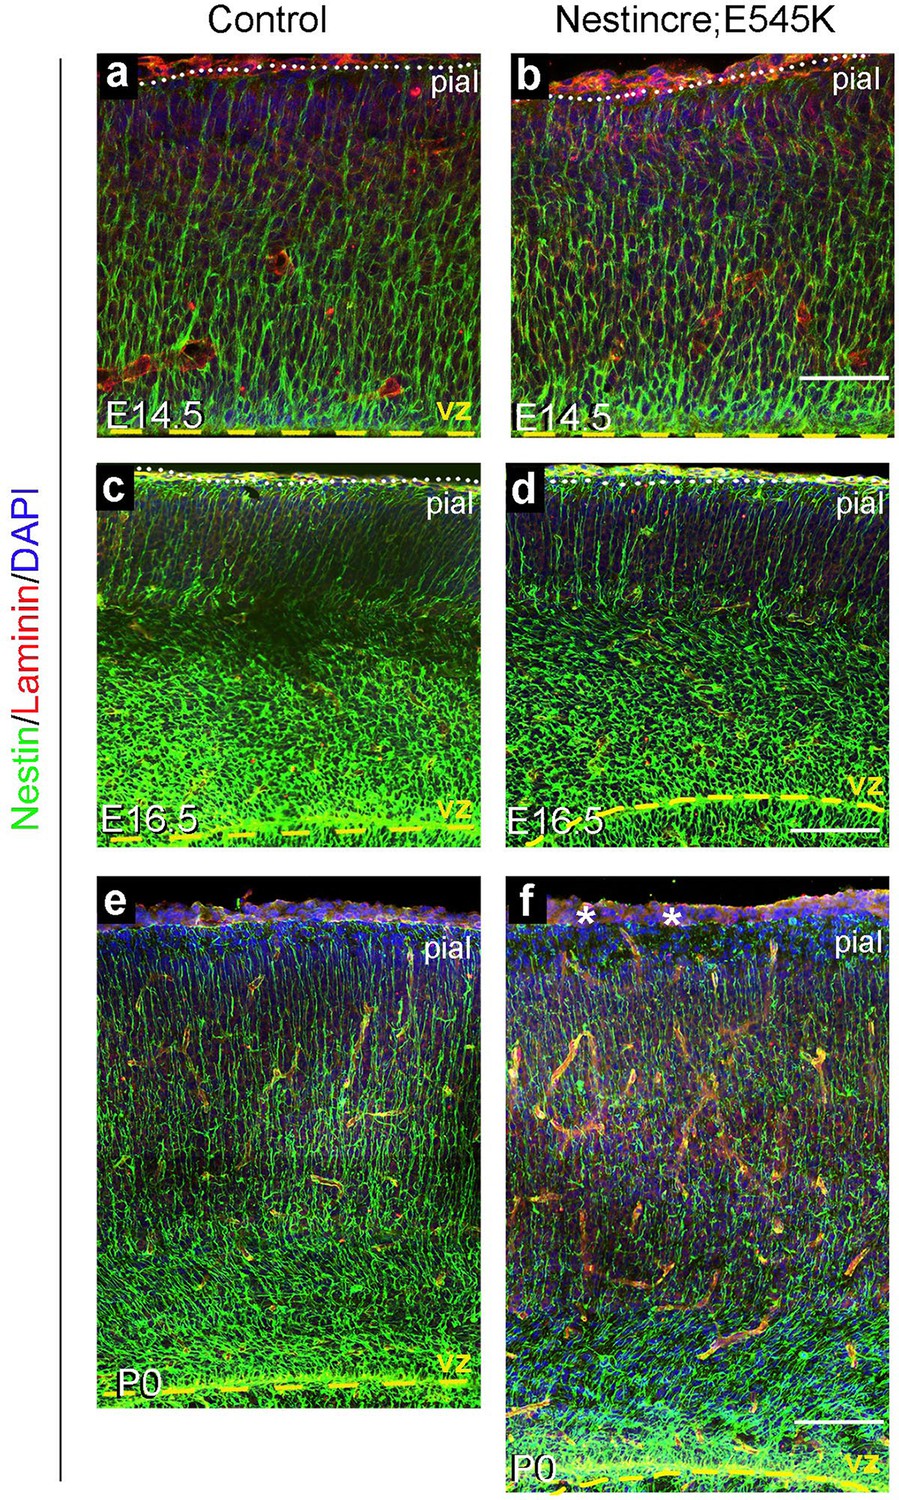
: Nestin expression in Nestin-cre;E545K mutant.
Nestin-positive radial glial fibres appeared normal in E14.5 and E16.5 Nestin-cre;E545K mutant (b,d) but subtle abnormalities in the glial end-feet were observed at P0 (asterisks, f), compared to respective controls (a,c,e). Scale bars: 50 μm (a,b), 150 μm (c-f).
Figure 5—figure supplement 2
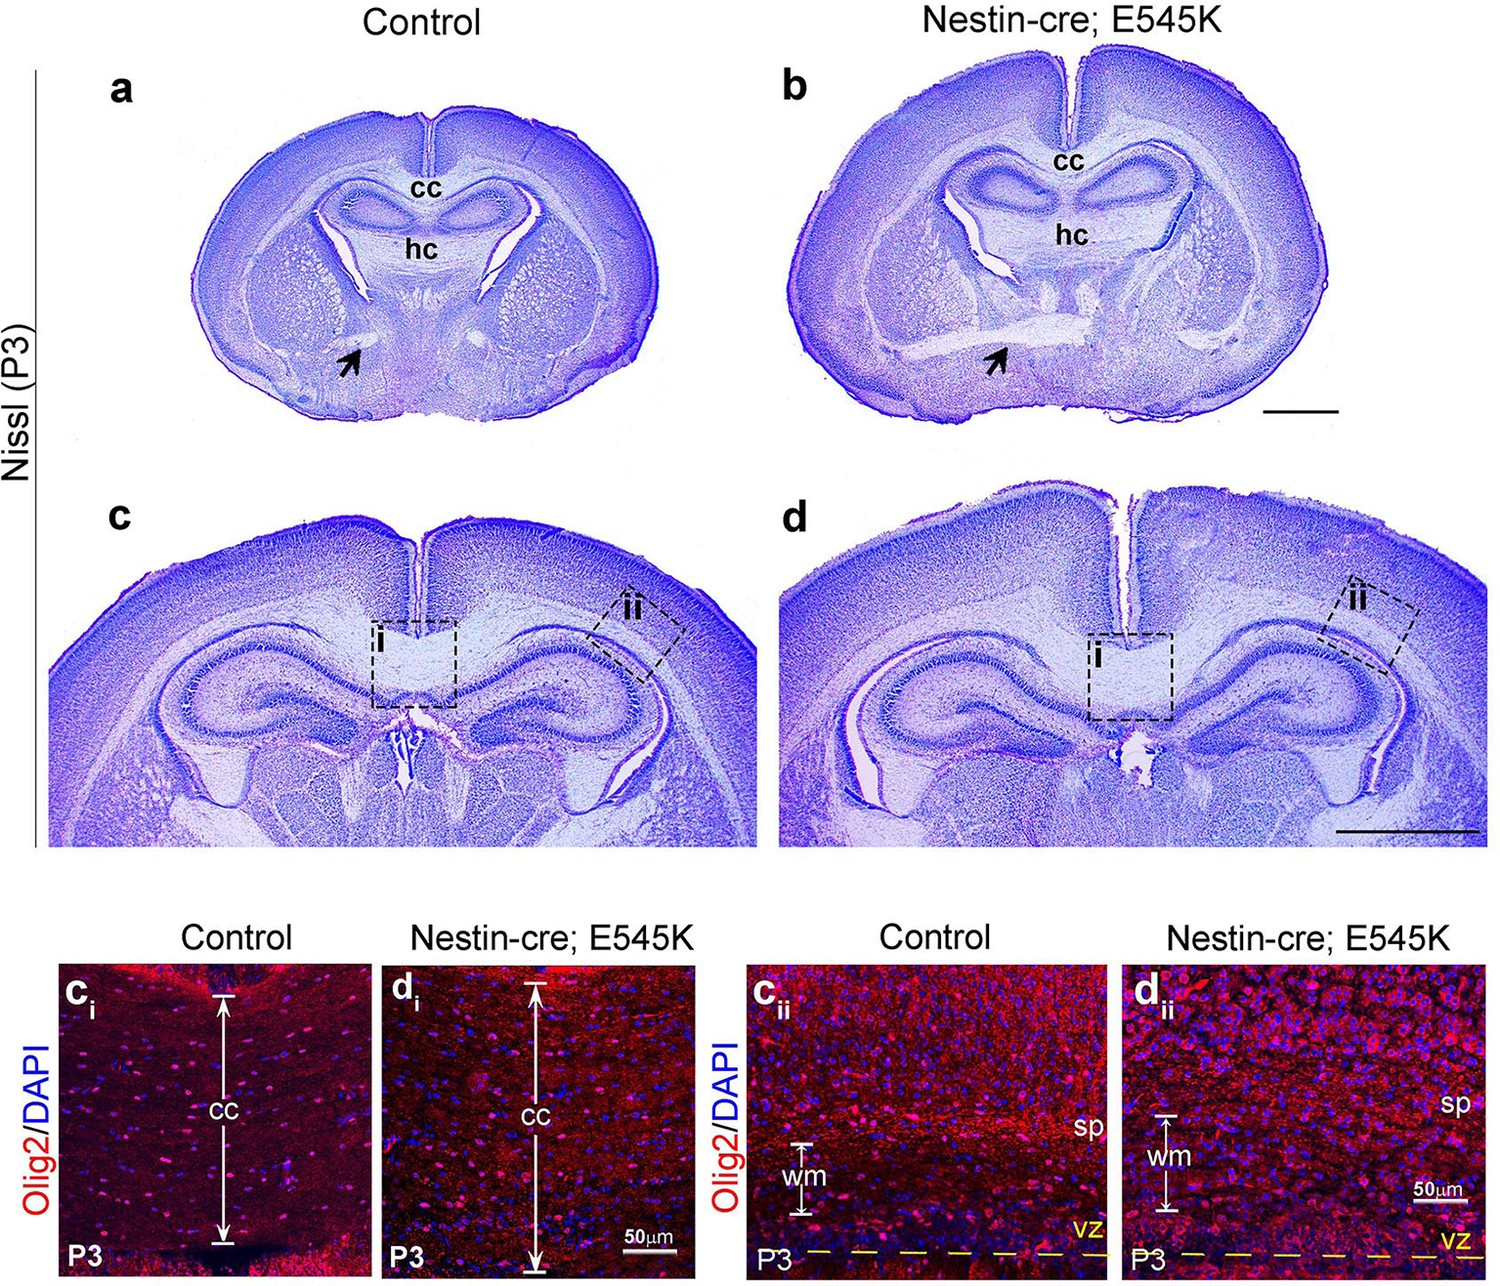
Nestin-cre;E545K mutant displays distinct white matter dysplasia.
(a,b) P3 Nestin-cre;E545K mutants had all three major commissures as in control littermates. (c,d) The mutant corpus callosum as well as the corona radiata were thickened compared to controls. ci, cii, di and dii correspond to the dotted boxes in (c) and (d) respectively. E545K mutants had increased numbers of Olig2-positive cells in an expanded corpus callosum (di) and lateral fiber tract (dii) with respect to the respective controls (ci,cii). The subplate in the E545K mutant though defined was less packed than the control. CP, cortical plate; cc, corpus callosum; hc, hippocampal commissure; sp, subplate. Scale bars: 50 μm (ci,cii,di,dii); 1 mm (a-d).
Figure 5—figure supplement 3
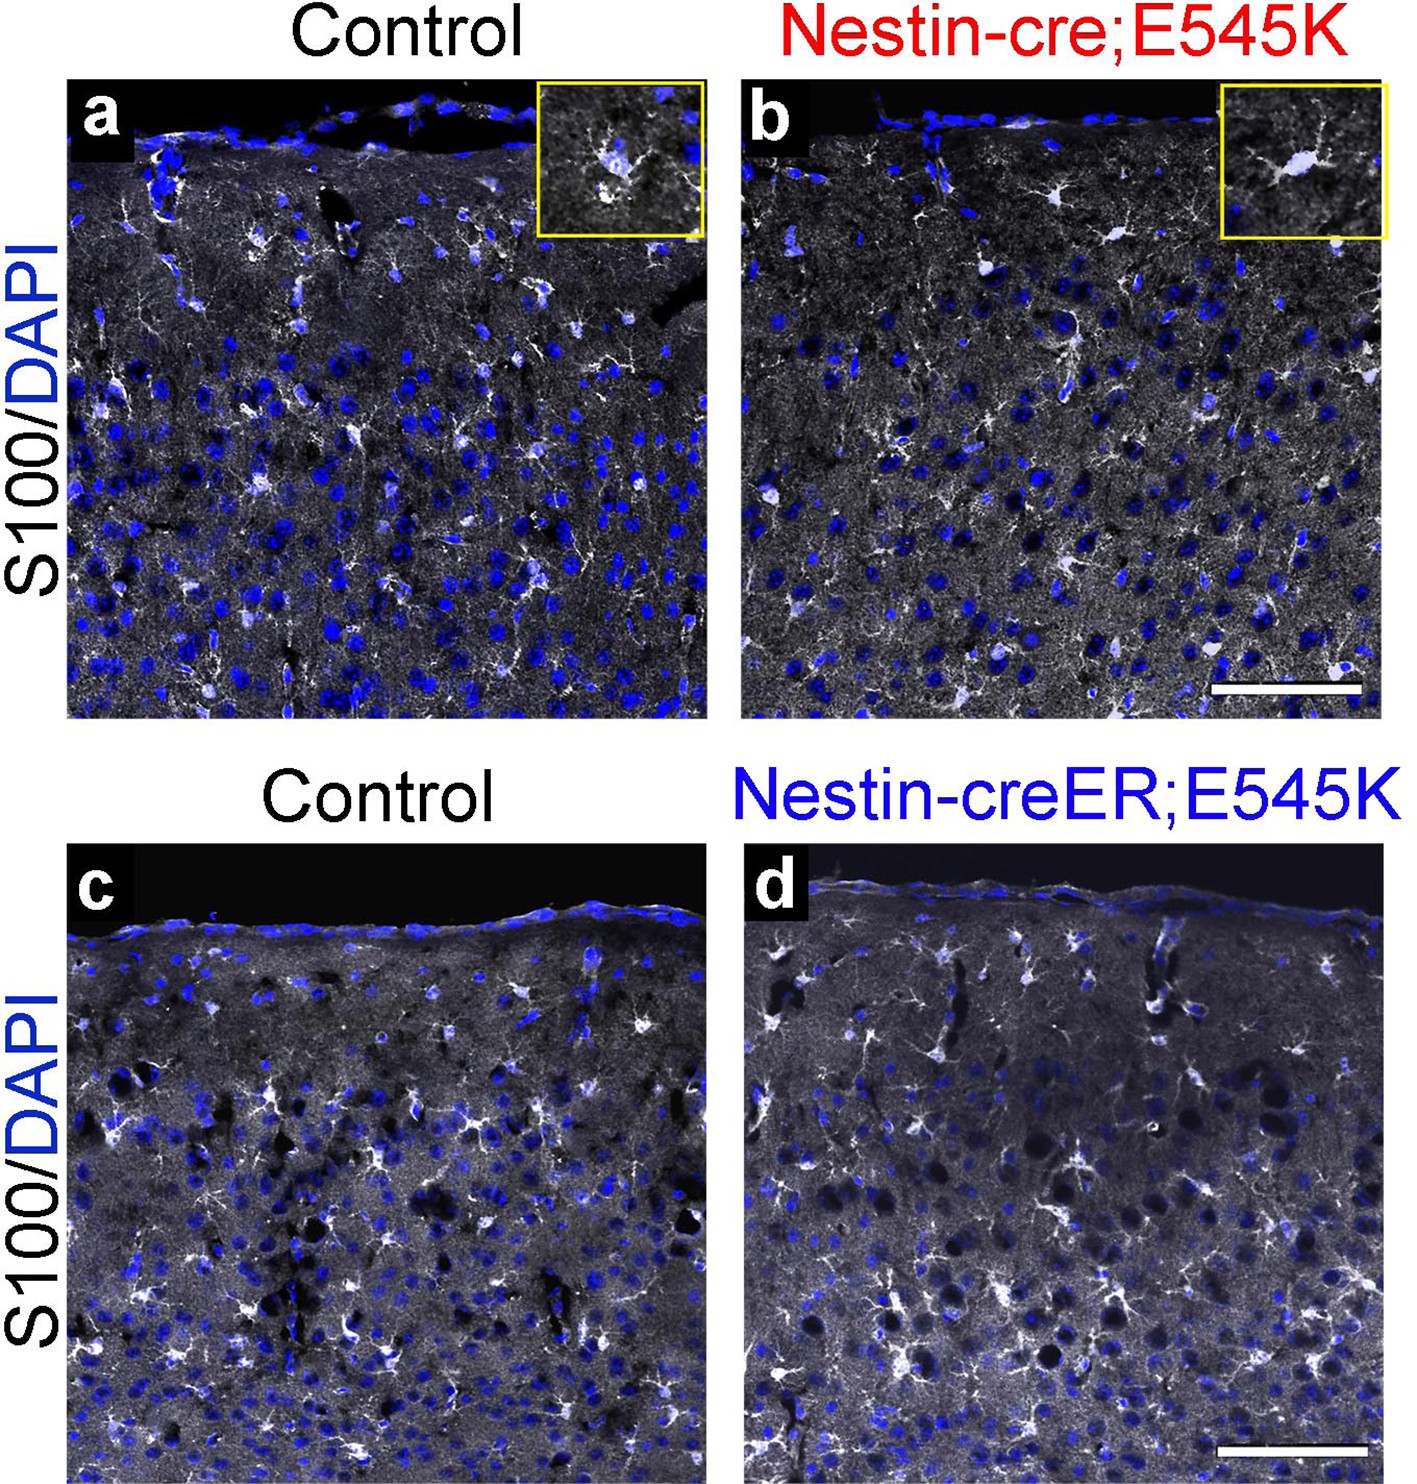
Astrocytes show no gross dysmorphology in adult Nestin-cre;E545K and Nestin-creER;E545K mutants.
S100 is expressed in astrocytes (a-d). No gross change in morphology or number was observed in the Nestin-cre;E545K and Nestin-creER;E545K;YFP mutants compared to controls. Insets (a,b) show magnified cells. Scale bars: 100 μm (a-d).
Figure 6
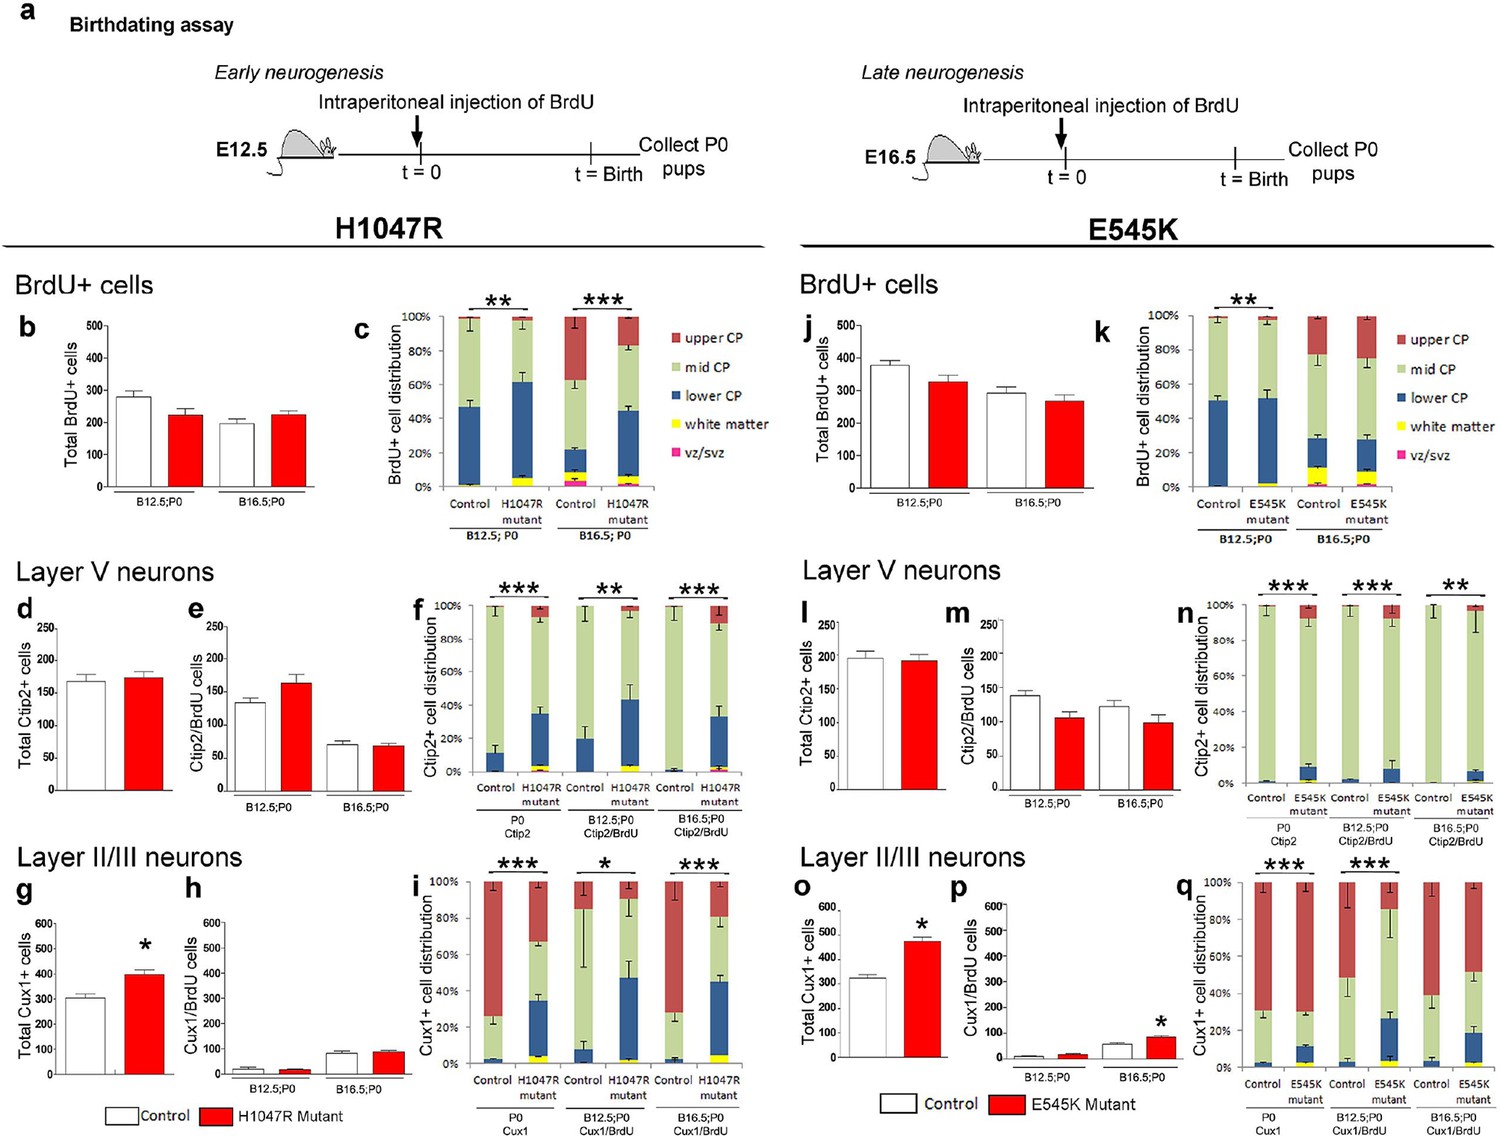
Birthdating assays demonstrate defects in laminar distribution.
(a) Experimental outline of birthdating assays: BrdU was injected at E12.5 and E16.5 and analyzed at P0 (B12.5;P0 and B16.5;P0). Total number of BrdU+ cells at P0 generated at E12.5 and E16.5 (b,j), and total number of Ctip2+ cells (layer V neurons; d,l) were not significantly different between respective controls and mutants, for both H1047R and E545K lines. (c) Distribution of BrdU+ cells in the neocortex was significantly different between control and hGFAP-cre;H1047R mutant for both early and late assays, with more cells residing in the lower cortical plate and white matter instead of mid and upper zones of the cortical plate. (e,m) Total number of layer V neurons in both H1047R and E545K mutants, born at E12.5 and at E16.5, did not significantly differ from the respective controls; but showed significant difference in their zonal distribution with Ctip2+BrdU+ cells predominating the lower cortical plate in both the mutants (f,n). Total number of Cux1+ neurons (layers II/III neurons; g,o) was significantly higher in both the mutants compared with the respective controls. The colocalization of Cux1 and BrdU was not significantly different in the H1047R mutant and control for both ages (h); but number of Cux1+ cells born at E16.5 was significantly higher in E545K mutant than in the control (p). (i,q) Zonal distribution of Cux1+ cells was significantly different between controls and mutants, with more Cux1+ cells residing at the lower portion of the P0 cortical plate. The H1047R mutant phenotype is more extreme than the E545K mutant. Data are represented as mean ± SEM. *p<0.05; **p<0.001; ***p<0.0001.
Figure 7 with 1 supplement
PI3K activity acutely modulates epileptic seizures.
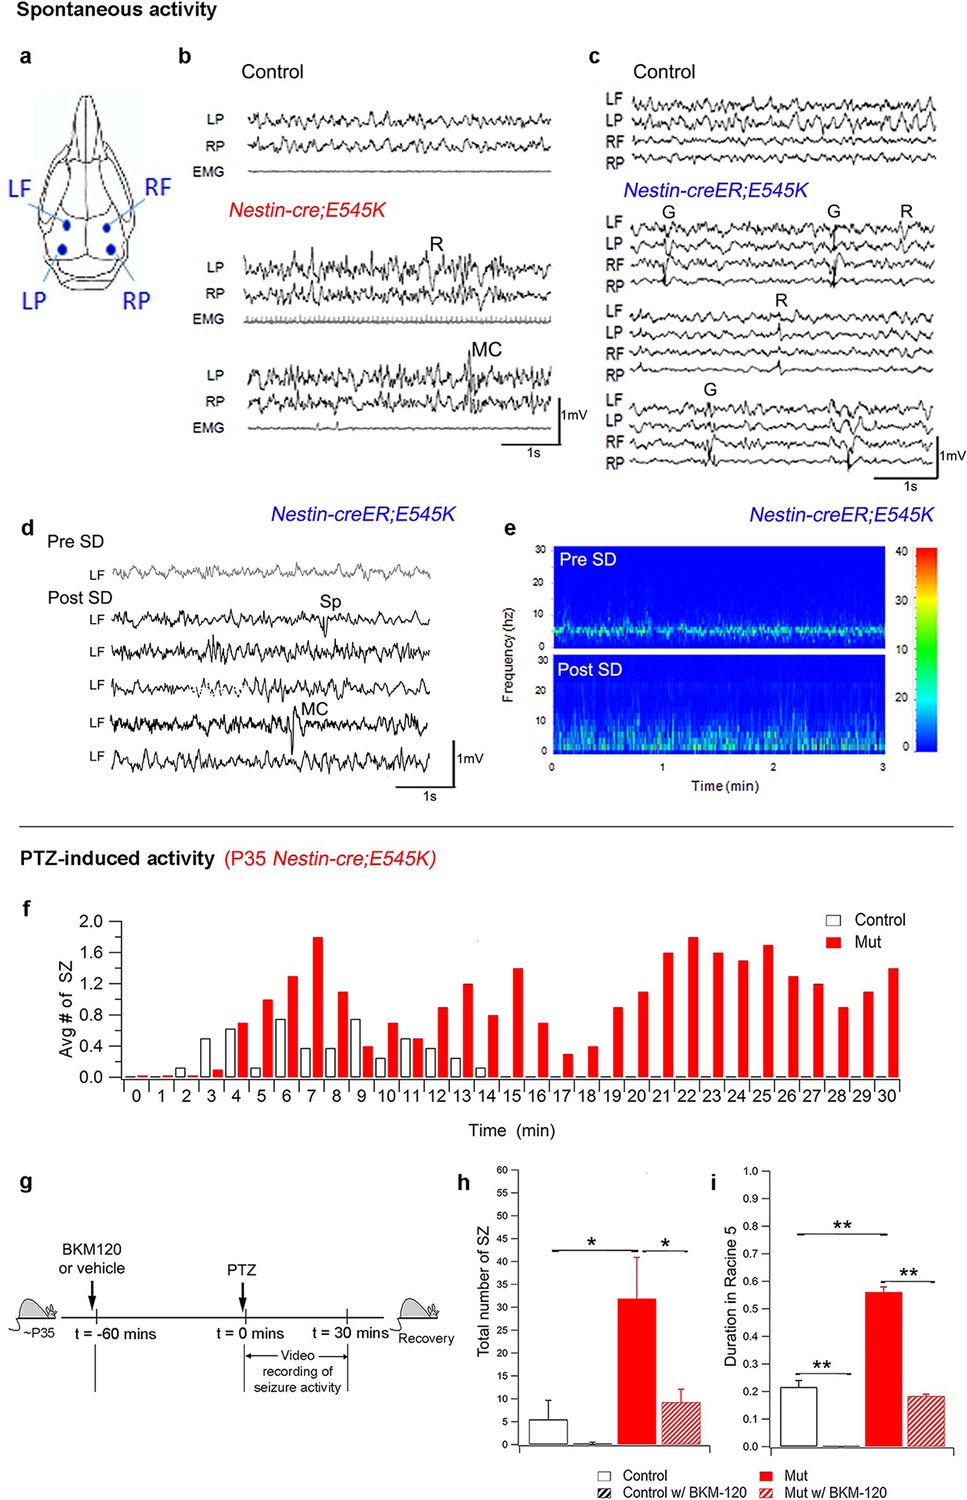
(a) Schematic shows electrode placement for EEG recordings. LF=Left Frontal, LP= Left Posterior, RF=Right Frontal, RP= Right Posterior. Only 2 electrodes were placed in P35 Nestin-cre;E545K. (b) EEG-EMG tracings of Nestin-cre;E545K mutant showed bilateral spikes/polyspikes, myoclonic (MC) seizures, fast and slow wave discharges, not associated with movement on video or EMG activity. (c) Generalized (G) and regional (R) spike and wave discharges were observed in Nestin-creER;E545K mice. Scale: 1s,1mV. (d,e) Sleep deprivation (SD) enhances epileptiform EEG activity in Nestin-creER;E545K mutant. EEG tracings of a Nestin-creER;E545K mutant mouse after 5 hr of normal sleep (Pre SD) and after 5 hr of total sleep deprivation (Post SD) in the same mouse (d), the mutant showing myoclonic (MC) seizures and isolated regional spikes (R). Power spectrum analysis, representing the frequency distribution for EEG activity over time, also displayed increased activity of the mutant post SD (e). (f) Bar chart showing average number of seizures (SZ) in PTZ-induced P35 Nestin-cre;E545K and control over time. (g) Experimental outline for BKM120-PTZ test. (h) Total number of seizures was significantly higher in P35 mutants than controls. Acute administration of BKM120 reduced number of seizures in mutants. (i) Duration of sustained generalized tonic-clonic seizure state (Racine 5), normalized to the total time of test, was significantly longer in P35 Nestin-cre;E545K mutants than controls. BKM120 significantly reduced the duration. Data are represented as mean ± SEM. *p<0.05; **p<0.0001. See also Figure 7—figure supplement 1.
Figure 7—figure supplement 1
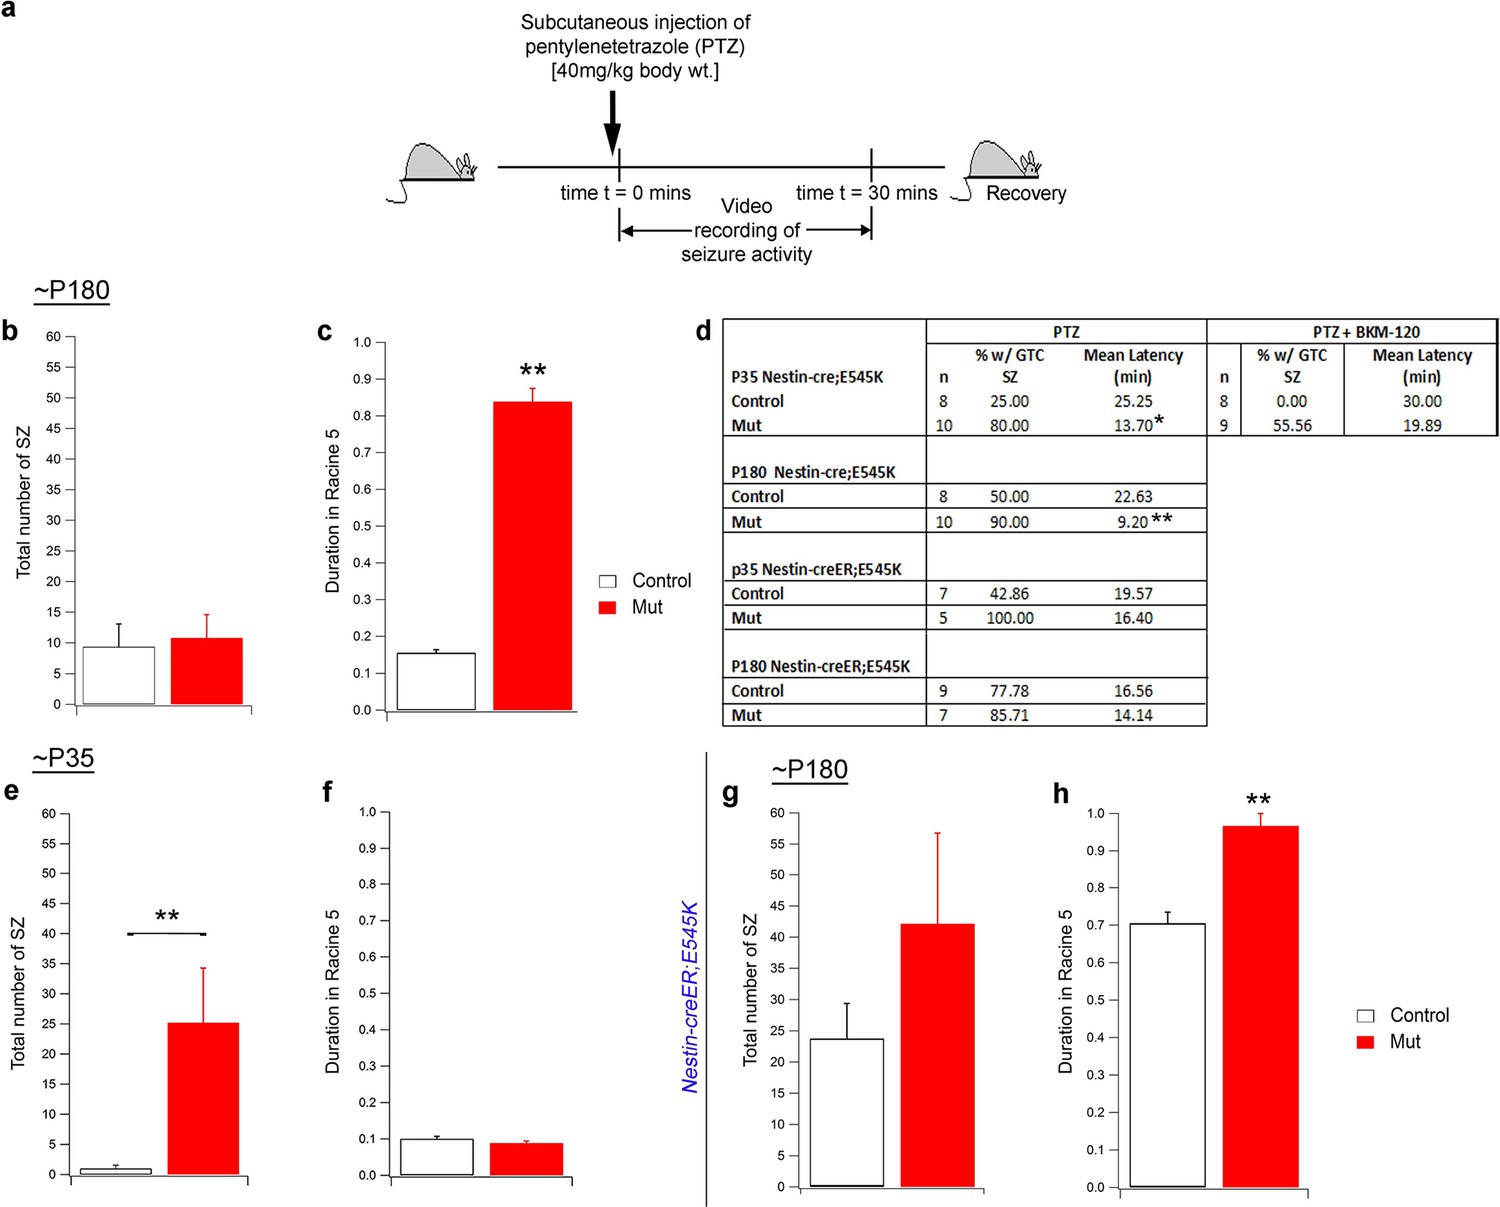
Seizure activity of E545K mutants at old age.
(a) Experimental outline for ~P180 constitutive (Nestin-cre;E545K) mice: Seizures were induced in mice by administering PTZ subcutaneously and then video recorded for 30 min. (b,c) Total number of seizures was not significantly different in P180 Nestin-cre;E545K while duration spent by these mutants in severe seizure attacks (Racine 5), measured as a percentage of the total time of recording, was significantly longer compared to respective controls. (d) Table showing percentage of generalized tonic clonic seizures (GTC SZ) and mean latency (in mins) across different genotypes and age groups. (e,f) In ~P35 Nestin-creER;E545K mutants, total seizure number was higher while duration spent in Racine 5, measured as a percentage of the total time of recording, was the same as respective controls. (g,h) In ~P180 Nestin-creER;E545K mutants, total seizure number was comparable to the controls but the duration in Racine 5 was different compared to respective controls. *p<0.01; **p<0.001.
Figure 8 with 1 supplement
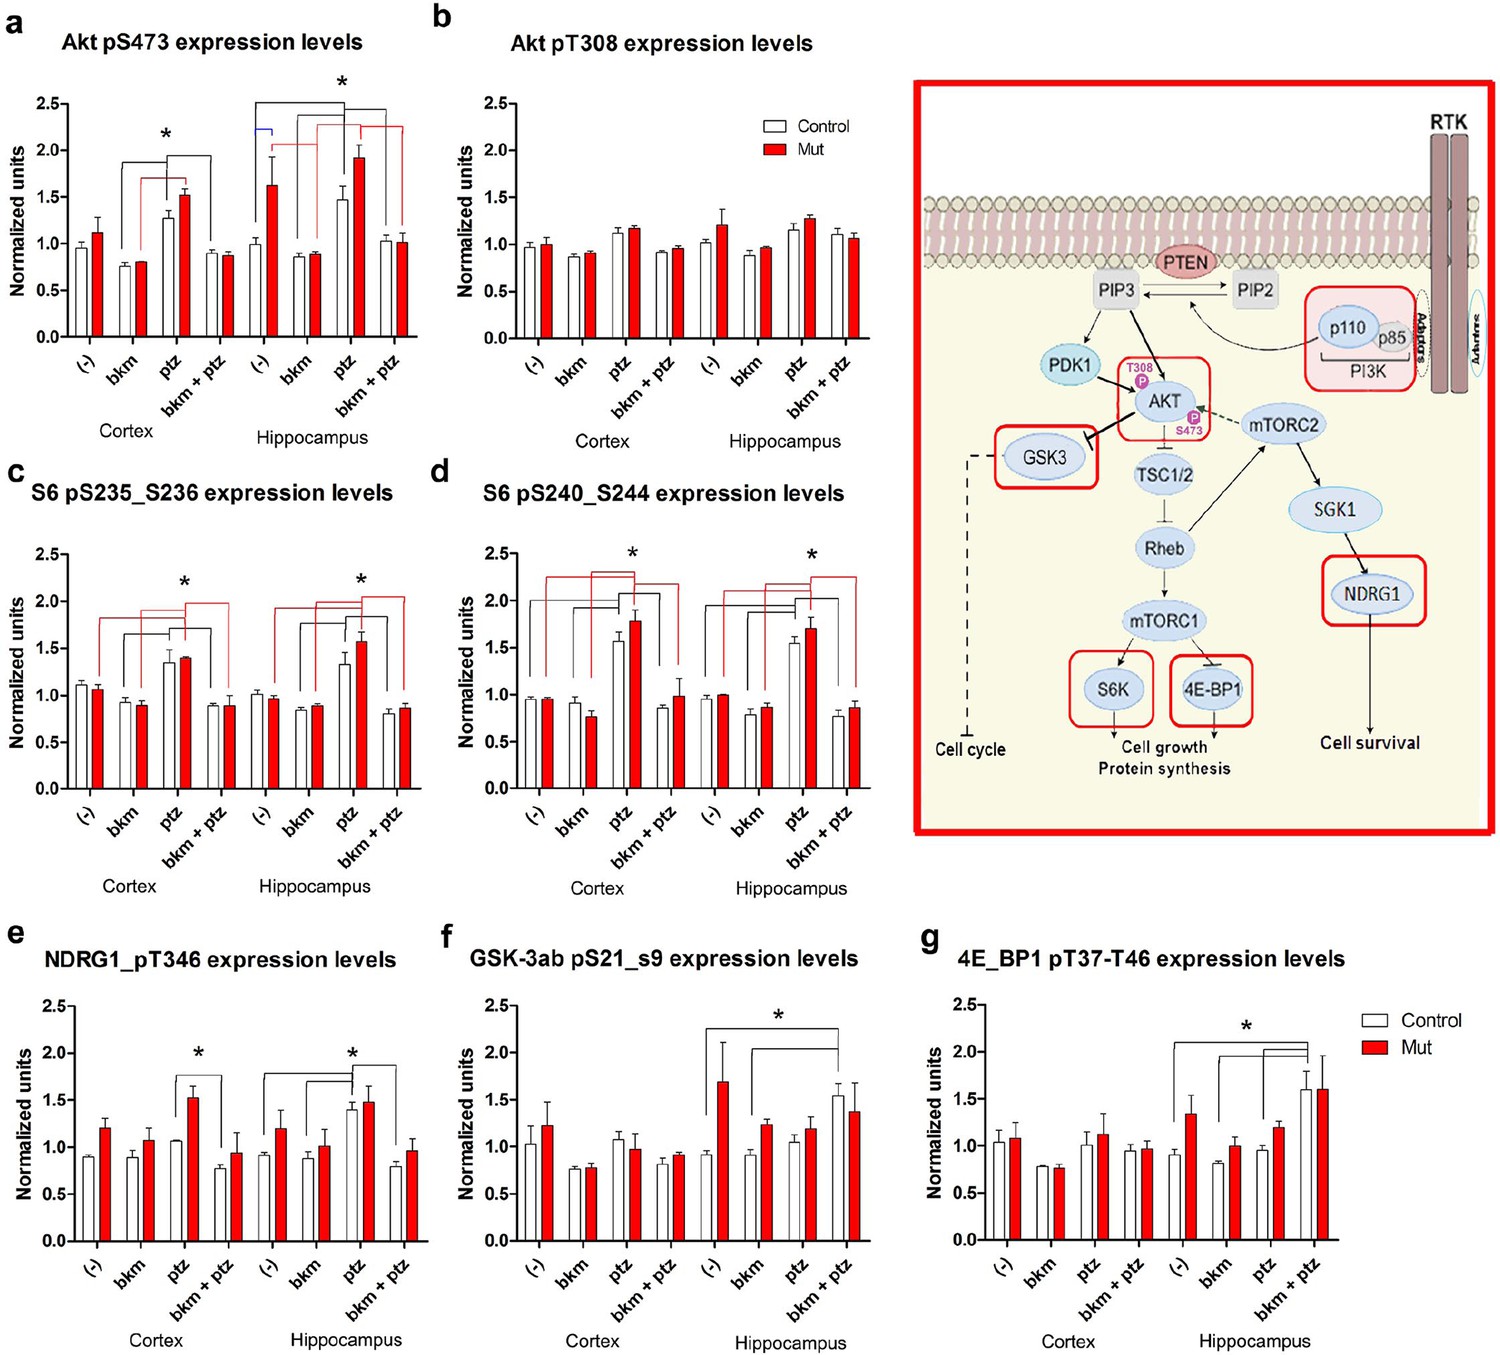
BKM120 acutely alter PI3K pathway protein profile.
(a–g) Graphs show differential protein levels in P35 Nestin-cre;E545K mutant and control brains due to different treatments: untreated (-); BKM120; PTZ; BKM120+PTZ. Data are represented as mean ± SEM. *p<0.05. Inset shows simplified PI3K pathway; BKM120 significantly regulated the highlighted molecules. See also Figure 8—figure supplement 1.
Figure 8—figure supplement 1
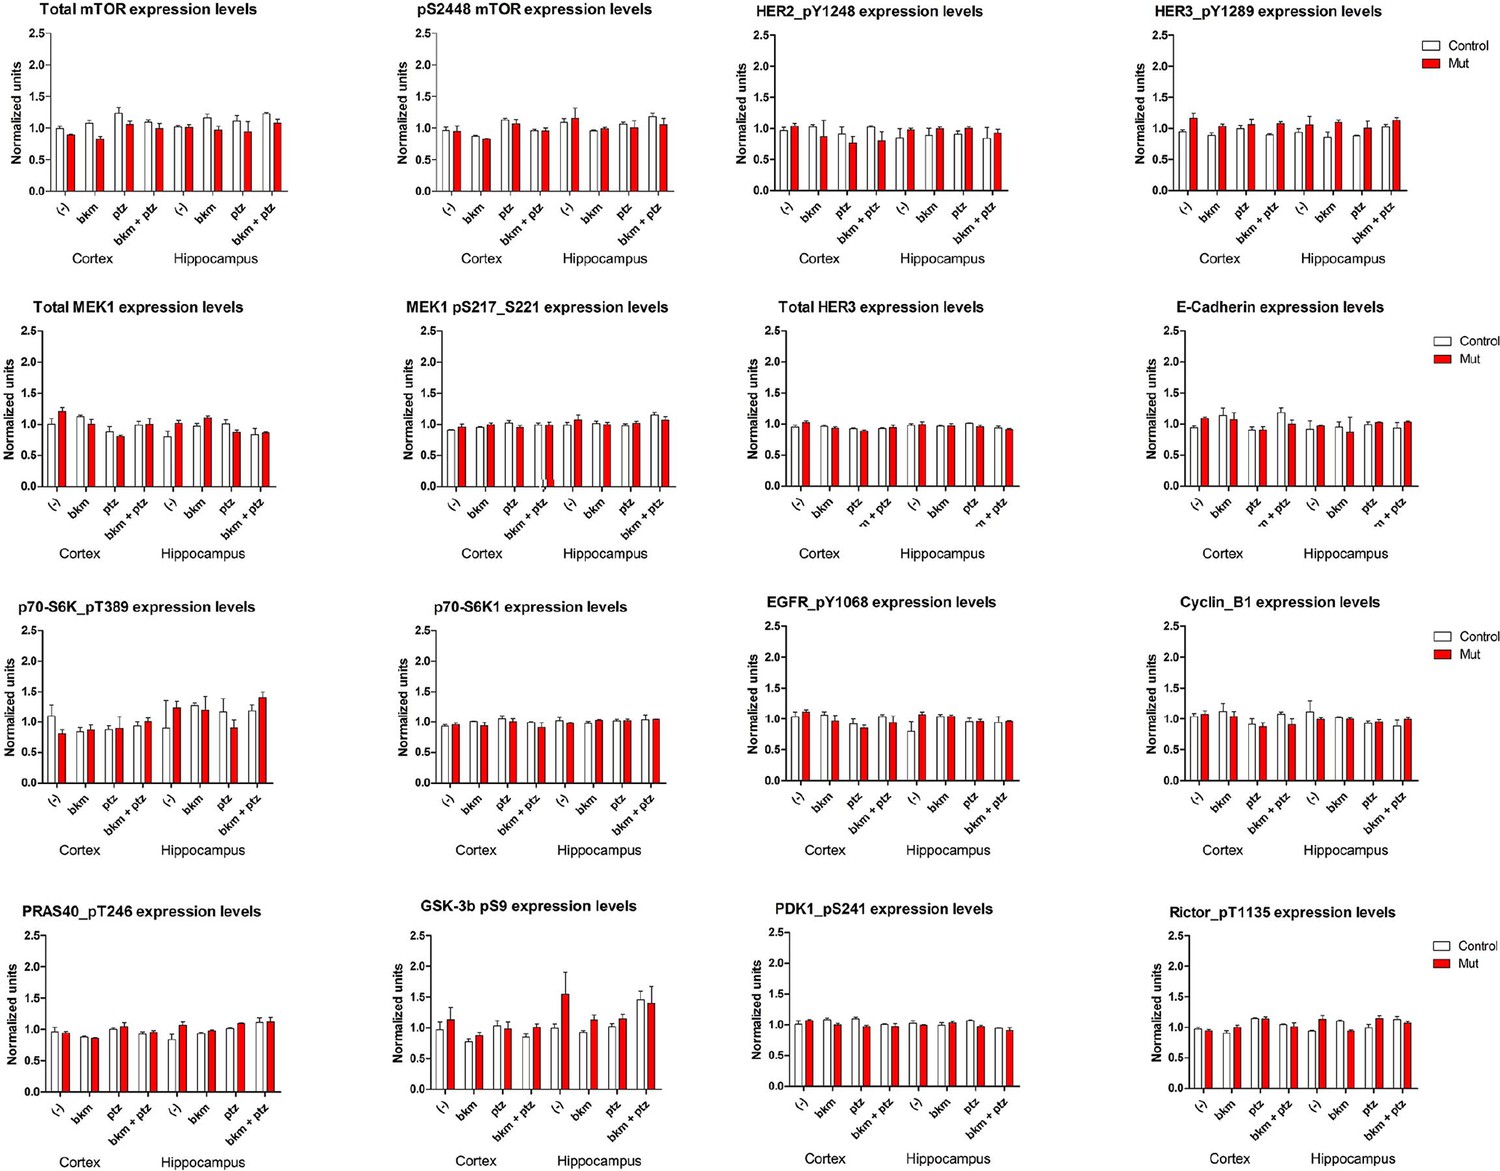
RPPA analysis graphs.
Protein profile of cortical and hippocampal samples from untreated and treated P35 control and Nestin-cre;E545K mutant. Graphs show differential protein levels due to PTZ and BKM120 treatments on control and Nestin-cre;E545K mutant.
Tables
Table 1
Table displays comparison of the key features across different Pik3ca genetic models used in this study.
Mutant allele | H1047R | E545K | |||
Cre driver | hGFAP-cre(dox from E0.5) | hGFAP-cre(dox from P1) | Nestin-cre | hGFAP-cre | Nestin-creERT2(tamoxifen @P0/P1) |
GoF expression onset | Late embryonic | Neonatal | Early embryonic | Late embryonic | Neonatal |
Viability | Lethal by weaning age | Viable | Viable | Viable | Viable |
Megalencephaly | ✓ | X | ✓ | ✓ (intermediate) | X |
Hydrocephalus | ✓ | X | X | X | X |
Increased cell size | ✓ | Not tested | ✓ | X | X |
Cortical dysplasia | ✓ | X | ✓ | X | X |
White matter dysplasia | ✓ | X | ✓ | ✓ (data not shown) | X |
Epilepsy | Not tested | Not tested | ✓ | Not tested | ✓ |
Additional files
-
Supplementary file 1
Parameters for motor rotation in LabChart 8 Software
Table shows the list of parameters customized in the stimulator panel dialog box of LabChart 8 Software, in order to randomize the speed and direction of rotation of the motor used for the sleep deprivation study. The stimulation program cycle, comprising segments 1–12, was repeated through the entire duration of the sleep deprivation experiment (i.e. for 5 hr).
- https://doi.org/10.7554/eLife.12703.024
Download links
A two-part list of links to download the article, or parts of the article, in various formats.
Downloads (link to download the article as PDF)
Open citations (links to open the citations from this article in various online reference manager services)
Cite this article (links to download the citations from this article in formats compatible with various reference manager tools)
Mouse models of human PIK3CA-related brain overgrowth have acutely treatable epilepsy
eLife 4:e12703.
https://doi.org/10.7554/eLife.12703


