The human SKA complex drives the metaphase-anaphase cell cycle transition by recruiting protein phosphatase 1 to kinetochores
- Oklahoma Medical Research Foundation, United States
- University of Texas Southwestern Medical center, United States
- Howard Hughes Medical Institute, University of Texas Southwestern Medical center, United States
- University of Virginia School of Medicine, United States
Figures
Figure 1
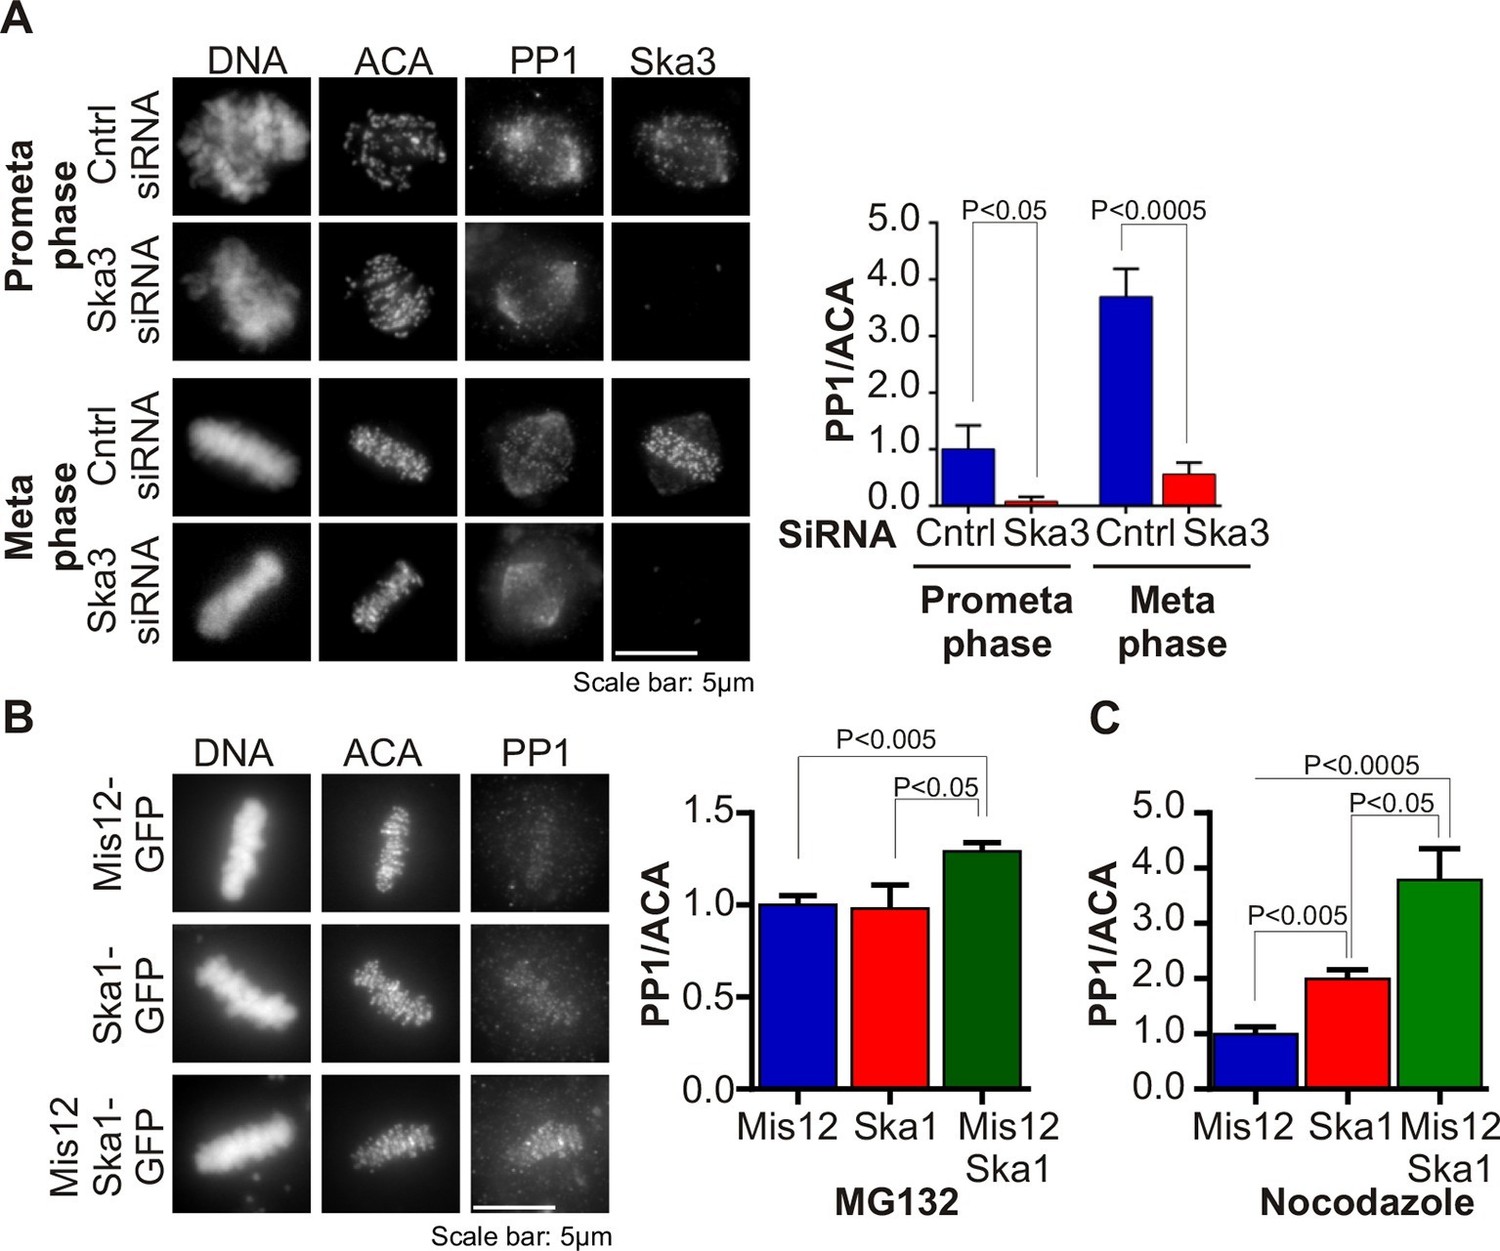
Ska complex is required for PP1 recruitment to the kinetochore.
(A) HeLa cells were transfected with control or Ska3 siRNA at 50nM final concentration. Thirty hours after transfection immunofluorescence was done and PP1 at the kinetochore was quantified. Ska3 antibody staining shows efficiency of depletion. PP1 at kinetochores increases from prometaphase to metaphase. Ska3-depleted cells are inefficient in PP1 recruitment to kinetochores in both prometaphase and metaphase. (B) HeLa cells were transfected with Mis12-GFP, Ska1-GFP or Mis12Ska1-GFP to increase Ska complex accumulation at kinetochores. Thirty-six hours after transfection, MG132 was added for 1 hr to accumulate cells at metaphase. Immunofluorescence of PP1 at kinetochores was quantified. PP1 accumulates at kinetochores in Mis12Ska1GFP-expressing cells to a greater extent than in Mis12GFP- or Ska1GFP-expressing cells. (C) In cells treated with 3.3 μM nocodazole, PP1 accumulated to higher levels at kinetochores of cells expressing Mis12Ska1-GFP compared to cells expressing Mis12GFP or Ska1GFP.
Figure 2
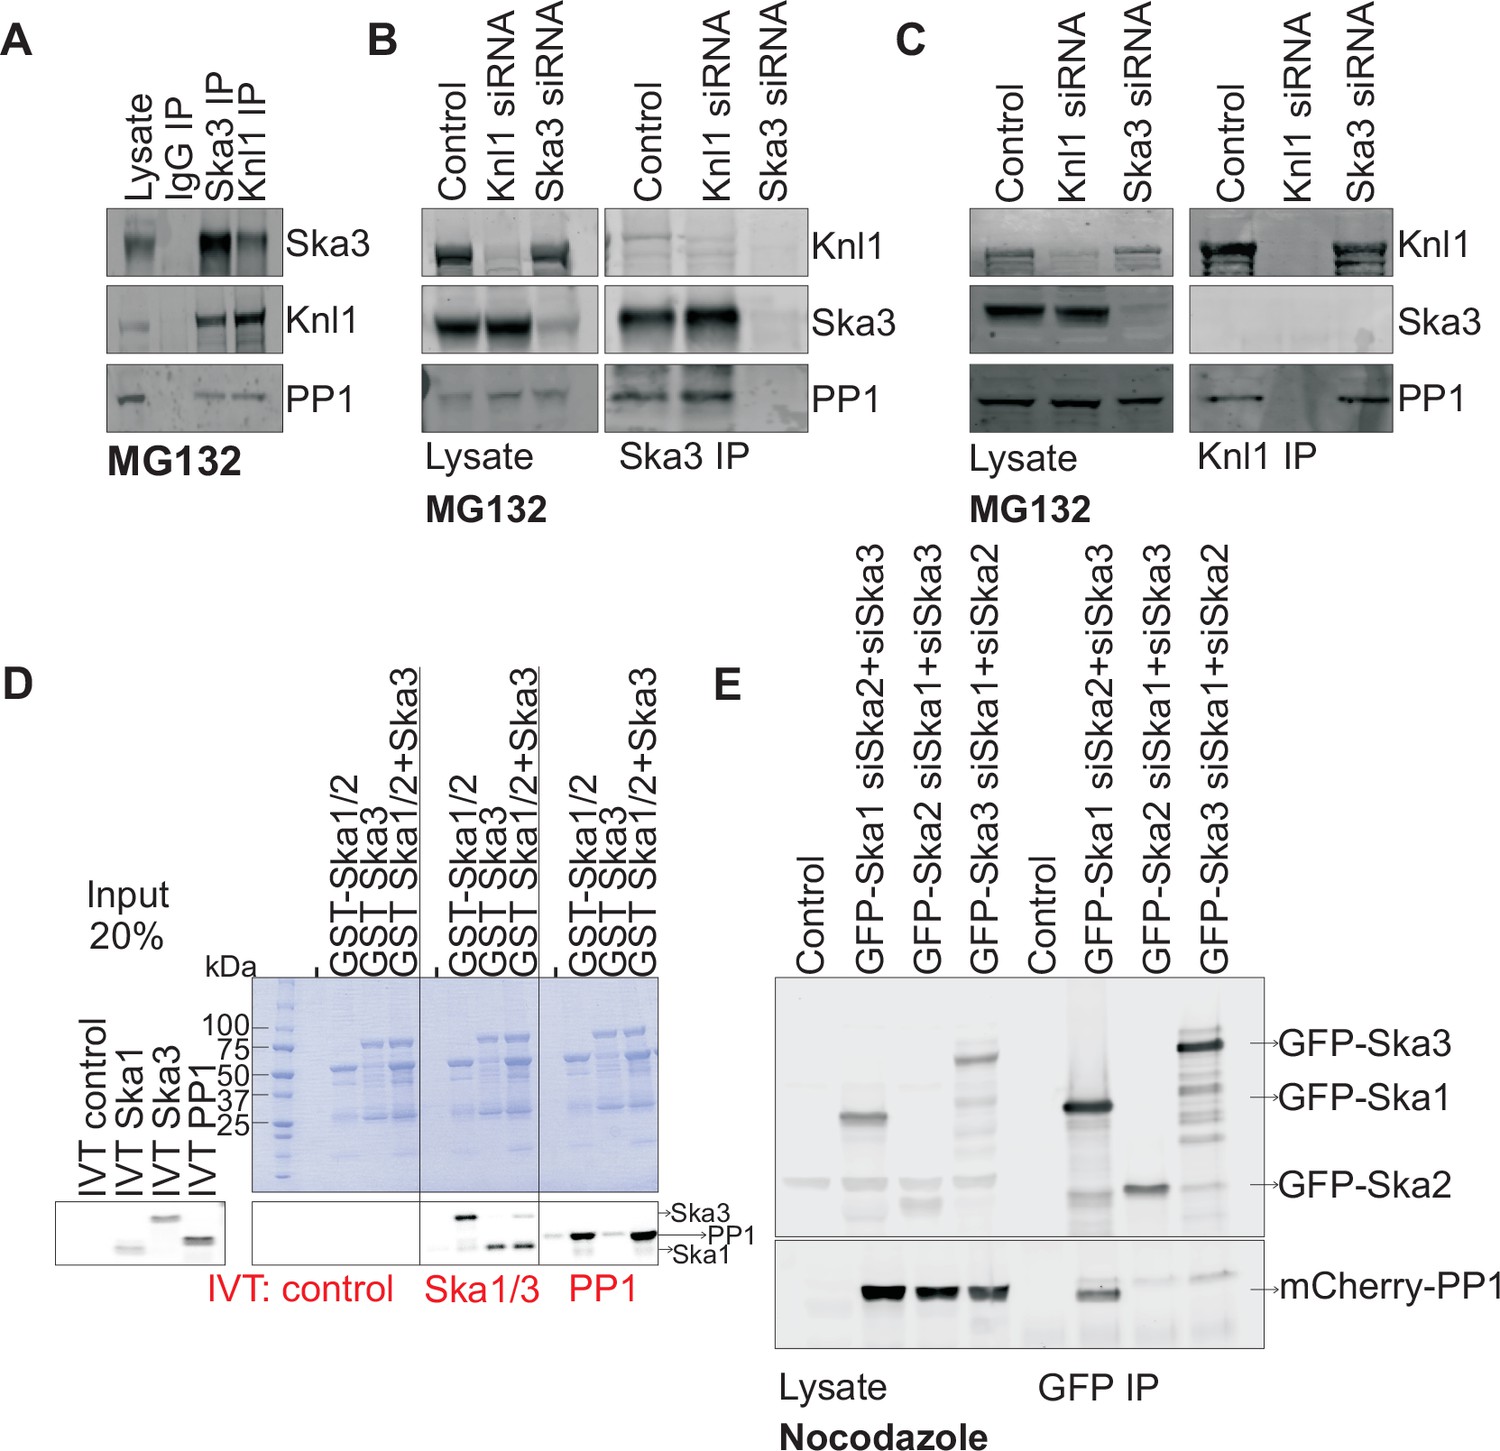
Ska1 interacts with PP1.
(A) HeLa cells synchronized in S phase with thymidine were then released and arrested in mitosis using 0.33 μM nocodazole. The cells were subsequently released from nocodazole into MG132 (25 μM) for 1 hr to allow metaphase chromosome alignment. Cell pellets were lysed and IgG, Ska3, and Knl1 IPs were performed to detect interaction with PP1. Both Ska3 and Knl1 IPs, but not control IgG IP, pulled down PP1 from cell lysates. (B) HeLa cells were transfected with mock siRNA, Knl1 siRNA, or Ska3 siRNA. HeLa cells were then arrested at metaphase as decribed above in A. Ska3 co-precipitated with similar amounts of PP1 in extracts prepared from control and Knl1-depleted cells. (C) HeLa cells transfected with mock, Knl1, or Ska3 siRNA were synchronized at metaphase as described above in A. Knl1 co-precipitated with similar amounts of PP1 in extracts prepared from control and Ska3-depleted cells. (D) GST-Ska proteins purified from bacteria were incubated with in vitro translated S35-labeled Myc-PP1. GST-Ska1/2 and GST Ska1/2+GST Ska3 interacted with S35-labeled Myc-PP1. E. HeLa cells were transfected with mCherry-PP1 and control, GFP Ska1, GFP Ska2 or GFP Ska3 plasmids. Endogenous Ska components were depleted using siRNA; cells were synchronized in S phase using thymidine then released and arrested in mitosis using 3.3 μM nocodazole. GFP-Ska1 precipitated from cells depleted of Ska2 and Ska3 showed the strongest interaction with mCherry-PP1.
Figure 3 with 1 supplement
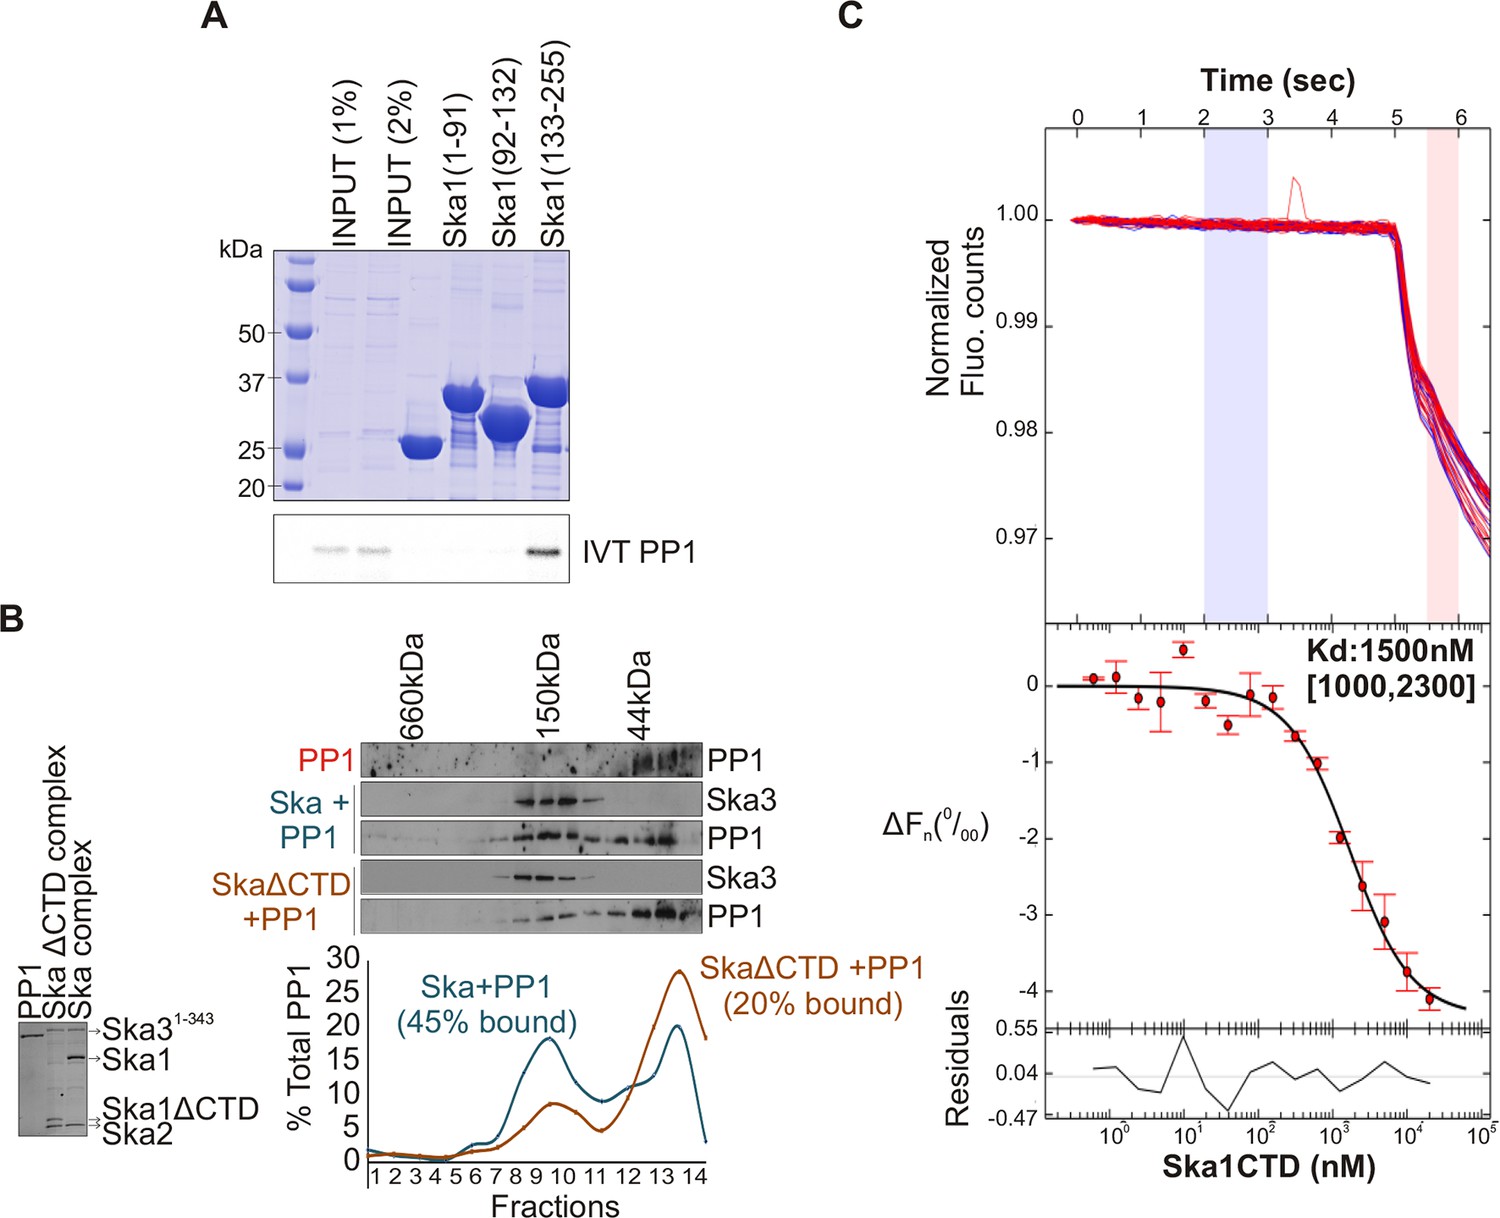
Ska1 C terminal domain (CTD) physically interacts with PP1.
(A) GST fusions to Ska1 fragments, GST-Ska1(1–91), GST-Ska1(92–132) and GST-Ska1(133–255) were purified from bacteria. In vitro translated S35 labeled Myc-PP1 was added to GST-Ska1 fragments and in vitro binding assays were performed to detect Myc-PP1 interaction with GST-Ska1 fragments. GST-Ska1(133–255) bound strongly with Myc-PP1 while other fragments did not. (B) (Left) Purified 6xHis-PP1α7–330 (PP1), untagged Ska1ΔCTD/Ska2/Ska31-343 and Ska1FL/Ska2/Ska31-343, visualized on coommassie stained gel. (Right) Immunoblots showing the elution profile of PP1, PP1 incubated with Ska1FL/Ska2/Ska31-343 (blue) or PP1 incubated with Ska1ΔCTD/Ska2/Ska31-343 (orange) run on a Superose 12 size-exclusion column. Ska complexes run in the same fraction in the absence of PP1 (not shown). Densitometry quantifications of PP1 signal in fractions eluted from size-exclusion column shows a reduction in binding to Ska complex lacking the Ska1 CTD. (C) Microscale thermophoresis (MST) was done to analyze the direct binding interaction between PP1 and the Ska1 CTD proteins purified from bacteria. The top panel shows thermophoretic time traces of 16 samples in three independent experiments. The middle panel shows the T-Jump data (circles) and the fit to the data (line). The residuals between the data and the fit line are indicated in the bottom panel. The Kd of PP1 binding to the Ska1 CTD was calculated to be 1.5 μM. Fn represents ratio (expressed in per-mille units) of the fluorescence readings in the time traces as measured just after (pink region, top panel) and before (blue region, top panel) activation of the MST laser; ΔFn is calculated by subtracting the refined Fn of the free PP1 from all Fn values and thus represents the change in T-Jump response as a function of ligand concentration. This part was rendered using the program GUSSI (Brautigam, 2015).
Figure 3—figure supplement 1
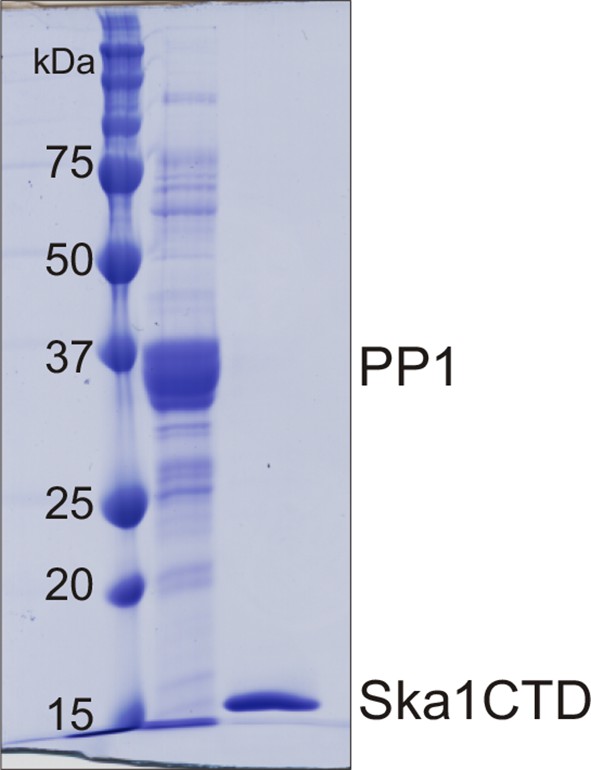
Purification of PP1 and Ska1CTD from bacteria His-PP1γ and GST-Ska1CTD were individually purified from bacteria.
The tags were cleaved using Thrombin and 3C protease respectively. Coomasie stained gel shows the two proteins after size exclusion chromatography. The proteins were then used to perform MST assay.
Figure 4 with 3 supplements
Ska1CTD immunoprecipitates with PP1 in HeLa cells.
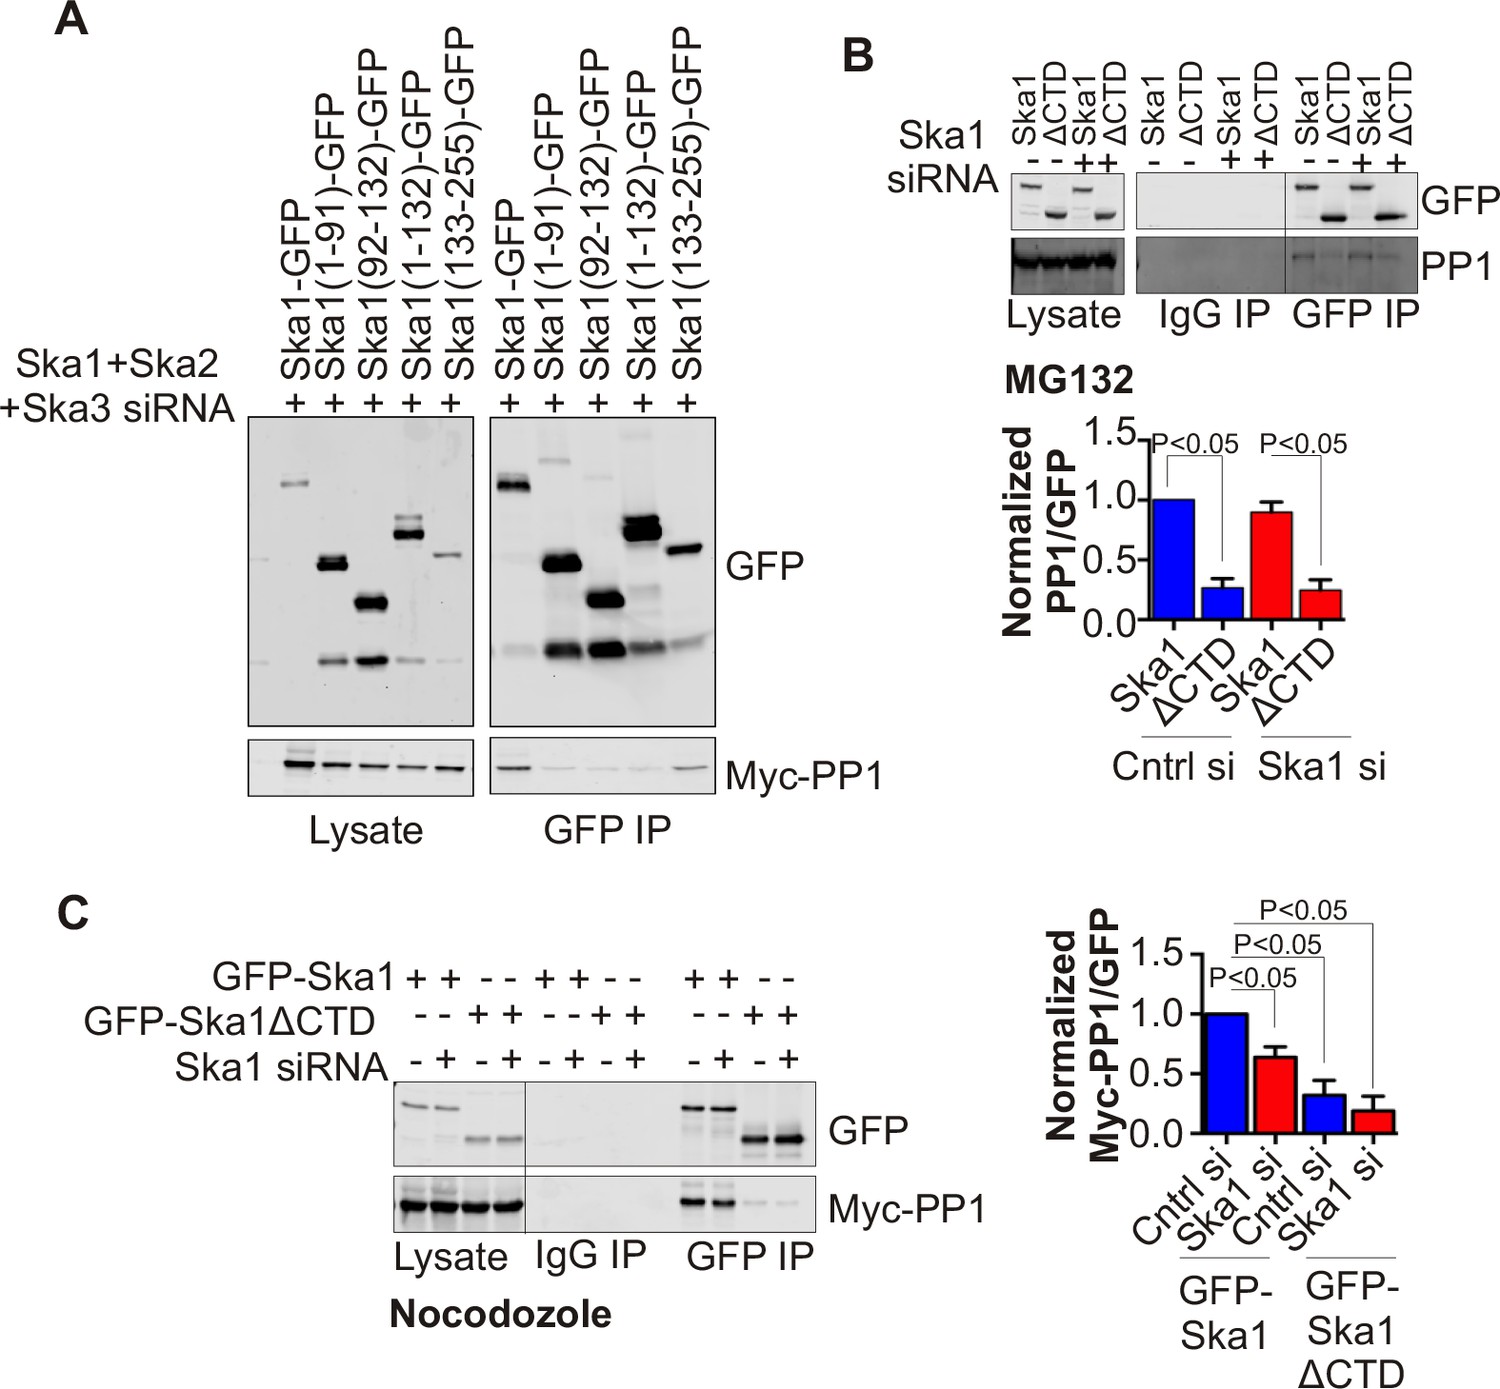
(A) HeLa cells were transfected with GFP-Ska1(1–91), GFP-Ska1(92–132), GFP-Ska1(1–132), GFP-Ska1(133–255), and Myc-PP1 plasmids. Endogenous Ska1, Ska2, and Ska3 were depleted with siRNA. GFP IP’s followed by Western blotting was done to analyze the GFP-Ska1 fragment that associated most strongly with Myc-PP1 in vivo. GFP-Ska1(133–255) interacted with Myc-PP1 in extracts from cells depleted of all endogenous Ska components. (B) HeLa cell lines expressing GFP-Ska1 or GFP-Ska1ΔCTD under Doxocycline (Dox) control and resistant to siRNA were generated. These were transfected with control or Ska1 siRNA and transgene expression was induced. Cells were synchronized by thymidine in S phase then released and arrested in mitosis using 0.33 μM nocodazole. Mitotic cells were released into MG132 (25 μM) to allow metaphase chromosome alignment and collected after 1 hr. GFP IP’s were prepared from the cell extracts and the amount of PP1 associated determined by quantitative immunoblotting. IP of GFP-Ska1ΔCTD showed greatly reduced binding to PP1 both with or without depletion of endogenous Ska1. (C) Dox-inducible HeLa GFP-Ska1 and GFP-Ska1ΔCTD cells were transfected with Myc-PP1 plasmid followed 6 hr later by transfection of control or Ska1 siRNA. Dox was added to induce transgene expression. Cells were synchronized in S phase with thymidine then released and collected in mitosis using 3.3 μM nocodazole. GFP IP’s were done followed by quantitative immunoblotting to detect Myc-PP1 association. GFP-Ska1 coprecipitated significant amonts of Myc-PP1, while GFP-Ska1ΔCTD (with or without depletion of endogenous Ska1) showed greatly reduced co-precipitatation with Myc-PP1. Depletion of endogenous Ska1 did reduce somewhat the ability of full length GFP-Ska1 to co-precipitate Myc-PP1. However, GFP-Ska1ΔCTD showed pronounced reduction in co-precipitation of Myc-PP1.
Figure 4—figure supplement 1

Characterization of HeLa Tet-On cells expressing GFP-Ska1 or GFP-Ska1ΔCTD HeLa cells stably transfected with constructs for inducible expression of GFP-Ska1 or GFP Ska1ΔCTD cells were treated with Dox to induce transgene expression.
Cells were imaged live to determine the localization of GFP-Ska1 and GFP-Ska1ΔCTD. As previously reported, GFP-Ska1 concentrates on spindle microtubules and at kinetochores while GFP-Ska1ΔCTD predominantly concentrates at kinetochores (Abad et al., 2014; Schmidt et al., 2012).
Figure 4—figure supplement 2

GFP-Ska1ΔCTD shows reduced binding to Myc-PP1 in extracts from cells arrested at metaphase with MG132..
HeLa GFP-Ska1 and GFP-Ska1ΔCTD stable cell lines were transfected with Myc-PP1 plasmid. Six hours later, cells were treated with mock or Ska1 siRNA. Dox was added to induce transgene expression. Cells were synchronized in S phase with thymidine and then released and collected in mitosis using 0.33 μM nocodazole. Cells were released into MG132 (25 μM) for 1 hr to generate metaphase-arrested cells. GFP IPs were done to assess the amount of Myc-PP1 associated. In GFP IP’s from cell extracts, GFP-Ska1ΔCTD showed a decrease in PP1 co-precipitation compared to GFP-Ska1.
Figure 4—figure supplement 3
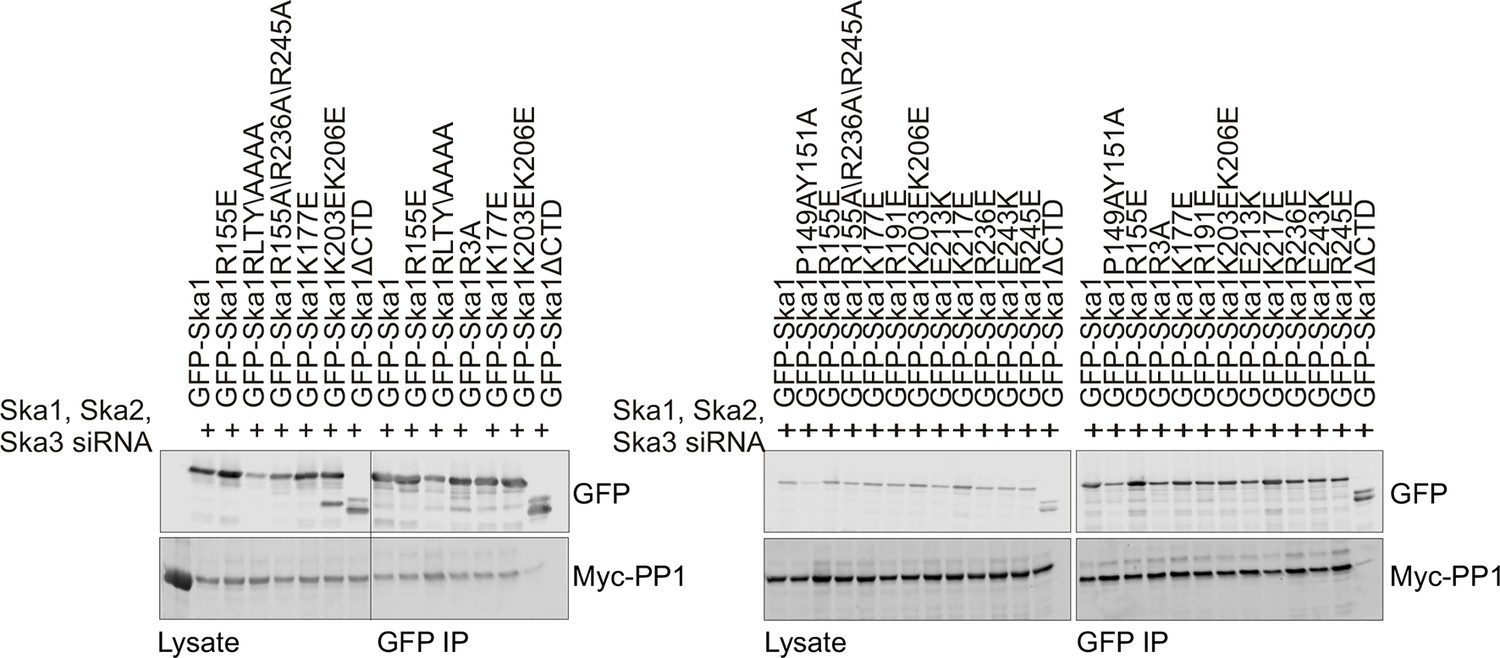
Characterization of Ska1CTD to identify residues involved in interaction with PP1.
HeLa cells were transfected with Myc-PP1 and the indicated Ska1 mutants. Endogenous Ska1, Ska2 and Ska3 were depleted using siRNA. Cells were synchronized in S phase with thymidine then released and collected in mitosis using 3.3 μM nocodazole. The amount of Myc-PP1 in anti-GFP IP’s was determined by quantitative Western blotting. Whereas Ska1ΔCTD showed diminished binding to Myc-PP1, none of the point mutants exhibited altered binding.
Figure 5 with 1 supplement
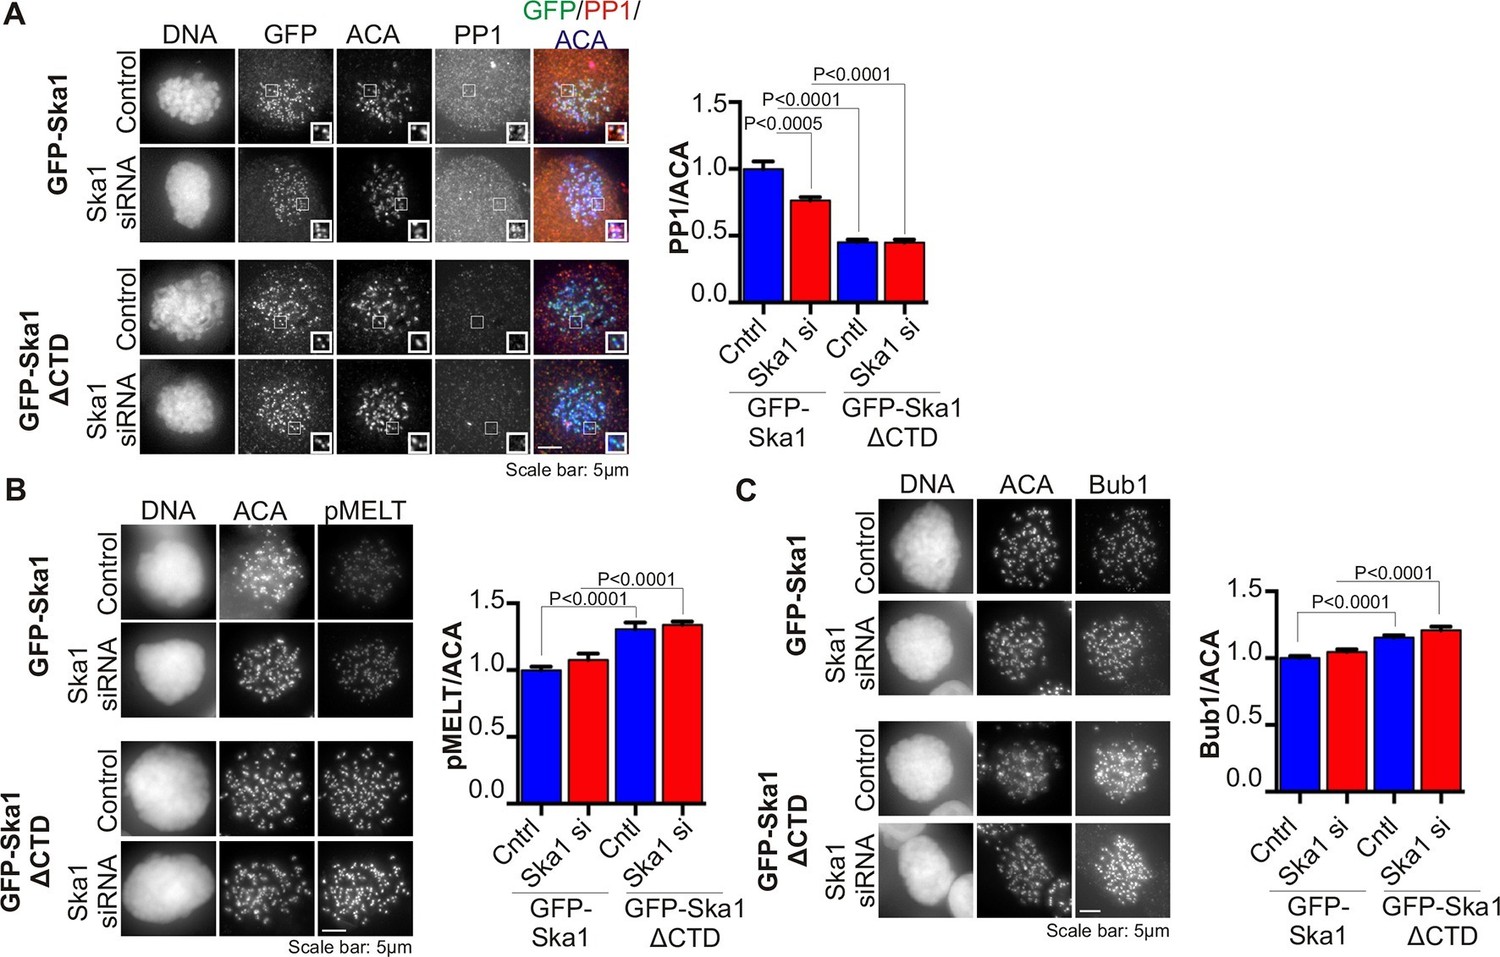
Cells expressing Ska1ΔCTD recruit less PP1 and accumulate more Knl1 phosphoepitope and Bub1 protein at kinetochores.
HeLa GFP-Ska1 and HeLa GFP-Ska1ΔCTD cells were grown on chambered cover slides. Dox was added to induce transgene expression. Cells were transfected with Ska1 siRNA, and thymidine was added for 18–24 hr to synchronize cells. Cells were released from thymidine and arrested in mitosis using 3.3 μM nocodazole. Immunofluorescence was done to detect PP1, pMELT, Bub1 at the kinetochore. (A) Image panel showing PP1 localization at the kinetochore in GFP-Ska1 and GFP-Ska1ΔCTD cells. The graph depicts the decrease in PP1 localization in GFP-Ska1ΔCTD cells compared to GFP-Ska1 cells both with and without depletion of endogenous Ska1. (B) Images show localization of antibody (pMELT) to a phosphoepitope on Knl1 (pT875) at kinetochores in GFP-Ska1 and GFP-Ska1ΔCTD cells. The graph shows that cells expressing GFP-Ska1ΔCTD have increased pMELT signals at kinetochores compared to GFP-Ska1-expressing cells. (C) Images show the levels of Bub1 protein at kinetochores in GFP-Ska1 and GFP-Ska1ΔCTD cells. Qantification shows that GFP-Ska1ΔCTD accumulate more Bub1 at kinetochores compared to GFP-Ska1 cells.
Figure 5—figure supplement 1

Expression levels of cell lines stably expressing inducible GFP-Ska1 and GFP-Ska1ΔCTD are similar After induction with Dox, GFP expression levels in individual cells were quantified.
At least five cells in each case was quantified. GFP-Ska1 (with or without Ska1 depletion) and GFP-Ska1ΔCTD (with or without Ska1 depletion) cells show similar amounts of GFP expressed.
Figure 6
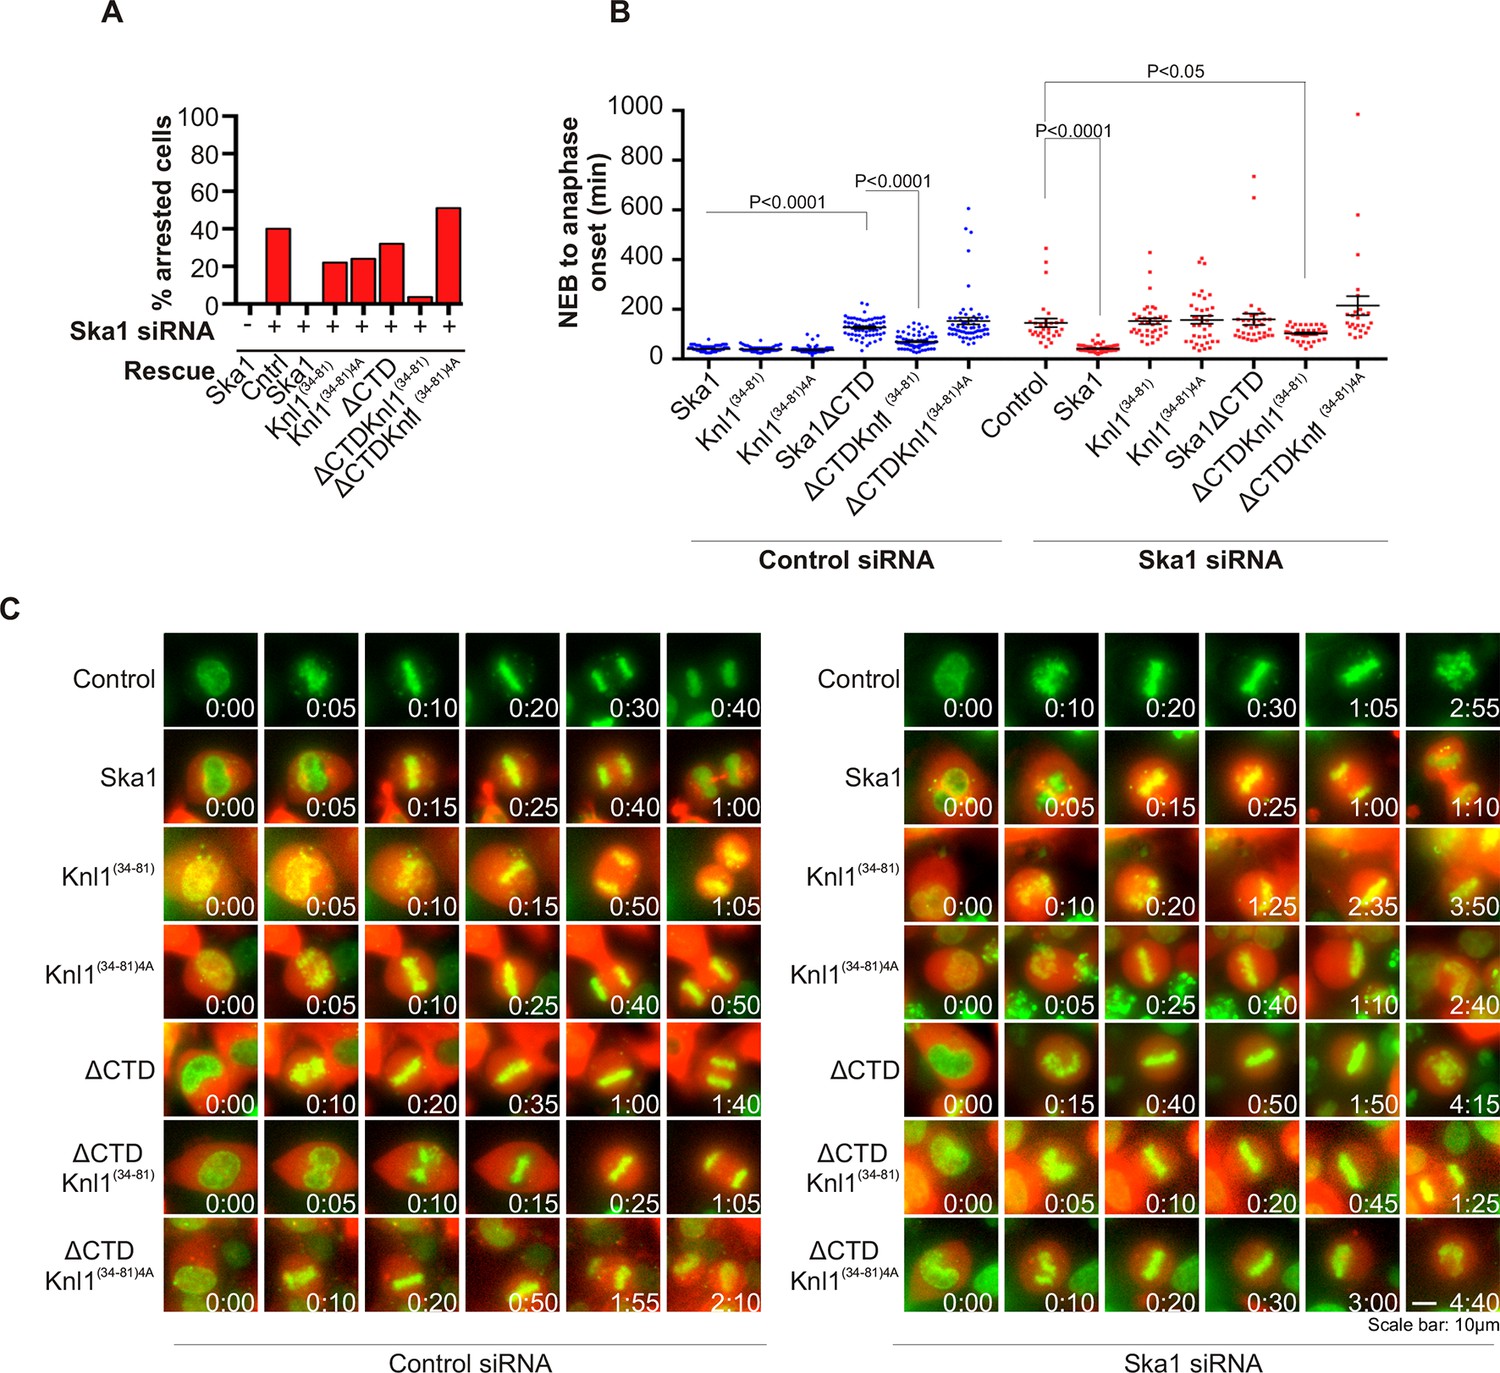
Expression of Ska1ΔCTD fused to the PP1-binding domain (amino acids 34–81) of Knl1 rescues phenotypes caused by Ska1 depletion.
(A) HeLa cells were transfected with plasmids to express mCherry-Ska1, mCherry-Knl1(34–81), mCherry-Knl1(34–81)4A (where the PP1 binding motif RVSF is mutated to AAAA), mCherry-Ska1ΔCTD, mCherry-Ska1ΔCTD fused to Knl1(34–81) (mCherry-Ska1ΔCTDKnl1(34–81)) and mCherry-Ska1ΔCTDKnl1(34–81)4A. Endogenous Ska1 was depleted using Ska1 siRNA. Cells were imaged by time-lapse microscopy, and % of mitotic cells arrested in metaphase was plotted. As expected, expression of siRNA-resistant mCherry-Ska1 rescued metaphase arrest caused by Ska1 depletion while expression of mCherry-Ska1ΔCTD did not. Expression of Ska1ΔCTDKnl1(34–81) fusion in Ska1-depleted cells rescued metaphase arrest while expression of Ska1ΔCTDKnl1(34–81)4A did not. (B) The interval from NEB to anaphase onset is plotted for cells that progressed to anaphase in cells expressing Ska1 constructs with or without depletion of endogenous Ska1. In cells not depleted of endogenous Ska1, dominant negative effects in delaying mitotic progression were caused by expression of Ska1ΔCTD, as previously reported, and by expression of the fusion Ska1ΔCTDKnl1(34–81)4A, which lacks the PP1-binding motif. Expression of other constructs including Ska1ΔCTDKnl1(34–81) with intact PP1 binding caused no delay. In cells depleted of endogenous Ska1, 40% of cells arrested at metaphase and did not progress to anaphase (Figure 6A). The rest showed delayed mitotic progression with an average of 146 min from NEB to anaphase onset compared to control cells (40 min). As expected the delay was rescued by expression of mCherry-Ska1 but was not rescued by expression of mCherry-Knl1(34–81), mCherry-Knl1(34–81)4A or mCherry-Ska1ΔCTD. Expression of Ska1ΔCTDKnl1(34–81) but not Ska1ΔCTDKnl1(34–81)4A showed significant rescue of the delay caused by Ska1 depletion. (C) Representative images of cells transfected with the indicated constructs treated with control siRNA or Ska1 siRNA. The green and red colors indicate DNA and mCherry expression, respectively. Only cells expressing indicated mCherry constructs were analyzed for this experiment. The time is indicated in hour:minutes.
Figure 7 with 2 supplements
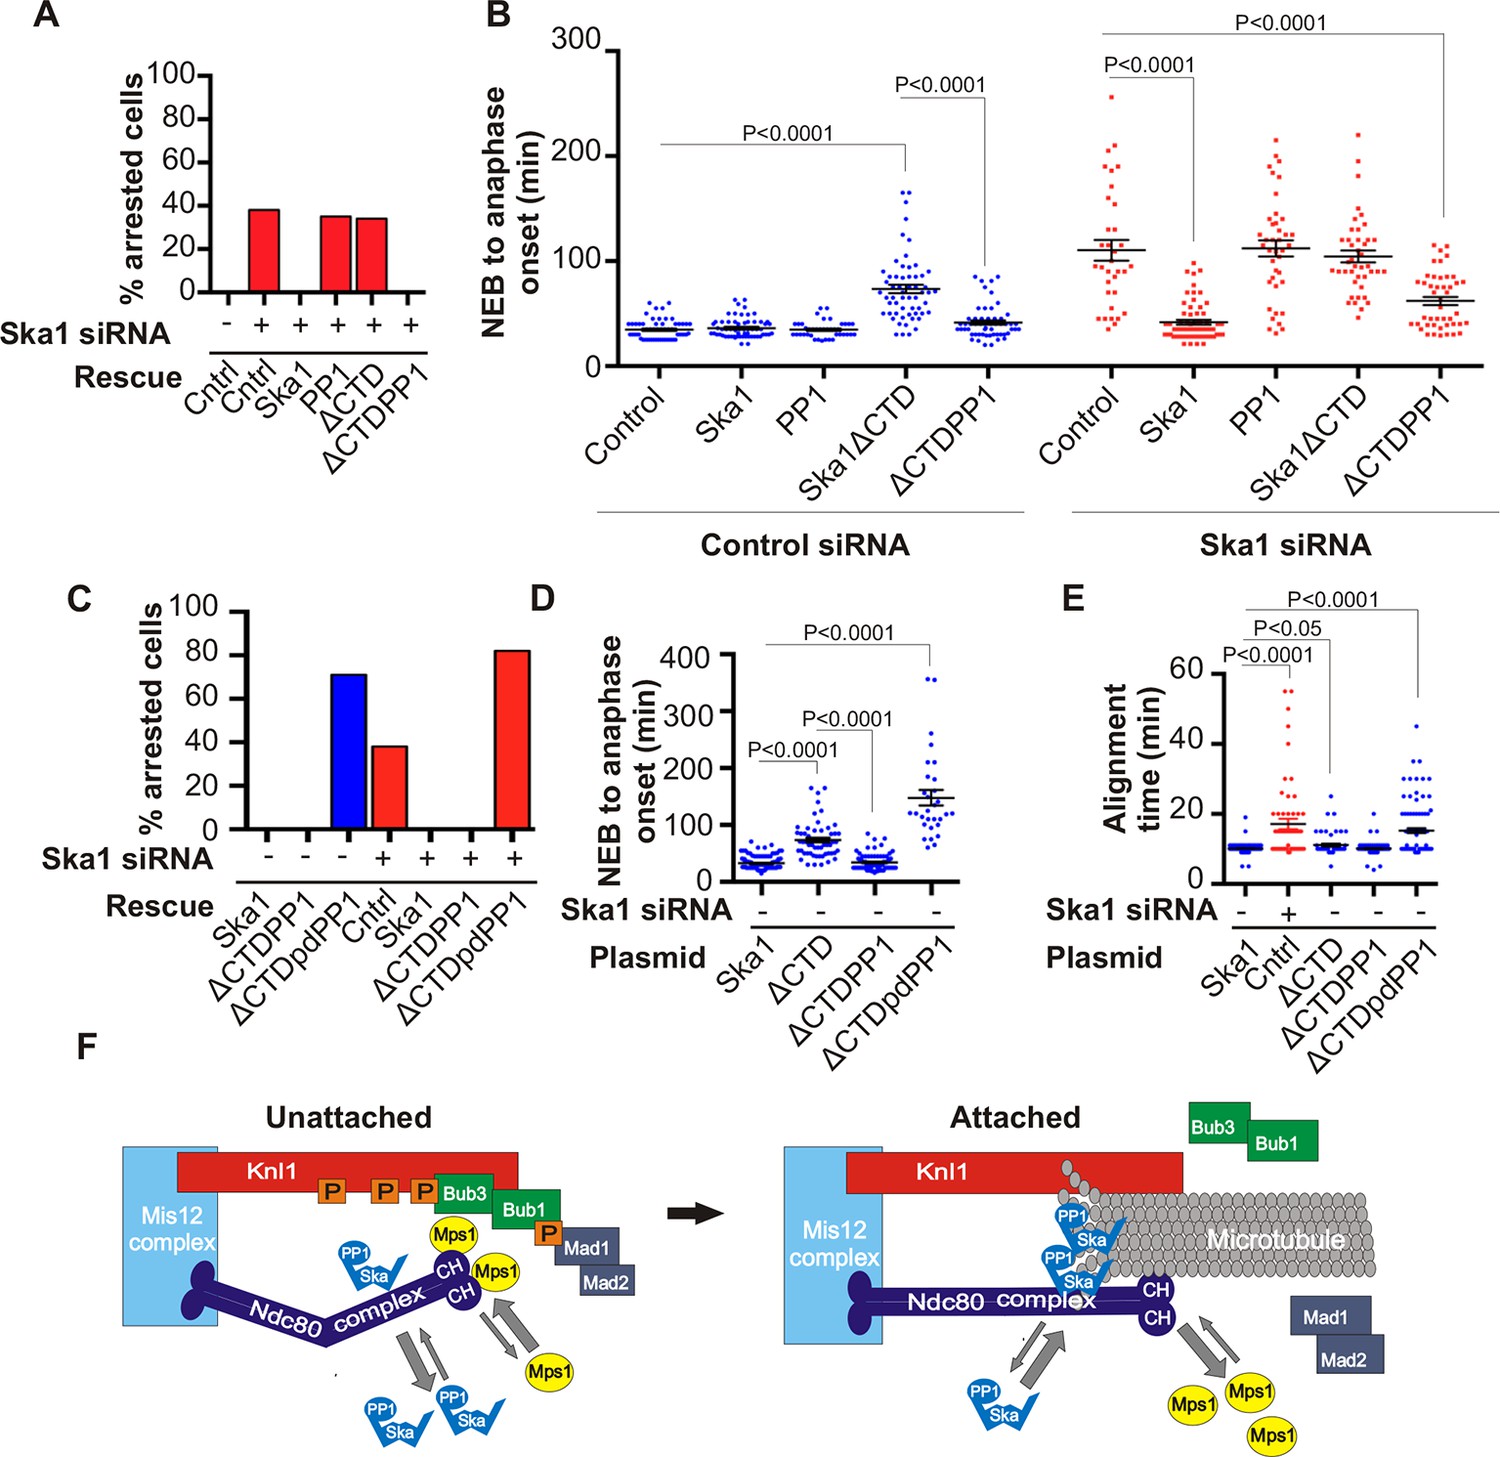
Expression of Ska1ΔCTD fused directly to PP1 but not phosphatase-dead PP1 (pdPP1) rescues phenotypes caused by Ska1 depletion.
(A) HeLa cells were transfected with plasmids to express mCherry-Ska1, mCherry-PP1, mCherry-Ska1ΔCTD, and mCherry-Ska1ΔCTD fused to PP1 (mCherry-Ska1ΔCTDPP1). Endogenous Ska1 was depleted using Ska1 siRNA. Hoechst 33342 was added at 25 ng/ml to visualize DNA. Cells were then imaged by time-lapse microscopy, and % of mitotic cells arrested in metaphase was plotted. As expected, expression of siRNA-resistant mCherry-Ska1 rescued metaphase arrest caused by Ska1 depletion while expression of mCherry-PP1 or mCherry-Ska1ΔCTD did not. Expression of Ska1ΔCTDPP1 fusion in Ska1 depleted cells completely rescued metaphase arrest. (B) The interval from NEB to anaphase onset is plotted for cells that progressed to anaphase while expressing Ska1 constructs without or with depletion of endogenous Ska1. As expected, Ska1ΔCTD-expression showed a dominant negative effect delaying mitotic progression in control cells not depleted of endogenous Ska1. Expression of the fusion, Ska1ΔCTDPP1, caused no delay. When endogenous Ska1 was depleted, 38% of cells arrested at metaphase and did not progress to anaphase (Figure 7A). The rest showed delayed progression from NEB to anaphase with an average of 110 min compared to control cells (35 min). As expected, the delay was rescued by expression of mCherry-Ska1 but was not rescued by expression of mCherry-PP1 or mCherry-Ska1ΔCTD. Expression of Ska1ΔCTDPP1 showed significant rescue of the delay cause by Ska1 depletion with an average time from NEB to anaphase of 62 min. (C) HeLa cells were transfected with the indicated plasmids and then treated with mock or Ska1 siRNA. Expression of Ska1ΔCTD fused to a phosphatase dead PP1 (Ska1ΔCTDpdPP1) failed to rescue Ska1 depletion. Indeed, expression of phosphatase dead fusion, on its own, induced a potent metaphase arrest phenotype in cells not depleted of endogenous Ska1. Moreover, it exacerbated the metaphase arrest in cells depleted of Ska1. (D) Ska1ΔCTDpdPP1 causes a longer delay to anaphase onset than Ska1ΔCTD even without depletion of endogenous Ska1. (E) Chromosome alignment is delayed in Ska1 depleted cells and this is recapitulated by expression of Ska1ΔCTDpdPP1 without endogenous Ska1 depletion. Delays in chromosome alignment are not observed upon expression of Ska1ΔCTDPP1 fusion. (F) Hypothetical model for dynamic balance of Mps1 kinase and PP1 phosphatase activities during mitotic progression. Photobleaching studies have shown that Mps1, Ska, and PP1 all exhibit high turnover at kinetochores with a residence times of a few seconds (Raaijmakers et al., 2009; Howell et al., 2004; Trinkle-Mulcahy et al., 2003). Before microtubule attachment, Mps1 concentration at kinetochores remains high due to interaction with the CH domains of the Ndc80 complex. Correspondingly, Ska-PP1 concentrations are low because of the paucity of microtubules. The high Mps1 and low PP1 concentrations maintain high phosphorylation Mps1 substrates, Knl1 and Bub1. Microtubules compete with Mps1 for binding to the CH domains of the Ndc80 complex, resulting in depletion of Mps1. The binding of Ska to microtubule protofilaments increases PP1 concentration. High Ska-PP1 and low Mps1 result in dephosphorylation of substrates, promoting release of Bub1–Bub3 and Mad1–Mad2 complexes. Diminished checkpoint signaling due to release of Bub1–Bub3 and Mad1–Mad2 from kinetochores promotes anaphase onset and mitotic exit.
Figure 7—figure supplement 1
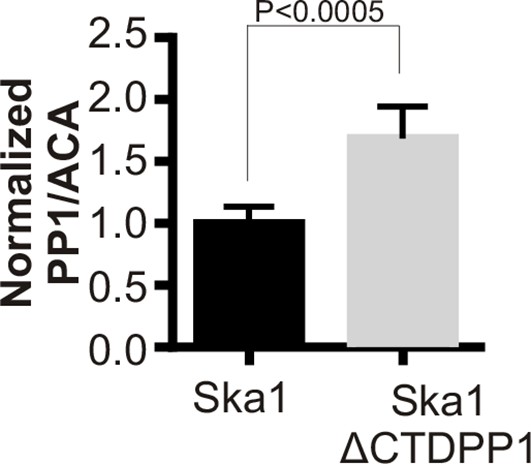
Ska1ΔCTDPP1 fusion increases PP1 concentration at kinetochores.
HeLa cells were transfected with mCherry-Ska1 or mCherry-Ska1ΔCTDPP1 plasmids. Immunofluorescence was done and the amount of PP1 at the kinetochore was determined. Expression of Ska1ΔCTDPP1 plasmid increases PP1 localization to the kinetochore by about two fold.
Figure 7—figure supplement 2

Ska1ΔCTDPP1 fusion but not Ska1ΔCTDpdPP1 (pdPP1-phosphatase dead PP1) rescues mitotic phenotypes observed upon Ska1 depletion.
Imagel panels show representative images of mitotic cells expressing the indicated mCherry constructs and progressing through mitosis. Expression of Ska1ΔCTDPP1 (fusion of PP1 to Ska1ΔCTD) rescues mitotic progression in Ska1 depleted cells while expression of Ska1ΔCTDpdPP1 does not.
Download links
A two-part list of links to download the article, or parts of the article, in various formats.
Downloads (link to download the article as PDF)
Open citations (links to open the citations from this article in various online reference manager services)
Cite this article (links to download the citations from this article in formats compatible with various reference manager tools)
The human SKA complex drives the metaphase-anaphase cell cycle transition by recruiting protein phosphatase 1 to kinetochores
eLife 5:e12902.
https://doi.org/10.7554/eLife.12902


