The RNA binding protein IMP3 facilitates tumor immune escape by downregulating the stress-induced ligands ULPB2 and MICB
- The Hebrew University Hadassah Medical School, Israel
Figures
Figure 1
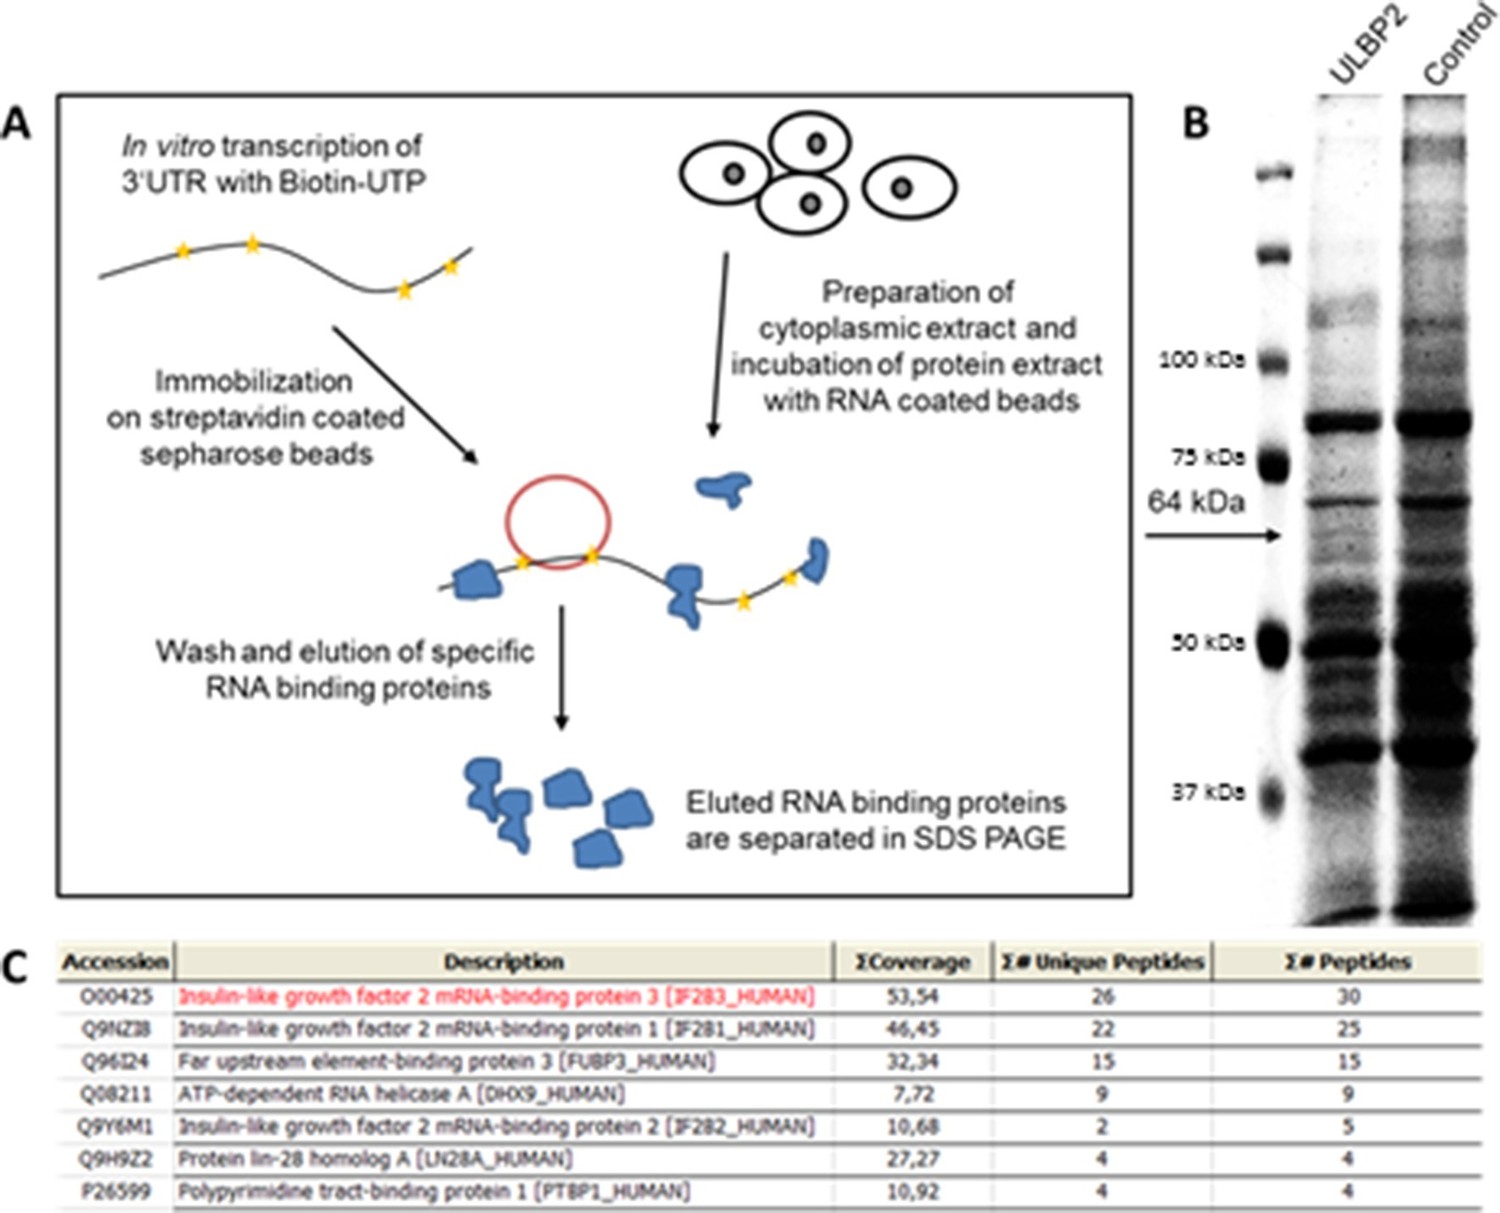
RNA affinity purification using the 3 ‘UTR of ULBP2.
(A) Schematic representation of the workflow in RNA affinity purification (RNA-AP). (B) Cytoplasmic extracts of RKO cells were incubated with RNA coding for the 3‘UTR of ULBP2 or control UTRs. The enriched RNA-binding proteins were run on 10% polyacrylamide gel and stained with Coomassie BB G-250. A specific band (indicated with an arrow, 64 kDa) was excised and analyzed by mass spectrometry. For facilitated visualization, a detail of the Coomassie gel is shown in false color and contrast was increased. (C) Top-listed results from mass spectrometry analysis of the excised gel part. IMP3 (here called IGF2BP3) is the hit with the highest coverage and amount of specific and total peptides in the analyzed gel band.
Figure 2 with 1 supplement
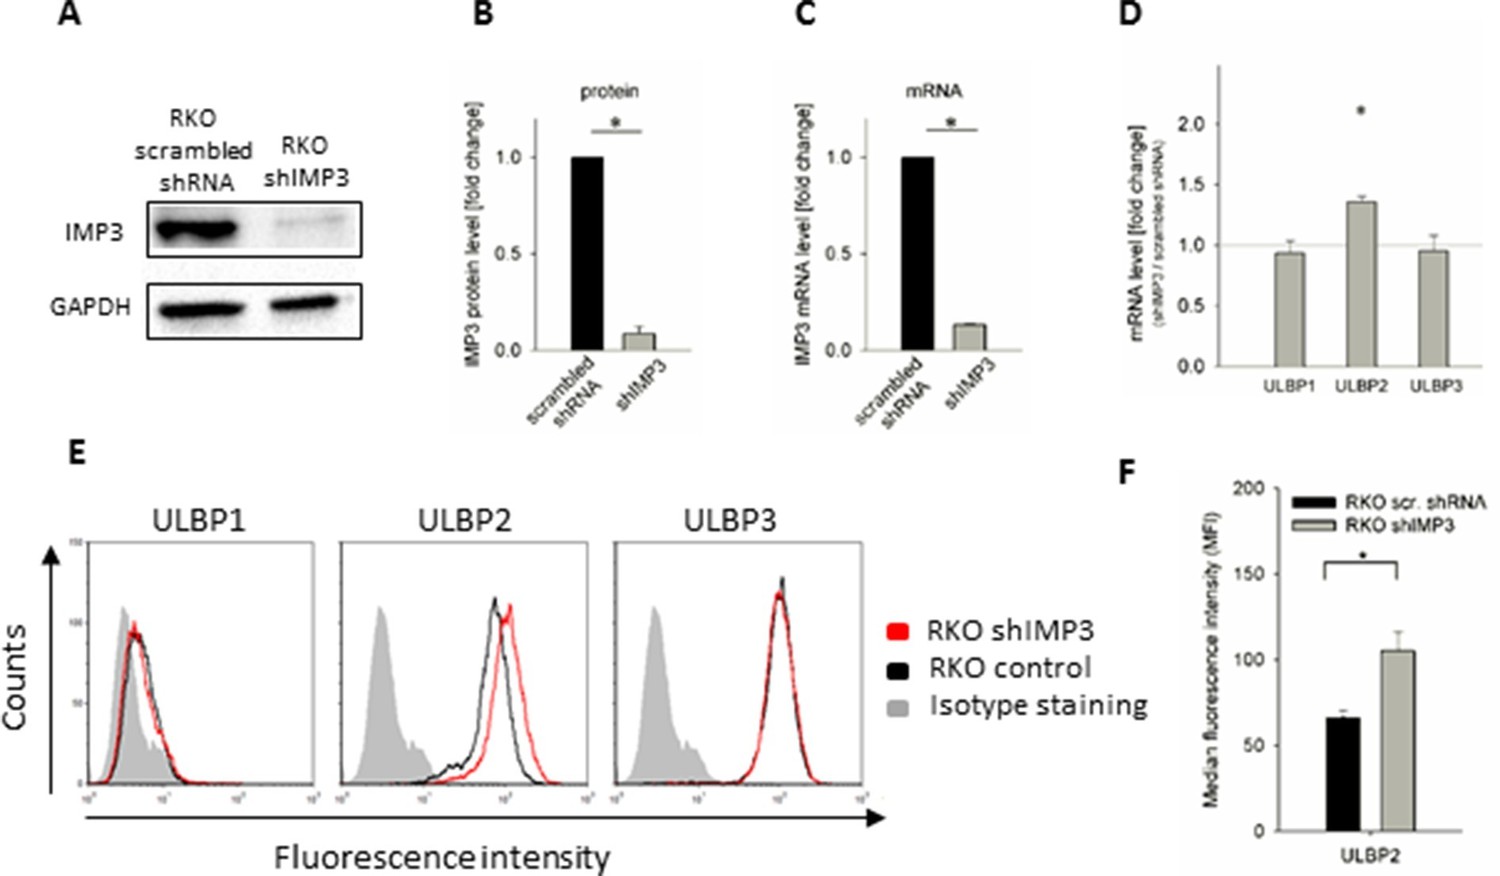
Knockdown of IMP3 in RKO cells and surface staining of NKG2D ligands.
(A) Western Blot analysis of IMP3 (64 kDa) in RKO cells transduced with a scrambled shRNA or with a shRNA against IMP3 (shIMP3). GAPDH (36 kDa) was used as a reference. Sections were cropped. (B) Quantification of IMP3 levels of Western Blots assays of two independent experiments performed with two different antibodies recognizing IMP3, relative to GAPDH expression *p=0.02 in student’s t-test. (C) qRT-PCR analysis of mRNA levels of IMP3 levels in RKO cells transduced with a scrambled shRNA or with shIMP3, normalized to GAPDH. *p<0.0001 in student’s t-test. (D) qRT-PCR analysis of mRNA levels for the NKG2D ligands in RKO transduced with shIMP3 compared to RKO transduced with scrambled shRNA. Combined data out of 4 replicates, statistics are calculated by comparing transcript levels of the same mRNA in RKO shIMP3 and RKO scrambled shRNA. *p(ULBP2)<0.001 in one-sample t-test. (E) Surface expression of NKG2D ligands ULBP1, 2 and 3 on RKO cells analyzed by FACS. Expression is shown on RKO cells transduced with shIMP3 (red histogram) and on cells transduced with a scrambled shRNA (black histogram). The grey filled histogram is the background staining determined for an isotype mouse IgG antibody on shIMP3 RKO. Figure shows one representative experiment out of 3 performed. (F) Quantification of ULBP2 surface expression on transduced with a scrambled or a IMP3 targeting shRNA. *p(ULBP2)=0.015
Figure 2—figure supplement 1
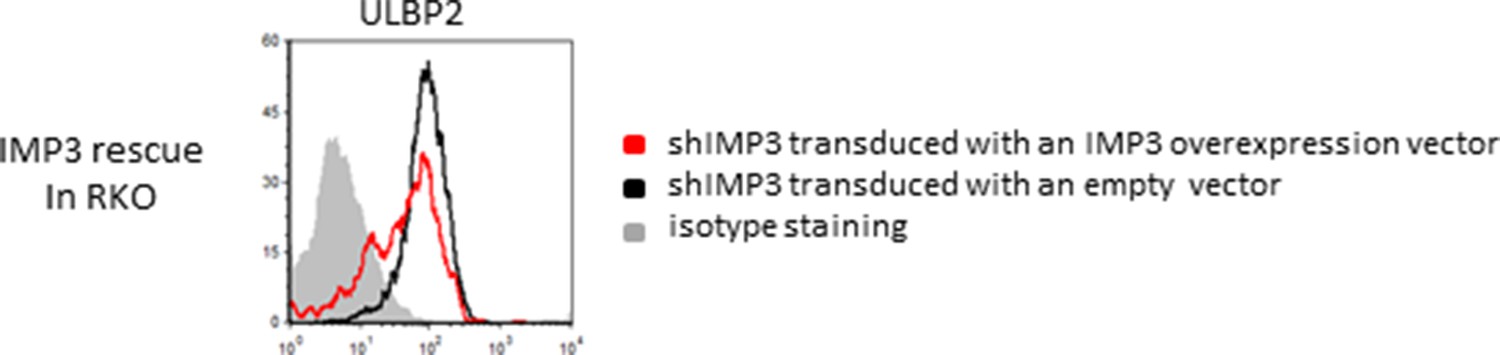
Rescue IMP3 in RKO shIMP3 cells reverses increase in ULBP2 expression.
RKO transduced with a shRNA targeting IMP3 were selected using puromycin and subsequently transduced with a plasmid coding for IMP3. FACS analysis of stress-ligand expression of ULBP2 is shown; cells that expressed the IMP3 targeting hairpin RNA were transduced either with an empty vector as control (black histogram) or with a IMP3 expression vector (red histogram). The grey filled histogram is the background staining determined for an isotype mouse IgG antibody. Cells were gated according to their appearance in forward and side scatter and for the expression of GFP as reporter for the IMP3-overexpression. Figure shows each one representative plot out of 3 experiments performed.
Figure 3
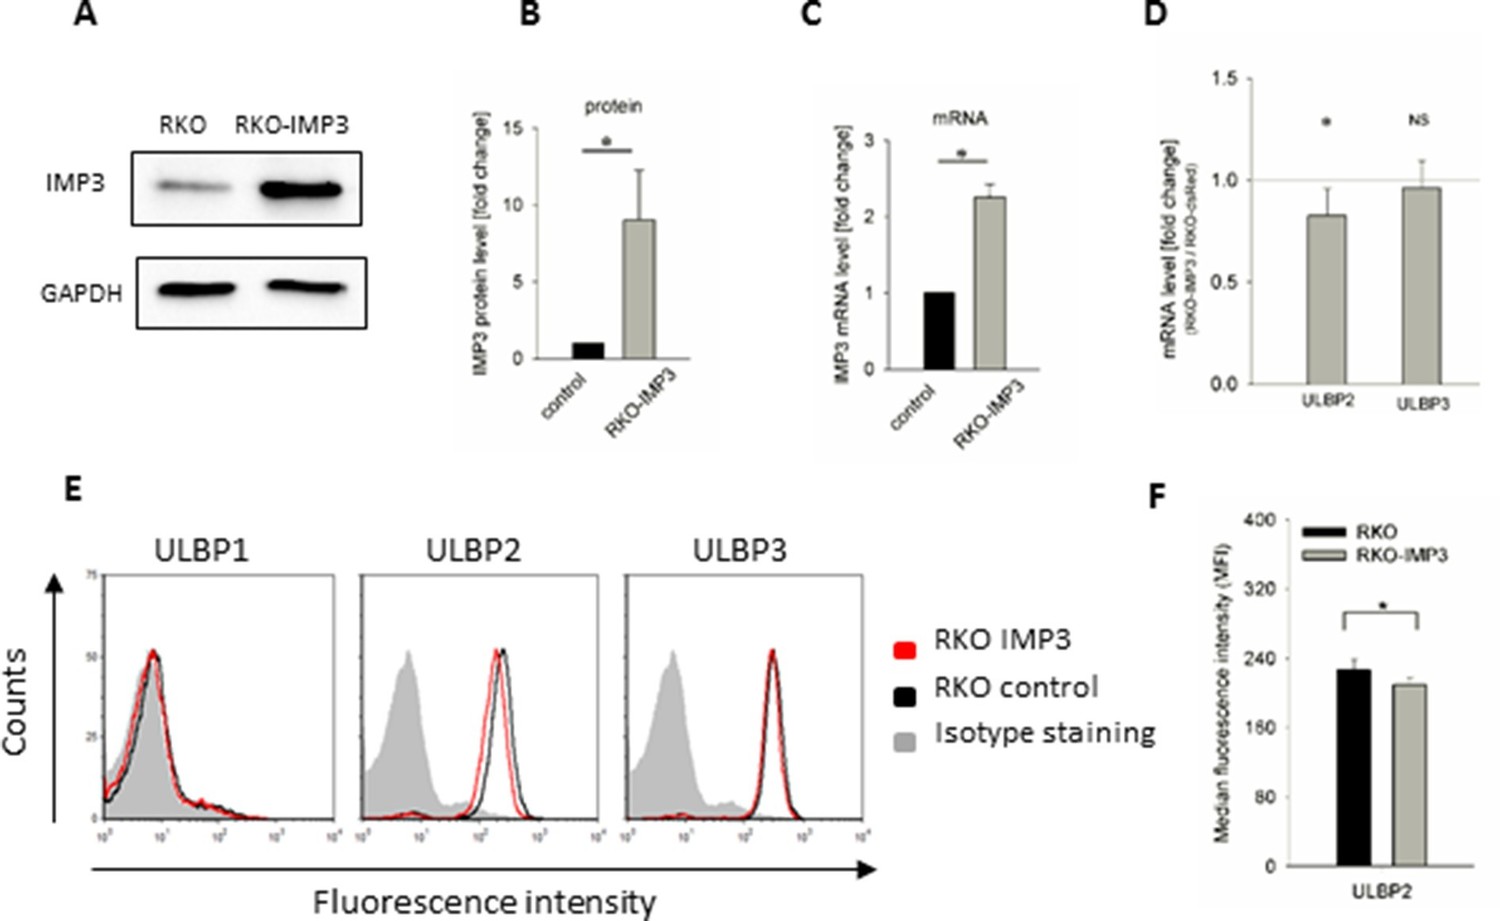
Surface staining of stress-induced ligands in IMP3 overexpressing RKO cells.
(A) Western Blot analysis of IMP3 in parental RKO cells and RKO cells overexpressing IMP3 (64 kDa). GAPDH (36 kDa) was used as a reference, sections were cropped. (B) Quantification of IMP3 levels of Western Blots assays of two independent experiments performed relative to GAPDH expression. *p<0.03 in student's t-test. (C) IMP3 RNA levels in the RKO-IMP3 compared to RKO analyzed by qRT-PCR. (D) RNA levels of ULBP2 and ULBP3 in RKO-IMP3 compared to RKO-dsRed analyzed by qRT-PCR. *p(ULBP2)=0.044, *p(ULBP3)=0.550 in student's t-test. (E) Surface expression of NKG2D ligands ULBP1, 2 and 3 on RKO cells analyzed by FACS. Expression is shown on RKO cells overexpressing IMP3 (red histogram) and on parental cells (black histogram). The grey filled histogram is the background staining determined for an isotype mouse IgG antibody on parental RKO. Figure shows one representative experiment out of 3 performed. (F) Quantification of ULBP2 surface expression on RKO or RKO-IMP3, *p(ULBP2)=0.034.
Figure 4 with 1 supplement
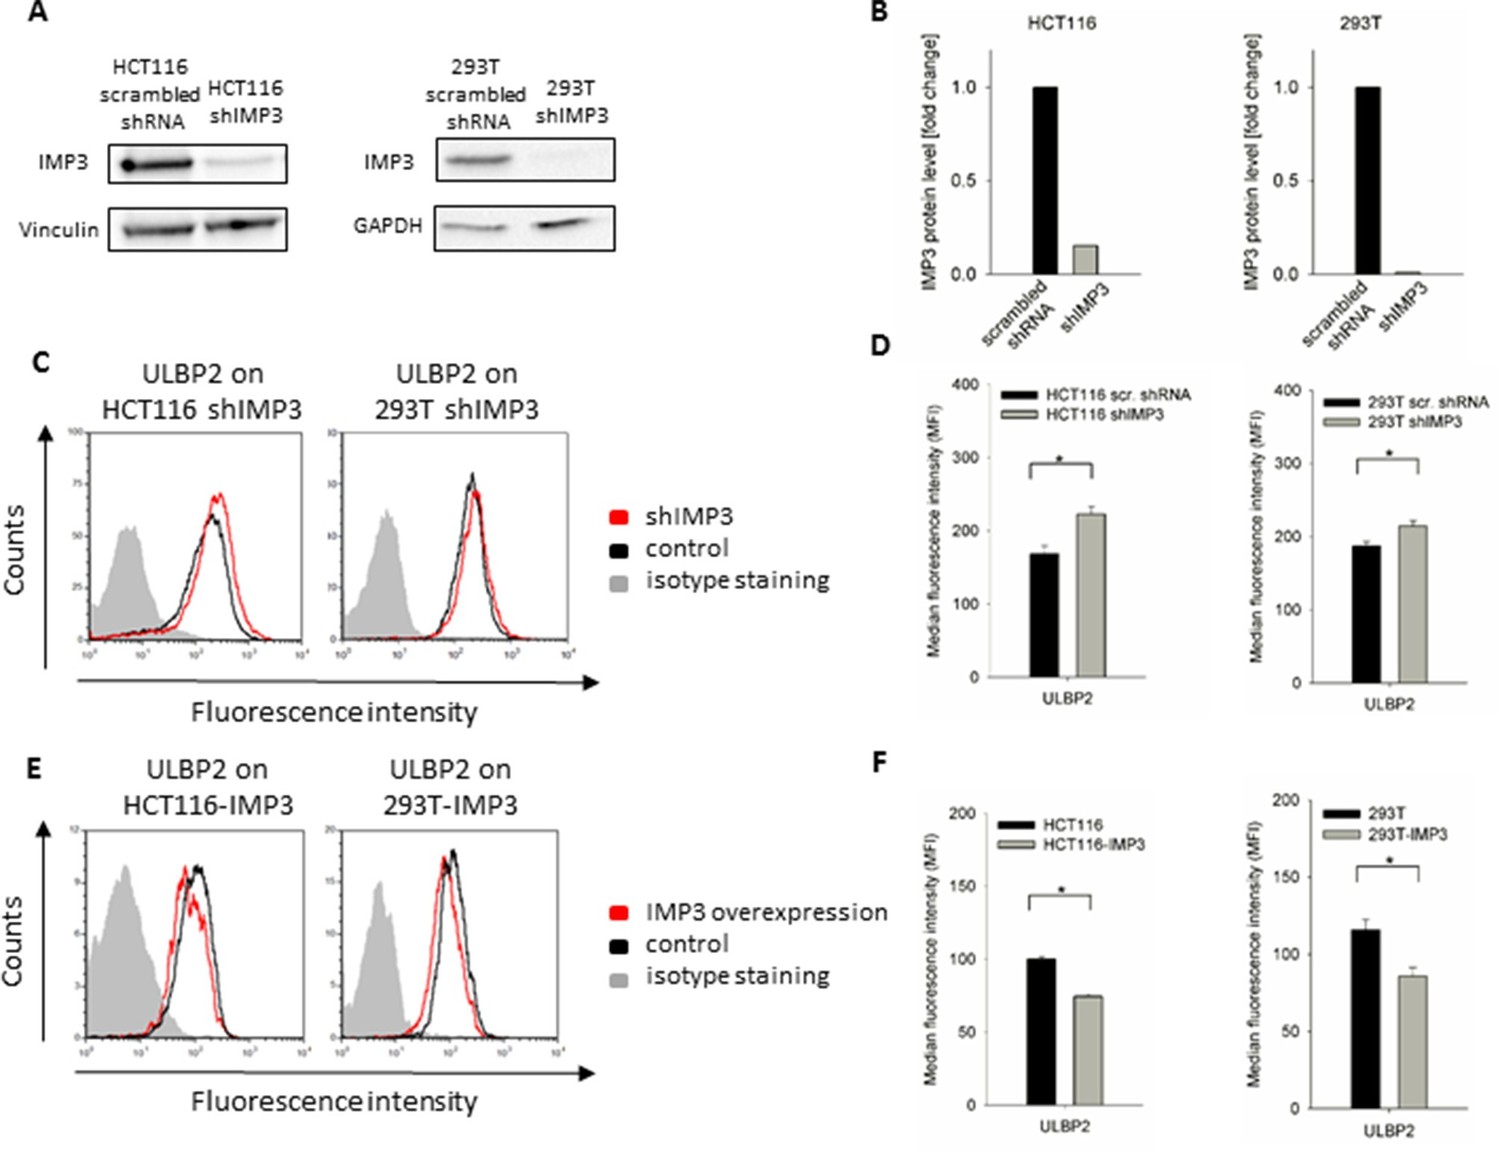
ULBP2 after IMP3 knockdown and overexpression in HCT116 and 293T cells.
(A) Western Blot analysis of IMP3 knockdown in HCT116 and 293T cells compared to cells transduced with a scrambled shRNA. For HCT116 cells, Vinculin was used as reference (130kDa); for 293T cells, GAPDH was used (36kDa). Sections were cropped. (B) Quantification of IMP3 WB in HCT116 and 293T, a single experiment was performed. (C) FACS analysis of ULBP2 on HCT116 and 293T cell lines with or without IMP3 knockdown. (D) Quantification of FACS analysis on HCT116 and 293T cell lines with a knockdown for IMP3 shown if figure C. Statistical analysis for data of three replicates was performed using student’s t-test. *p(ULBP2, HCT116)=0.0014, *P(ULBP2, 293T)=8.97 E-4. (E) Cell surface staining for ULBP2 in IMP3-overexpressing cell lines HCT116 and 293T. Cells were gated according to their appearance in forward and side scatter and to their GFP levels in FACS that correlate with IMP3 expression. (F) Quantification of surface expression of ULBP2 in IMP3 overexpressing HCT116 and 293T cells shown in figure E. Statistical analysis for data of three replicates was performed using student’s t-test. *p(ULBP2, HCT116)=9.46 E-9, *p(ULBP2, 293T)=0.0002.
Figure 4—figure supplement 1
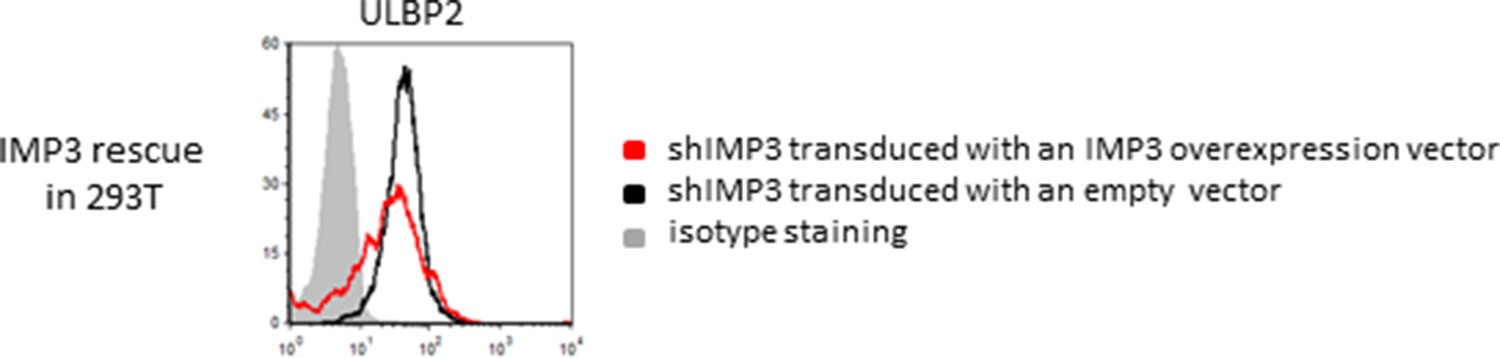
Rescue IMP3 in 293T shIMP3 cells reverses ULBP2 increase.
293T transduced with a shRNA targeting IMP3 were selected using puromycin and subsequently transduced with IMP3 using a lentiviral vector. FACS analysis of stress-ligand expression of ULBP2 is shown; staining of shIMP3 cells transduced with an empty vector as black histogram and cells with rescued IMP3 expression as red histogram. The grey filled histogram is the background staining determined for an isotype mouse IgG antibody. Cells were gated according to their appearance in forward and side scatter and for expression of GFP as reporter for the IMP3-overexpression. Figure shows each one representative plot out of three experiments performed.
Figure 5

Stability determinations of mRNA transcripts of ULBP2 and 3.
RKO transfected with a scrambled shRNA (control) or with shIMP3 were treated with D Actinomycin or with DMSO as control. 16 hr later, mRNAs were isolated and cDNA was prepared. The various mRNA transcripts were analyzed using qRT-PCR. Transcript levels were compared by normalization to GAPDH and by setting transcript levels determined for DMSO treatment as 1. Figure shows merged data of three replicates. *p<0.01 for ULBP2 in student’s t-test; for ULBP3, no significant differences were observed (NS).
Figure 6
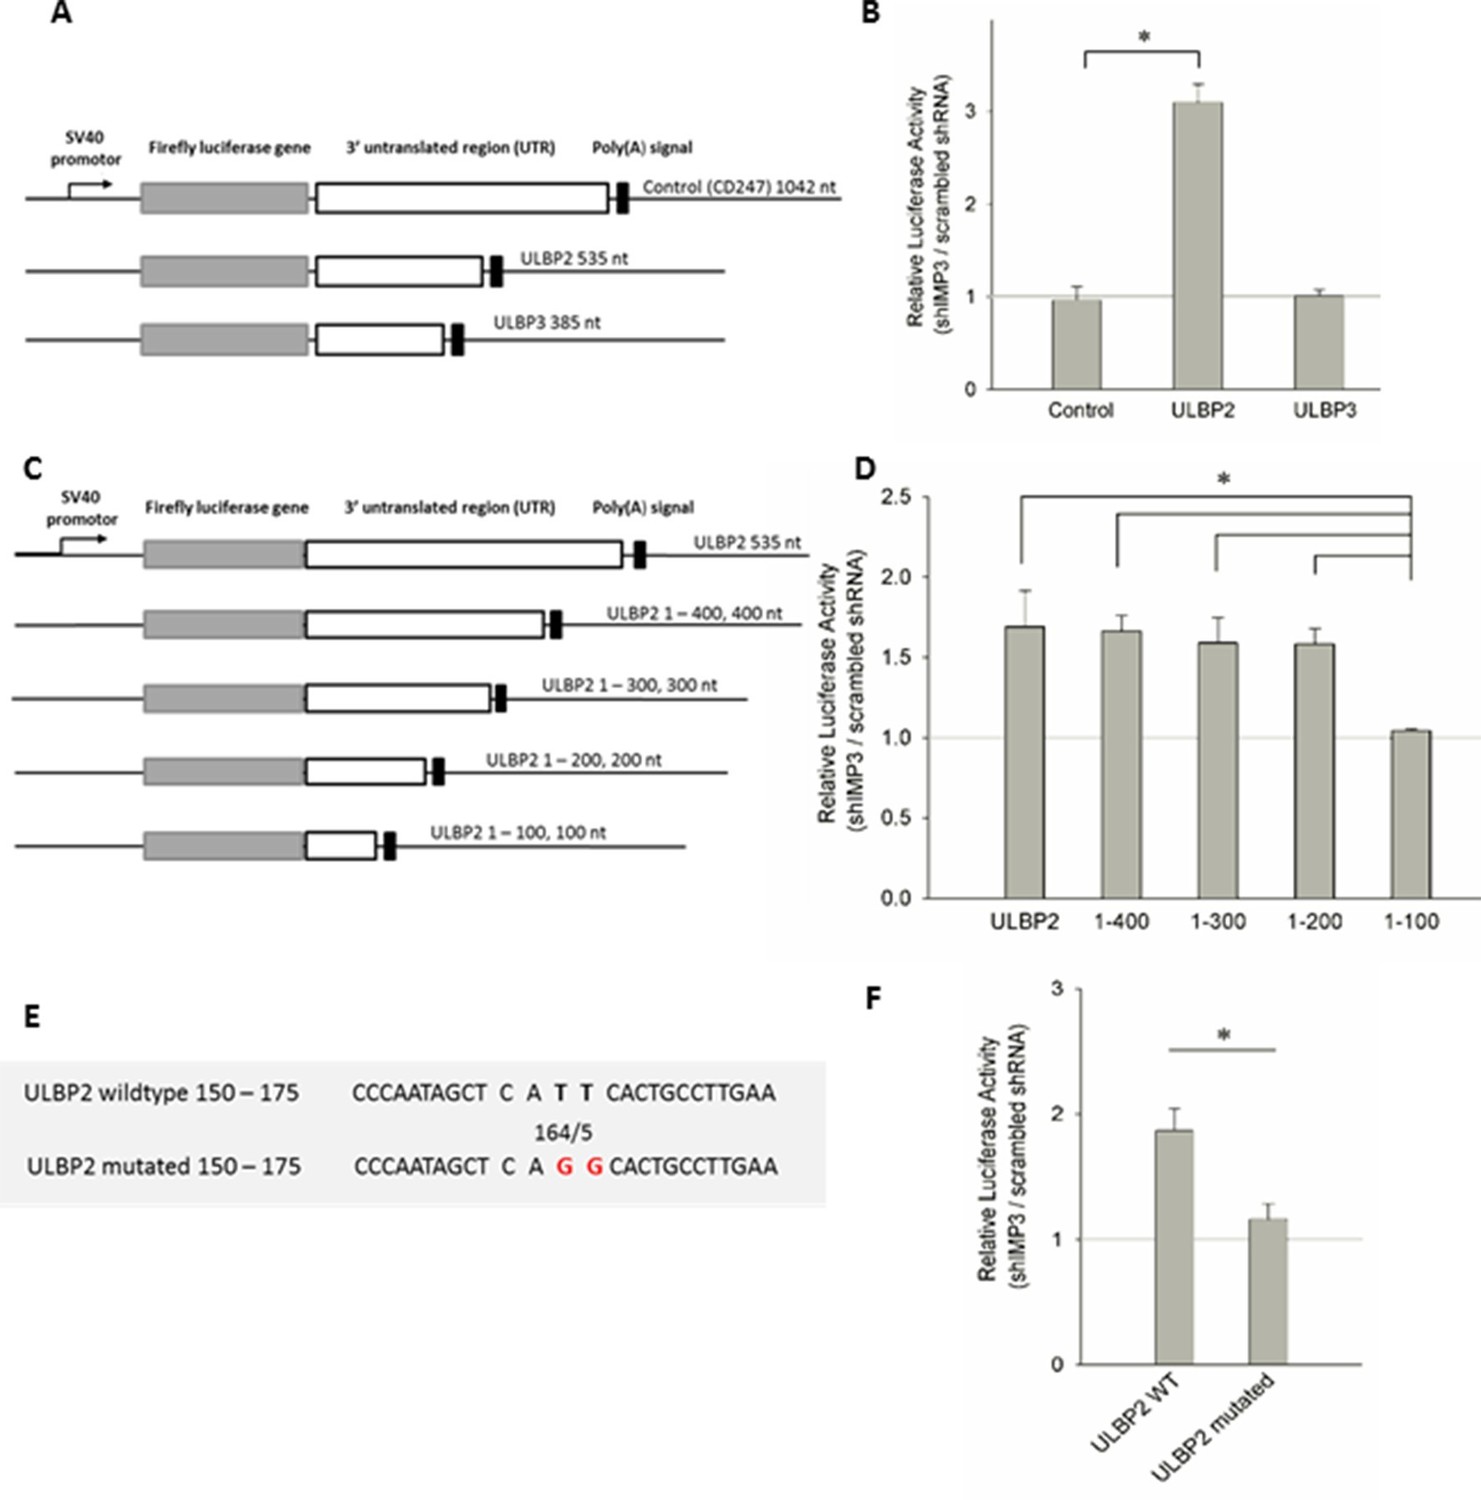
Post-transcriptional effects of IMP3 on ULBP2 mRNA assessed by luciferase assay.
(A) Schematic representation of the luciferase constructs used for this assay with the 3’UTRs of the ULBP family members including their lengths in nucleotides (nt). (B) The 3‘UTRs of ULBP 1, 2, 3 and CD247 (as control) were fused to the luciferase gene as shown in A and expressed in RKO cells transduced either with scrambled shRNA or with shIMP3. 28 hr after transfection of the luciferase vectors, luciferase activity was measured. The results were normalized to empty vector control and statistics were performed based on data acquired for the control UTR (CD247). Figure shows merged data of three independent replicates *p=0.023 in student’s t-test. (C) Schematic representation of the truncation mutants of the ULBP2 3’UTR. (D) Luciferase assay with the 3’UTR of ULBP2 and shortened variants presented in (C), expressed in RKO cells transduced either with scrambled shRNA or with shIMP3. Shown is merged data of three independent replicates. The luciferase activity of the fragment ranging from 1–100 bp was significantly lower than the activity of the fragment 1–200 bp (*p=0.002), 1 300 bp (*p=0.006), 1–400 bp (*p=0.041) and the full 3'UTR (*p=0.010) (E) Schematic representation of the ULBP2 3’UTR sequences areas that were mutated. The putative binding motif CATT is shown in loose characters (positions 161 – 164). The introduced mutations in the 3’ UTRs (CAGG) are shown in red letters. (F) The wild type (WT) or mutated 3’UTRs (as shown in A) of ULBP2 was transiently expressed in RKO cells transduced with scrambled shRNA or with shRNA IMP3. Luciferase activity was assayed 28 hr after transfection. Shown is merged data of three independent replicates. *p<0.001 in student’s t-test.
Figure 7

Knockdown of IMP3 enhances NK cell-mediated killing of cancer cells in a NKG2D dependent manner.
(A-C) Primary human NK cells were incubated with an isotype antibody (left columns, αIsotype) or with anti-hNKG2D monoclonal antibody (right column, αNKG2D) for one hour on ice before target cells – either transduced with a control shRNA or shIMP3 – were added. 35S released into the supernatant upon target cell lysis by NK cells, was assessed 3 hr later (A) 35S release by RKO cells co-cultured with NK cells in the ratio 1:25. *p=0.023 in student’s t-test. (B) 35S release by HCT116 cells co-cultured with NK cells in the ratio 1:10. *p=0.001 in student’s t-test. (C) 35S release by 293T cells co-cultured with NK cells in the ratio 1:10. *P=0.013 in student’s t-test. All experiments were performed at least twice and one representative replicate is shown.
Figure 8 with 1 supplement

IMP3 regulates MICB in a functionally distinct mechanism.
(A) FACS analysis of MICA and MICB surface expression on RKO and 293T cells. Expression is shown on cells transduced with shIMP3 (red histogram) and on cells transduced with a scrambled shRNA (black histogram). The grey-filled histogram is the background staining determined for an isotype mouse IgG antibody. Figure shows one representative experiment out of three performed. (B) Quantification of MICB surface expression of RKO cells transduced either with a scrambled or an IMP3 targeting shRNA. *P(MICB)=0.029 in student’s t-test (C) FACS analysis of MICB surface protein levels in IMP3 overexpressing RKO cells (red histograms) or controls (black histogram), Shown is one representative experiment of at least three performed ones. (D) Quantification of MICB surface expression of IMP3 overexpressing RKO cells or control cells *P(MICB)=1.24 E-6 in student’s t-test. (E) RNA levels of MICA and MICB in RKO transduced with an IMP3 targeting shRNA relative to the scrambled shRNA control and normalized to GAPDH. *P(MICB)=0.0005. (F) RKO transfected with a scrambled shRNA (control) or with an IMP3 targeting shRNA were treated with D-Actinomycin or with DMSO as control. After 16 hr, mRNAs were isolated and cDNA was prepared. The various mRNA transcripts were analyzed using qRT-PCR. Transcript levels were compared by normalization to GAPDH and by setting transcript levels determined for DMSO treatment as 1. Figure shows merged data of three replicates. (G) The 3‘UTRs of MICA and MICB and CD247 (as control) were fused to the luciferase gene and expressed in RKO cells transduced either with scrambled shRNA or with shIMP3. 28 hr after transfection of the luciferase vectors, luciferase activity was measured. Results were normalized to empty vector control and statistics were performed based on data acquired for the control UTR (CD247). No significant changes were obtained (NS). Figure shows merged data of three independent replicates.
Figure 8—figure supplement 1

Rescue IMP3 in RKO and 293T shIMP3 cells reverses MICB downregulation but does not affect MICA expression.
RKO and 293T cells transduced with a shRNA targeting IMP3 were selected using puromycin and subsequently transduced with a plasmid coding for IMP3. FACS analysis of stress-ligand expression MICB and ULBP2 for RKO cells or MICA and ULBP2 in 293T cells is shown. As shown before, MICA is not expressed on RKO cells and 293T cells are negative for MICB. RKO and 293T shIMP3 cells were transduced with either with an empty vector (black histogram) or rescued with an IMP3 expression plasmid (red histogram). The grey filled histogram is the background staining determined for an isotype mouse IgG antibody. Figure shows each one representative plot out of three experiments performed.
Download links
A two-part list of links to download the article, or parts of the article, in various formats.
Downloads (link to download the article as PDF)
Open citations (links to open the citations from this article in various online reference manager services)
Cite this article (links to download the citations from this article in formats compatible with various reference manager tools)
The RNA binding protein IMP3 facilitates tumor immune escape by downregulating the stress-induced ligands ULPB2 and MICB
eLife 5:e13426.
https://doi.org/10.7554/eLife.13426


