Quality control in oocytes by p63 is based on a spring-loaded activation mechanism on the molecular and cellular level
- Goethe University, Germany
- Merck KGaA, Germany
- University of Oxford, United Kingdom
- Georg-Speyer Haus, Germany
- Rutherford Appleton Laboratory, United Kingdom
Figures
Figure 1 with 10 supplements
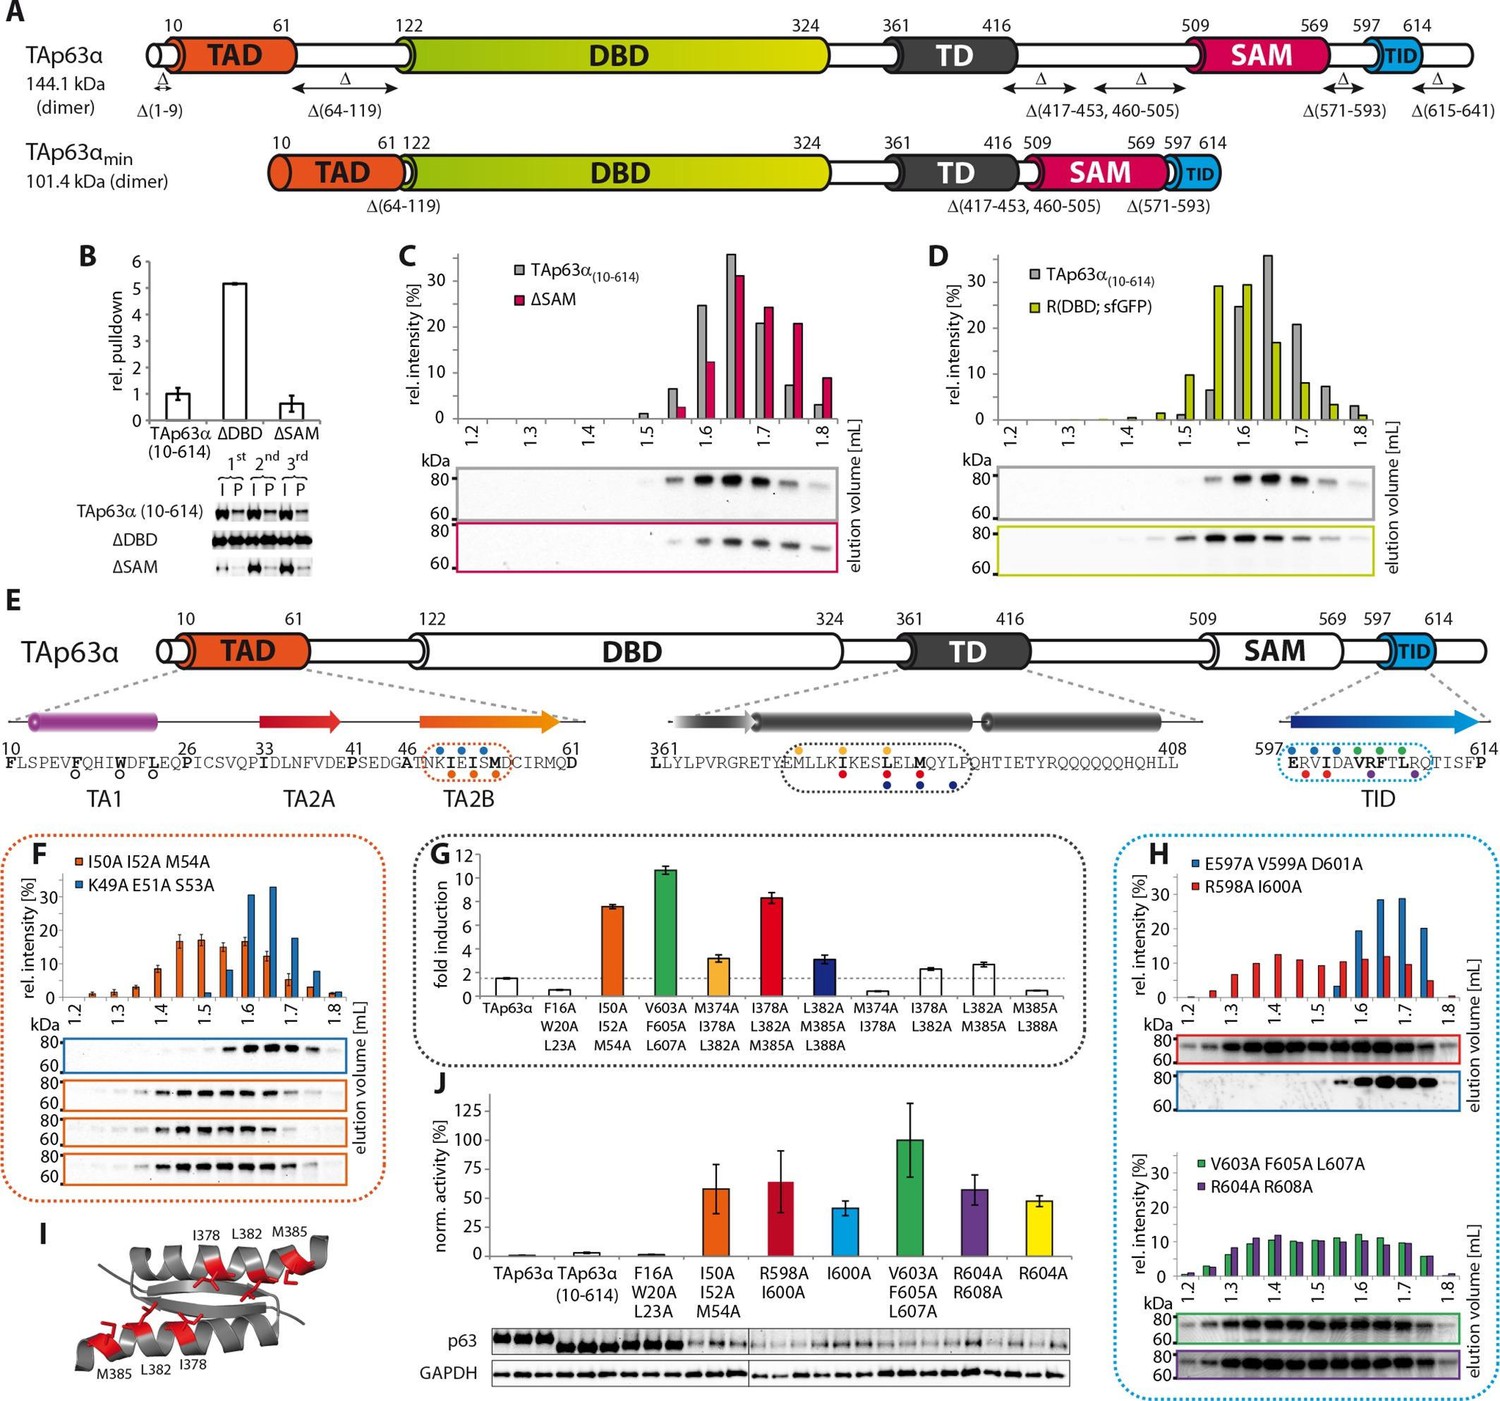
Mapping of structurally important regions within dimeric TAp63α.
(A) Domain organization of TAp63α: transactivation domain (TAD), DNA binding domain (DBD), tetramerization domain (TD), sterile alpha motif (SAM) domain, transactivation inhibitory domain (TID). The minimal construct of TAp63α (TAp63αmin) lacks the first 9 and the last 27 amino acids as well as linker regions between TAD and DBD (64–119), TD and SAM (417–453; 460–505) and SAM and TID (571–593). Residues 454–459 were used as a linker between TD and SAM. (B) WB and corresponding bar diagram of pull-down experiments with constructs lacking either the DBD or the SAM domain using immobilized TID. Ratio of pull-down (P) and input (I) is shown relative to TAp63α(10–614) (set to 1). Pull-downs were performed in technical triplicates and error bars denote standard deviation. (C,D,F,H) TAp63α(10–614) constructs were expressed in rabbit reticulocyte lysate (RRL) and subjected to size exclusion chromatography (SEC). SEC profiles were obtained by WB (using an anti-myc antibody). (C,D) SEC profiles of TAp63α (10–614) ΔSAM (C; pink) and TAp63α (10–614) R(DBD; sfGFP) (D; green) compared with wild type (TAp63α(10–614), grey). R(DBD; sfGFP) indicates the replacement of the DBD by sfGFP. (E) Secondary structure prediction and mapping of structural motifs that stabilize the dimeric TAp63α. Cylinders and arrows represent α-helices and β-strands, respectively. Mutations (color-coded and indicated by filled circles) were introduced into TAp63α(10–614) on different faces of predicted secondary structure elements. The TAD is subdivided into TA1 (residues 10–26), TA2A (33–41) and TA2B (46–61). The TA1 forms an α-helix and the F16/W20/L23 motif constitutes the single interaction motif of the TA1. See Figure 1—figure supplement 5 for a thorough mapping of the TA1. (F) The two faces of the β-stranded TA2B were mutated (residues i, i+2, i+4 to alanine). SEC profiles of I50A I52A M54A (orange) and K49A E51A S53A (blue). See Figure 1—figure supplement 6 for a thorough mapping of the TA2. SEC of I50A I52A M54A was performed in technical triplicates and error bars denote standard deviation. (G) Transcriptional activities of TAp63α TD mutants on the p21 promoter in SAOS2 cells. Triple and double alanine mutations were introduced on the central hydrophobic interface of the TD. Bar diagrams show n-fold induction relative to the activity of the empty vector. Experiments were performed in biological triplicates and error bars denote standard deviation. (H) Mutations were introduced on the two faces of the TID β-strand. SEC profile of R598A I600A (red), E597A V599A D601A (blue), V603A F605 L607A (green) and R604A R608A (purple), Q609A I611A F613A (green) and R604A R608A (purple). See Figure 1—figure supplement 7 for SEC profiles of other mutants. (I) Central hydrophobic interface of the dimeric TD, showing the important I378 L382 M385 motif. (J) Transactivation assay of TAp63α(10–614) mutants that appeared tetrameric in previous experiments (see F, H and Figure 1—figure supplement 7). Transcriptional activities on the p21 promoter in SAOS2 cells were normalized to the protein level (determined by WB and referenced on GAPDH level). Experiments were performed in biological triplicates and error bars denote standard deviation.
Figure 1—figure supplement 1
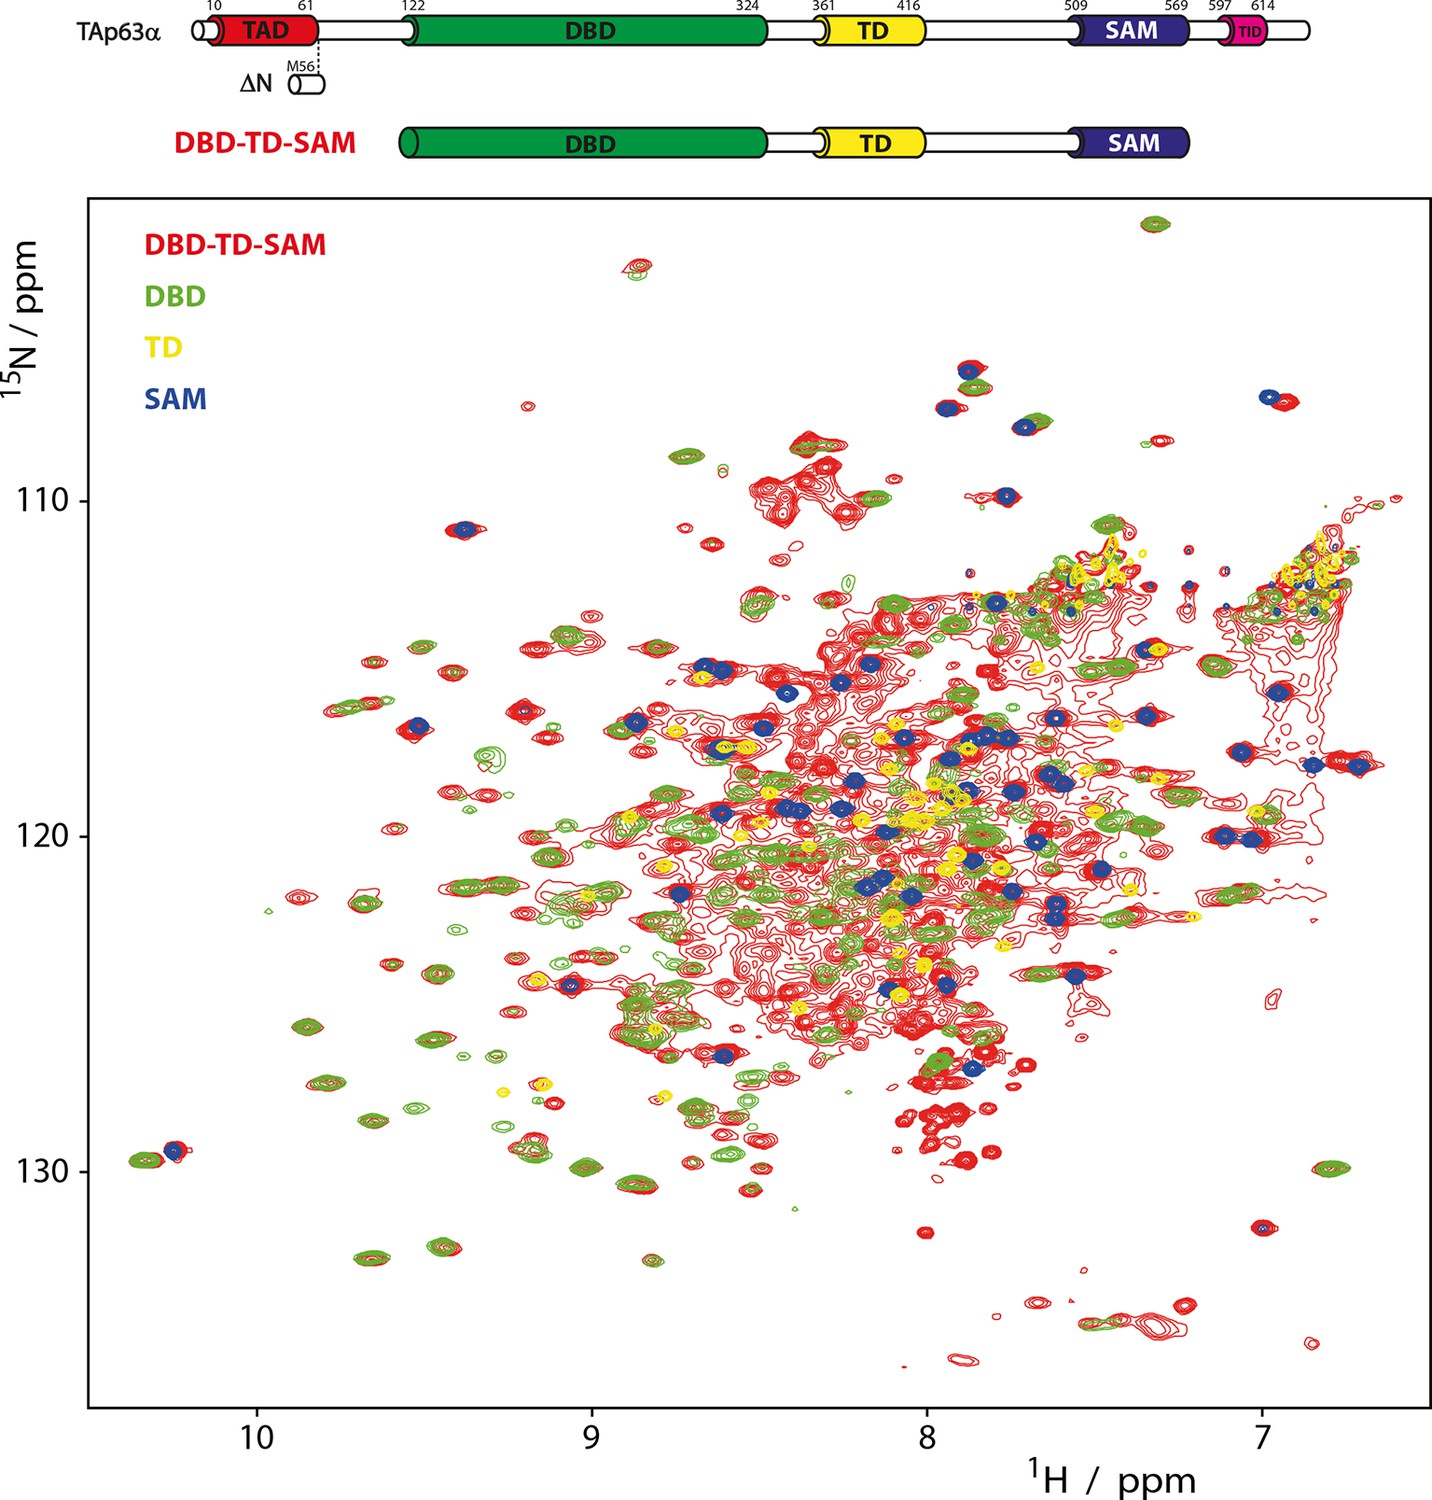
Domains behave as pearls on a string in tetrameric p63.
[15N, 1H]-TROSY spectra of 15N-labeled DBD-TD-SAM and individual domains at 303 K. The construct ranging from DBD to SAM is used to investigate the behavior of tetrameric p63 proteins, specifically referring to ΔNp63α and activated TAp63α. Despite its high molecular weight of 200 kDa a well-resolved spectrum of 15N-labeled DBD-TD-SAM was obtained. The spectra of DBD and SAM overlay well with the spectrum of DBD-TD-SAM. The spectrum of the TD can be recognized with lower confidence, likely owing to unfavorable relaxation properties in the center of the protein. The ability to obtain such a spectrum already proofs that the domains do not form a globular structure but that they tumble independent of each other in solution. Titrations of the individual domains (DBD, TD and SAM) to each other also did not show any interaction (data not shown).
Figure 1—figure supplement 2
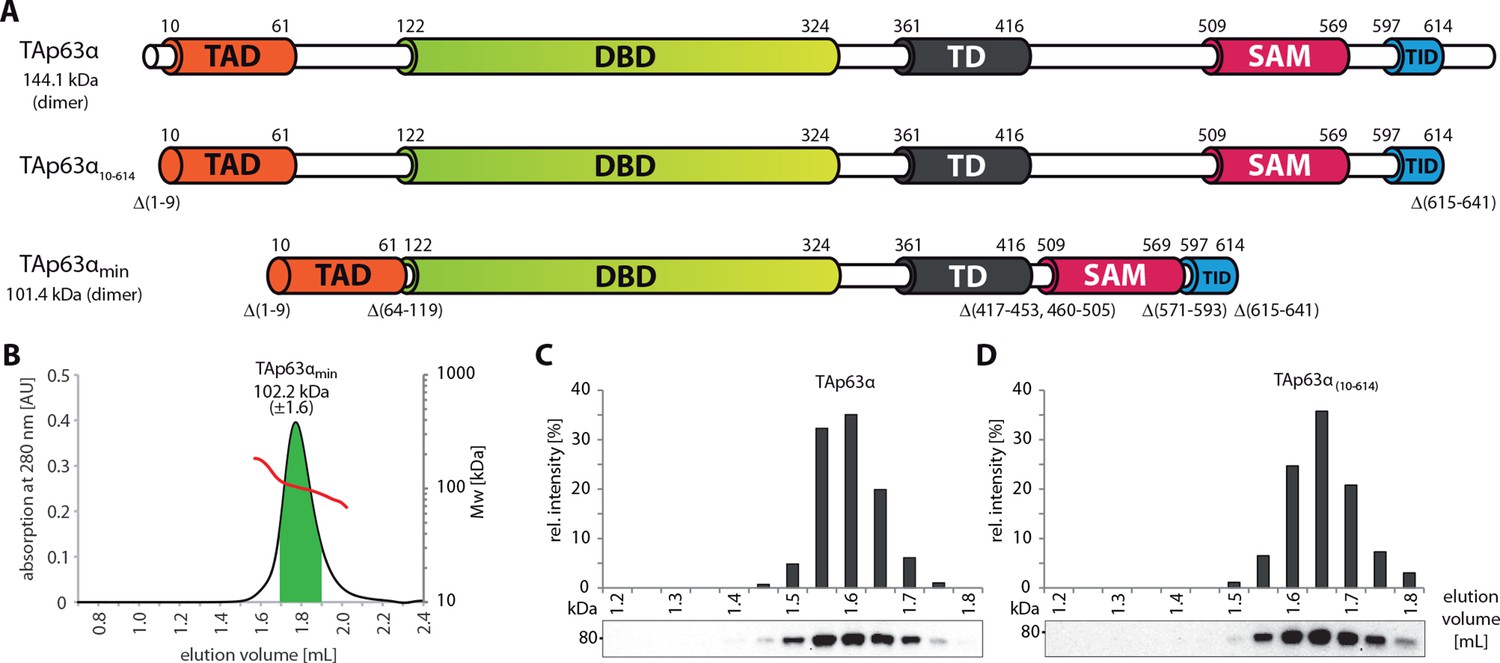
SEC-MALS proves the dimeric nature of TAp63αmin.
(A) Domain organization of TAp63α: transactivation domain (TAD), DNA binding domain (DBD), tetramerization domain (TD), sterile alpha motif (SAM), transactivation inhibitory domain (TID). TAp63α(10–614) lacks the first 9 and the last 27 amino acids. In addition to these N- and C-terminal truncations the minimal construct of TAp63α (TAp63αmin) lacks linker regions between TAD and DBD (64–119), TD and SAM (417–453; 460–505) and SAM and TID (571–593). Residues 454–459 were used as a linker between TD and SAM. Identical to Figure 1A. (B) SEC-MALS of TAp63αmin. Change of molecular weight (Mw) is shown in red. Marked area in green was used to calculate the Mw. (C, D) SEC profiles of RRL (rabbit reticulocyte lysate) expressed TAp63α and TAp63α(10–614), obtained by western blots (using an anti-myc antibody) of eluted fractions and subsequent signal integration, are shown.
Figure 1—figure supplement 3

Deletion of 322–342 does not disrupt the dimeric state.
SEC profiles of RRL expressed TAp63α(10–614) constructs Δ(K322-N342) and Δ(K322-N352).
Figure 1—figure supplement 4

DBD is not essential to retain the dimeric state.
(A) Constructs were designed based on TAp63α(10–614). R(DBD; sfGFP) indicates the replacement of the DBD by sfGFP. All constructs were expressed in rabbit reticulocyte lysate (RRL) and subjected to size exclusion chromatography (SEC) on a Superose 6 3.2/300 column. SEC profiles were obtained by western blots (using an anti-myc antibody) of eluted fractions and subsequent signal integration. (B) SEC profile of TAp63α (10–614) R(DBD; sfGFP) (green) and wild type (TAp63α (10–614), grey). R(DBD; sfGFP) indicates the replacement of the DBD by sfGFP. Identical to Figure 1D. (C) SEC profile of TAp63α (10–614) R(DBD; sfGFP) F16A W20A L23A (green) and TAp63α (10–614) F16A W20A L23A (grey). (D) SEC profile of TAp63α (10–614) R(DBD; sfGFP) I50A I52A M54A (green) and TAp63α (10–614) I50A I52A M54A (grey). (E) SEC profile of TAp63α (10–614) R(DBD; sfGFP) F605A T606A L607A (green) and TAp63α (10–614) F605A T606A L607A (grey). (F) SEC profiles of TAp63α R(DBD; sfGFP) (green) and TAp63α R(DBD; MBP) (dark blue).
Figure 1—figure supplement 5
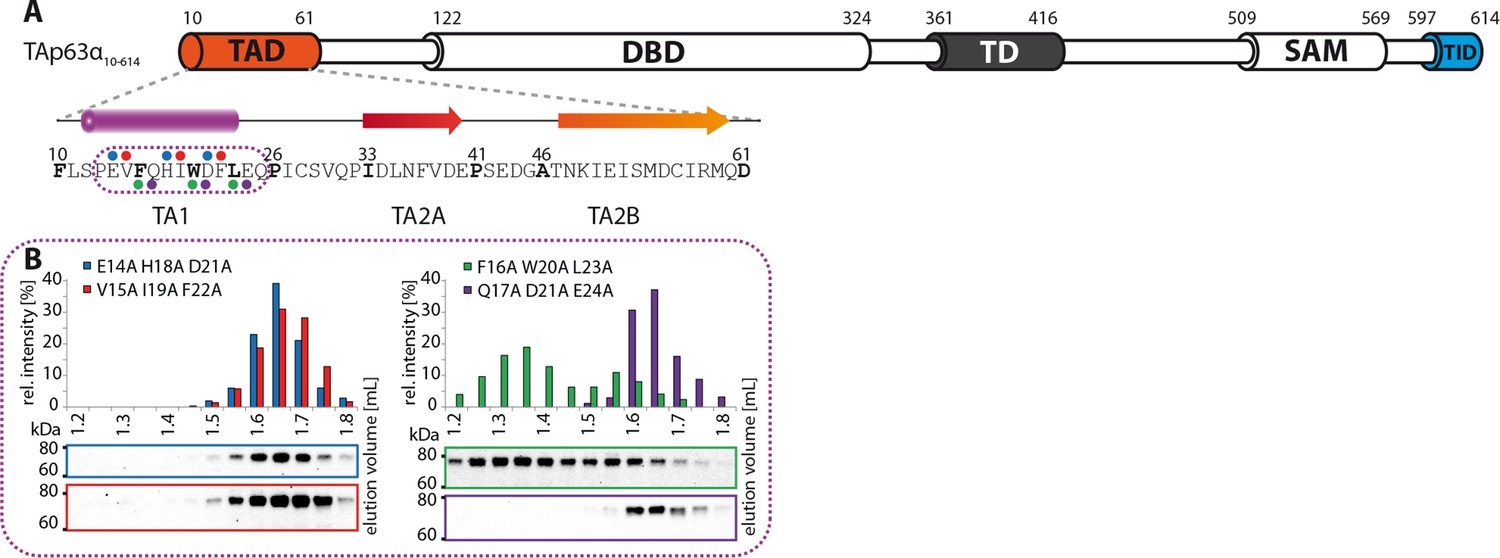
The TA1 forms an α-helix.
(A) Secondary structure prediction and mapping of structural motifs in the TAD that stabilize the dimeric TAp63α. Cylinders and arrows represent α-helices and β-strands, respectively. Mutations (color-coded and indicated by filled circles) were introduced into TAp63α(10–614) on different faces of predicted secondary structure elements. The TAD is subdivided into TA1 (residues 10–26), TA2A (33–41) and TA2B (46–61). (B) The four faces of the α-helical TA1 were mutated (residues i, i+4, i+7 to alanine). SEC profiles of E14A H18A D21A (blue), V15A I19A F22A (red), F16A W20A L23A (green) and Q17A D21A E24A (purple). Only the F16A W20A L23A mutation disrupts the dimeric state. Therefore, the F16 W20 L23 motif constitutes the single interaction motif of the helical TA1.
Figure 1—figure supplement 6
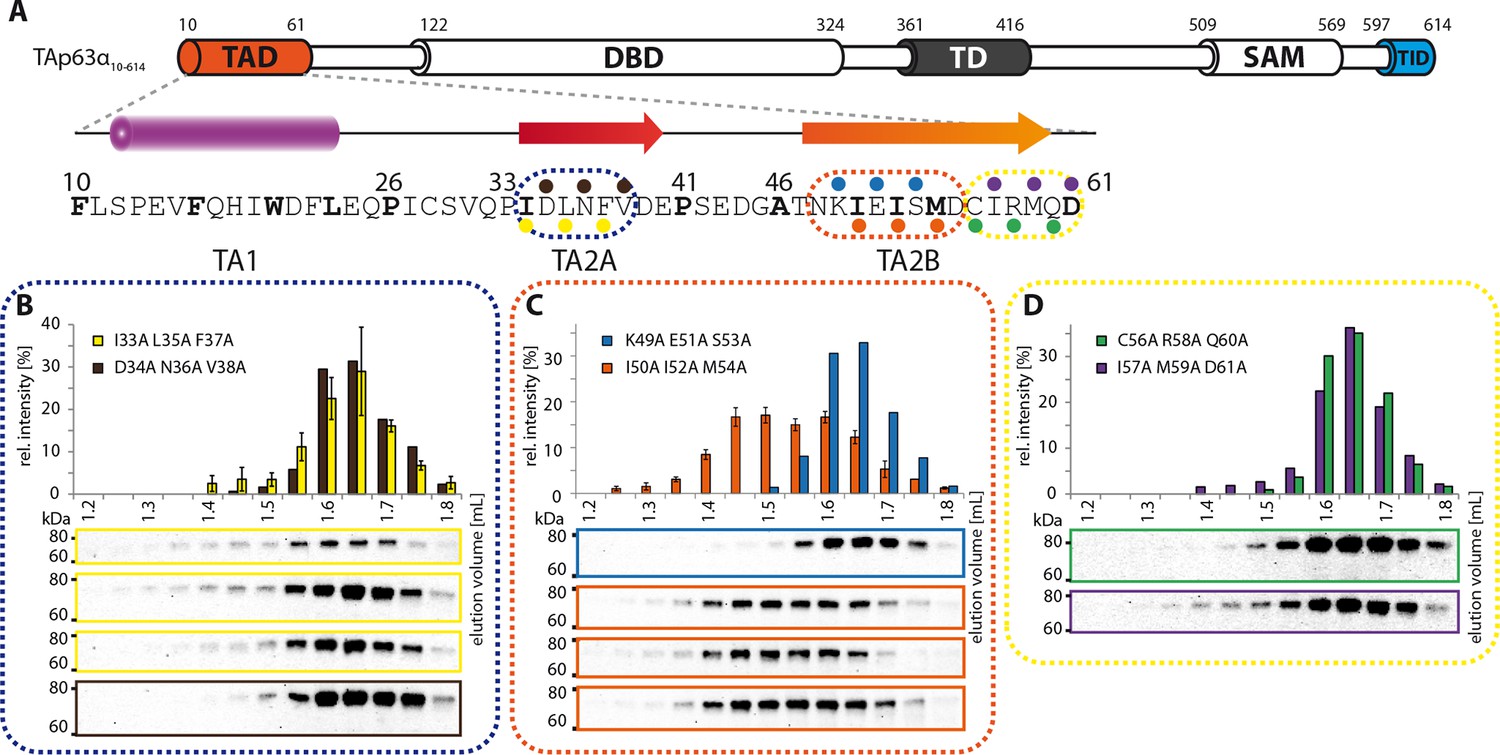
Mapping of structural motifs in the TA2.
(A) Secondary structure prediction and mapping of structural motifs in the TAD that stabilize the dimeric TAp63α. Cylinders and arrows represent α-helices and β-strands, respectively. Mutations (color-coded and indicated by filled circles) were introduced into TAp63α(10–614) on different faces of predicted secondary structure elements. The TAD is subdivided into TA1 (residues 10–26), TA2A (33–41) and TA2B (46–61). (B) The two faces of the β-stranded TA2A were mutated (residues i, i+2, i+4 to alanine). SEC profiles of I33A L35A F37A (yellow) and D34A N36A V38A (brown). SEC of I33A L35A F37A was performed in technical triplicates and error bars denote standard deviation. (C,D) The two faces of the β-stranded TA2B were mutated (residues i, i+2, i+4 to alanine). (C) SEC profiles of K49A E51A S53A (blue) and I50A I52A M54A (orange). SEC of I50A I52A M54A was performed in technical triplicates and error bars denote standard deviation. Identical to Figure 1F. (D) SEC profiles of C56A R58A Q60A (green) and I57A M59A D61A (purple).
Figure 1—figure supplement 7
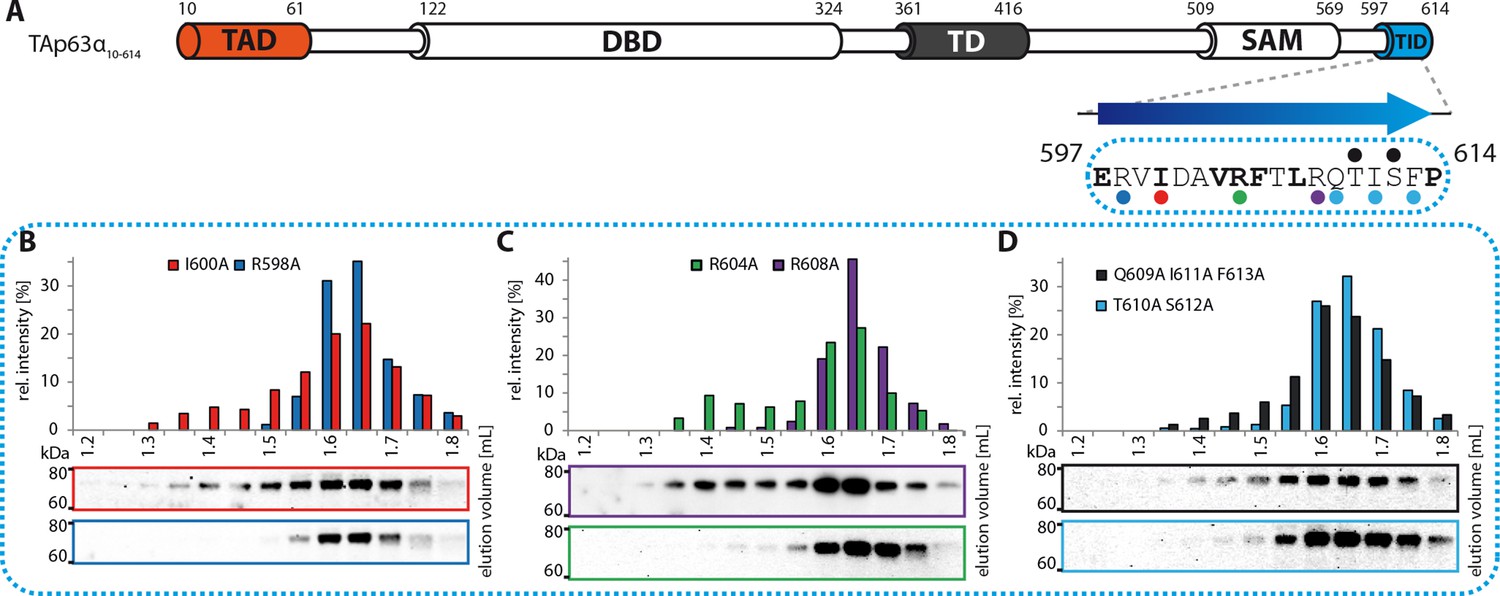
Mapping of structural motifs in the TID.
(A) Secondary structure prediction and mapping of structural motifs in the TID that stabilize the dimeric TAp63α. The TID is predicted to form a β-strand. Mutations (color-coded and indicated by filled circles) were introduced into TAp63α(10–614) on different faces of the β-strand. Mutations were performed to evaluate the contribution of the single amino acid mutants to the effect shown for the double mutations R598A I600A and R604A R608A (Figure 1H). In addition, the C-terminal part of the TID is mapped. (B) SEC profile of I600A (red) and R598A (blue). (C) SEC profile of R604A (green) and R608A (purple). (D) SEC profile of Q609A I611A F613A (black) and T610A S612A (cyan).
Figure 1—figure supplement 8
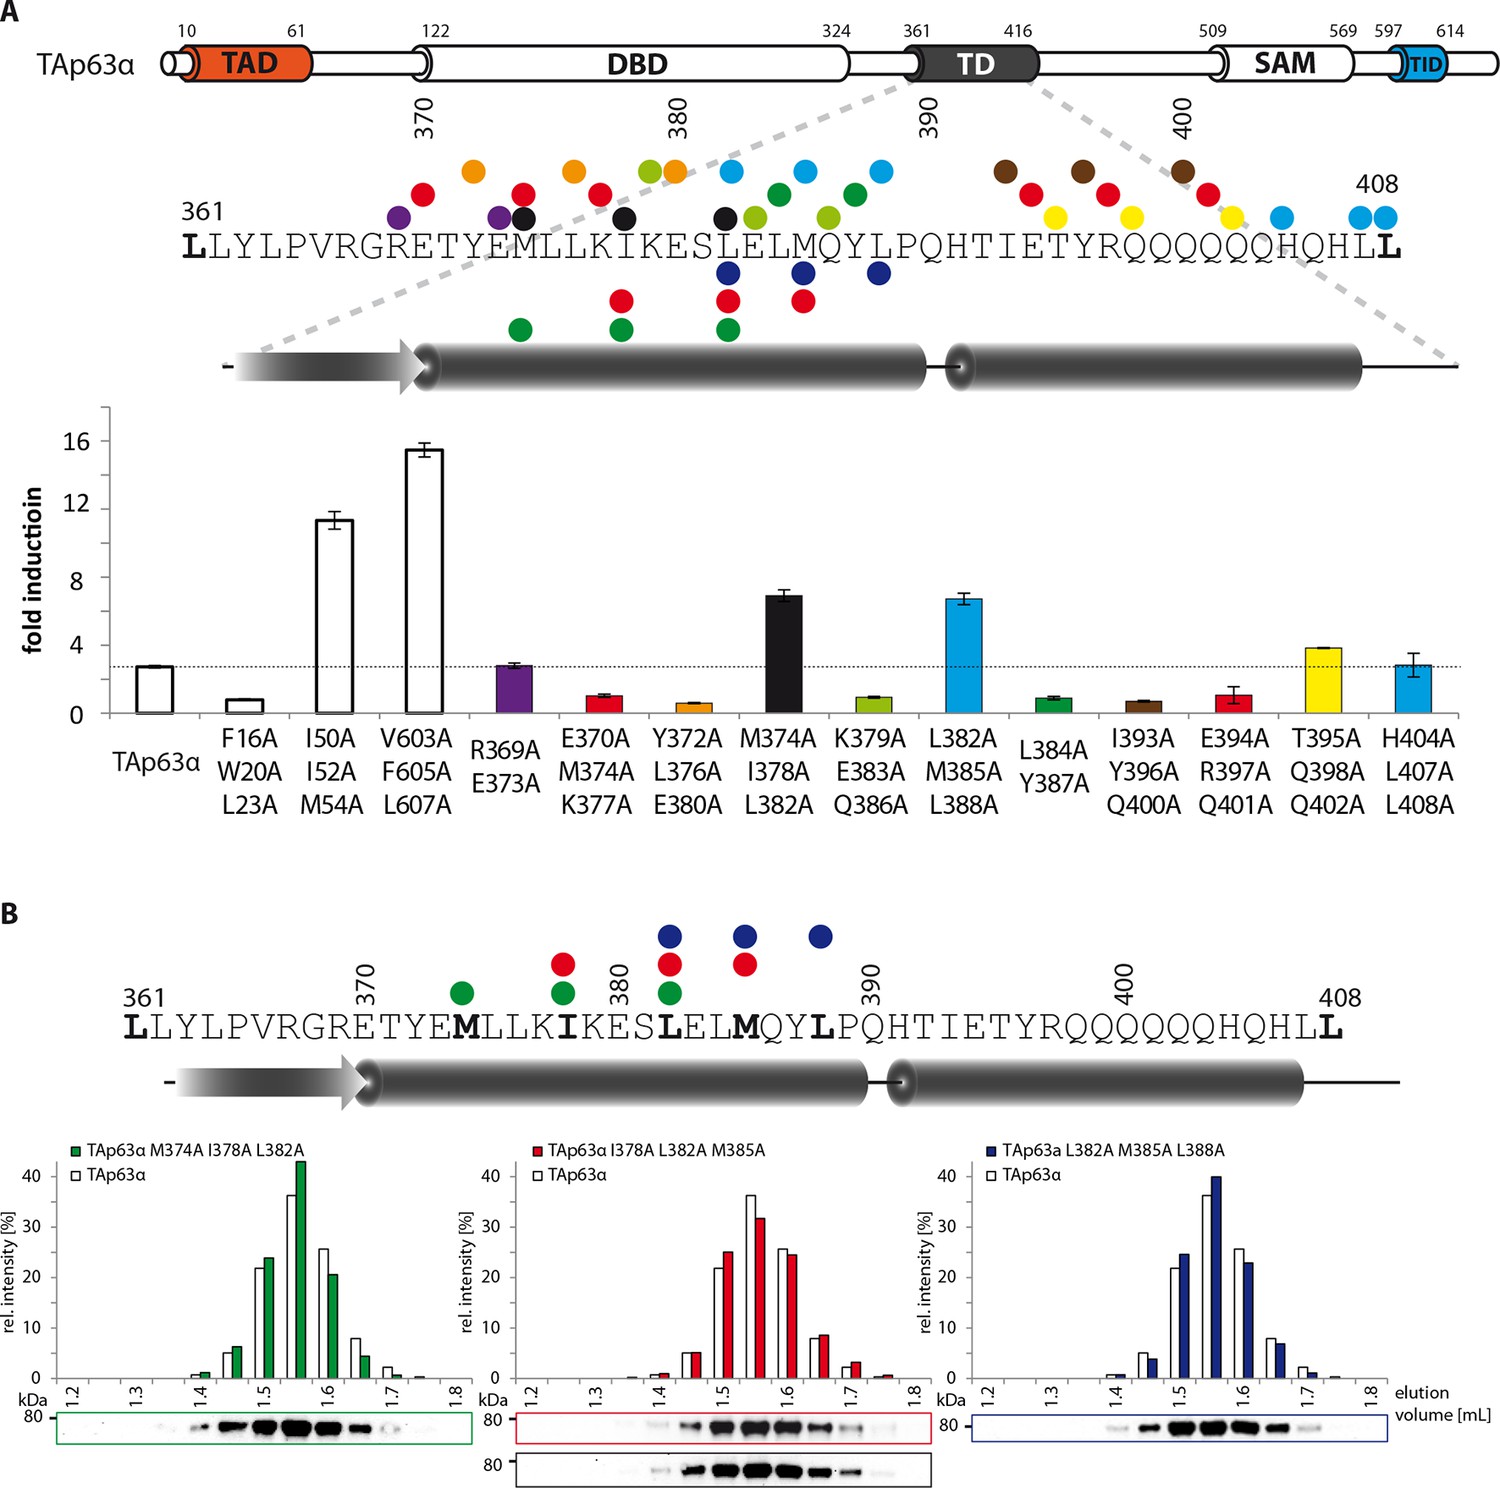
Mapping of structural motifs in the TD by measurement of transcriptional activities.
(A) Transcriptional activities of TAp63α TD mutants on the p21 promoter in SAOS2 cells. Triple and double alanine mutations were introduced on the surface of the two helices. Experiments were performed in triplicates. Bar diagrams show n-fold p21 promoter induction relative to the activity of the empty vector control. Mutations M374A I378A L382A and L382A M385A L388A suggest that the hydrophobic interface starting from the center to the end of the first α-helix is important for the stabilization of dimeric TAp63α. Further detailed experiments are shown in Figure 1G. (B) SEC profiles of TAp63α mutants M374A I378A L382A (green) I378A L382A M385A (red) and L382A M385A L388A (blue) are identical to wild type TAp63α although they are transcriptionally active and should therefore exhibit a more open conformation. Since the tetrameric interface is mutated, the mutants cannot form tetramer but only dimers.
Figure 1—figure supplement 9

Validation of structural motifs by pull-down with GST-TID.
(A) Secondary structure prediction and mapping of structural motifs that stabilize the dimeric TAp63α. Cylinders and arrows represent α-helices and β-strands, respectively. Mutations (color-coded and indicated by filled circles) were introduced into TAp63α (10–614) on different faces of predicted secondary structure elements. Transcriptional activities of identical mutations were investigated in a separated experiment (see Figure 1J). (B,C) Western blot (B) and corresponding bar diagram (C) of pull-down experiments (using immobilized TID) with TAp63α (10–614) mutants that appeared tetrameric in previous experiments and the I33 L35A F37A mutant. (B) Western blots used for quantification of pull-down with GST-TID. Experiments were performed in technical triplicates. (C) Quotient of pull-down (P) and input (I) is shown relative to TAp63α (10–614) (set to 1). Error bars denote standard deviation. All mutants showed a more than 2-fold pull-down compared to TAp63α (10–614) which indicates that they exist in an open conformation, exposing hydrophobic patches. Surprisingly the I33A L35A F37A mutant exhibited the highest pull-down, indicating that I33, L35, and F37 do indeed play a structural role inside TAp63α, likely in forming a beta-strand as predicted. Error bars denote standard deviation.
Figure 1—figure supplement 10
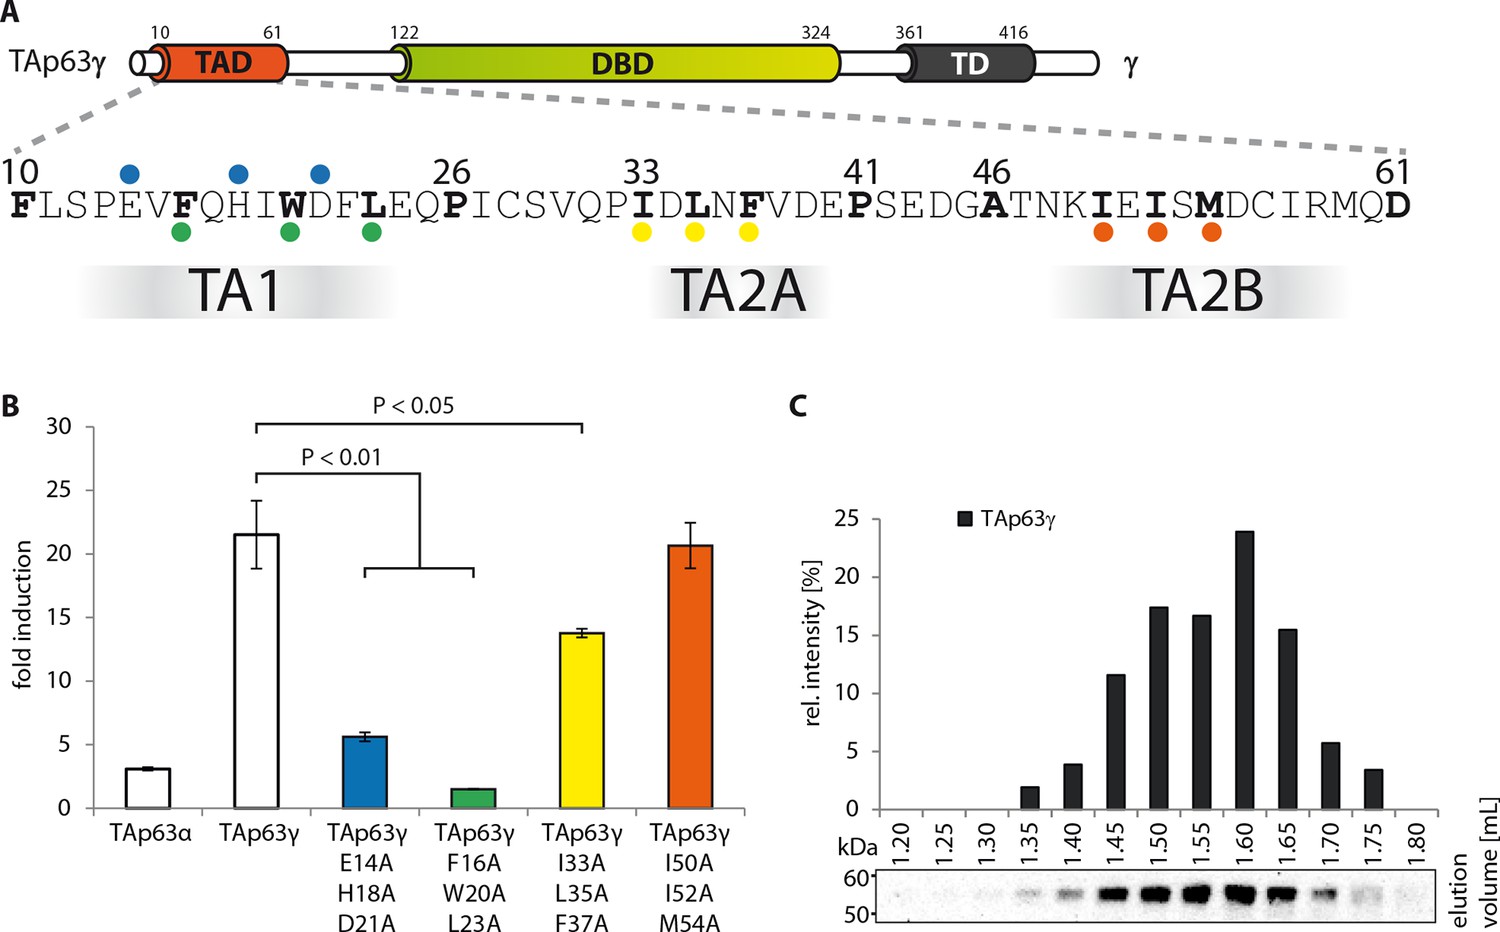
Transcriptional activities of tetrameric TAp63γ mutants.
(A) Motifs in the TAD of TAp63γ are tested for their importance in transcriptional activation. (B) Transcriptional activities of human TAp63γ mutants on the p21 promoter in SAOS2 cells. Bar diagrams show n-fold p21 promoter induction relative to the activity of the empty vector control. Experiments were performed in biological triplicates and error bars denote standard deviation. Means were compared using Student’s t-test. (C) TAp63γ forms tetramers (expected molecular weight: 204 kDa). TAp63γ was expressed in rabbit reticulocyte lysate (RRL) and subjected to size exclusion chromatography (SEC) on a Superose 6 3.2/300 column. SEC profile of TAp63γ was obtained by western blot (using an anti-myc antibody) of eluted fractions and subsequent signal integration.
Figure 2 with 1 supplement
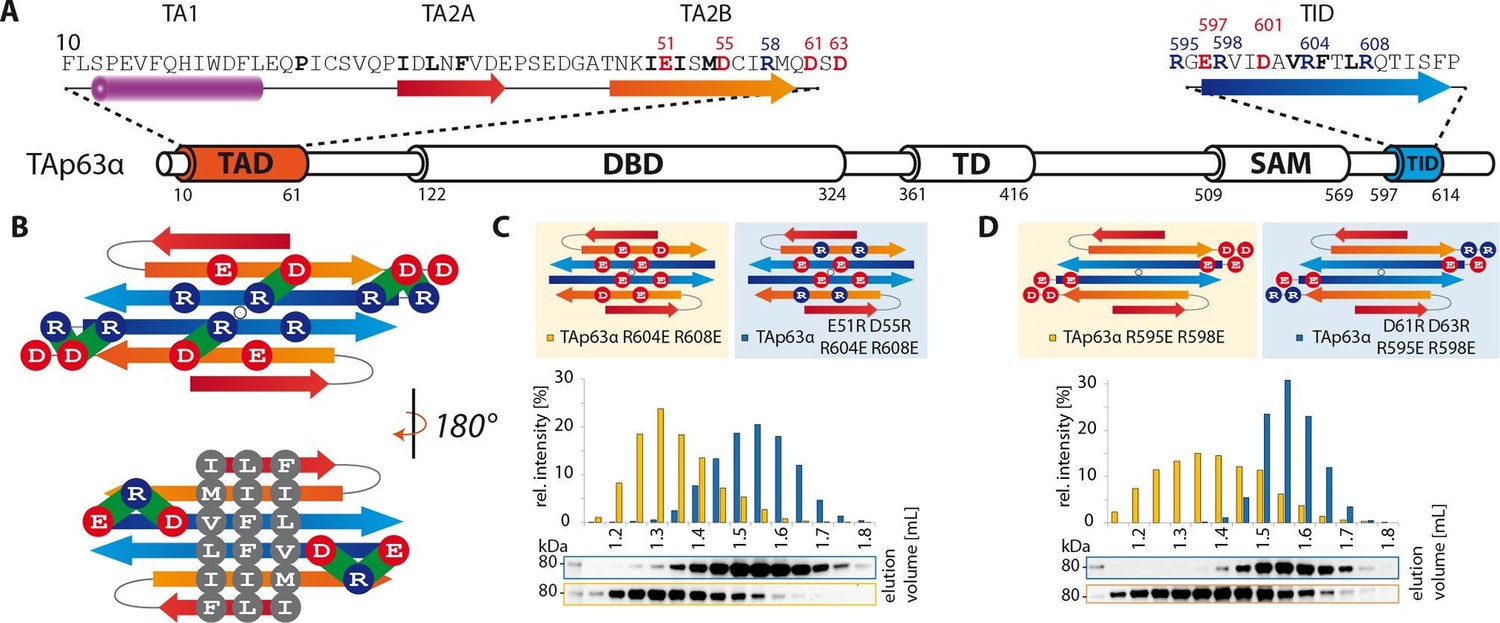
TA2B and TID form an anti-parallel β-sheet with a polar and a hydrophobic face.
(A) Domain organization of TAp63α and secondary structure elements of TAD and TID. (B) Proposed interaction of TA2 and TID through β-sheet formation. This interaction is thought to be stabilized by hydrophobic amino acids clustered on one face of the β-sheet (bottom) and electrostatic interactions between charged amino acids on the other face (top). Extensive charge swap experiments (see Figure 2—figure supplement 1) revealed interactions between TA2B and TID. Interactions are depicted in green. (C, D) Introduction of negative charges in the TID and charge swaps between TID and TA2B show interaction via β-sheet formation. (C) SEC profiles of TAp63α R604E R608E (orange) and the charge swap mutant TAp63α E51R D55R R604E R608E (blue). (D) SEC profiles of TAp63α R595E R598E (orange) and the charge swap mutant TAp63α D61R D63R R595E R598E (blue).
Figure 2—figure supplement 1
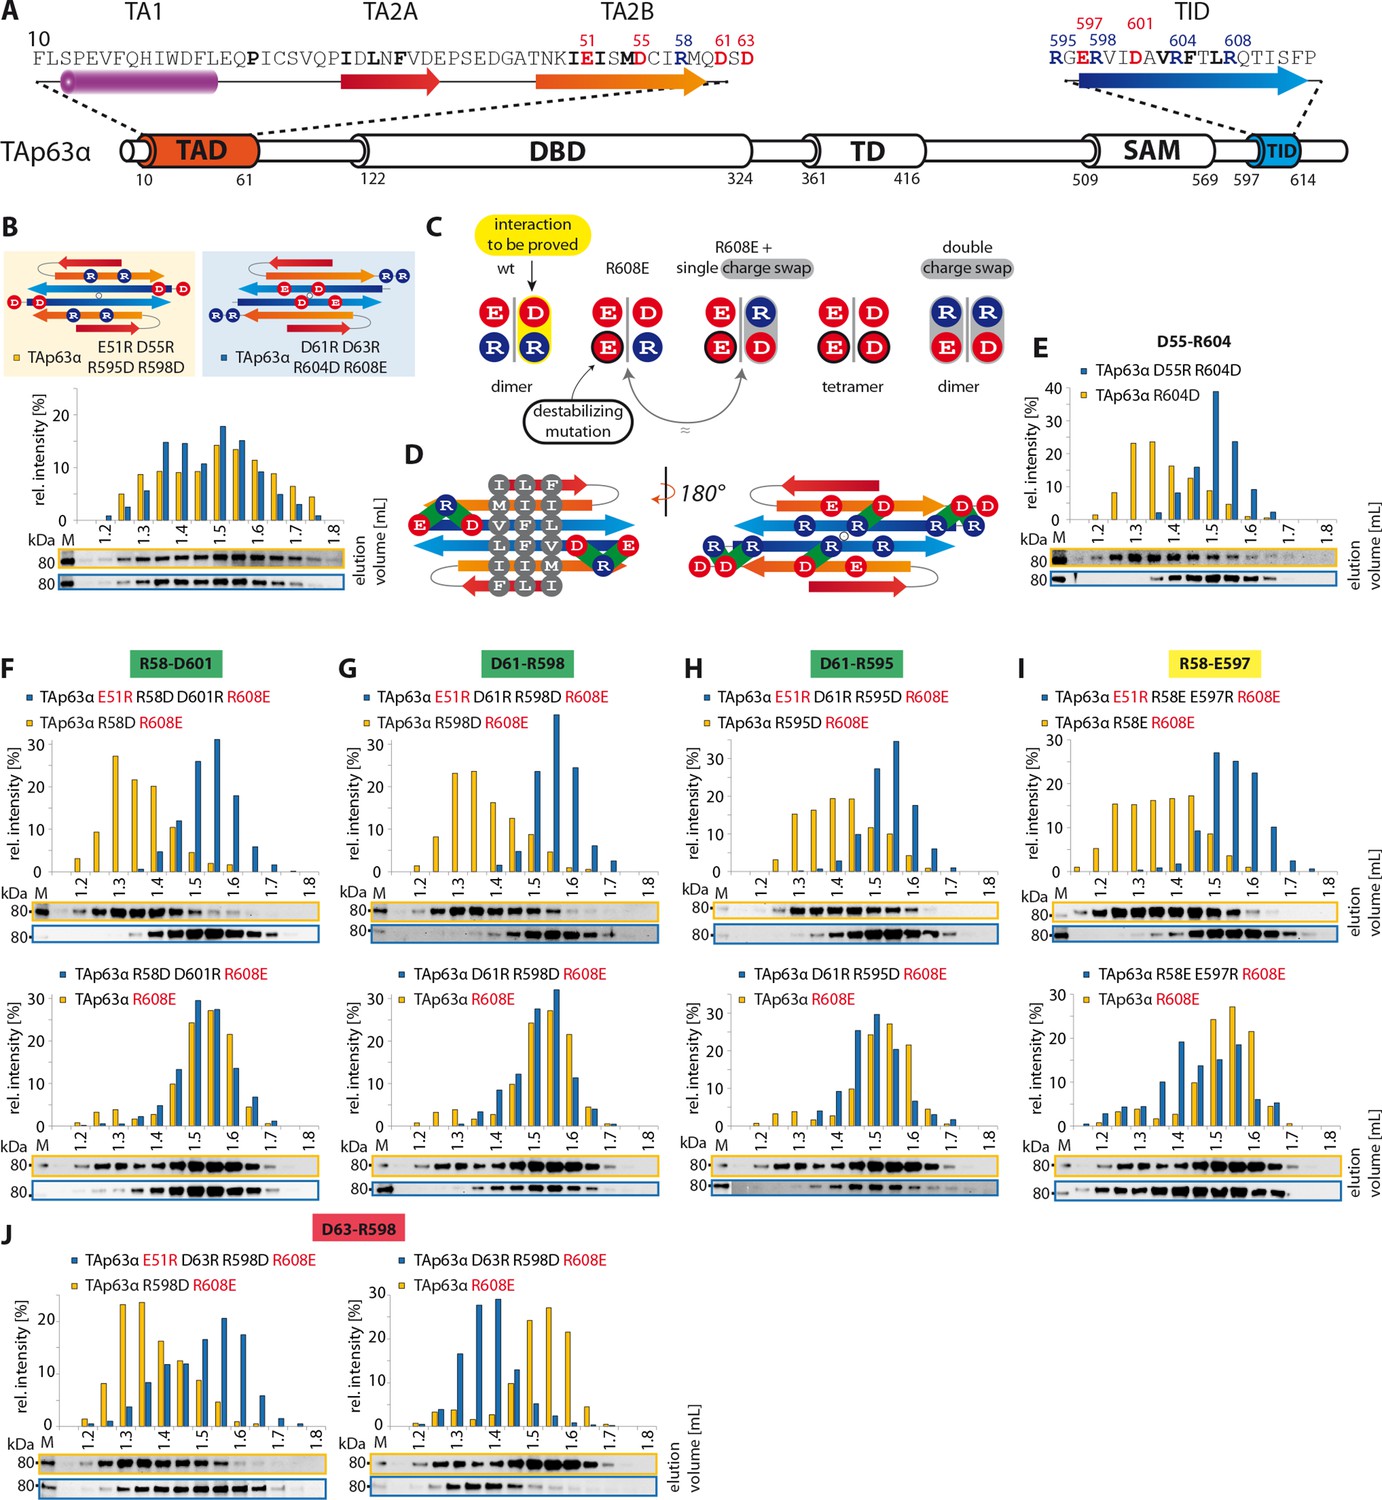
TA2B and TID form an anti-parallel β-sheet.
(A) Secondary structure prediction of TAD and TID. TA2B and TID are predicted to form β-strands. (B) On validation, charges were swapped between presumably distant amino acids. SEC profiles of TAp63α E51R D55R R595D R598D (orange) and TAp63α D61R D63R R604D R608E (blue). (C) Charge swaps are used to reveal interactions between charged amino acids across the presumed β-sheet formed by TA2B and TID. A destabilizing mutation (arginine to aspartate or glutamate) is introduced into TAp63α. Solely mutation R604D/E leads to the formation of tetramers. Any other arginine in TA2B or TID mutated to aspartate or glutamate does not change the oligomeric state. In order to break the interaction between TA2B and TID, a second destabilizing mutation is introduced that disrupts the dimeric state and leads to the formation of tetramers. Additional compensating mutations in the double charge swap recover the dimeric state. To prove a single interaction between two differently charged amino acids, they are swapped in presence of a destabilizing mutation (R608E) resulting in a triple mutant. Similar SEC profiles of the destabilizing and the triple mutation prove the interaction between the swapped amino acids. (D) Extensive charge swap experiments (shown in E-I) revealed interactions (shown in green) between TA2B and TID. (E) SEC profiles of a single charge swap between R604 and D55 (blue) and the destabilizing mutation R604D show a direct interaction between D55 and R604. (F,G,H,I,J) SEC profiles of double arginine mutants (top, orange) and double charge swaps (top, blue). SEC profiles of triple mutants (bottom, blue) and the R608E mutant (bottom, orange) should be identical to verify the interaction shown in bold (top). For comparison identical western blots / SEC profiles of TAp63α R608E are shown on bottom. (F) SEC profiles of TAp63α R58D R608E (top, orange), charge swap TAp63α E51R R58D D601R R608E (top, blue), triple mutant TAp63α R58D D601R R608E (bottom, blue) and mutant TAp63α R608E (bottom, orange). (G) SEC profiles of TAp63α R598D R608E (top, orange) and charge swap TAp63α E51R D61R R598D R608E (top, blue), triple mutant TAp63α D61R R598D R608E (bottom, blue) and mutant TAp63α R608E (bottom, orange). (H) SEC profiles of TAp63α R595D R608E (top, orange) and charge swap TAp63α E51R D61R R595D R608E (top, blue), triple mutant TAp63α D61R R595D R608E (bottom, blue) and mutant TAp63α R608E (bottom, orange). (I) SEC profiles of TAp63α R58E R608E (top, orange) and charge swap TAp63α E51R R58E E597R R608E (top, blue), triple mutant TAp63α R58E E597R R608E (bottom, blue) and mutant TAp63α R608E (bottom, orange). (J) SEC profiles of TAp63α R598D R608E (left, orange, identical blot/profile as shown in G) and charge swap TAp63α E51R D63R R598D R608E (left, blue), triple mutant TAp63α D63R R598D R608E (right, blue) and mutant TAp63α R608E (right, orange).
Figure 3
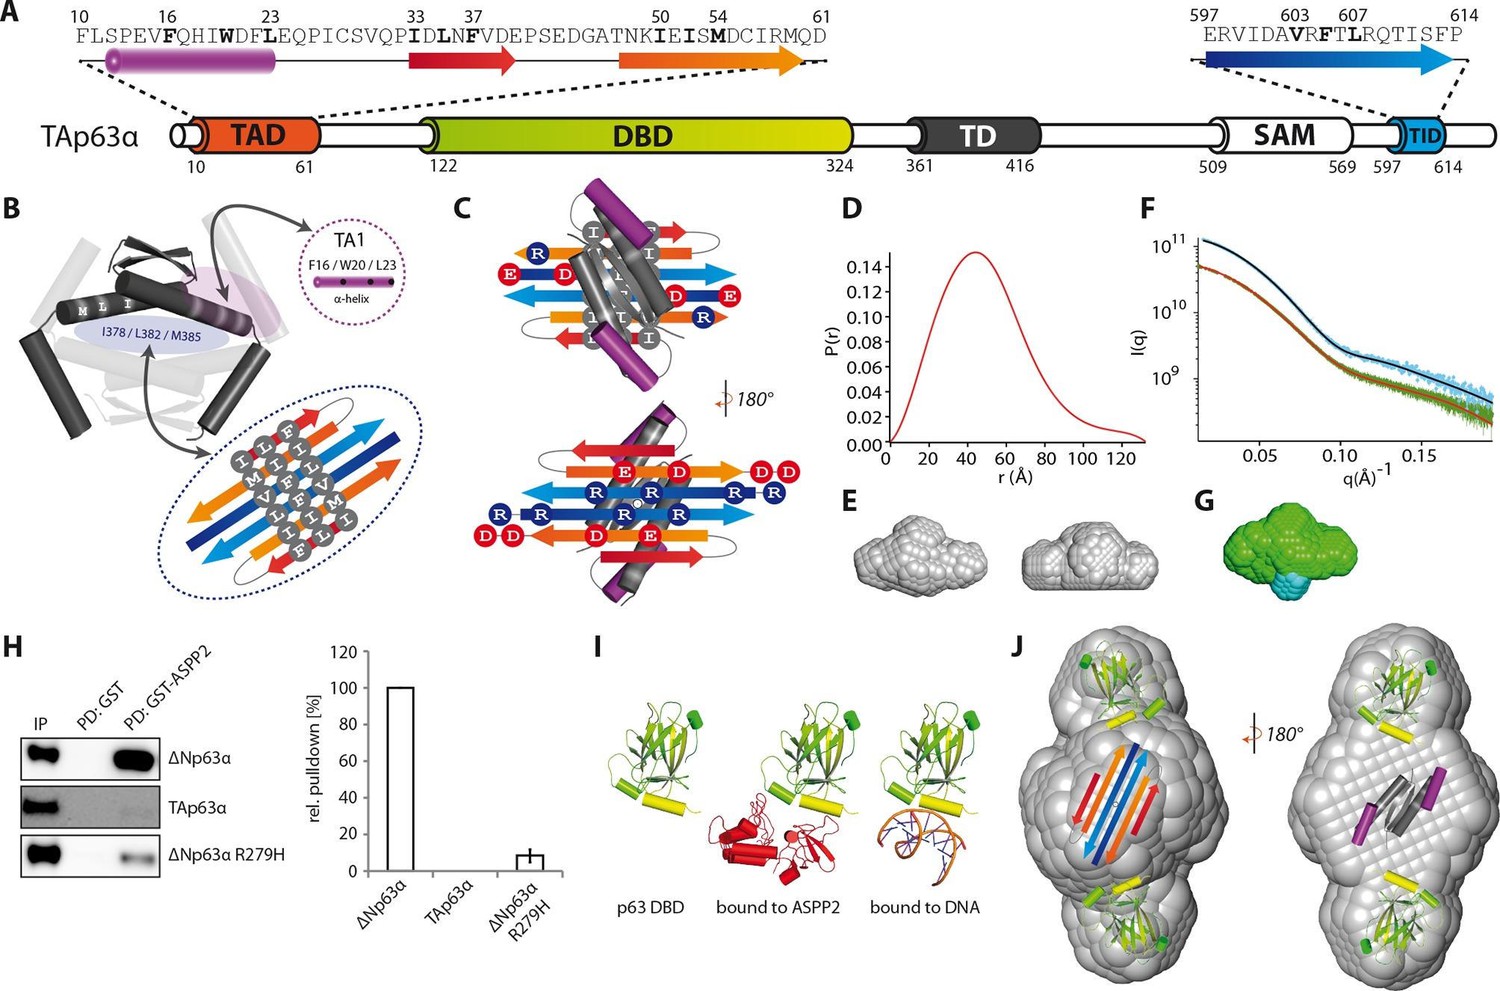
Model of the closed dimeric conformation of TAp63α .
(A) Domain organization of TAp63α. All domains and structural elements are color coded. (B) The TD of p63 forms a dimer of dimers (colored in dark and light grey). Its two tetrameric interfaces (in light blue and rose) must be blocked in the inactive dimer to inhibit tetramerization. The TA1 was shown to bind to the upper interface (in rose) (Deutsch et al., 2011). The I378 L382 M385 motif in the central interface (in light blue) must be covered by hydrophobic amino acids. The hydrophobic interface of the proposed 6-stranded β-sheet is expected to cover this central tetrameric interface of the TD. (C) Model of the intramolecular interactions between TAD, TD and TID. The angles between structural elements are speculative. The TD was placed on top of the TA2/TID β-sheet so that the hydrophobic amino acids mask each other. The second helix of the TD is not modelled. (D) Pair distribution function P(r) from inline SEC-SAXS (small-angle X-ray scattering) data of TAp63αmin. Derived function transformed smoothly and appears to indicate globular central part with short extensional component. (E) Average ab-initio SAXS envelopes of TAp63αmin without (left) and with (right) P2 symmetry, calculated using DAMMIF (Franke and Svergun, 2009). The similar shape suggests the presence of C2 symmetry in TAp63αmin. Envelopes were filtered and averaged using DAMFILT and were obtained from inline SEC-SAXS. (F) Simulated annealing multiphase model from simultaneous curve fits to wild type TAp63αmin and λ-cro-TAp63αmin (N-terminal fusion). Models constructed using MONSA allowing co-refinement of ab-initio models simultaneously. Blue segments give density differences derivative when refined against the native dataset. (G) Localization of the N-terminus. Multiphase fits to data sets, wild type TAp63αmin in green and λ-cro-TAp63αmin in blue. (H) WB and corresponding bar diagram of the pull-down experiments with ΔNp63α, TAp63α and ΔNp63α R279H from RRL using either immobilized GST or GST-ASPP2 fusion. WB signal for input (IP) and pull-down (PD) are shown. The pull-down efficiency of ΔNp63α was set to 100%. Pull-downs were performed in technical triplicates and error bars display the standard deviation. (I) Structure of the human p63 DBD alone, bound to DNA and a model of the p63 DBD bound to ASPP2 based on the co-crystal structure between the p53 DBD and ASPP2. (J) TAD, DBD, TD and TID are placed manually inside the P2 calculated average SAXS envelope. The DBDs are likely positioned at the outside of the molecule, leaving the center to be occupied by TAD, TD and TID. The SAM domain is not modelled.
Figure 4 with 2 supplements
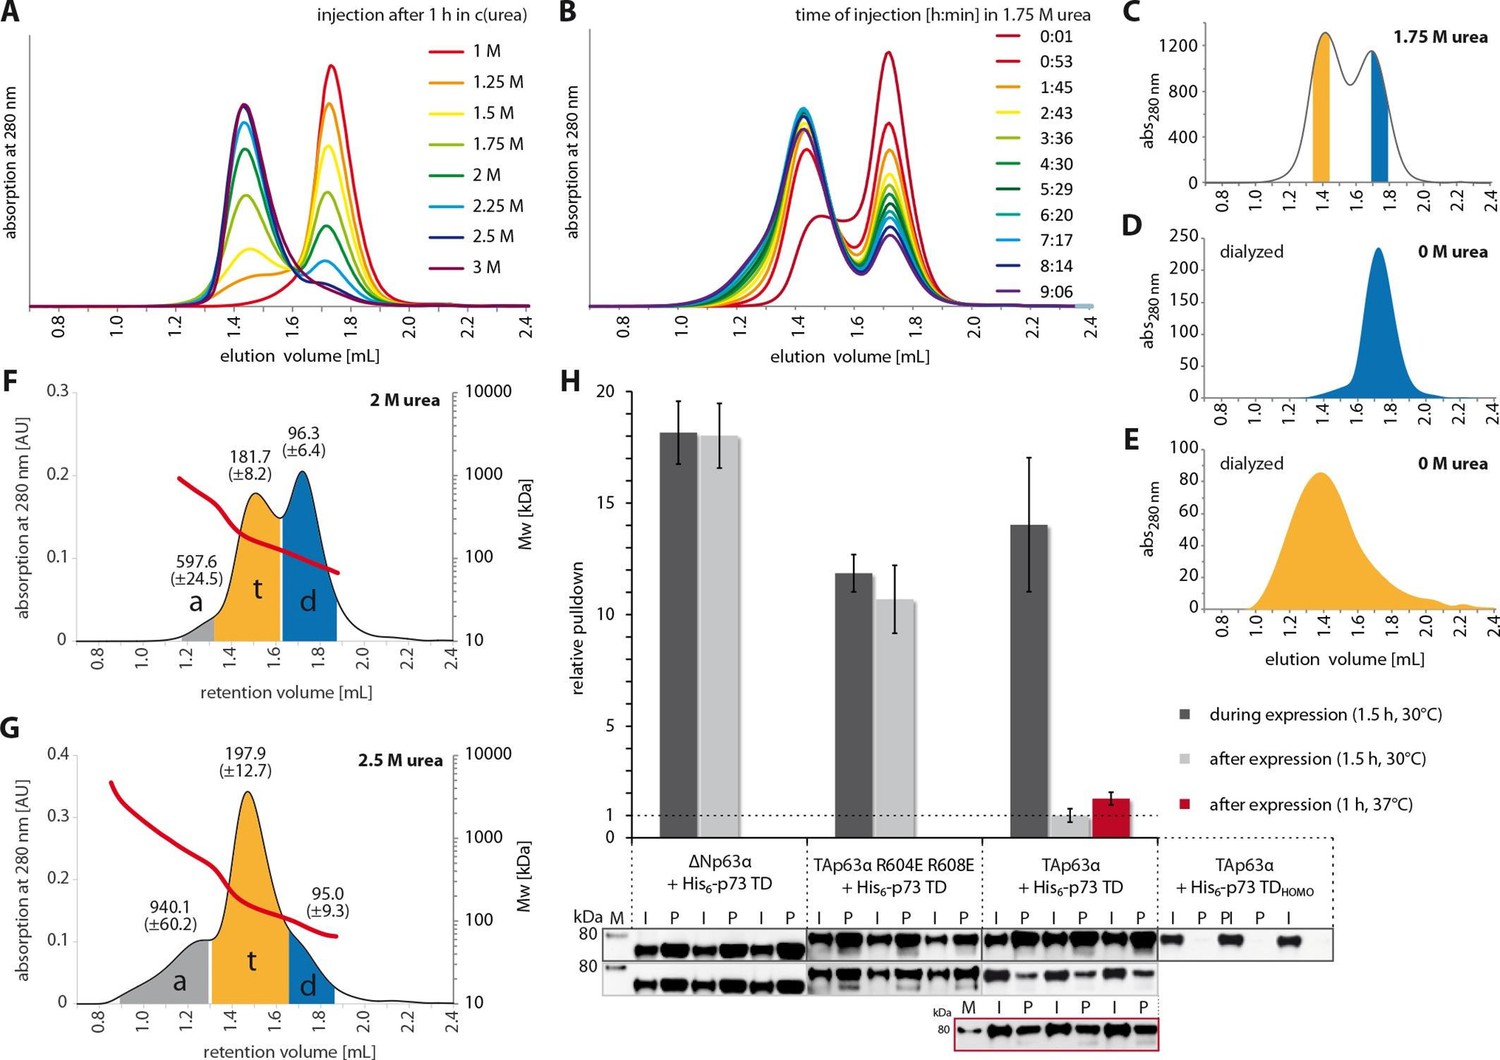
The closed dimeric conformation of TAp63α constitutes a kinetically trapped state.
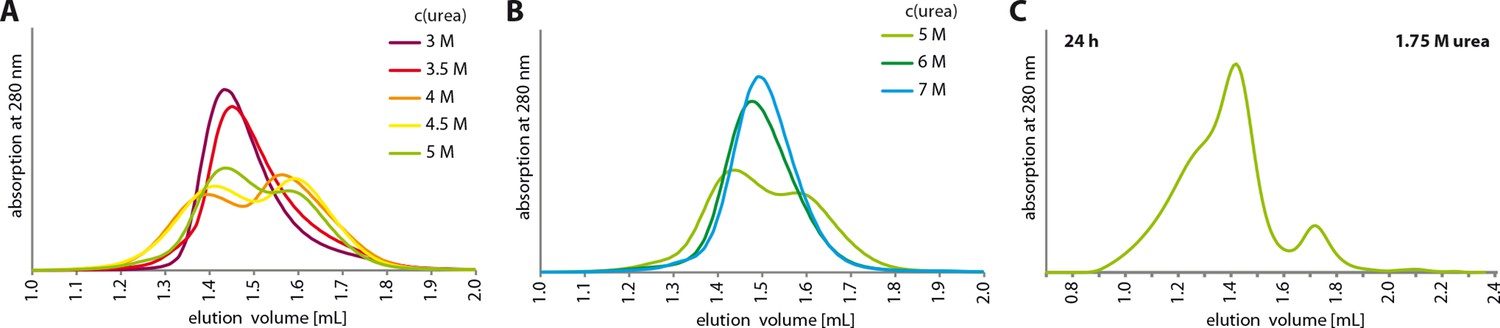
(A) TAp63αmin samples were incubated for 1 hr at different urea concentrations and subjected to size exclusion chromatography (SEC) at corresponding urea concentrations. (B) TAp63αmin samples were incubated in 1.75 M urea and injected into a Superose 6 3.2/300 column equilibrated with 1.75 M urea at different time points. (C) SEC profiles of TAp63αmin injected after incubation for 50 min in 1.75 M urea. Fractions of tetrameric and dimeric protein are highlighted in orange and blue, respectively. (D,E) SEC profiles of reinjected tetrameric (E) and dimeric (D) fractions (originating from SEC shown in C) after dialysis to 0 M urea for 13 hr. (F,G) SEC-MALS of TAp63αmin at different urea concentrations to proof the tetrameric nature of the early eluting peak in A. a, t and d denote aggregate, tetramer and dimer respectively. Colored areas where used to calculate the mean molecular weight and standard deviation. (F) SEC-MALS of TAp63αmin in 2 M urea (preincubated in 2 M urea for 14 min at RT). (G) SEC-MALS of TAp63αmin in 2.5 M urea (preincubated in 2.5 M urea for 25 min at RT). (H) WB and corresponding bar diagram of pull-down experiments with ΔNp63α, TAp63α R604E R608E and TAp63α incubated either during or after expression in RRL at 30°C for 1.5 hr with His6-tagged p73 TD or a mutant that is not able to form hetero-tetramers (His6-p73 TDHOMO). Pull-down is achieved by hetero-tetramerization of His6-tagged p73 TD with specified p63α constructs. Quotient of pull-down (P) and input (I) is shown relative to TAp63α incubated after expression with p73 TD (set to 1). Pulldowns were performed in technical triplicates and error bars denote standard deviation.
Figure 4—figure supplement 1
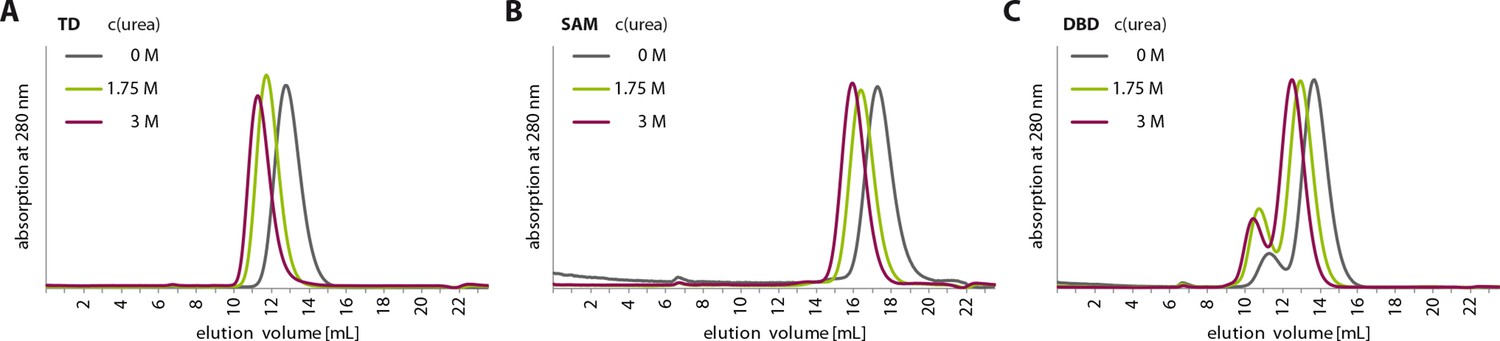
Urea treatment of p63 structured domains.
To prove that moderate concentrations of urea (up to 3 M) do not unfold domains inside TAp63αmin, individual domains were incubated for 1 hr at different urea concentrations and subjected to size exclusion chromatography (SEC) on a Superdex 75 3.2/300 column at corresponding urea concentrations. SEC profiles of TD (A), SAM (B) and DBD (C) at urea concentrations of 0 M, 1.75 M and 3 M urea.
Figure 4—figure supplement 2
Urea unfolding experiments with TAp63αmin.
(A,B) TAp63αmin samples were incubated for 1 hr at different urea concentrations and subjected to size exclusion chromatography (SEC) on a Superose 6 3.2/300 column at corresponding urea concentrations. As in Figure 4A but at higher urea concentrations. At a urea concentration of 4 M urea the tetramers seem to unfold as seen in the partial shift to higher elution volumes. (C) TAp63αmin was incubated in 1.75 M urea for 24 hr and injected onto a Superose 6 3.2/300 column equilibrated in 1.75 M urea.
Figure 5
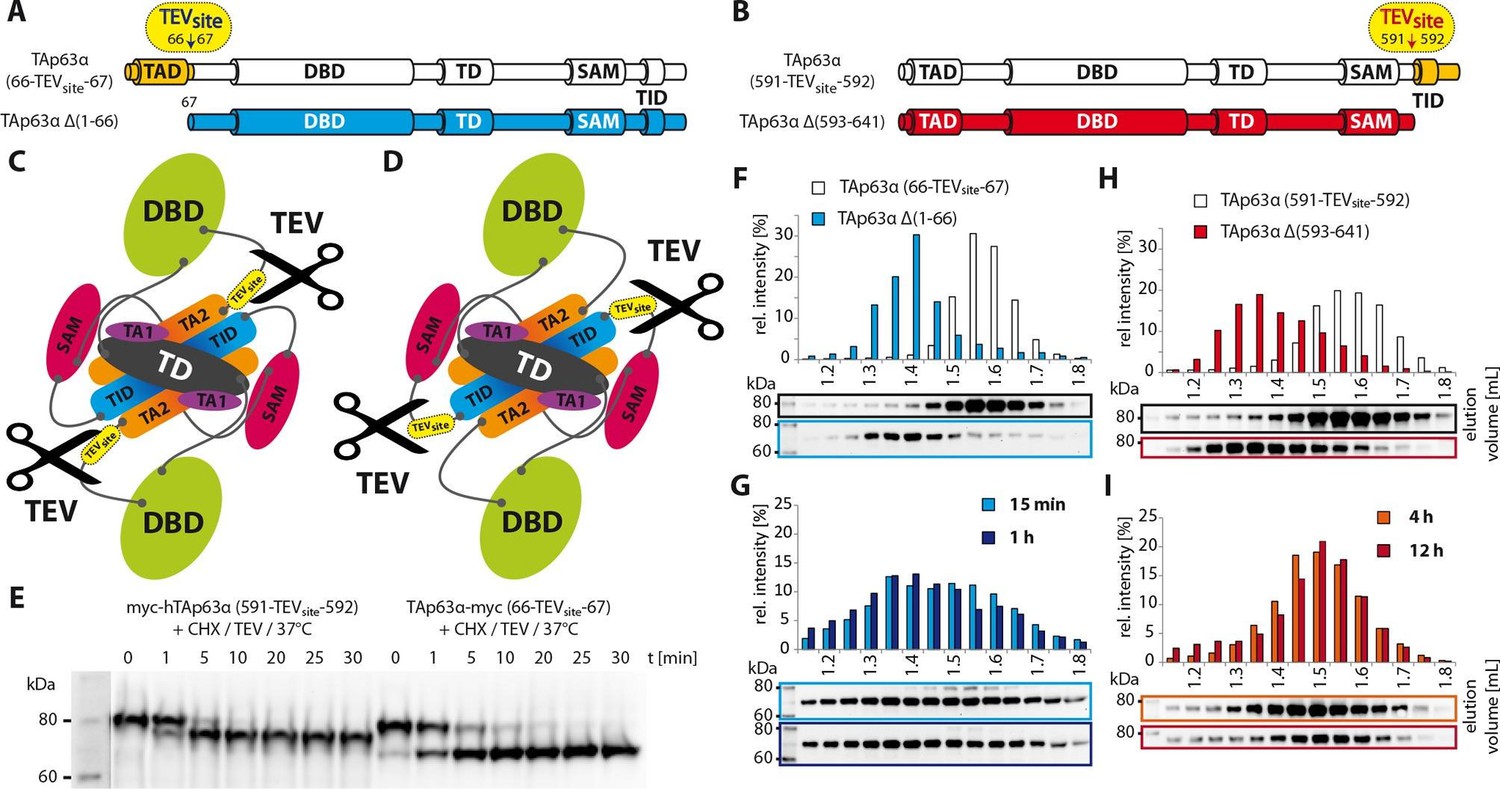
Unlike TID, secession of TAD induces the transformation of dimeric TAp63α to tetramers.
(A) A cleavage site is introduced C-terminal to the TAD (between residues 66 and 67) allowing its secession by TEV protease cleavage. For comparison a TAp63α construct is created that lacks the TAD (TAp63α Δ(1–66)) and resembles the cleavage product. (B) A cleavage site is introduced N-terminal to the TID (between residues 591 and 592) allowing its secession by TEV protease cleavage. For comparison a TAp63α construct is created that lacks the TID (TAp63α Δ(593–641)) and resembles the cleavage product. (C) Schematic depiction of TAp63α (66-TEVsite-67) and secession of TAD by TEV protease cleavage. (D) Schematic depiction of TAp63α (591-TEVsite-592) and secession of TID by TEV protease cleavage. (E) Secession of TAD and TID from TAp63α derivatives using TEV protease. Cycloheximide (CHX) and TEV protease were added to the RRL expressed TAp63α derivative at 37°C and samples were taken after indicated time points and analyzed by western blotting. Both constructs are cleaved nearly completely within approximately 10 min. (F,G,H,I) TAp63α constructs were expressed in reticulocyte lysate (RRL), treated with CHX and optionally with TEV protease (G,I) at 37°C for denoted time, cooled to 4°C and subjected to SEC. SEC profiles were obtained by WB. (F) SEC profiles of TAp63α (66-TEVsite-67) and of TAp63α Δ(1–66). (G) SEC profiles of TAp63α (66-TEVsite-67) after treatment with CHX and TEV protease for either 15 min or 1 hr at 37°C. (H) SEC profiles of TAp63α (591-TEVsite-592) and of TAp63α Δ(593–641). (I) SEC profiles of TAp63α (591-TEVsite-592) after treatment with CHX and TEV protease for either 4 or 12 hr at 37°C.
Figure 6 with 1 supplement
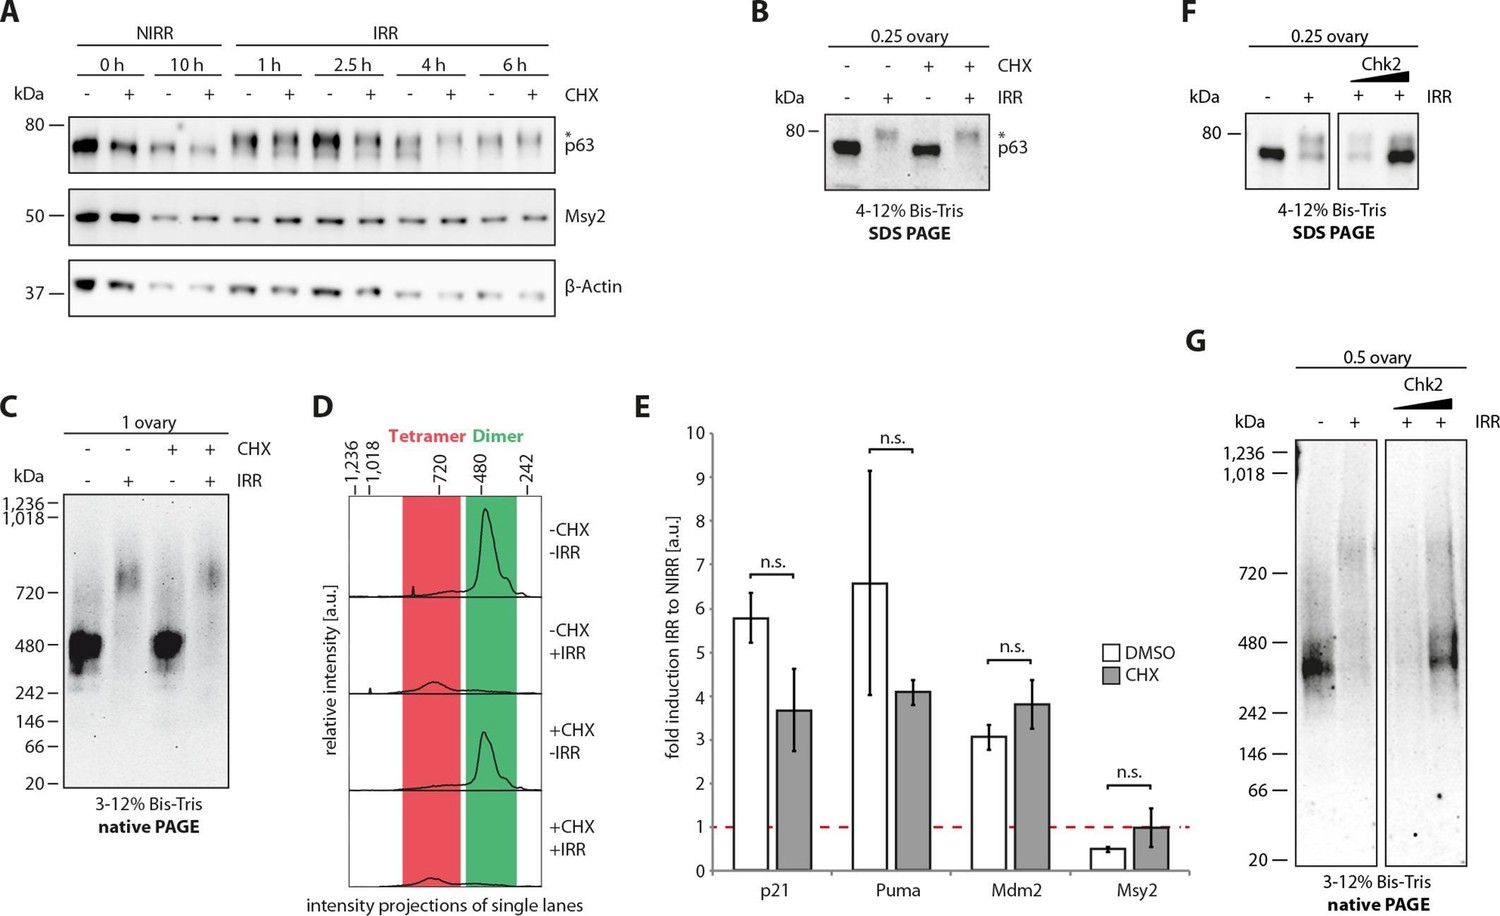
The cellular machinery for TAp63α activation in murine oocytes is always present and ready to act upon genotoxic insults.
(A) WB of CHX treatment of nonirradiated (NIRR) and γ-irradiated (IRR) murine ovary samples. The signals of p63, the oocyte marker Msy2 and β-actin are displayed for each time point after NIRR/IRR. The asterisk marks phosphorylated p63. (B) WB of SDS-PAGE loaded with the ovary samples of the Native PAGE in (C). The asterisk marks phosphorylated p63. (C) WB of Native PAGE from (un-)treated and either NIRR or IRR murine ovaries. The p63 signal in the range from 20 kDa to 1,236 kDa is shown. (D) Intensity projection of the Native PAGE p63 signal from (C). The molecular weight range of the p63 dimer and tetramer is colored in green and red, respectively. (E) Quantitative Real-Time PCR of isolated murine oocytes. The bar diagram shows the fold induction of p21, Puma, Mdm2 and Msy2 mRNA after γ-irradiation. Error bars show the standard deviation of the biological duplicates. Brackets above the bars display the p-test results showing no significance (n.s.) between untreated and CHX treated oocytes for all targets. (F) Inhibition of Chk2 suppresses the DNA-damage induced phosphorylation of TAp63α in γ-irradiated ovaries. Chk2 inhibitor II at concentrations of 5 and 25 µM was added 2 hr before irradiation with 1.5 Gy. Ovaries were harvested 4 hr after irradiation and analyzed by SDS PAGE and Western Blot. Activated TAp63α gets degraded fast while preventing activation via inhibition of Chk2 preserves the original cellular concentration. (G) Native PAGE analysis of the same samples used as in (F). Inhibition of Chk2 prevents tetramerization and keeps TAp63α in a closed and dimeric state.
Figure 6—figure supplement 1

p63 is responsible for inducing apoptosis in oocytes.
(A) Verification of CHX activity in ovary culture. WB of CHX and MG132 treatment of mouse ovaries. After overnight culture with either DMSO or CHX, ovaries were incubated with DMSO, CHX, MG132 or a combination of the latter two for additional 8 hr. The signal of ubiquitin (mono- and poly-ubiquitin bands) and β-actin as a loading control are displayed. (B) Immunohistochemistry staining of P8 mouse ovaries either non-irradiated (NIRR) or 8h after γ-irradiation (IRR) for Msy, p53, p63 or p73. Stainings for Msy and p63 were developed with a 30 s exposure time and then stopped due to high signal intensity. Stainings for p53 and p73 were exposed for 5 min. The red arrows indicate primordial follicles, which express high amount of TAp63α and are responsive to a low dosage of γ-irradiation. Scale bar: 50 µm.
Figure 7
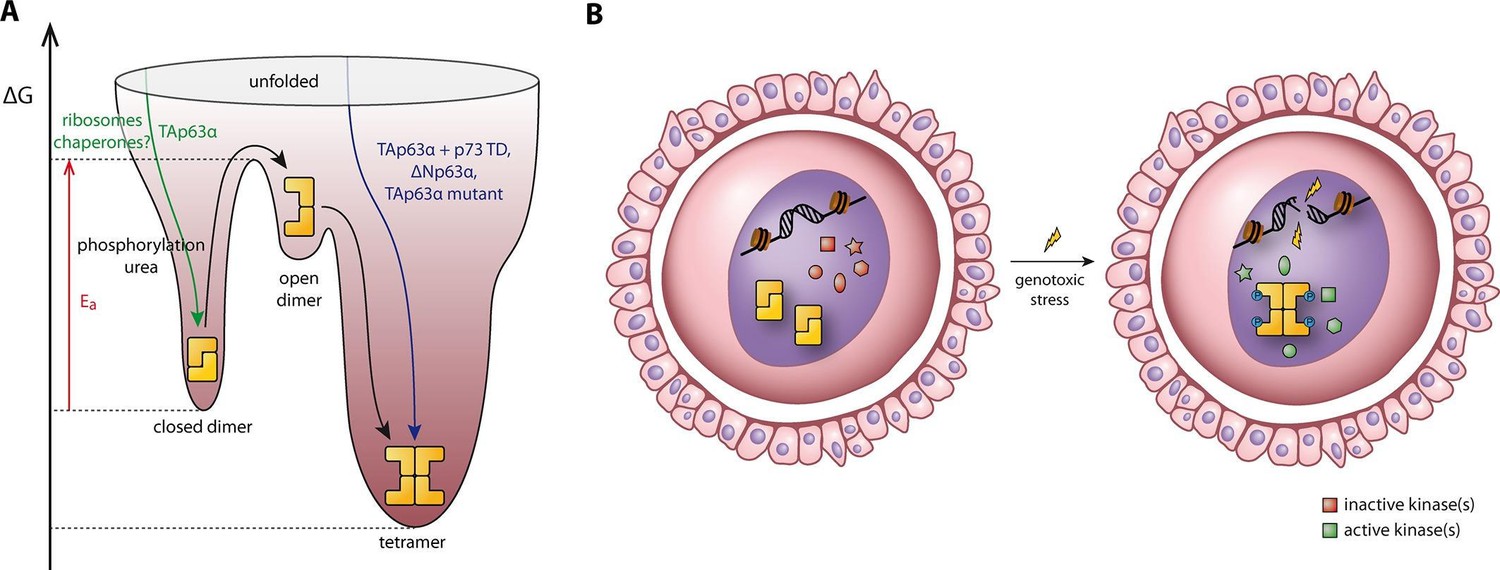
Spring-loaded activation mechanism of TAp63α on the molecular and cellular level.
(A) Schematic energy landscape of TAp63α. The kinetically trapped closed dimer is opened by phosphorylation or artificially by moderate concentrations of urea (Figure 4). The resulting open dimer is less stable and forms tetramers with a dissociation constant of 12 ± 1 nM (Brandt et al., 2009). (B) Schematic representation of TAp63α activation. Oocytes express high levels of dimeric TAp63α and harbor normally inactive kinases ready to be activated and to phosphorylate TAp63α upon genotoxic stress leading to active tetramers and, consequently, cell death.
Author response image 1

Caspase assay.
H1299 (A), SUM159 (B) and SAOS2 (C) cells were transfected with TAp63α mutants. Caspase-3 Antibody (Cell Signaling #9662) and PARP Antibody (Cell Signaling #9542) were used in A and B to detect full-length proteins and cleaved fragments (large fragment of caspase-3 (17 kDa) and large fragment of PARP (89 kDa)). Cleaved Caspase-3 Antibody (Cell Signaling #9662) was used in C to detect cleaved Caspase-3. No signal of any cleaved fragment was detected in dependency of TAp63α mutant transfection. Only inactive TAp63α (either wildtype or mutants bearing mutation F16A W20A L23A or R304Q (DNA-binding deficient)) reached high expression levels in the cells.
Additional files
-
Supplementary file 1
Mutagenesis screen of residues on the surface of the DBD.
Constructs were expressed in rabbit reticulocyte lysate and subjected to size exclusion chromatography on a Superose 6 3.2/300. All constructs formed dimers indicating that none of these residues are involved in essential contacts inside dimeric TAp63α.
- https://doi.org/10.7554/eLife.13909.024
Download links
A two-part list of links to download the article, or parts of the article, in various formats.
Downloads (link to download the article as PDF)
Open citations (links to open the citations from this article in various online reference manager services)
Cite this article (links to download the citations from this article in formats compatible with various reference manager tools)
Quality control in oocytes by p63 is based on a spring-loaded activation mechanism on the molecular and cellular level
eLife 5:e13909.
https://doi.org/10.7554/eLife.13909


