A novel role for the root cap in phosphate uptake and homeostasis
- University of Tokyo, Japan
- Commissariat à l'Energie atomique et aux énergies alternatives, France
- Centre National de Recherche Scientifique, France
- Aix-Marseille Université, France
- Laboratoire des Interactions Plantes Micro-organismes, France
Figures
Figure 1 with 3 supplements

Active Pi transporters are localized in the root cap.
(A) Reporter lines expressing transcriptional and translational fusions for the high affinity transporters expressed in the root (PHT1;1 and PHT1;4) are localized in the root cap, in addition to PHF1, a major post-translational regulator required for PHT1 targeting to the plasma membrane. Scale bars: 50 μm. (B) Accumulation of 33P in the root tip of Arabidopsis plantlets. Whole roots were immersed in 33P-enriched solution for 1 day. (C) Pi accumulation in the root tip is abolished by targeted ablation with 5FC in the Q0171>>FCY-UPP line. The short pulse of 33Pi applied to the WT and Q0171>>FCY-UPP lines was revealed by a live radioisotope microimaging system. Light transmission and 33P images are merged. 33P content is represented as color intensity. Scale bar: 100 μm.
Figure 1—figure supplement 1
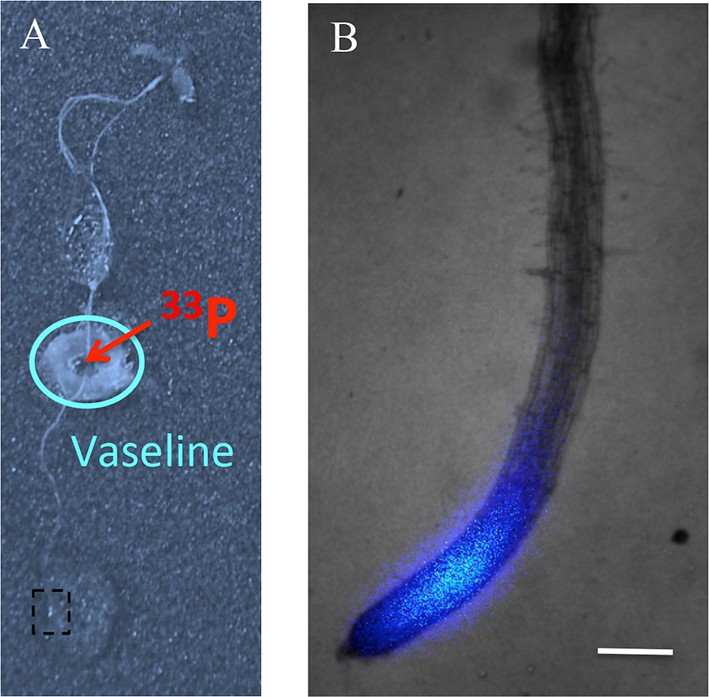
Assay for Pi translocation to the root tip.
(A) 33P (200 kBq) was initially applied to the middle of the root in a zone isolated from the medium by Vaseline. (B) The presence of 33P in the root tip is observed 30 min later by the live radioisotope microimaging system. Presented image is a magnified view of the box in (A). Scale bar: 200 μm.
Figure 1—figure supplement 2
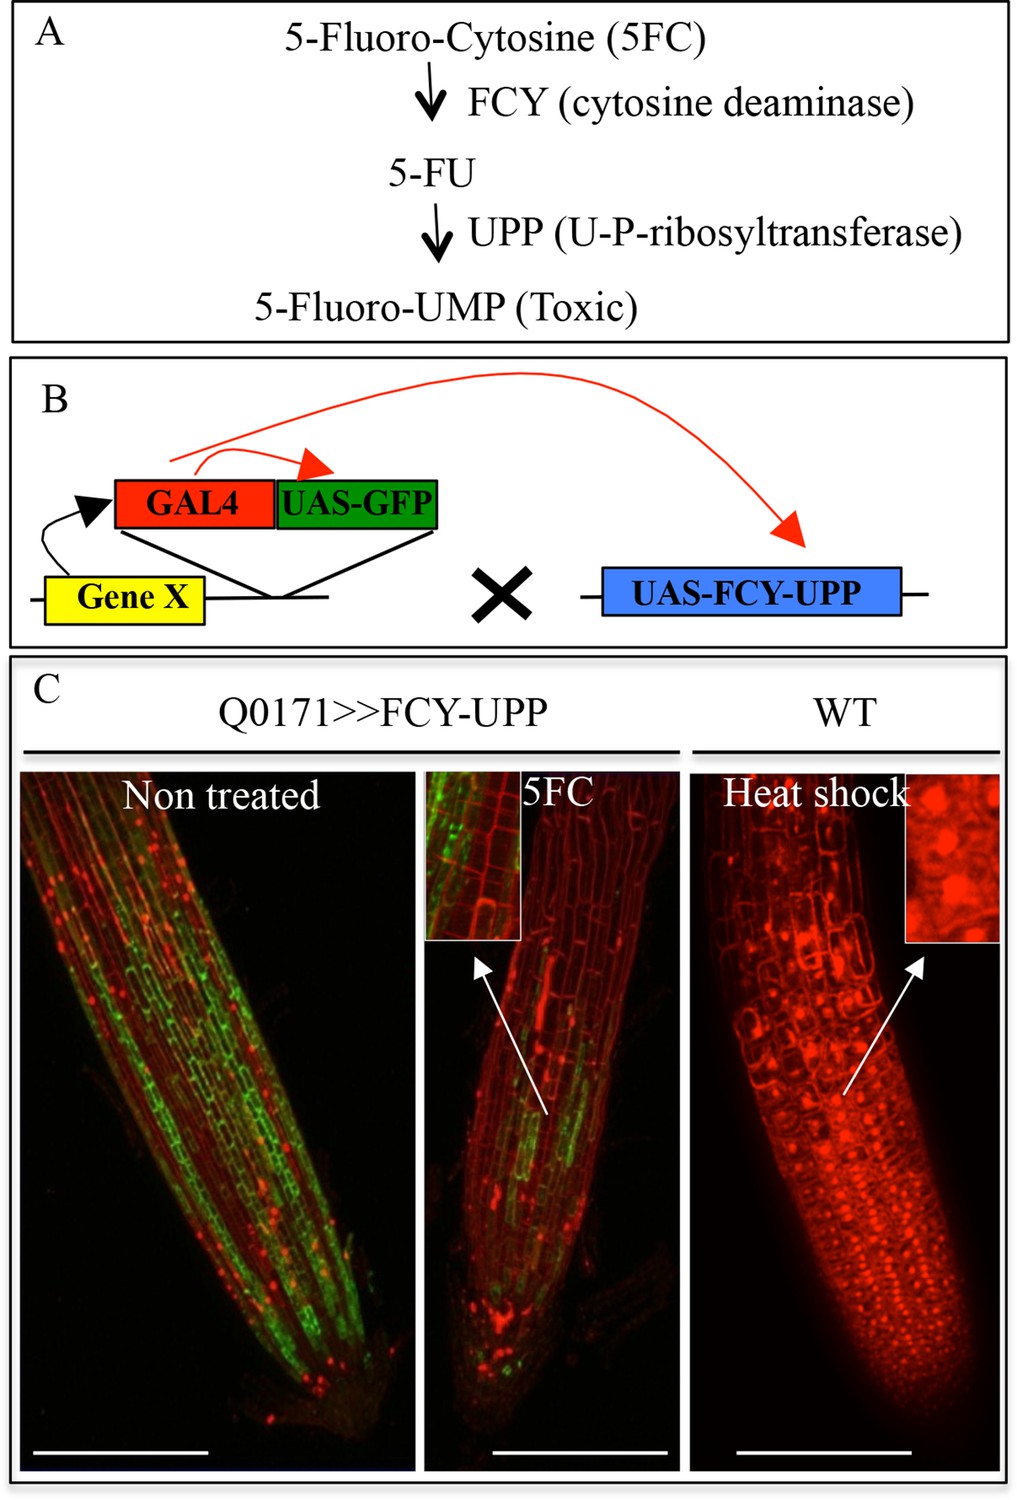
Conditional negative marker expression in the root cap.
(A) Enzymatic transformation of 5-Fluorocytosine (5-FC) into toxic 5-Fluoro-UMP by FCY and UPP enzymes. (B) Transactivation system used to express a conditional negative marker in the root cap. The Q0171 transgenic line contains a GAL4 activator gene (in T-DNA) driven by a minimal promoter (enhancer trap), which is transactivated in the root cap by a cell layer-specific gene X (black arrow). After crossing with a line containing the conditional ablation marker FCY-UPP driven by UAS, GAL4 binds to the UAS sequence, activating transcription of the GFP reporter gene as well as FCY-UPP (red arrows). (C) Effect of 5FC (3.8 mM) on GFP expression in the transgenic Q0171>>FCY-UPP line. The line contains a transactivating GFP marker (green) and an FCY-UPP fusion in the root cap. 5FC treatment abolishes expression of genes in the root cap (as visualized by a strong reduction in GFP signal) while keeping cells alive (as visualized by the absence of PI staining in the nuclei). The heat shock treatment control promotes cell death (visualized as PI nuclear staining). Images are focused on the surface of the lateral root cap. Magnifications of the images are shown in the inserts. Red: PI, green: GFP. Scale bars: 100 μm.
Figure 1—figure supplement 3
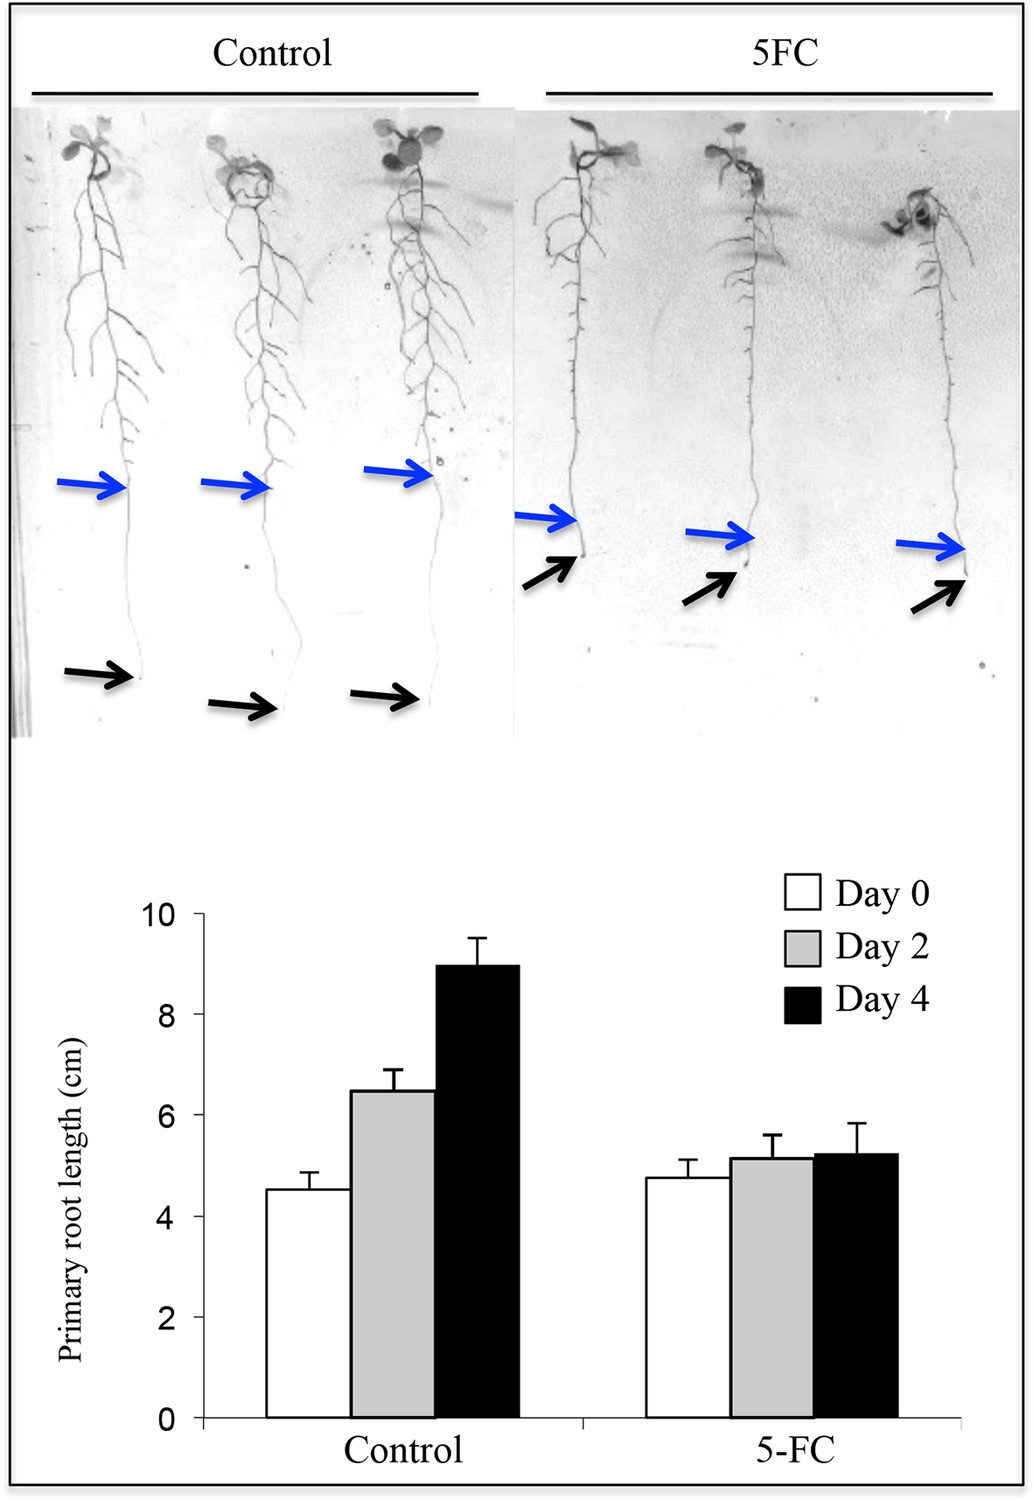
Effect of 5FC (3.8 mM) on primary root growth in the Q0171>>FCY-UPP line.
Plantlet phenotypes are shown after the 4-day transfer to 5FC or DMSO (control). Arrows indicate the tips of primary roots at the beginning (blue) and end (black) of the respective treatment. Primary root growth is shown at the beginning (Day 0) and after 2 and 4 days of treatment. DMSO, a solvent of 5FC, was used as the control treatment. Values are means ± SD of 15 plantlets.
Figure 2 with 1 supplement
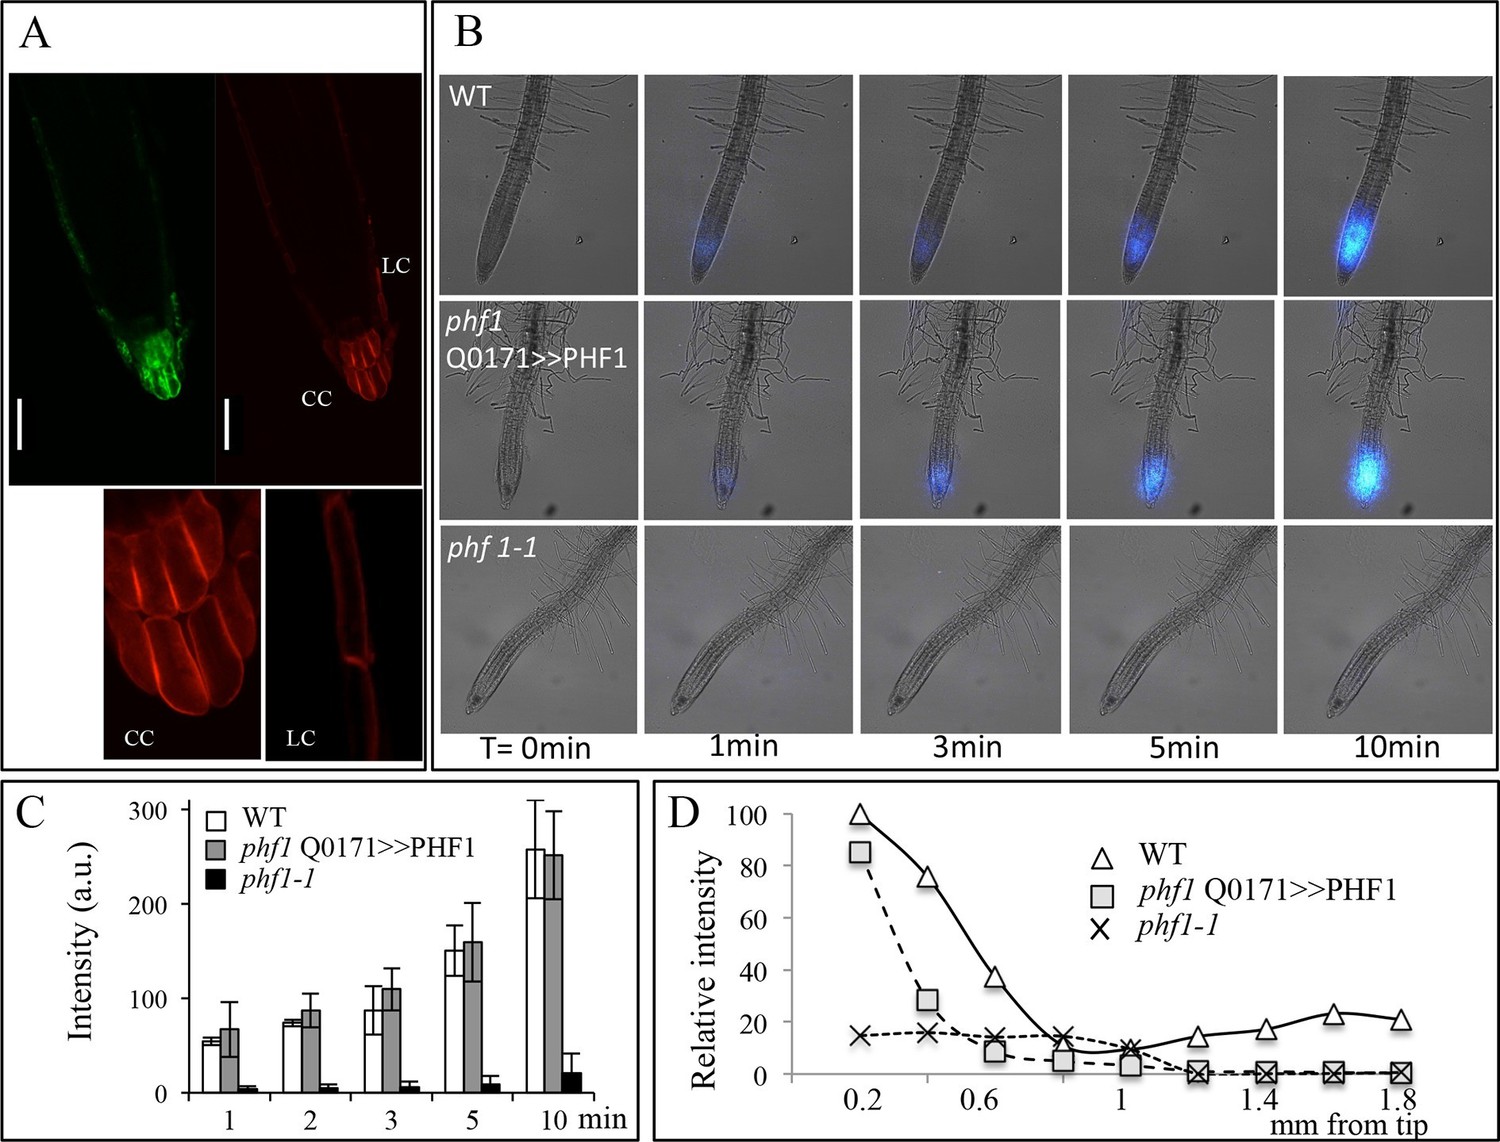
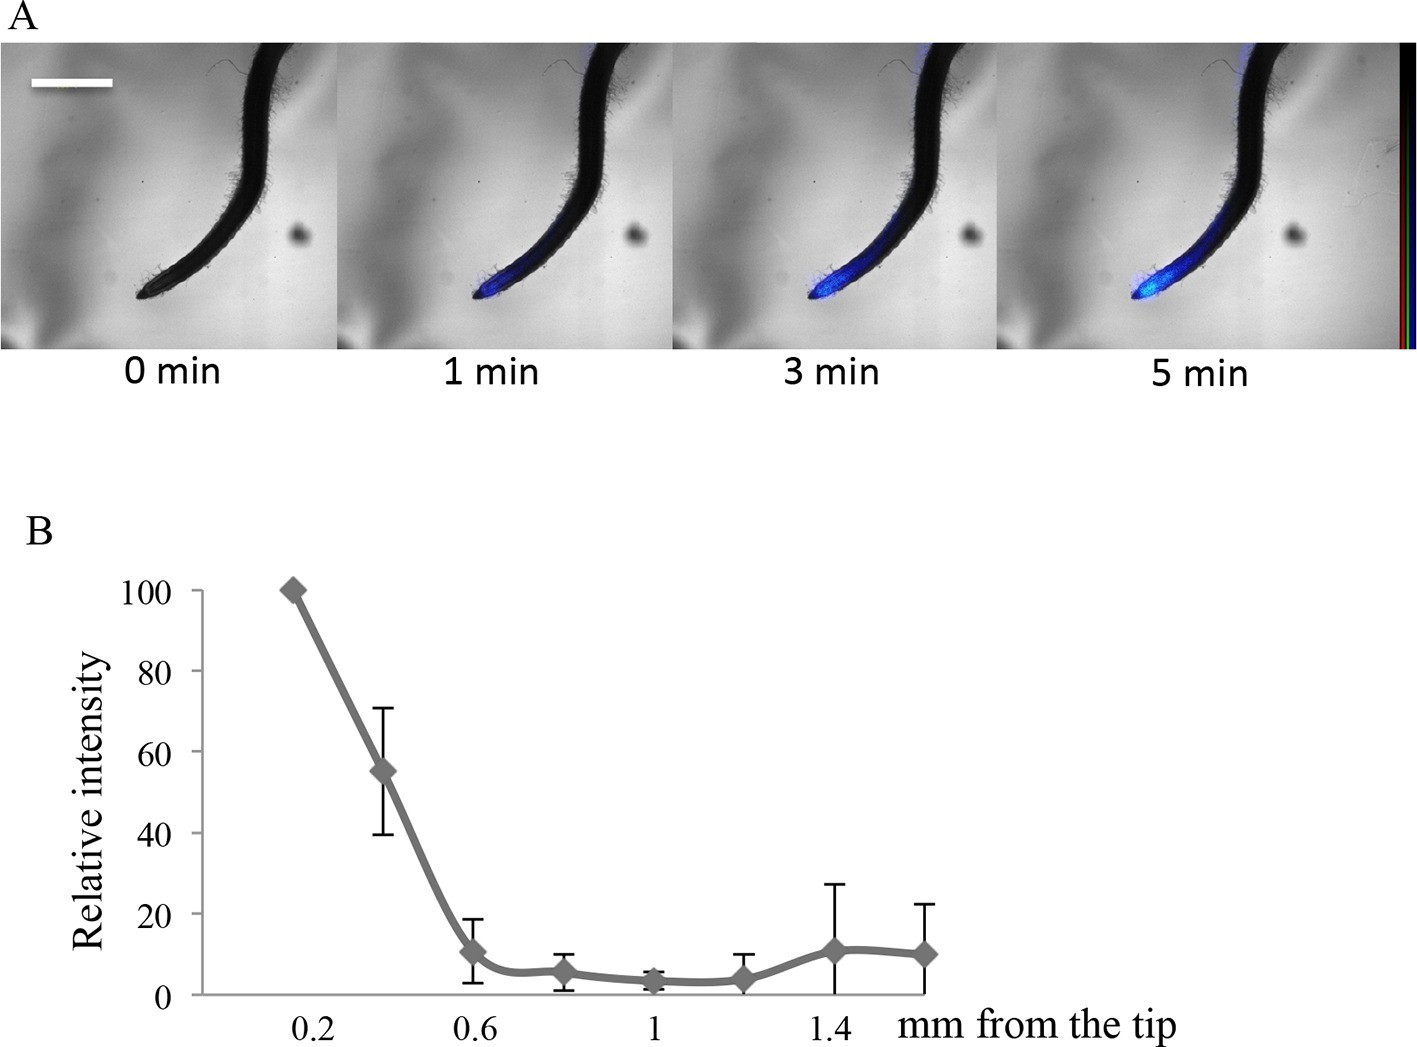
Root cap complementation of the phf1-1 mutant in the phf1 QO171>>PHF1 line.
(A) Accumulation of PHT1;4 in the plasma membrane (red; 35S:PHT1;4-mCherry) correlates with PHF1 complementation in cells expressing GFP. Scale bars: 50 μm. Lower panels display magnified views of the mCherry image in the columella (CC) and lateral root cap (LC) cells. (B) Visualization of 33P absorption (blue) by real-time imaging. The image displays a time course during a 10 min period. (C) Quantification of radioactivity (200 kBq application) in the root apex (0.2 mm from the tip). Values are means ± SD. 3 root tips were analyzed. (D) Quantification of 33P along the root after 1 min. Measurements were taken from the tip to a distance of 1.8 mm at 0.2 mm intervals. A representative graph is shown. The experiment was performed eight times giving the same trend.
Figure 2—figure supplement 1
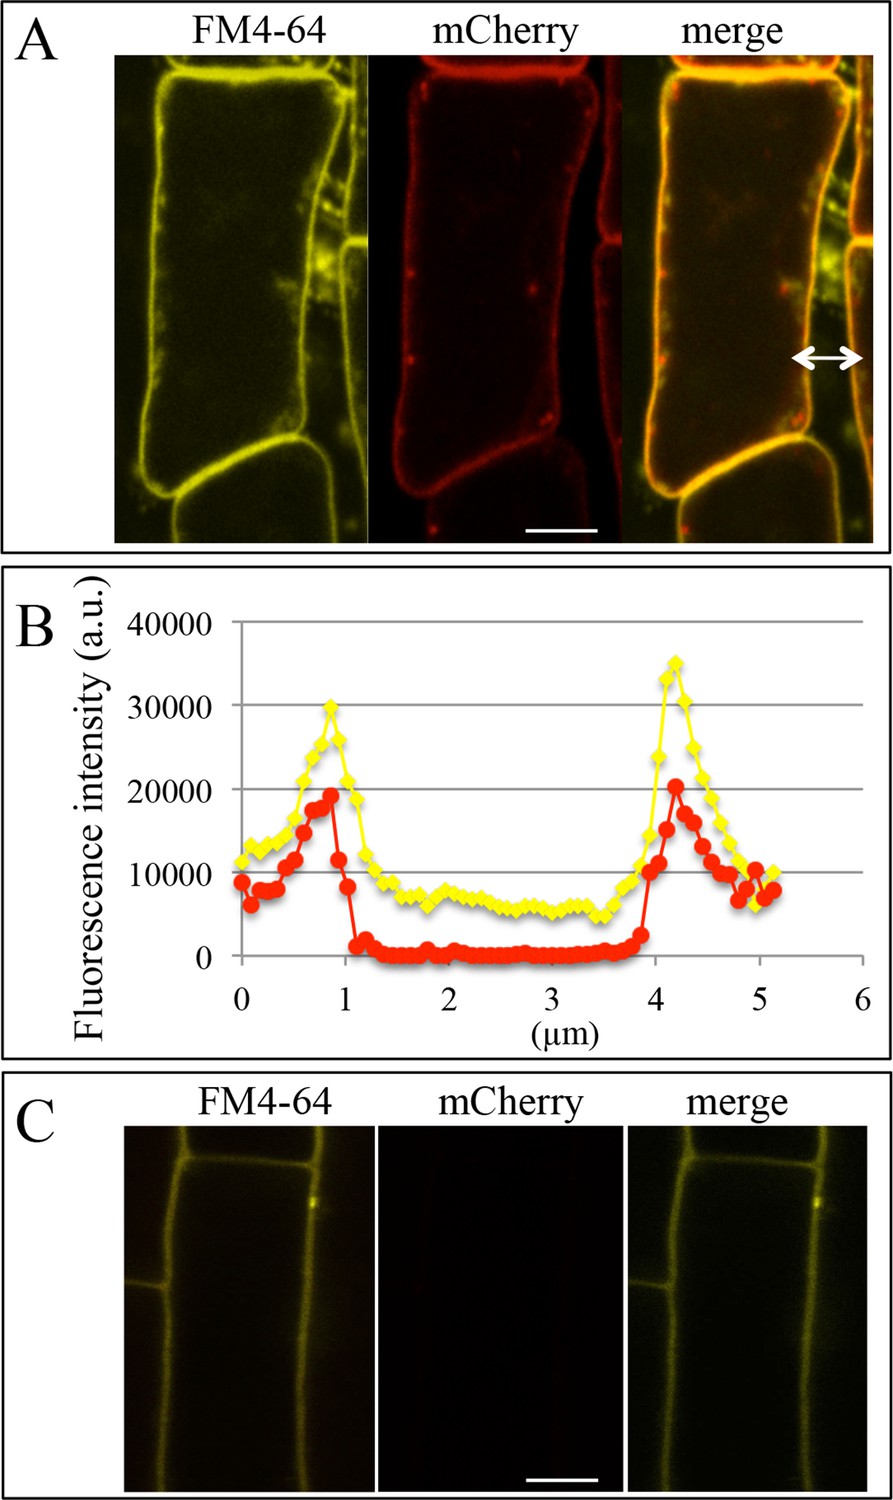
Colocalization of the plasma membrane marker FM4-64 and PHT1;4-mCherry in the phf1 Q0171>>PHF1 line.
(A) Images of lateral root cap cells. For arrow, see (B). (B) Intensity profile of FM4-64 and mCherry fluorescence signals along the white arrow indicated in (A). (C) Images of a root epidermis cell. Yellow: FM4-64, red: mCherry. Scale bar: 5 µm.
Figure 3 with 3 supplements
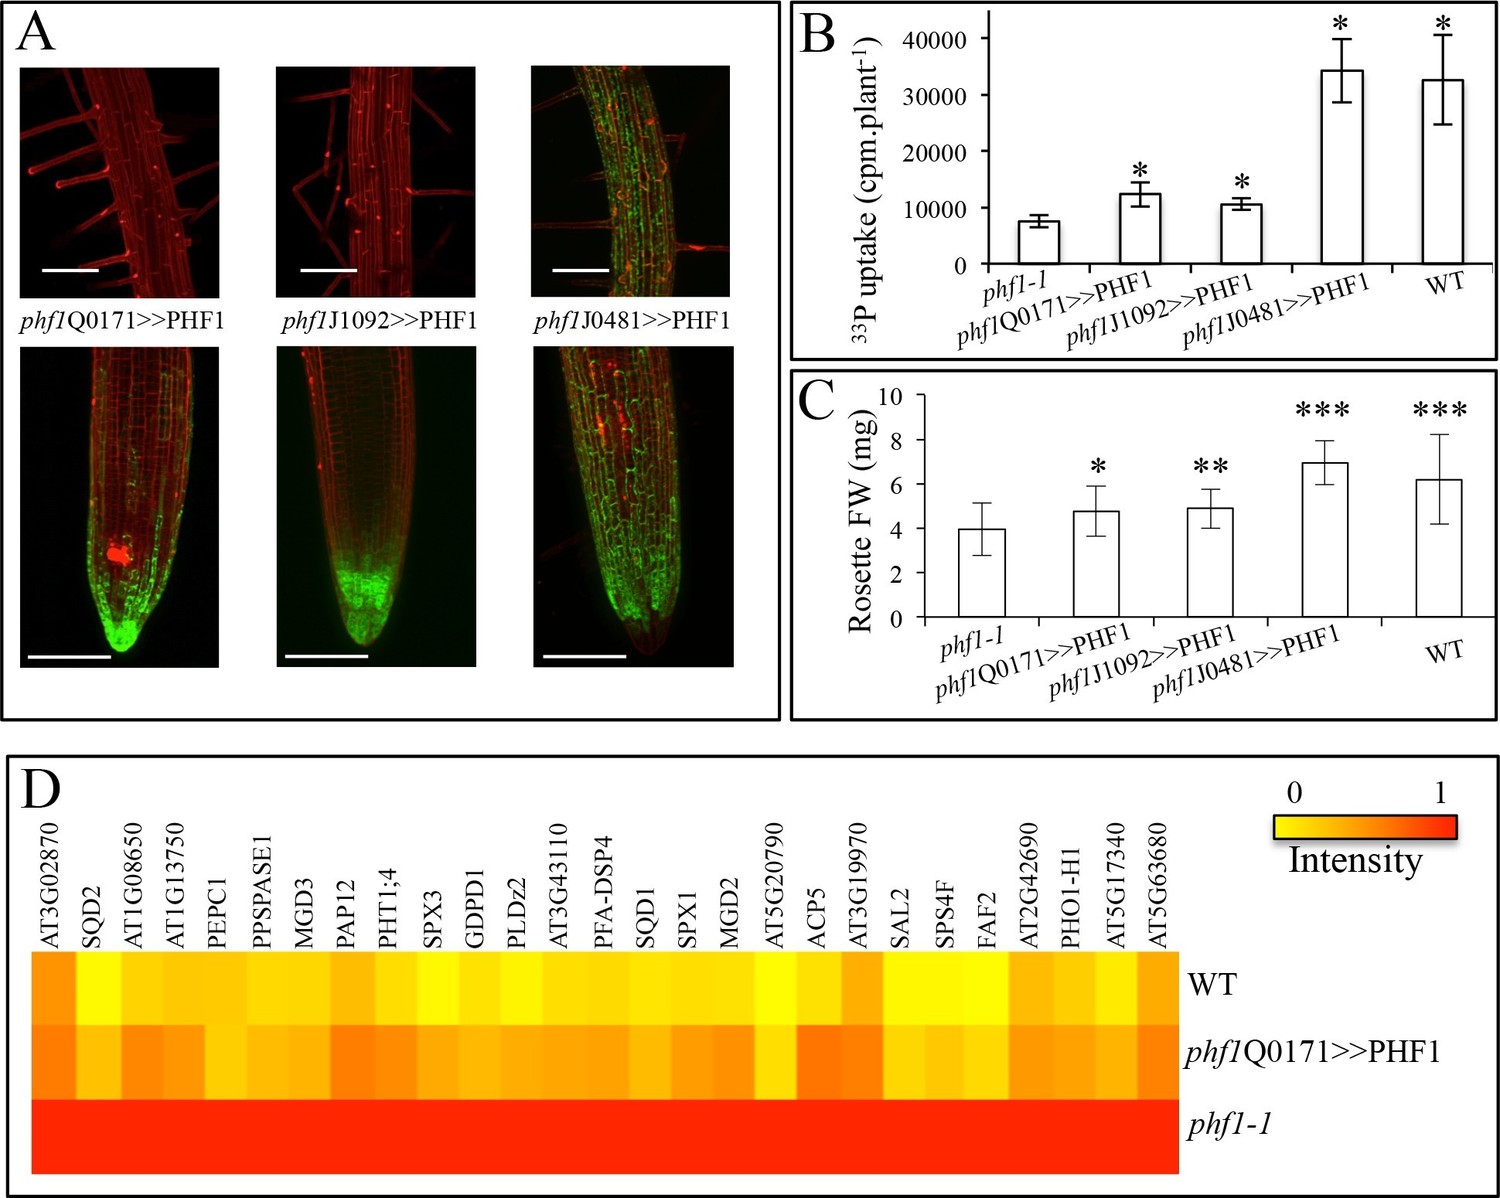
Effect of tissue-specific PHF1 complementation on plant physiology.
(A) GFP expression pattern (green) labels root tissues (root tip and mature zone) where PHF1 complementation occurs in three different transgenic lines. Scale bars: 100 μm. (B) Quantification of Pi uptake after transfer of plantlets to +P medium for 3 d in the presence of 33Pi. Values are means ± SD. 10 plantlets were analyzed individually. Significantly different from phf1-1: P<0.0001 (Student’s t-test). (C) Rosette biomass. Plants were grown in -P and transferred to +P medium for 4 d. Values are means ± SD of 23 to 24 individually weighed rosettes. Significantly different from phf1-1: *P=0.008; **P=0.004; ***P<0.001 (Student’s t-test). (D) Expression level of Pi starvation markers after a 3-day transfer to +P medium relative to low Pi. Results are normalized to phf1-1 values according to Figure 3—figure supplement 3.
-
Figure 3—source data 1
(B) Effect of tissue-specific PHF1 complementation on plant physiology. Quantification of Pi uptake after transfer of plantlets to +P medium for 3 d in the presence of 33Pi. (C) >Effect of tissue-specific PHF1 complementation on plant physiology. Rosette biomass.
- https://doi.org/10.7554/eLife.14577.010
Figure 3—figure supplement 1
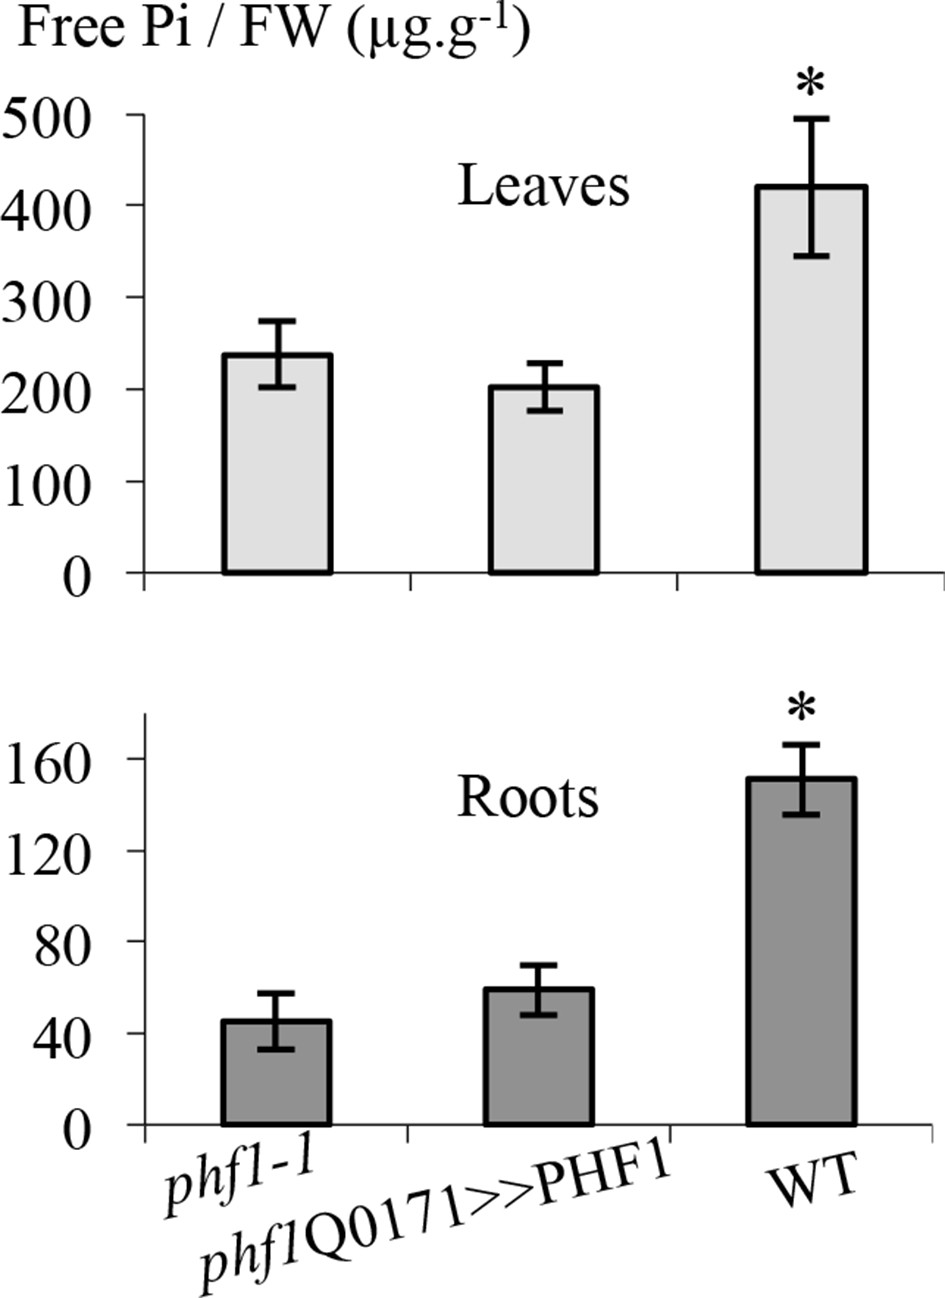
Effect of PHF1 complementation on free Pi content.
Quantification of free phosphate present in roots and leaves. Values are means ± SD of three independent experiments. Pools of 10 to 20 plant tissues were analyzed. Significantly different from phf1-1 line: *P=0.008 (Leaves), P=0.0009 (Roots) (Student’s t-test).
-
Figure 3—figure supplement 1—source data 1
Effect of PHF1 complementation on free Pi content.
Quantification of free phosphate present in roots and leaves.
- https://doi.org/10.7554/eLife.14577.012
Figure 3—figure supplement 2
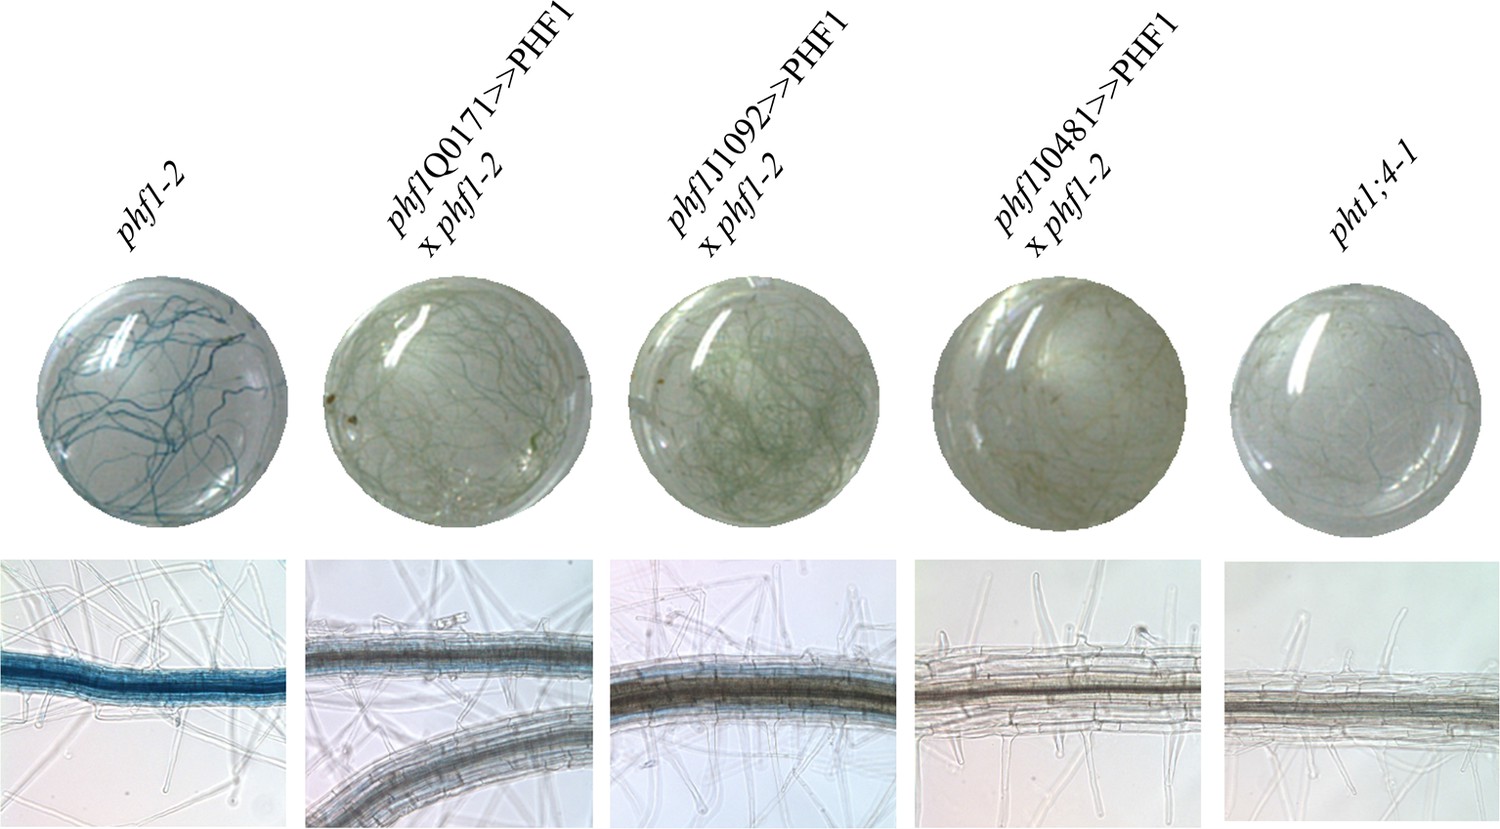
Effect of the PHF1 complementation on the expression of the Pi-starvation marker PHT1;4 as revealed by fusion of the GUS reporter gene to the PHT1;4 promoter.
Plants were grown in Pi-rich medium.
Figure 3—figure supplement 3
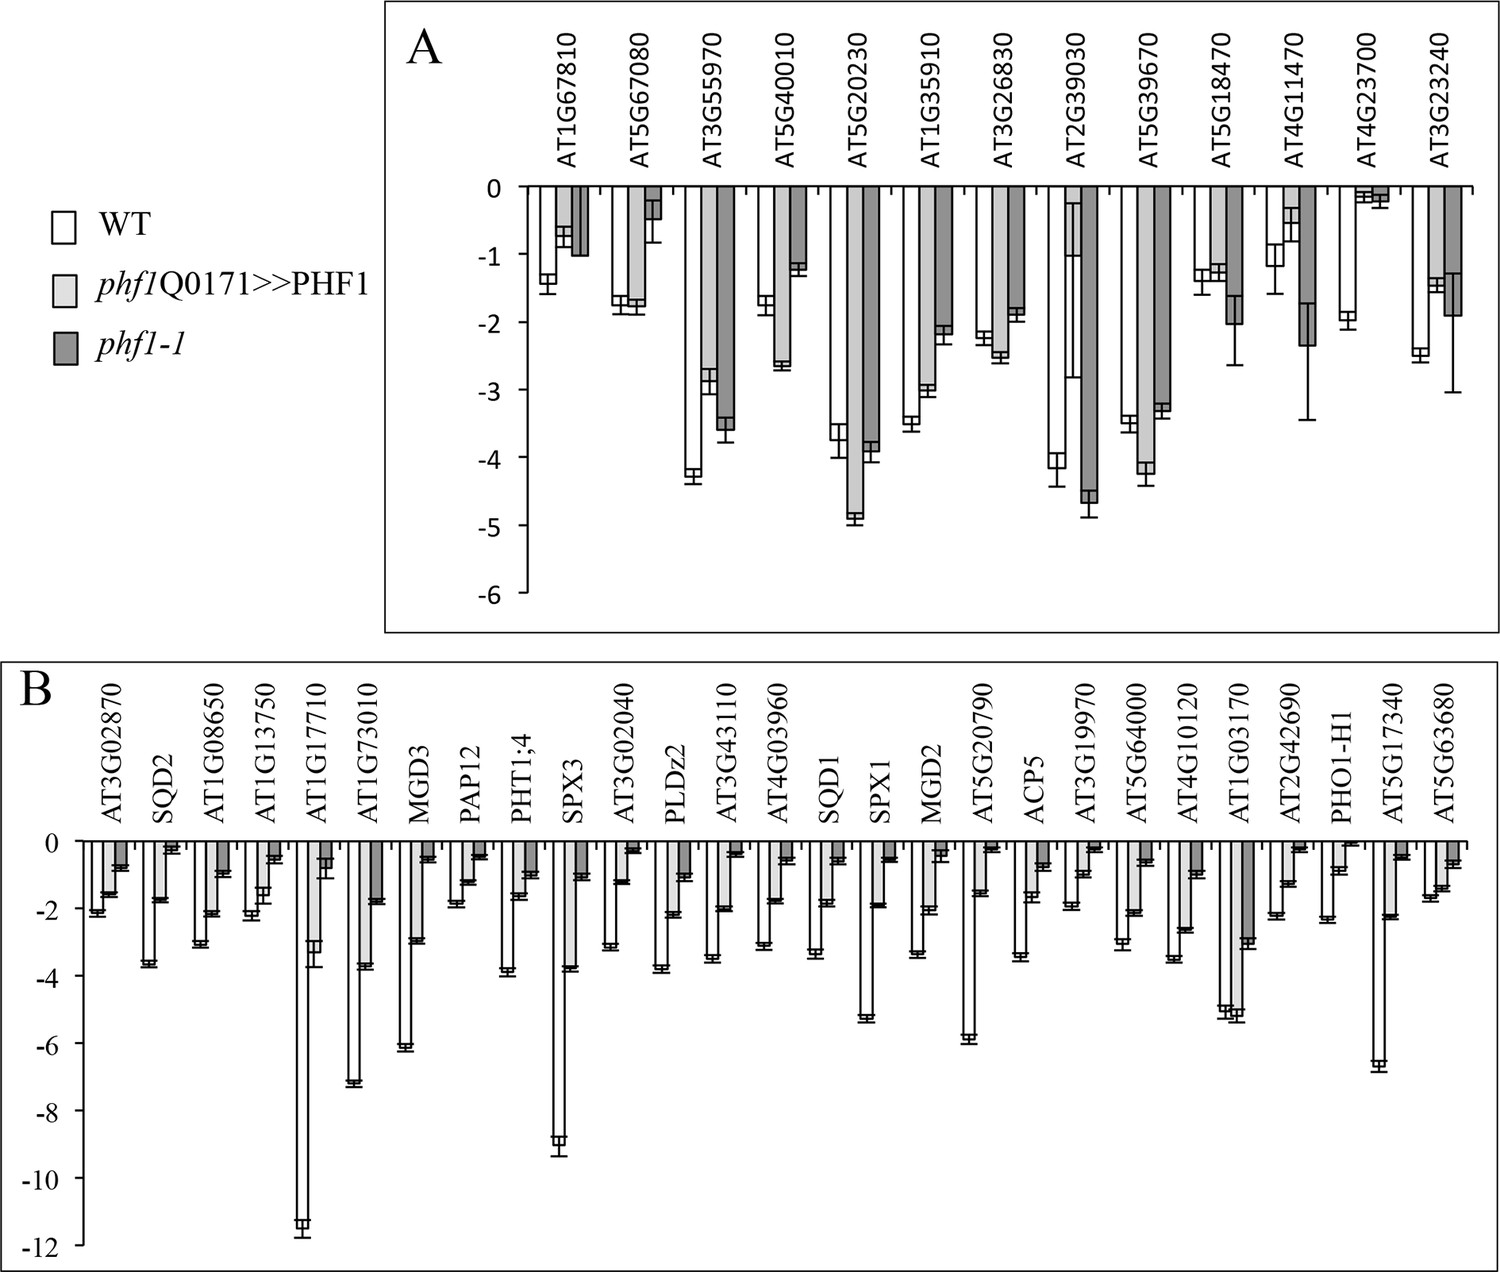
Effect of PHF1 complementation on gene expression.
Expression levels (log2) in phf1 Q0171>>PHF1, phf1-1 and WT lines after 3 days in +P relative to -P for locally (A) or systemically (B) regulated genes. Values are means ± SD of 3 technical replicates.
-
Figure 3—figure supplement 3—source data 1
(A) Effect of PHF1 complementation on locally-regulated gene expression. (B) Effect of PHF1 complementation on systemically-regulated gene expression.
- https://doi.org/10.7554/eLife.14577.015
Figure 4 with 1 supplement
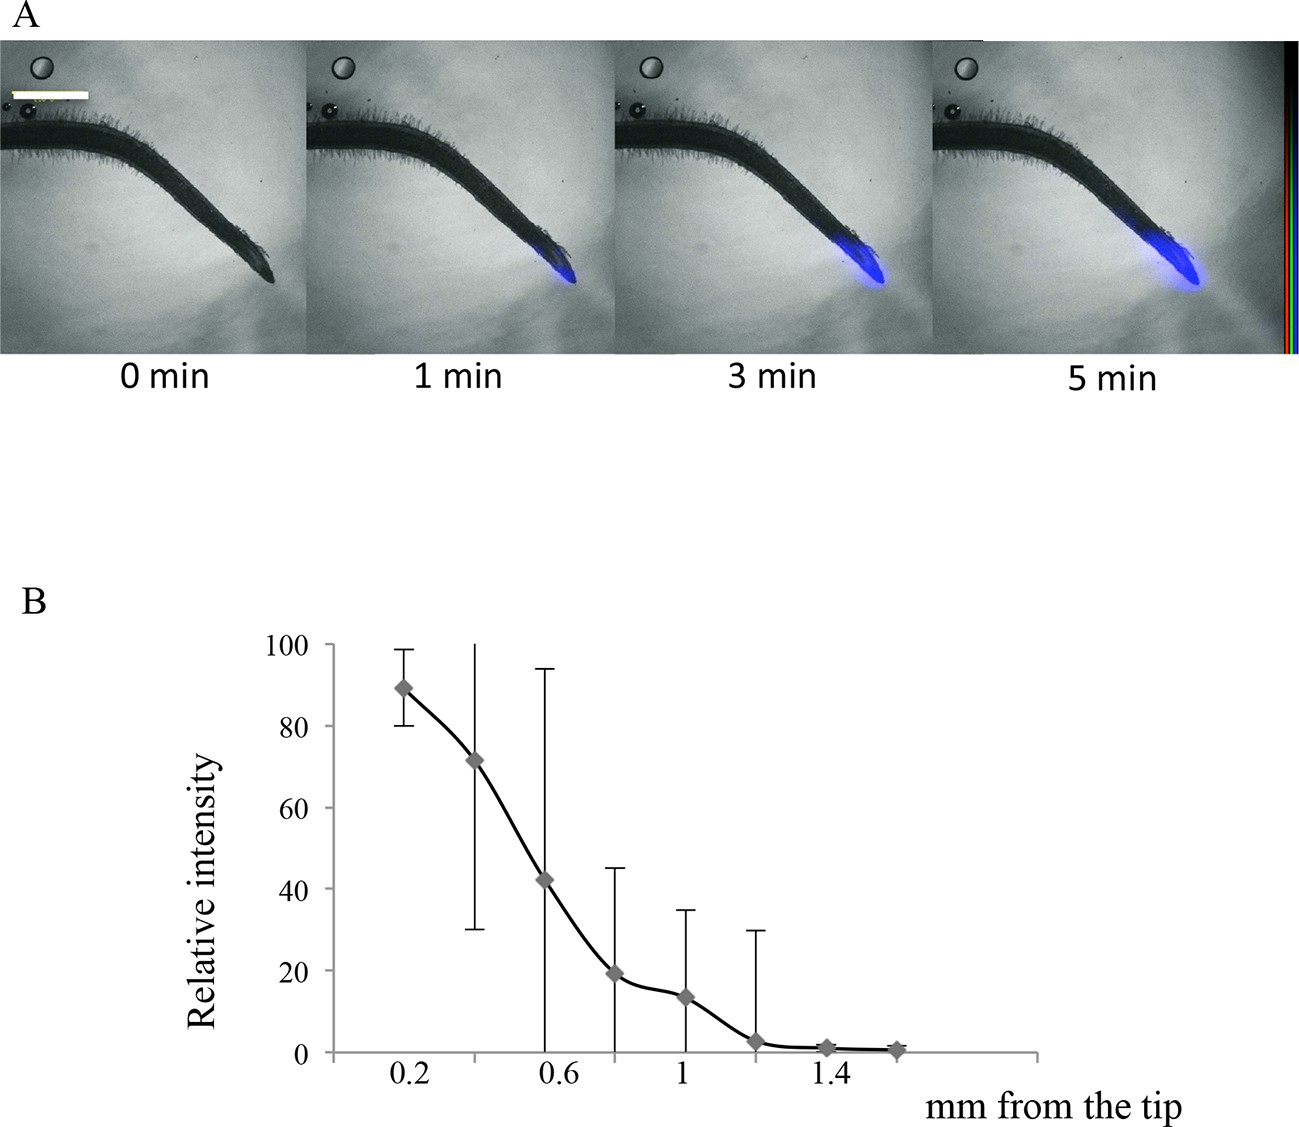
Imaging of 33P uptake at the root tip in Oryza sativa.
(A) Time course of 33P uptake (200 kBq application). (B) Quantification of 33P (after 1 min absorption) along the root in 0.2 mm intervals, extending 2 mm from the tip. Values are means ± SD of 4 plantlets. Scale bar: 0.5 mm. 33P level is represented as color intensity.
Figure 4—figure supplement 1
Imaging of 33P uptake at the Lotus japonicus root tip.
(A) Time course of 33P uptake (200 kBq application). (B) Quantification of 33P (after 1 min absorption) along the root in 0.2 mm intervals, extending 2 mm from the tip. Values are means ± SD of 4 plantlets. Scale bar: 0.5 mm. 33P level is shown as color intensity.
Tables
Table 1
Rosette biomass during long-term experiments. Plants were grown on soil or hydroponically in sand.
| FW (mg) | On soil | Hydroponically on sand |
|---|---|---|
| phf1-1 | 3.07 ± 2.23 | 3.04 ± 0.70 |
| phf1 Q0171>>PHF1 | 8.66 ± 4.09* | 5.53 ± 1.56* |
| WT | 41.17 ± 24.76* | 11.04 ± 2.63* |
-
FW: fresh weight. Values are mean ± SD. Comparison to phf1-1 line: *P ≤ 0.0009 (Student’s t-test). 10 to 23 rosettes were individually weighed.
-
Table 1—source data 1
Rosette biomass during long-term experiments.
- https://doi.org/10.7554/eLife.14577.017
Additional files
-
Supplementary file 1
(A) Primers used for constructs. (B) Primers used for RT-qPCR.
- https://doi.org/10.7554/eLife.14577.020
Download links
A two-part list of links to download the article, or parts of the article, in various formats.
Downloads (link to download the article as PDF)
Open citations (links to open the citations from this article in various online reference manager services)
Cite this article (links to download the citations from this article in formats compatible with various reference manager tools)
A novel role for the root cap in phosphate uptake and homeostasis
eLife 5:e14577.
https://doi.org/10.7554/eLife.14577


