ESCRT-III activation by parallel action of ESCRT-I/II and ESCRT-0/Bro1 during MVB biogenesis
- Cornell University, United States
Figures
Figure 1 with 4 supplements
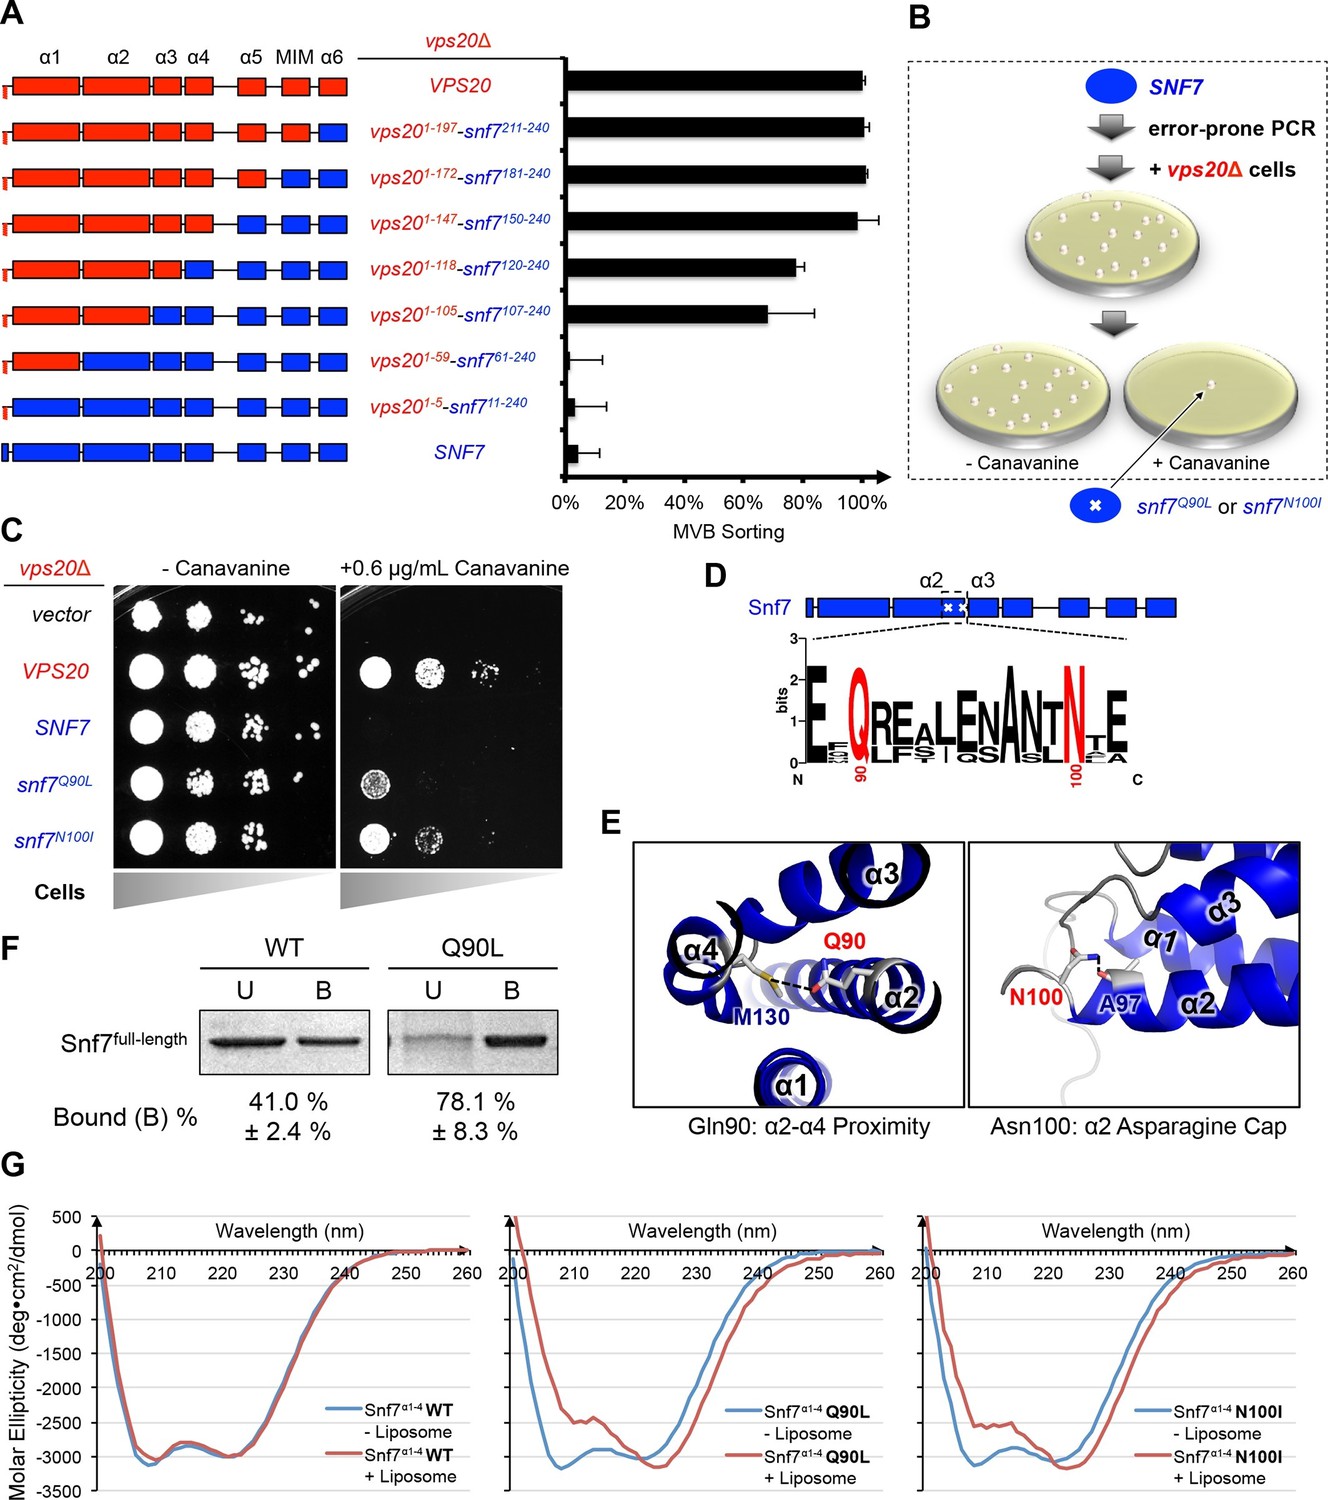
Novel Snf7 point mutations trigger core domain activation.
(A) Domain organization of Vps20(red)-Snf7(blue) chimera (left) and quantitative MVB sorting data (right) for vps20Δ yeast exogenously expressing VPS20, vps201-197-snf7211-240, vps201-172-snf7181-240, vps201-147-snf7150-240, vps201-118-snf7120-240, vps201-105-snf7107-240, vps201-59-snf761-240, vps201-5-snf711-240, and SNF7. Error bars represent standard deviations from 3–5 independent experiments. (B) Screening strategy to identify snf7 suppressors in vps20Δ yeast. (C) Canavanine sensitivity assay for vps20Δ yeast exogenously expressing empty vector, VPS20, SNF7, snf7Q90L, and snf7N100I. (D) Domain organization of Snf7, with the locations of Gln90 and Asn100. WebLogo of protein sequence analysis (Doerks et al., 2002) of Snf7 orthologs from Saccharomyces cerevisiae, Homo sapiens, Mus musculus, Xenopus laevis, Drosophila melanogaster, Caenorhabditis elegans, Schizosaccharomyces pombe. (E) Close-up view of the side chain interactions of Gln90 (left) and Asn100 (right) in a 'closed' Snf7 homology model (Henne et al., 2012). (F) Liposome sedimentation assays of Snf7WT and Snf7Q90L. Liposome-bound (B) proteins and unbound (U) proteins. (G) CD scanning spectra from 200 nm to 260 nm of wild-type Snf7α1–4 (left), Snf7α1–4 Q90L (middle), and Snf7α1–4 N100I proteins with (red) and without (blue) liposomes.
Figure 1—figure supplement 1
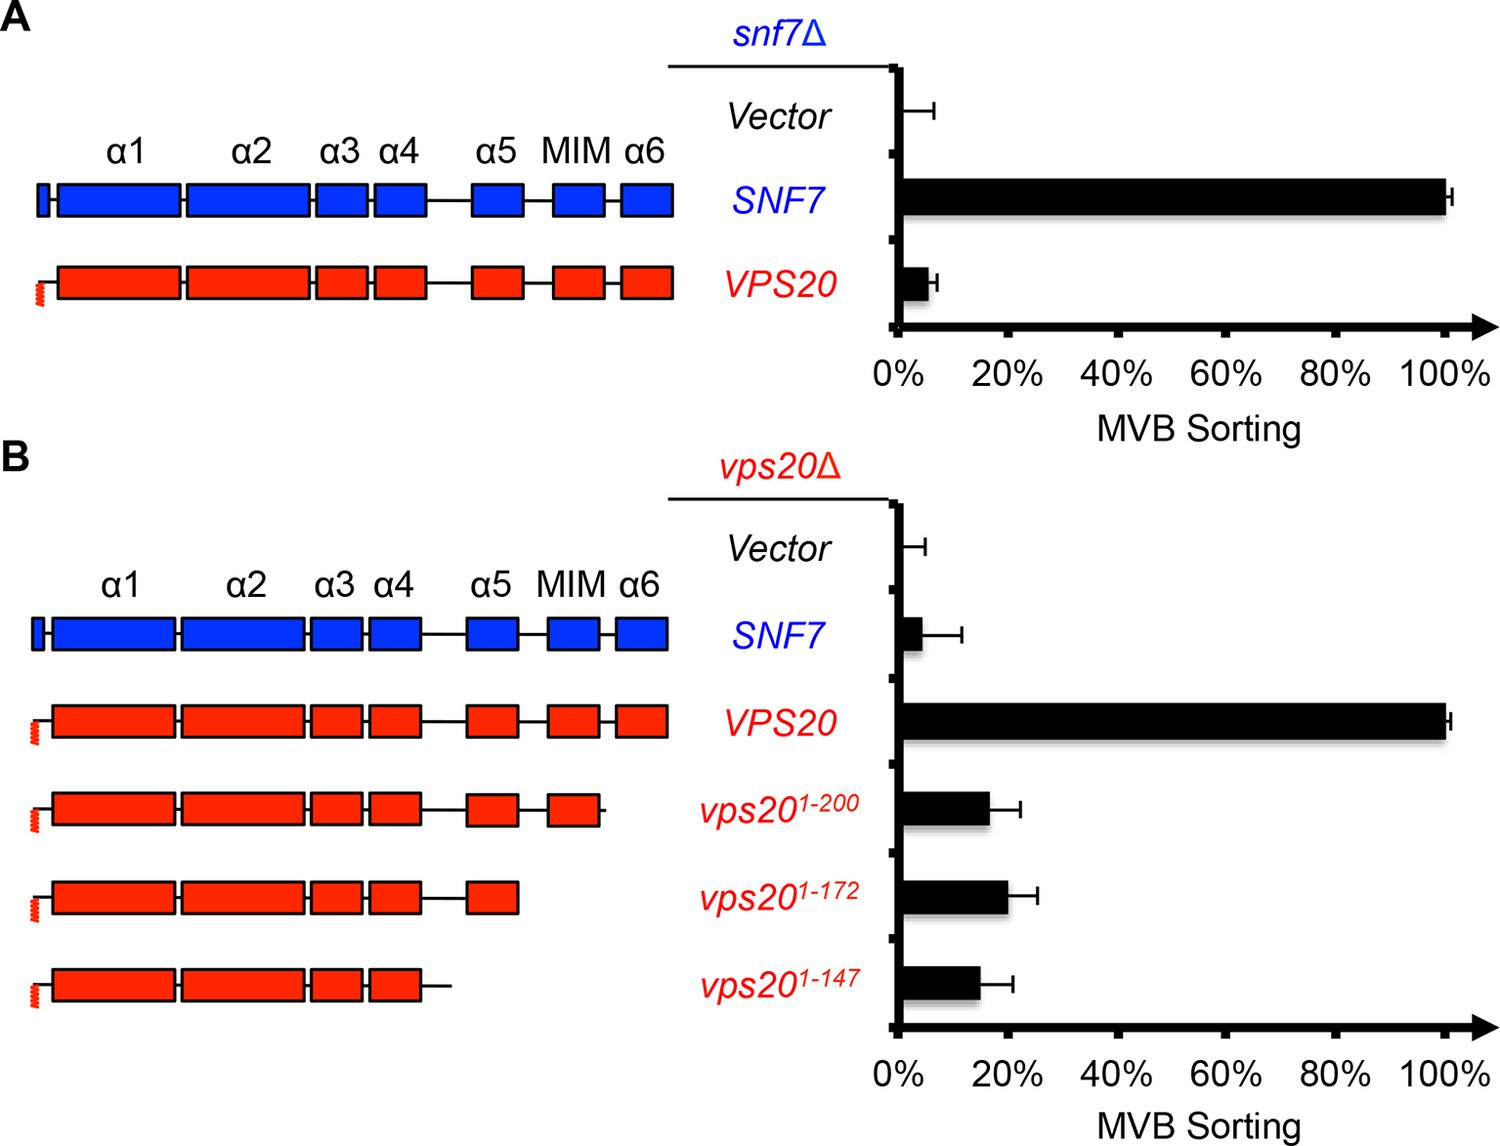
A full-length Vps20 is required for MVB sorting.
(A–B) Domain organization (left) and quantitative MVB sorting data (right) for (A) snf7Δ yeast exogenously expressing empty vector, SNF7, and VPS20, and for (B) vps20Δ yeast exogenously expressing empty vector, SNF7, VPS20, vps201-200, vps201-172, and vps201-147. Error bars represent standard deviations from 3–5 independent experiments.
Figure 1—figure supplement 2
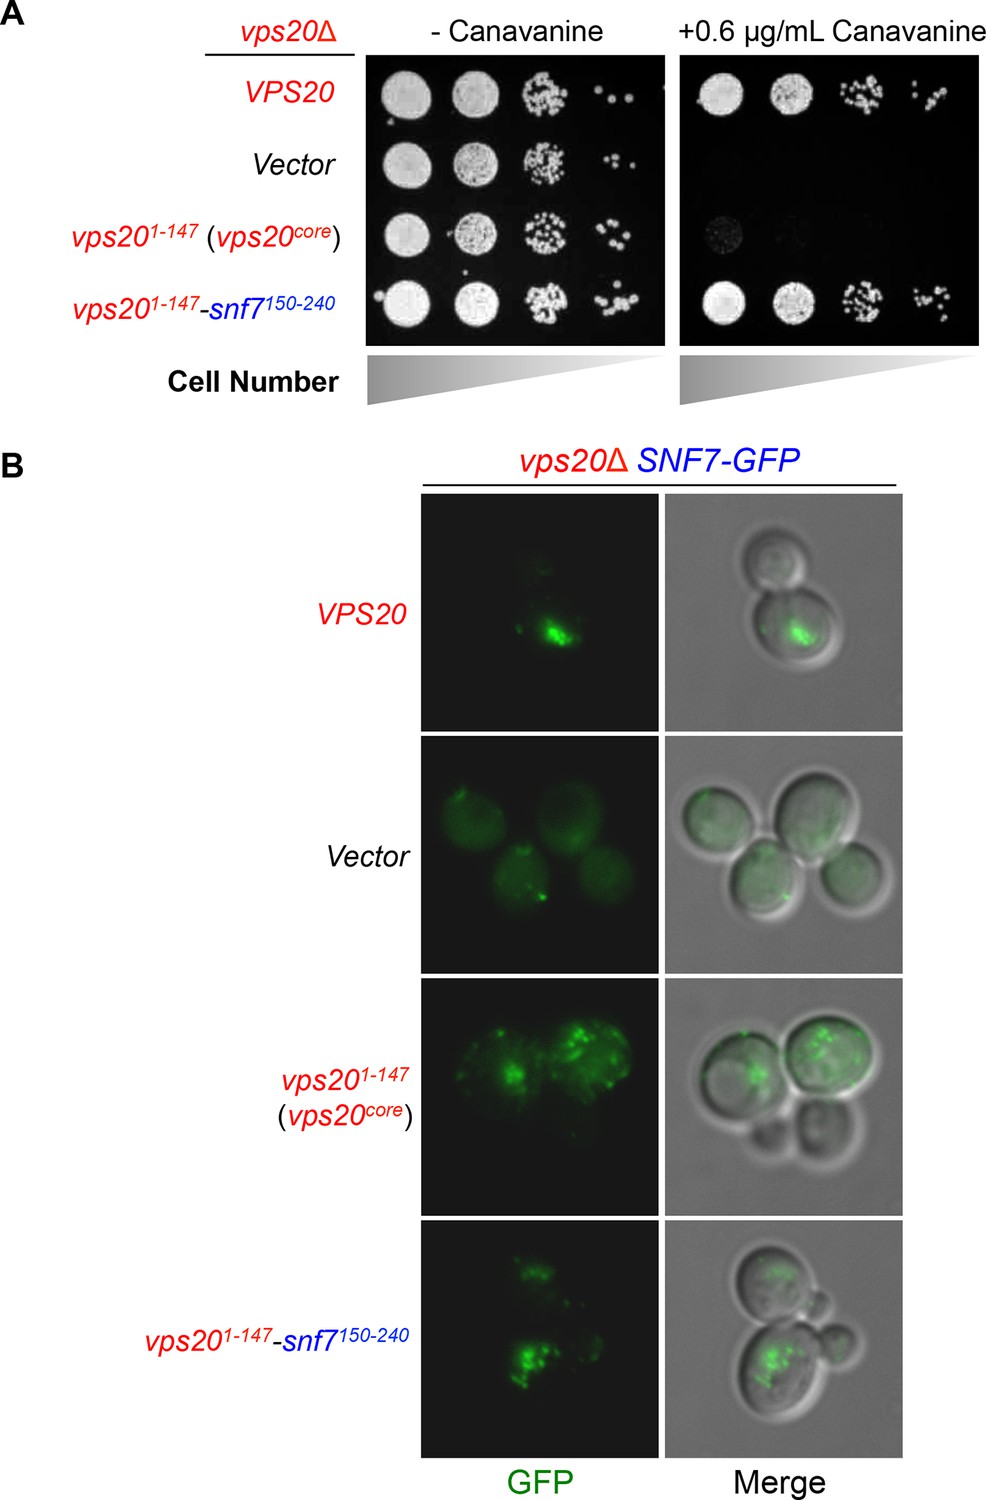
Vps20-Snf7 chimera complements Vps20 function.
(A) Canavanine sensitivity assay for vps20Δ yeast exogenously expressing VPS20, empty vector, vps201-147, and vps201-147-snf7150-240. (B) Representative images of vps20Δ SNF7-GFP yeast exogenously expressing VPS20, empty vector, vps201-147, and vps201-147-snf7150-240. GFP images (left) and composite images of GFP and DIC (right).
Figure 1—figure supplement 3

Snf7Q90L and Snf7N100I trigger core domain activation.
(A) Domain organization of Snf7 closed and open conformations, highlighting the core domain. (B) Ribbon models of Snf7 closed (homology) (Henne et al., 2012) and open conformations (right, PDB: 5FD9), with the locations of Gln90 and Asn100.
Figure 1—figure supplement 4
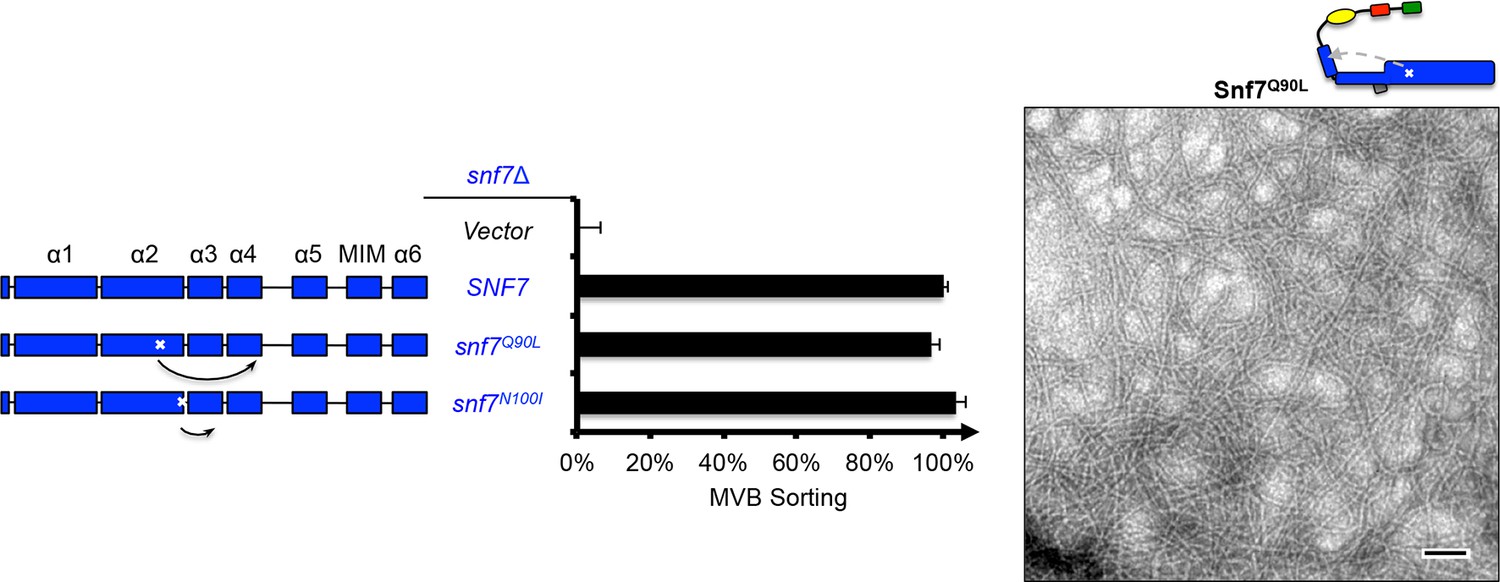
Snf7Q90L assembles into protofilaments in vivo and in vitro.
Domain organization and quantitative MVB sorting data (left) for snf7Δ yeast exogenously expressing empty vector, SNF7, snf7Q90L, and snf7N100I. Error bars represent standard deviations from 3–5 independent experiments. Representative TEM images (right) of Snf7Q90L. Scale bars 100 nm.
Figure 2 with 2 supplements
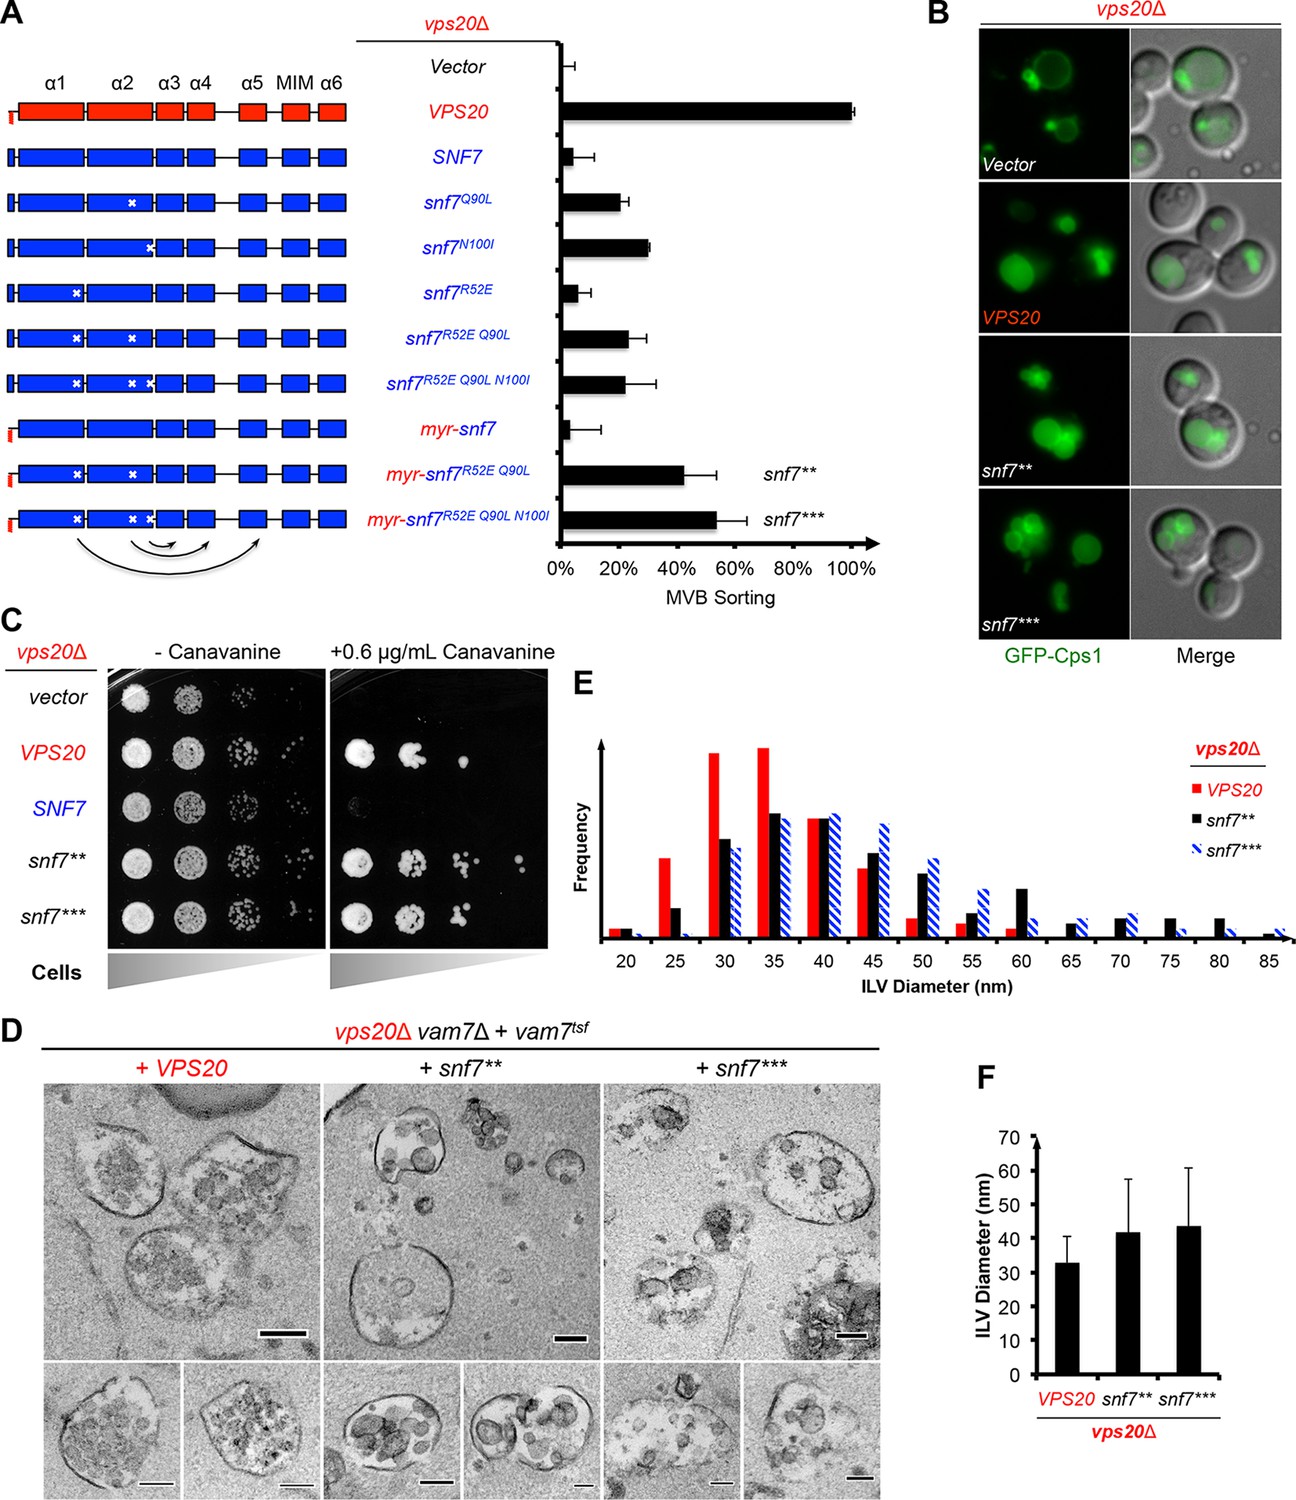
Auto-activated Snf7 functionally bypasses Vps20.
(A) Domain organization of Snf7 mutants (left) and quantitative MVB sorting data (right) for vps20Δ yeast exogenously expressing empty vector, VPS20, SNF7, snf7Q90L, snf7N100I, snf7R52E, snf7R52E Q90L, snf7R52E Q90L N100I, myr-snf7, myr-snf7R52E Q90L, and myr-snf7R52E Q90L N100I. Error bars represent standard deviations from 3–5 independent experiments. The data of myr-snf7 (vps201-5-snf711-240) and SNF7 were re-plotted from Figure 1A for comparsion. Mutants myr-snf7R52E Q90L and myr-snf7R52E Q90L N100I are referred to snf7** and snf7***, respectively. (B) Representative images of vps20Δ yeast exogenously expressing GFP-CPS1 with VPS20, snf7**, and snf7***. GFP images (left) and composite images of GFP and DIC (right). (C) Canavanine sensitivity assay for vps20Δ yeast exogenously expressing empty vector, VPS20, SNF7, snf7**, and snf7***. (D) Representative TEM images of ILV-containing MVBs from vps20Δ vam7Δ yeast exogenously expressing vam7tsf, with VPS20, snf7**, and snf7***. Scale bars 100 nm. (E–F) Quantitation of ILV (N=150 ILV summed per sample) outer diameter from (D) in frequency distributions (E), and averaged measurements (F). Error bars represent standard deviations.
Figure 2—figure supplement 1

Activation mutants complement snf7Δ in vivo.
Domain organization of Snf7 mutants (left) and quantitative MVB sorting data (right) for snf7Δ yeast exogenously expressing empty vector, VPS20, SNF7, snf7Q90L, snf7N100I, snf7R52E, snf7R52E Q90L, myr-snf7, and myr-snf7R52E Q90L. Error bars represent standard deviations from 3–5 independent experiments. The data from snf7Q90L and snf7N100I were partially re-plotted from Figure 1—figure supplement 4 for comparison.
Figure 2—figure supplement 2

Activation mutants complement vps20Δ snf7Δ in vivo.
(A) Domain organization of Snf7 mutants (left) and quantitative MVB sorting data (right) for vps20Δ snf7Δ yeast exogenously expressing empty vector and empty vector, VPS20 and SNF7, VPS20 and empty vector, empty vector and SNF7, empty vector and myr-snf7R52E Q90L, and empty vector and myr-snf7R52E Q90L N100I. Error bars represent standard deviations from 3–5 independent experiments. (B) Western blotting analyses of vps20Δ snf7Δ yeast expressing SNF7, snf7Q90L, snf7N100I, snf7R52E, myr-snf7, snf7**, and snf7***. G6PDH used as loading controls.
Figure 3 with 7 supplements
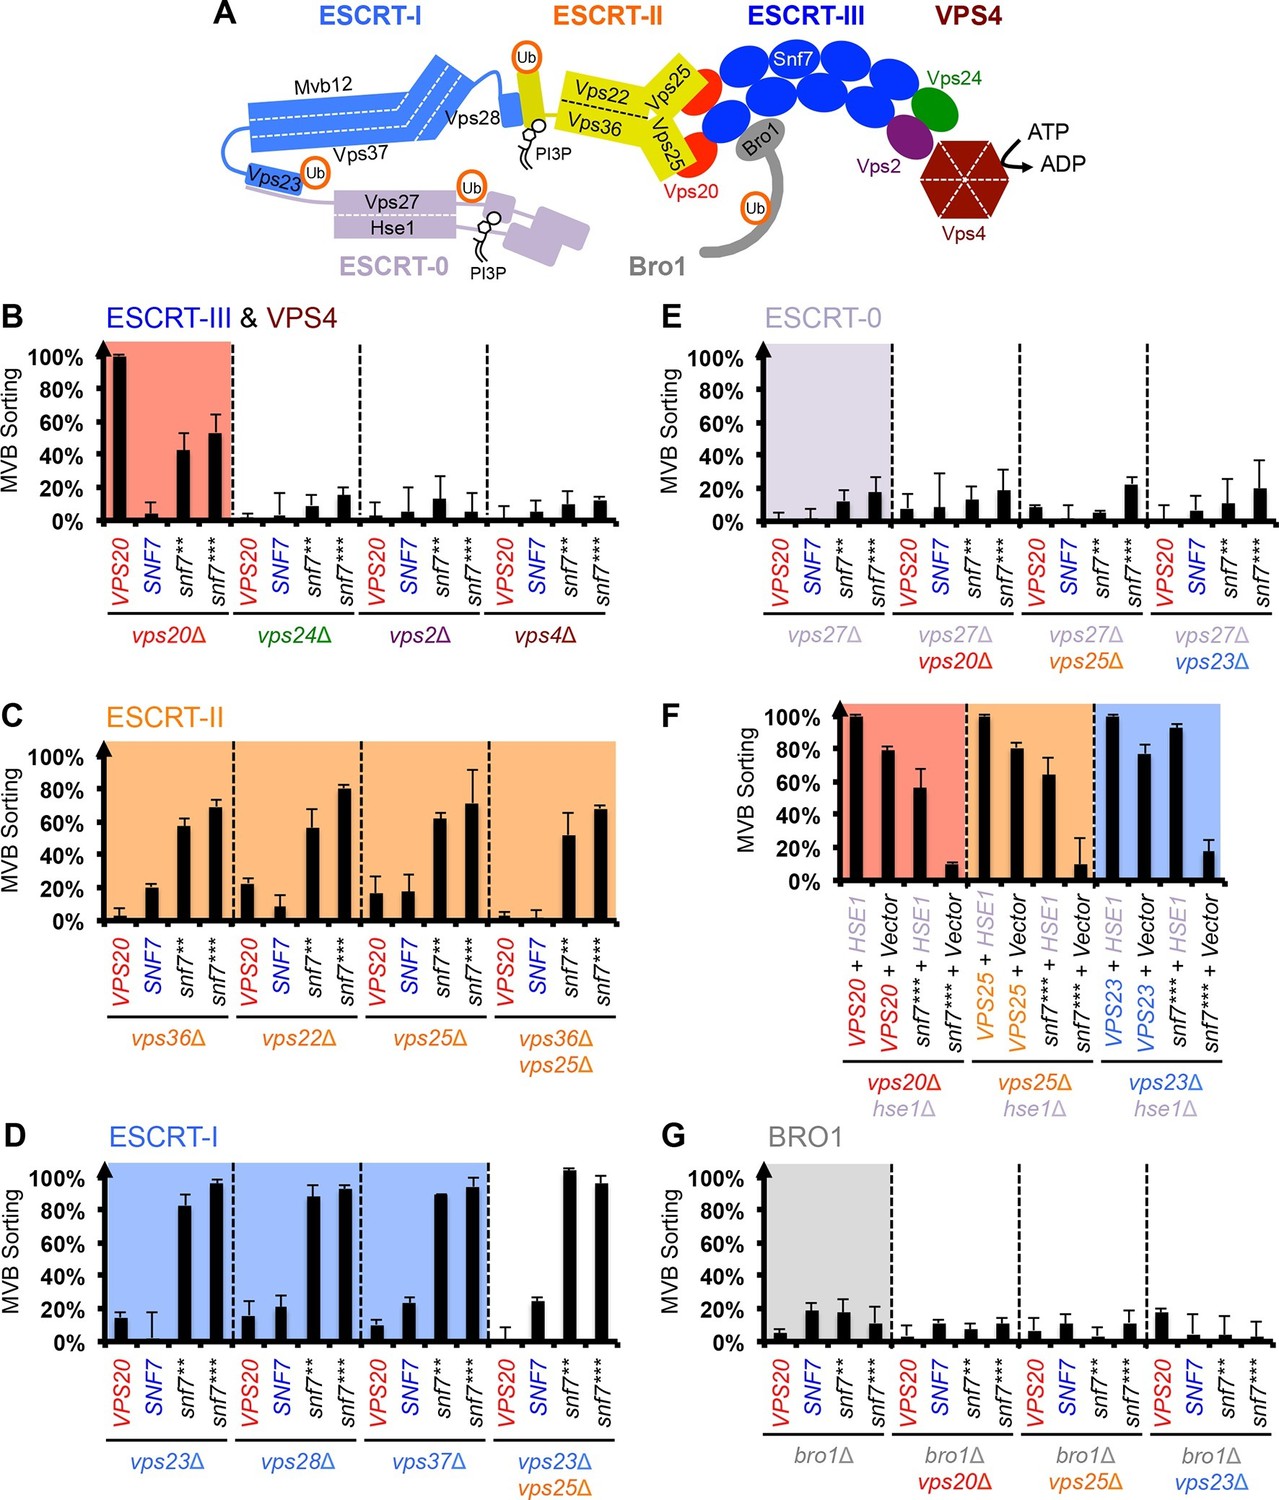
Snf7 core domain auto-activation bypasses ESCRT-I and ESCRT-II.
(A) Cartoon of the ESCRT pathway in MVB Biogenesis. (B–D & F–G) Quantitative MVB sorting data for (B) vps20Δ, vps24Δ, vps2Δ and vps4Δ yeast, (C) vps36Δ, vps22Δ, vps25Δ and vps36Δ vps25Δ yeast, (D) vps23Δ, vps28Δ, vps37Δ and vps23Δ vps25Δ yeast, (E) vps27Δ, vps27Δ vps20Δ, vps27Δ vps25Δ and vps27Δ vps23Δ yeast, (G) bro1Δ, bro1Δ vps20Δ, bro1Δ vps25Δ and bro1Δ vps23Δ yeast exogenously expressing VPS20, SNF7, snf7**, and snf7***, respectively. The data from vps20Δ were partially re-plotted from Figure 2A for comparison. (F) Quantitative MVB sorting data for vps20Δ hse1Δ, vps25Δ hse1Δ, and vps23Δ hse1Δ yeast exogenously expressing VPS20/VPS25/VPS23 and HSE1, and VPS20/VPS25/VPS23 and empty vector, snf7*** and HSE1, and snf7*** and empty vector, respectively. Error bars represent standard deviations from 3–5 independent experiments.
Figure 3—figure supplement 1

Snf7 core domain auto-activation does not suppress vps24Δ, vps2Δ and vps4Δ.
Quantitative MVB sorting data for vps20Δ vps24Δ, vps20Δ vps2Δ and vps20Δ vps4Δ yeast exogenously expressing VPS20, SNF7, snf7**, and snf7***, respectively. Error bars represent standard deviations from 3–5 independent experiments.
Figure 3—figure supplement 2
Repurposing Snf7 to bind Vps25 does not improve suppression in vps20Δ.
Multiple sequence alignment between Saccharomyces cerevisiae Snf7 and Vps20 and rational design of Snf77mut. Quantitative MVB sorting data for vps20Δ yeast exogenously expressing empty vector, VPS20, snf7**, snf7***, vps201-59-snf761-240, vps201-59-snf761-240 Q90L, snf7T20D V24L R27K I30K N31D L33I S34H (snf77mut), snf77mut R52E Q90L, snf77mut R52E Q90L N100I, snf7** 7mut, and snf7*** 7mut. Error bars represent standard deviations from 3–5 independent experiments. The data of snf7** and snf7*** were partially re-plotted from Figure 2A and vps201-59-snf761-240 from Figure 1A for comparison.
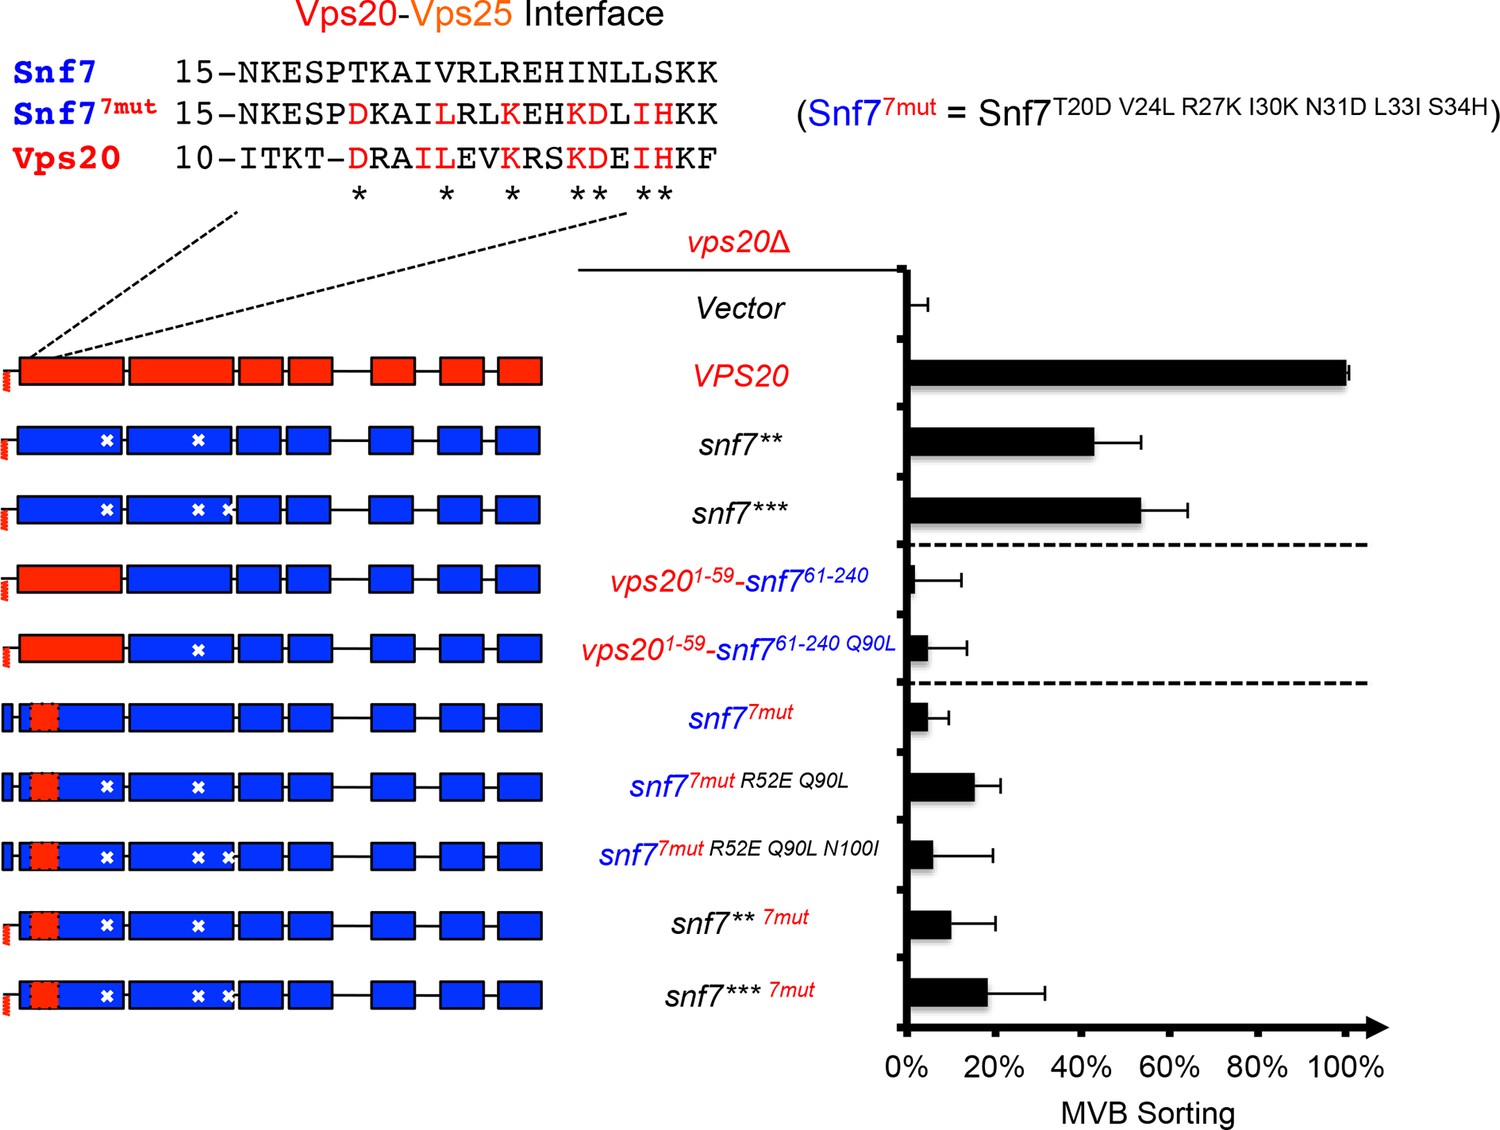
Figure 3—figure supplement 3

Snf7 core domain auto-activation suppresses ESCRT-II deletions.
Quantitative MVB sorting data for vps20Δ vps36Δ, vps20Δ vps22Δ and vps20Δ vps25Δ yeast exogenously expressing VPS20, SNF7, snf7**, and snf7***, respectively. Error bars represent standard deviations from 3–5 independent experiments.
Figure 3—figure supplement 4

Snf7 core domain auto-activation suppresses ESCRT-II 'arm' mutants.
Cartoon diagram of ESCRT-II Arms. Quantitative MVB sorting data for vps20Δ vps36Δ, vps20Δ vps22Δ and vps20Δ vps25Δ yeast exogenously expressing empty vector and empty vector, VPS20 and VPS36/VPS22/VPS25, VPS20 and vps36D548R (vps36arm) / vps22D214A (vps22arm) / vps25R83D (vps25arm), snf7** and vps36arm / vps22arm/ vps25arm, and snf7*** and vps36arm / vps22arm / vps25arm, respectively. Error bars represent standard deviations from 3–5 independent experiments.
Figure 3—figure supplement 5

Snf7 core domain auto-activation suppresses ESCRT-I deletions.
Quantitative MVB sorting data for vps20Δ vps23Δ, vps20Δ vps28Δ and vps20Δ vps37Δ yeast exogenously expressing VPS20, SNF7, snf7**, and snf7***, respectively. Error bars represent standard deviations from 3–5 independent experiments.
Figure 3—figure supplement 6

MVB morphologies of snf7** and snf7*** in vps23Δ.
(A) Representative TEM images of ILV-containing MVBs from vps23Δ vam7Δ yeast exogenously expressing vam7tsf, with VPS23, snf7**, and snf7***. Scale bars 100 nm. (B–C) Quantitation of ILV (N=150 ILV summed per sample) outer diameter from (A) in frequency distributions (B), and averaged measurements (C). Error bars represent standard deviations.
Figure 3—figure supplement 7
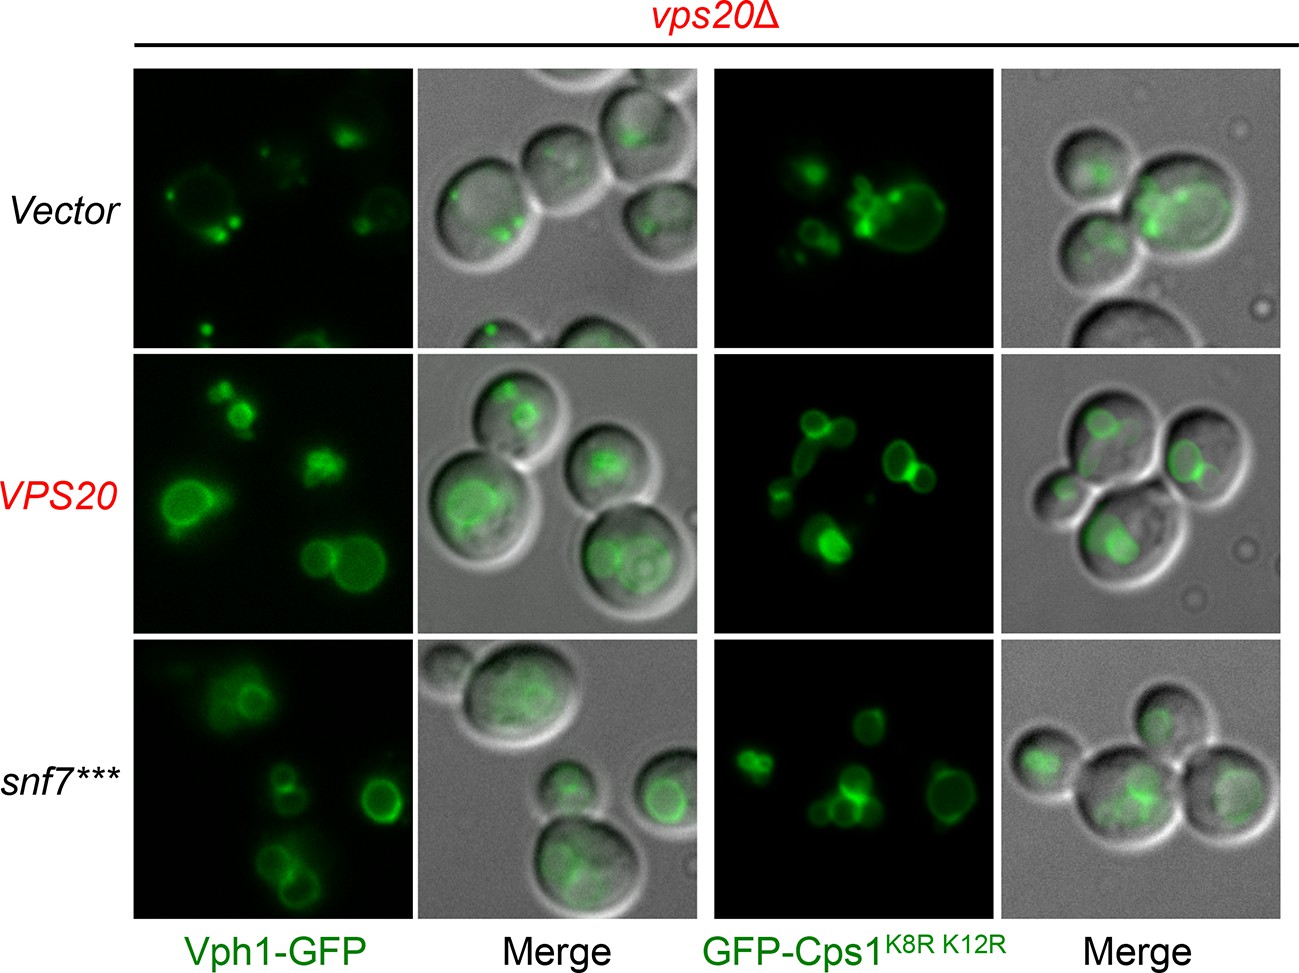
Localization of Vph1-GFP and GFP-Cps1K8R K12R.
Representative images of vps20Δ yeast exogenously expressing VPH1-GFP (left) and GFP-CPS1K8R K12R (right) with VPS20, and snf7***. GFP images and composite images of GFP and DIC.
Figure 4 with 1 supplement
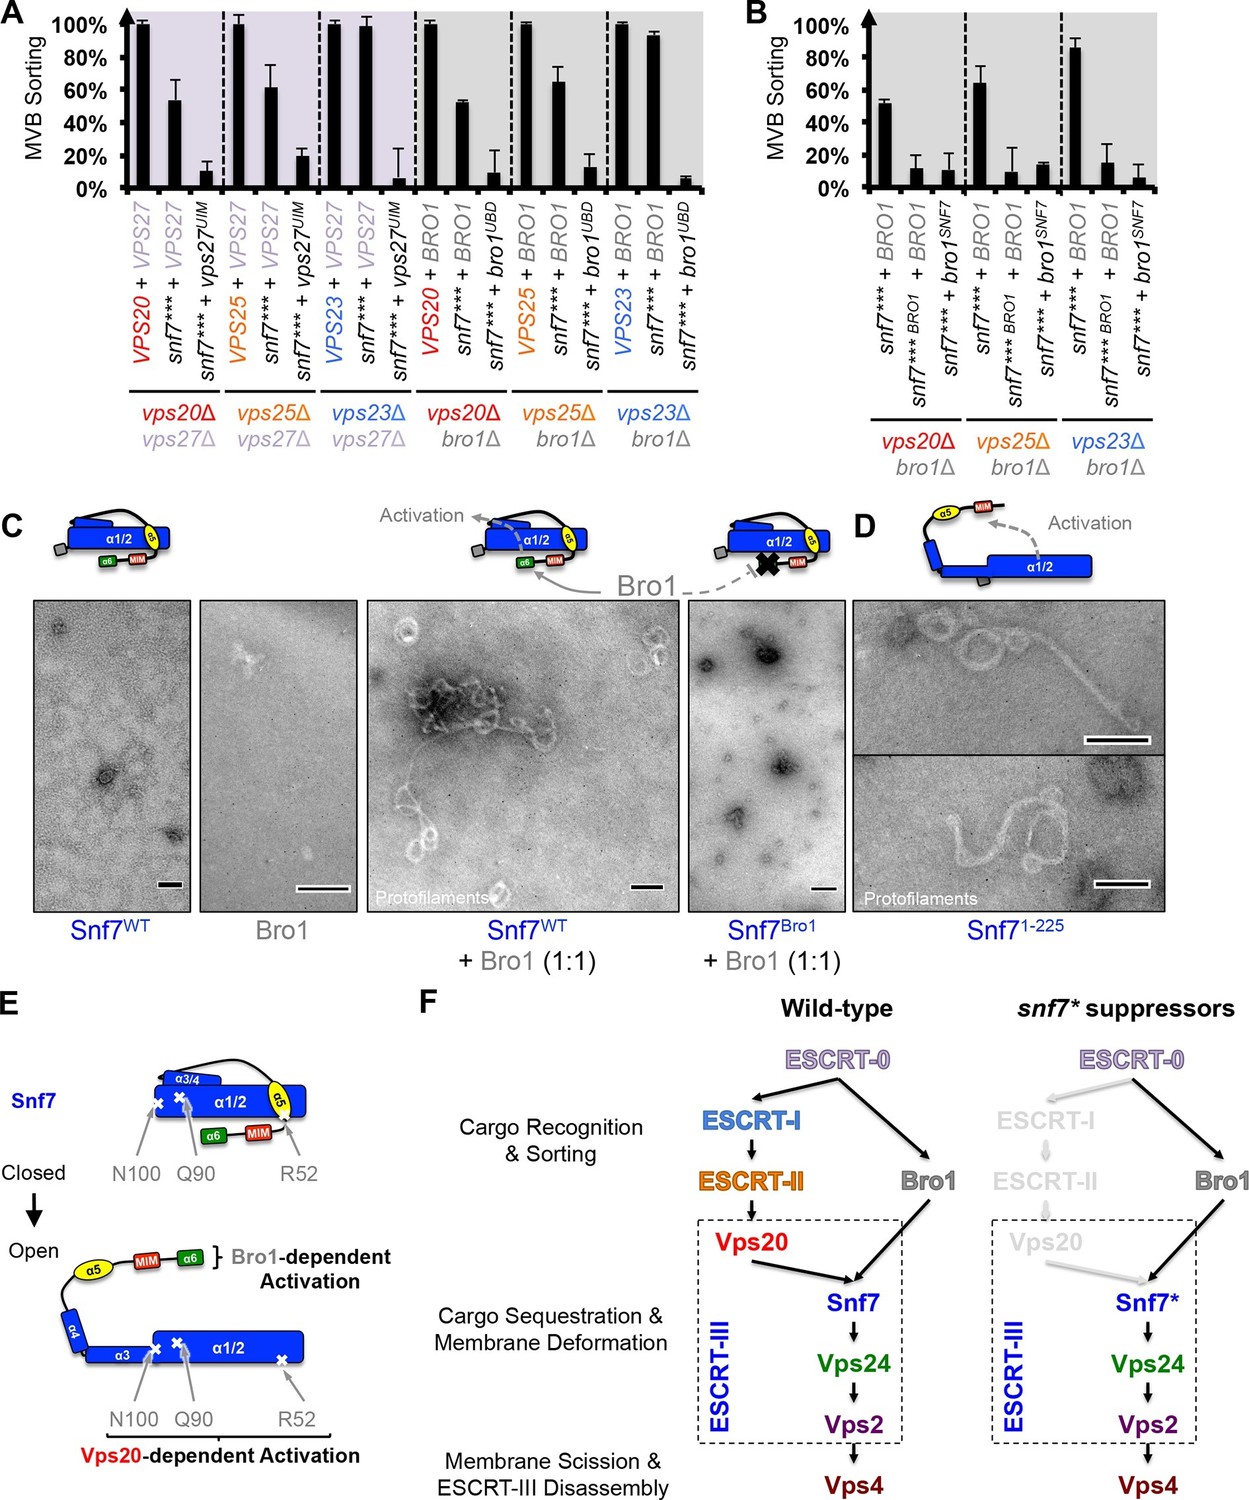
Parallel Snf7 activation at its core domain and the C-terminal α6.
(A–B) Quantitative MVB sorting data for (A) vps20Δ vps27Δ, vps25Δ vps27Δ, and vps23Δ vps27Δ yeast exogenously expressing VPS20/VPS25/VPS23 and VPS27, snf7*** and VPS27, and snf7*** and vps27S270D S313D(vps27UIM), and vps20Δ bro1Δ, vps25Δ bro1Δ, and vps23Δ bro1Δ yeast exogenously expressing VPS20/VPS25/VPS23 and BRO1, snf7*** and BRO1, and snf7*** and bro1I377R L386R(bro1UBD), respectively, and for (B) vps20Δ bro1Δ, vps25Δ bro1, and vps23Δ bro1Δ yeast exogenously expressing snf7*** and BRO1, snf7*** L231K L234K (snf7*** BRO1) and BRO1, and snf7***and bro1I144D L336D(bro1SNF7), respectively. Error bars represent standard deviations from 3–5 independent experiments. (C–D) Representative TEM images of (C) Snf7WT, Bro1, and Snf7WT with Bro1 (1:1), and (D) Snf71-225 and Snf7R52E. Scale bars 100 nm. Cartoon diagrams of Snf7 activation. (E) Cartoon diagrams of closed and open Snf7, with the locations of Vps20-dependent activation sites, Arg52, Gln90, and Asn100, and Bro1-dependent activation region, α6. (F) Conceptual models of parallel ESCRT-III Snf7 activation pathways in MVB biogenesis of wild-type (left) and the core domain auto-activated Snf7 mutant, Snf7* (right).
Figure 4—figure supplement 1
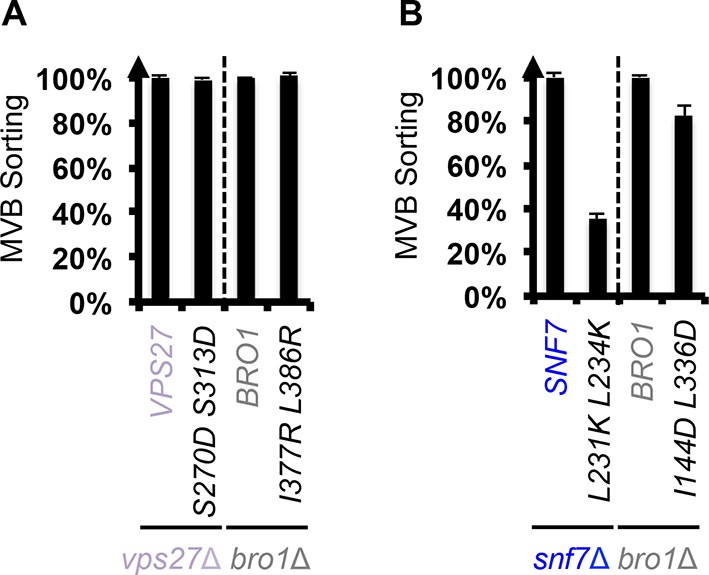
Snf7-Bro1 interaction is important for MVB sorting.
Quantitative MVB sorting data for (A) vps27Δ yeast exogenously expressing VPS27 and vps27S270D S313D and bro1Δ east exogenously expressing BRO1 and bro1I377R L386R, and (B) snf7Δ yeast exogenously expressing SNF7 and snf7L231K L234K, and bro1Δ east exogenously expressing BRO1 and bro1I144D L336D. Error bars represent standard deviations from 3–5 independent experiments.
Additional files
-
Supplementary file 1
- https://doi.org/10.7554/eLife.15507.020
Download links
A two-part list of links to download the article, or parts of the article, in various formats.
Downloads (link to download the article as PDF)
Open citations (links to open the citations from this article in various online reference manager services)
Cite this article (links to download the citations from this article in formats compatible with various reference manager tools)
ESCRT-III activation by parallel action of ESCRT-I/II and ESCRT-0/Bro1 during MVB biogenesis
eLife 5:e15507.
https://doi.org/10.7554/eLife.15507


