The ubiquitin-proteasome system regulates focal adhesions at the leading edge of migrating cells
- Fred Hutchinson Cancer Research Center, United States
Figures
Figure 1 with 2 supplements
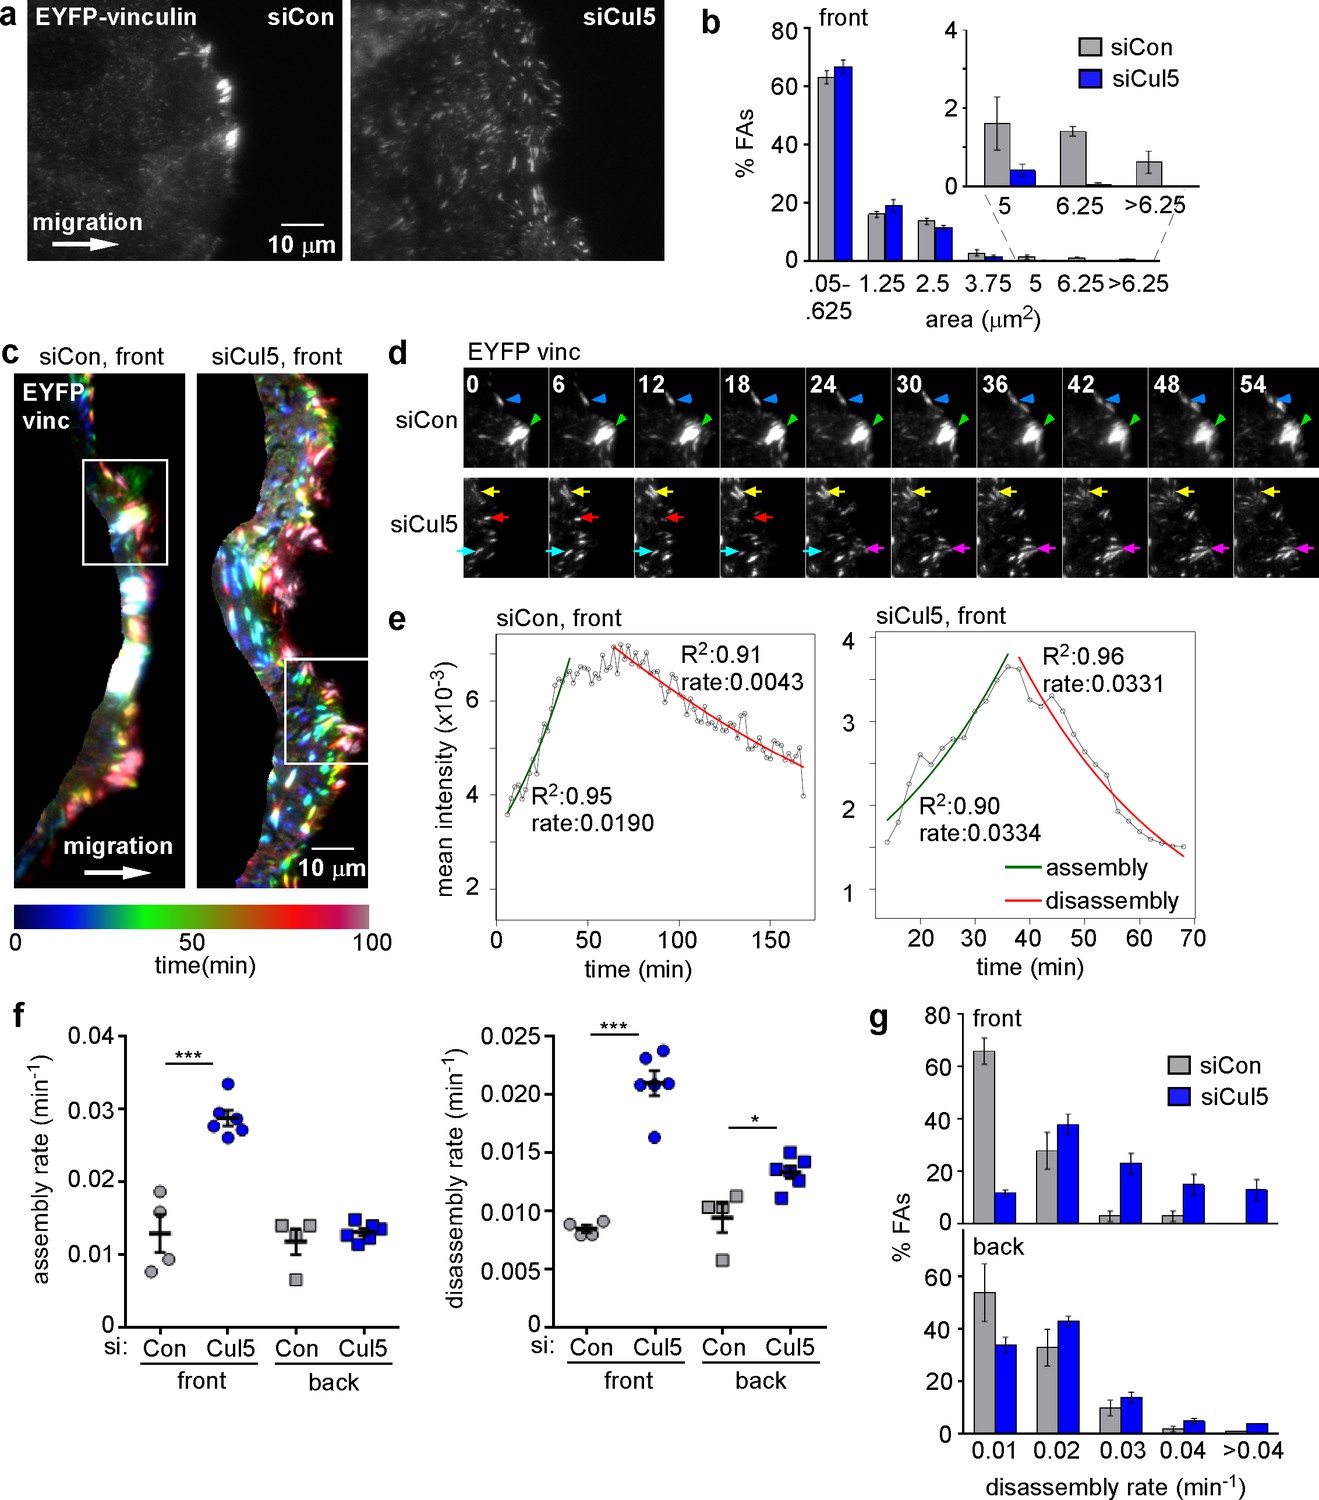
Cul5 stabilizes focal adhesions at the front of migrating cells.
Focal adhesion dynamics of control and Cul5-deficient MCF10A cells, migrating into a scratch wound in EGF-deficient medium, monitored using EYFP-vinculin. (a) FAs visualized using TIRF microscopy of control and Cul5-deficient cells expressing EYFP-vinculin. (b) Histogram of FA sizes at the front of control (gray) and Cul5-deficient (blue) cells. All structures greater than 0.05 μm2 (two pixels) were quantified. The inset shows structures greater than 5 μm2 on an expanded scale. (c) Rainbow color representation of FA appearance and disappearance. FAs are colored according their presence during the time course, from blue to red. Only the front region of the cell is shown. (d) Individual frames from regions boxed in c. Arrowheads and arrows indicate stable and dynamic FAs, respectively. (e) Automated curve fitting to intensity/time plots for representative FAs from the front of control and Cul5-deficient cells. R2: Pearson’s correlation coefficient squared. (f) FA assembly and disassembly rate constants from the front (circles) and back (squares) of control (gray) and Cul5-deficient (blue) cells. Mean and standard error of median rates from each of 4–6 time-lapse movies are indicated. *p<0.05; ***p<0.001. Student’s t-test, two tailed, unequal variance. (f) Histogram of disassembly rate constants at the front and back of control (gray) and Cul5-deficient (blue) cells. Mean and standard error of biological replicates.
Figure 1—figure supplement 1
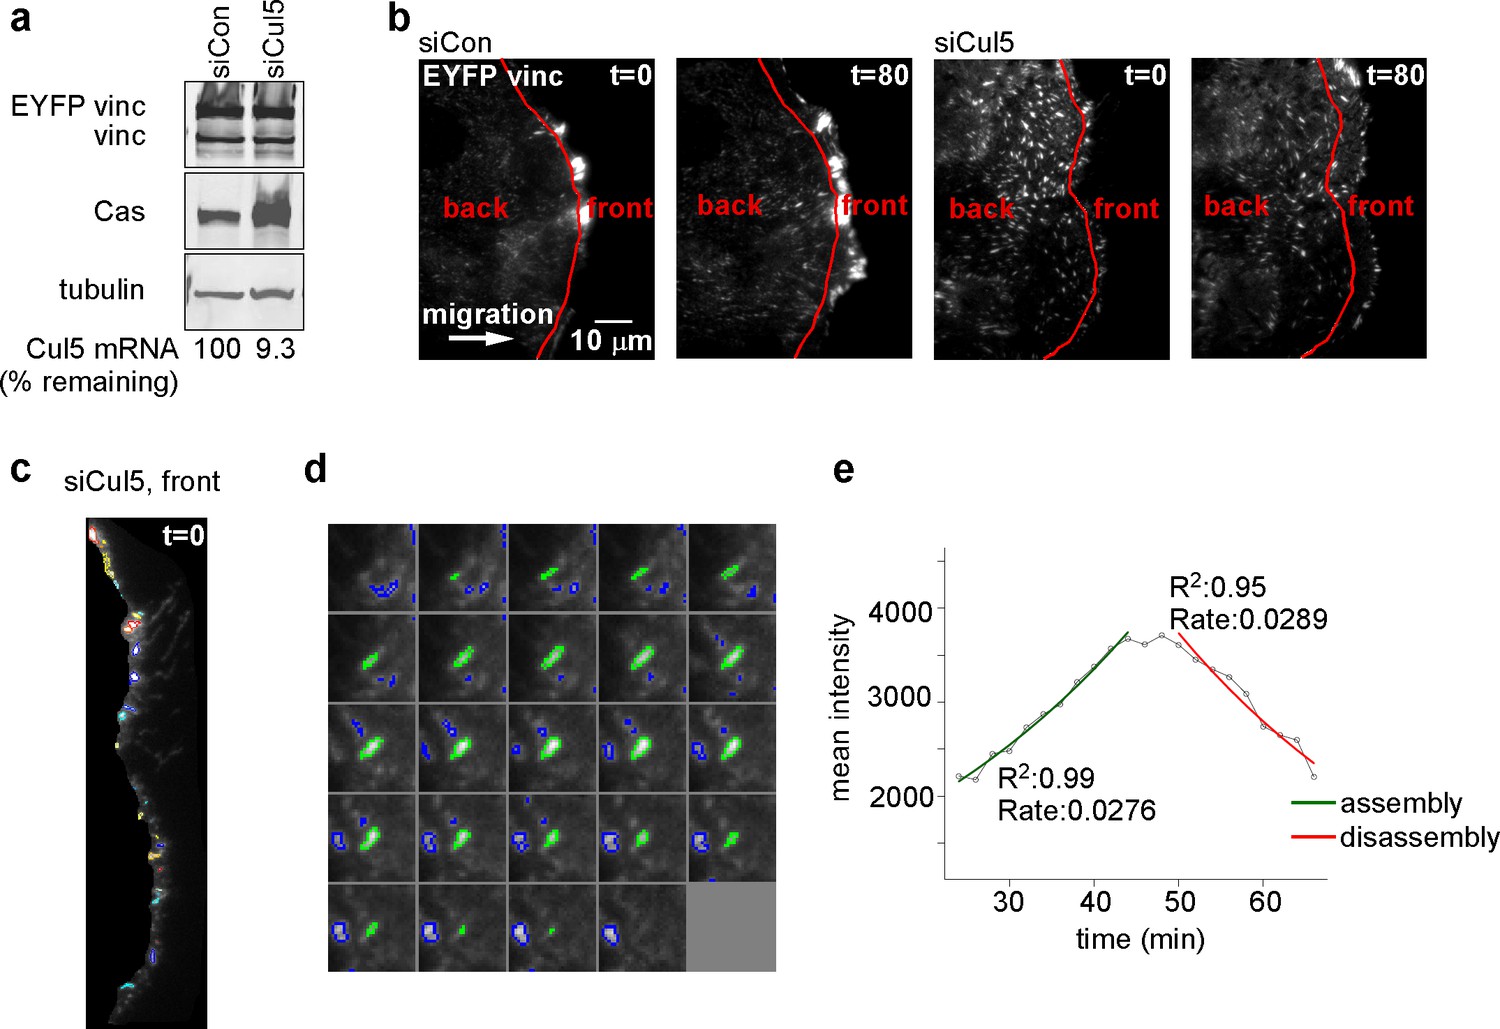
Quantification of FA dynamics.
(a) Characterization of cells. Western blot and RT-PCR data showing expression of EYFP-vinculin, Cas and Cul5 in MCF10A cells. (b) Definition of cell front and back. Red line indicates the position of the mask, ~6 µm from the cell front at zero time that was used to define the cell front and back. Note that the area included in the cell front increases over time as the leading edge advances. (c) Automated segmentation of EYFP-vinculin fluorescence into individual FAs. Different colors outline each FA. (d) Time series for a specific FA. Images recorded at 2 min intervals. (e) Plot of FA mean intensity against time, with automated curve fitting to estimate first-order rate constants for assembly and disassembly.
Figure 1—figure supplement 2
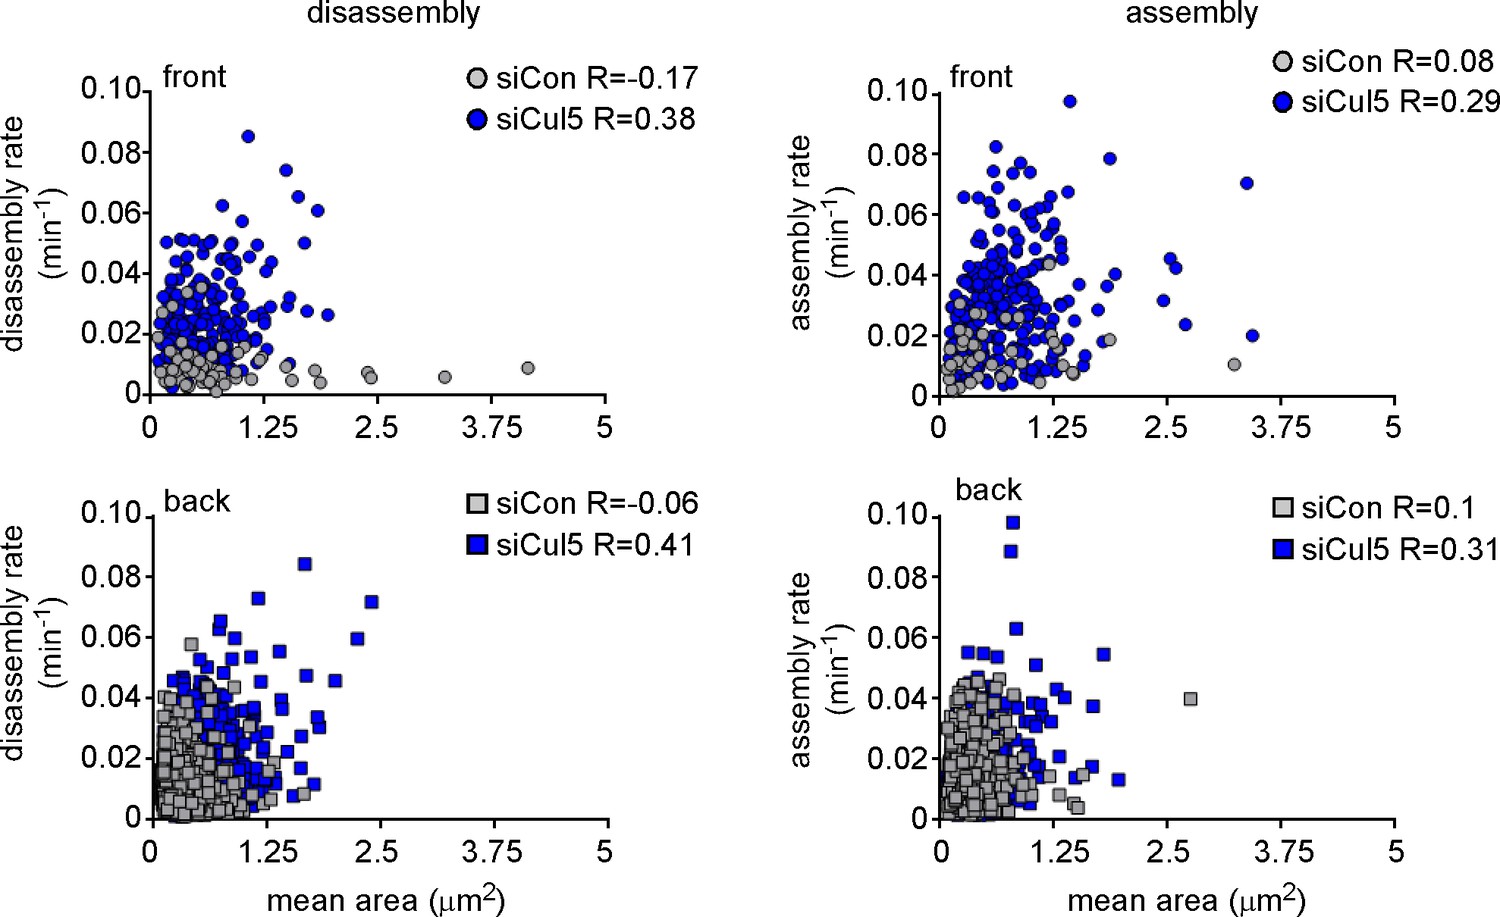
FA size is independent of FA assembly and disassembly rate constants.
Plots of assembly and disassembly rate constants against mean area (pixels) for FAs at the front and back of control (gray) and Cul5-deficient (blue) cells. There is a slight but insignificant correlation between FA size and disassembly rates for Cul5-deficient cells but complete independence for control cells. Only structures >2 pixels (0.05 um2) were included in the analysis. Note that small FAs in control cells assemble and disassemble much slower than similarly sized FAs in Cul5-deficient cells. R: Pearson’s correlation coefficient.
Figure 2 with 2 supplements
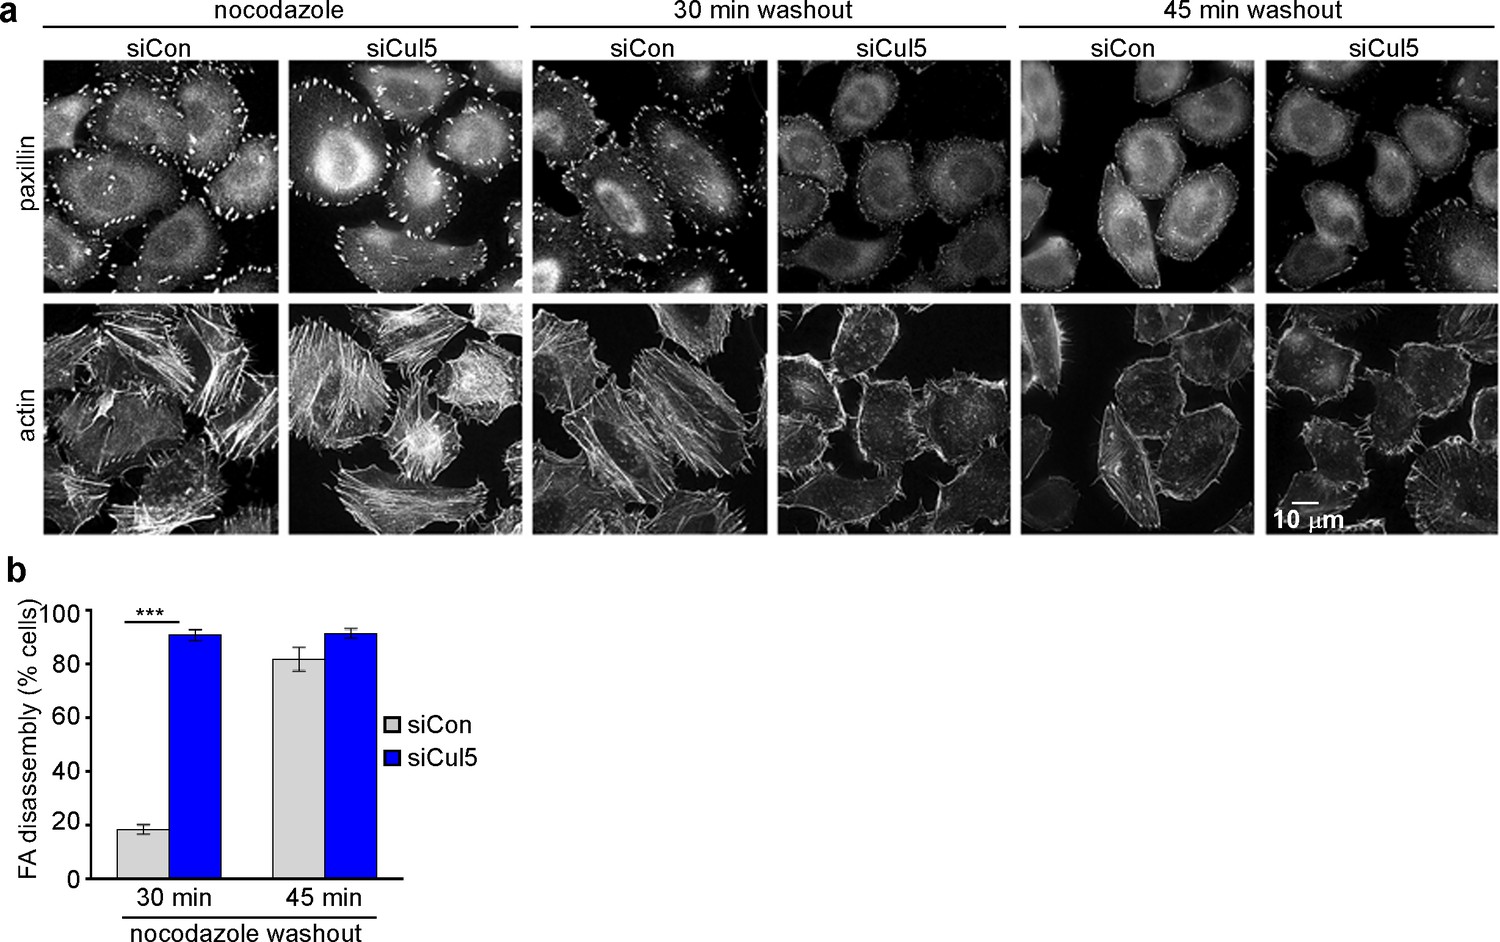
Cul5 regulates microtubule-dependent FA disassembly.
Control and Cul5-deficient HeLa cells were plated on collagen IV-coated coverslips, serum-starved overnight, and incubated with nocodazole for 3 hr to induce microtubule disassembly and stabilize FAs. Cells were fixed at various times after nocodazole removal and stained for F-actin and paxillin. (b) Cells lacking large FAs and prominent stress fibers were scored as percent of total cells. Mean and standard deviation of three biologically independent experiments. ***p<0.001.
Figure 2—figure supplement 1
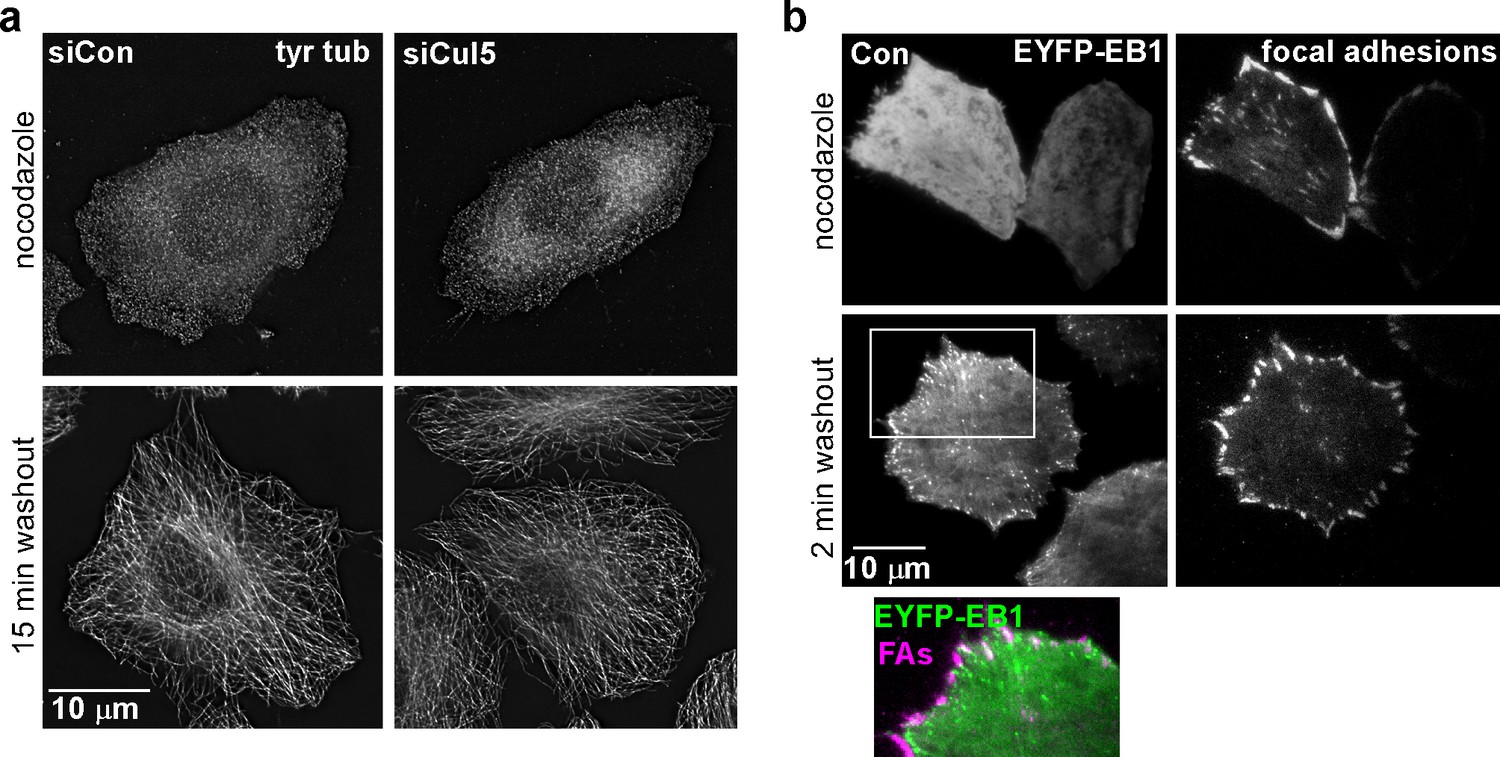
Cul5 does not regulate microtubule growth.
(a) HeLa cells were fixed at 0 or 15 min after reversal of nocodazole block and stained for tyrosinated tubulin. Deconvolution microscopy, ventral section. Cul5 did not affect the complete regrowth of microtubules. (b) HeLa cells expressing EYFP-EB1, a microtubule + end tracking protein, and mChSOCS6, a marker for FAs (see below, Figure 4) were incubated in nocodazole and imaged live by TIRF microscopy. EB1 was diffusely localized when nocodazole was present, but was detected in puncta that approached or co-localized with FAs two minutes after nocodazole washout, suggesting that microtubules regrow within 2 min of nocodazole reversal in cells that contain Cul5.
Figure 2—figure supplement 2
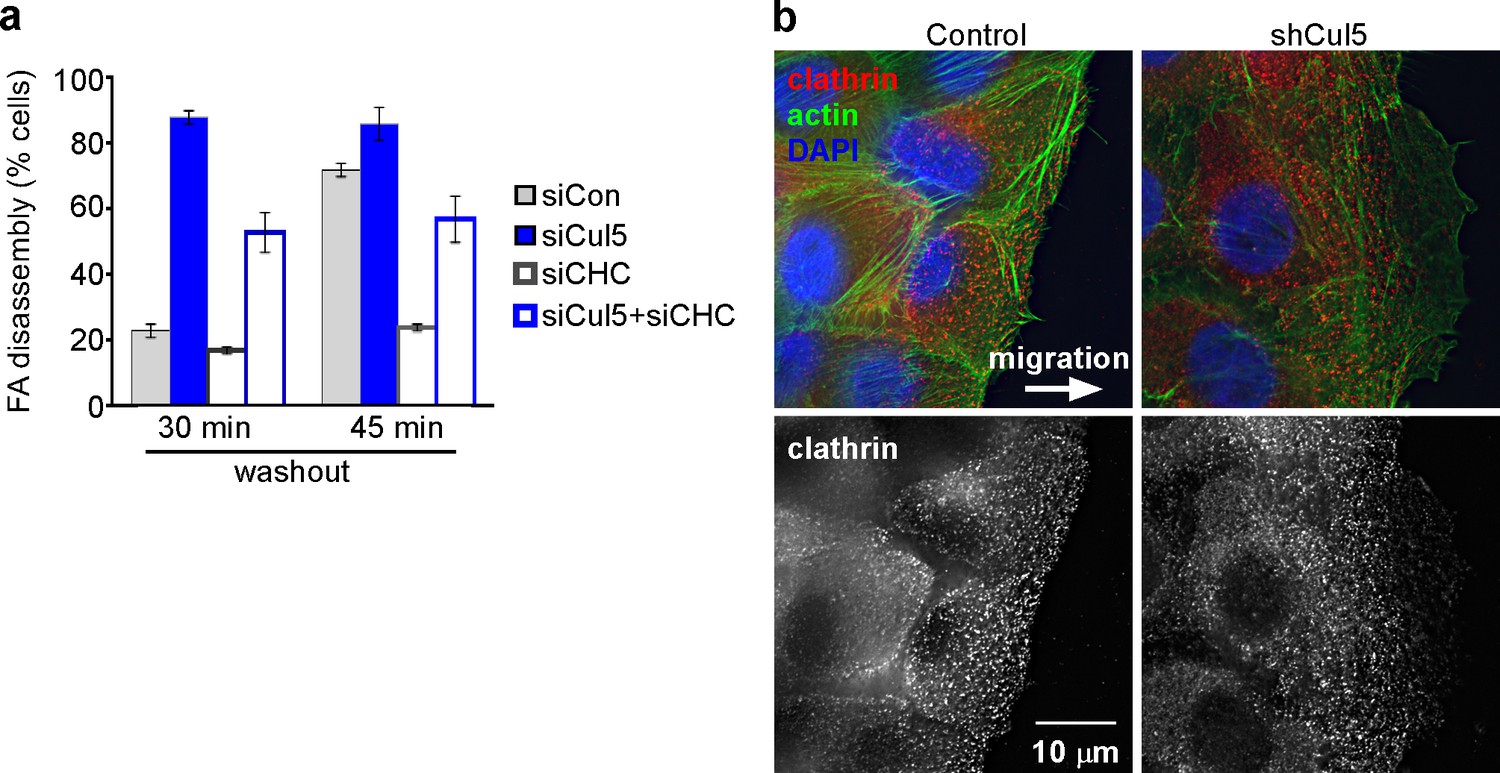
Adhesion turnover in Cul5-deficient cells is not regulated by clathrin-mediated endocytosis.
(a) HeLa cells were treated with control, Cul5 or clathrin heavy chain (CHC) siRNA and subject to the nocodazole washout assay for FA disassembly as in Figure 2. Mean and standard error of two biologically-independent experiments. CHC was required for the delayed FA disassembly in Cul5-proficient cells but was largely dispensable for the accelerated disassembly in Cul5-deficient cells. (b) Localization of CHC in migrating MCF10A shCul5 cells. Immuofluorescence for CHC (red), F-actin (green) and nucleus (blue) in migrating control and Cul5-deficient MCF10A cells. Deconvolution microscopy, ventral section. Note the low numbers of clathrin-coated structures in the leading lamellipodium of Cul5-deficient cells.
Figure 3 with 1 supplement
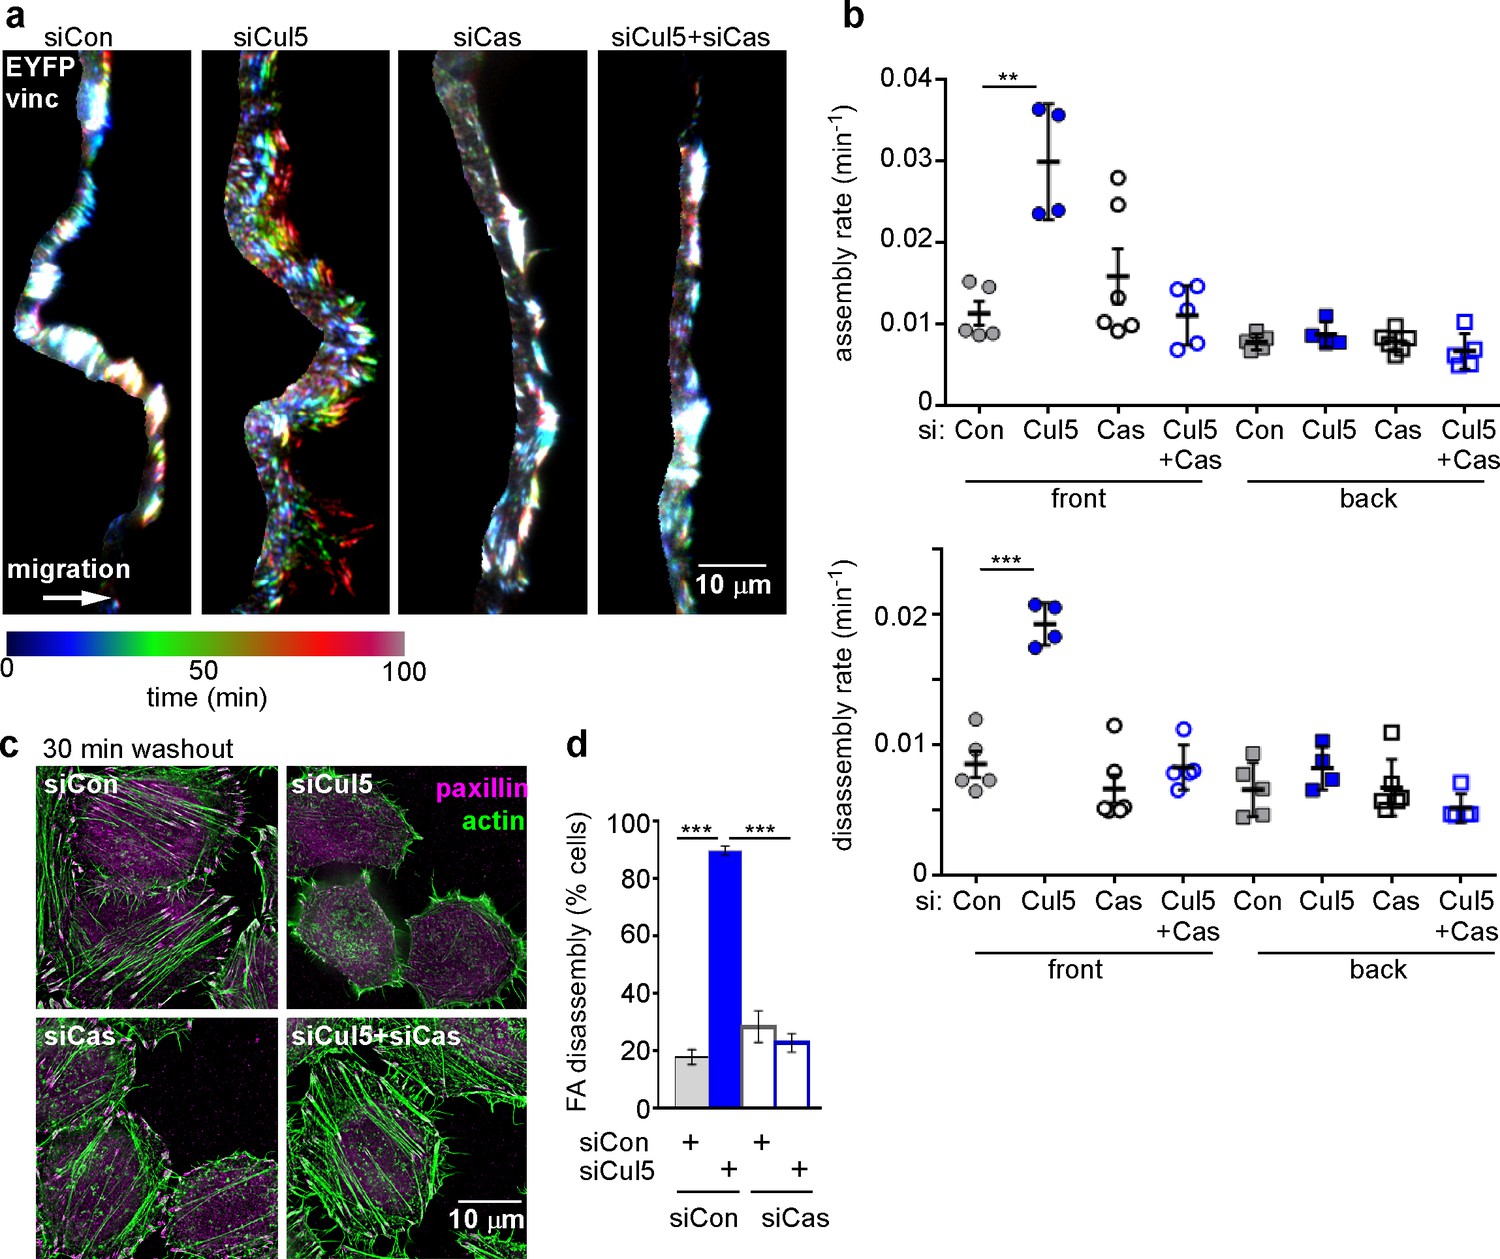
Cul5-mediated FA turnover at the leading edge is regulated by Cas.
Focal adhesion dynamics of MCF10A cells migrating into a scratch wound in EGF-deficient medium, monitored using EYFP-vinculin and TIRF microscopy. (a) Rainbow color representation of FA appearance and disappearance at the front of control, Cul5-deficient, Cas-deficient, and Cul5-Cas-deficient cells. (b) FA assembly and disassembly rate constants from the front and back. Mean and standard error of median rates from each of 4–6 time-lapse movies are indicated. ***p<0.001. Student’s t-test, two tailed, unequal variance. (c,d) Nocodazole washout assay as in Figure 2. (c) Images (deconvolution microscopy, ventral section) and (d) quantification of FA disassembly in cells depleted for Cul5 and Cas. Cas was required for the accelerated FA disassembly in Cul5-deficient cells. Mean and standard error of three biologically-independent experiments. ***p<0.001.
Figure 3—figure supplement 1
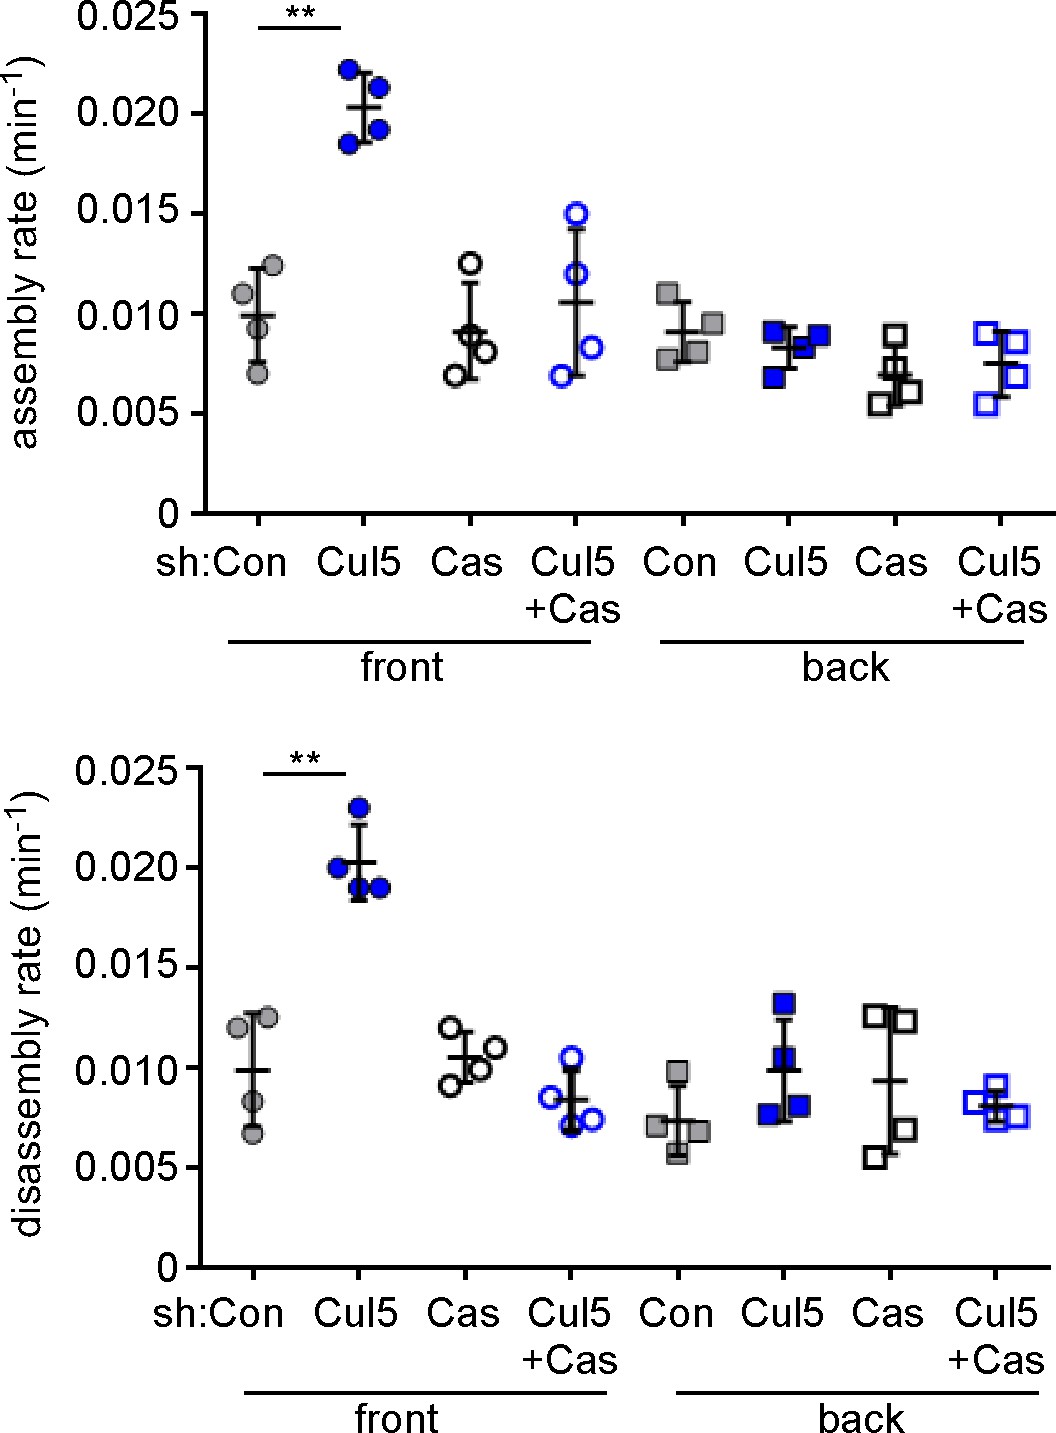
Specificity controls for Cul5 and Cas knockdown.
Focal adhesion dynamics of stable vector, shCul5, shCas and shCul5/shCas EYFP-vinculin-expressing MCF10A cells migrating into a scratch wound in EGF-deficient medium. FA assembly and disassembly rate constants from the front 6 µm and back of leading cells. Mean and standard error of median rates from each of four time-lapse movies are indicated. **p<0.01. Student’s t-test, two tailed, unequal variance.
Figure 4 with 2 supplements
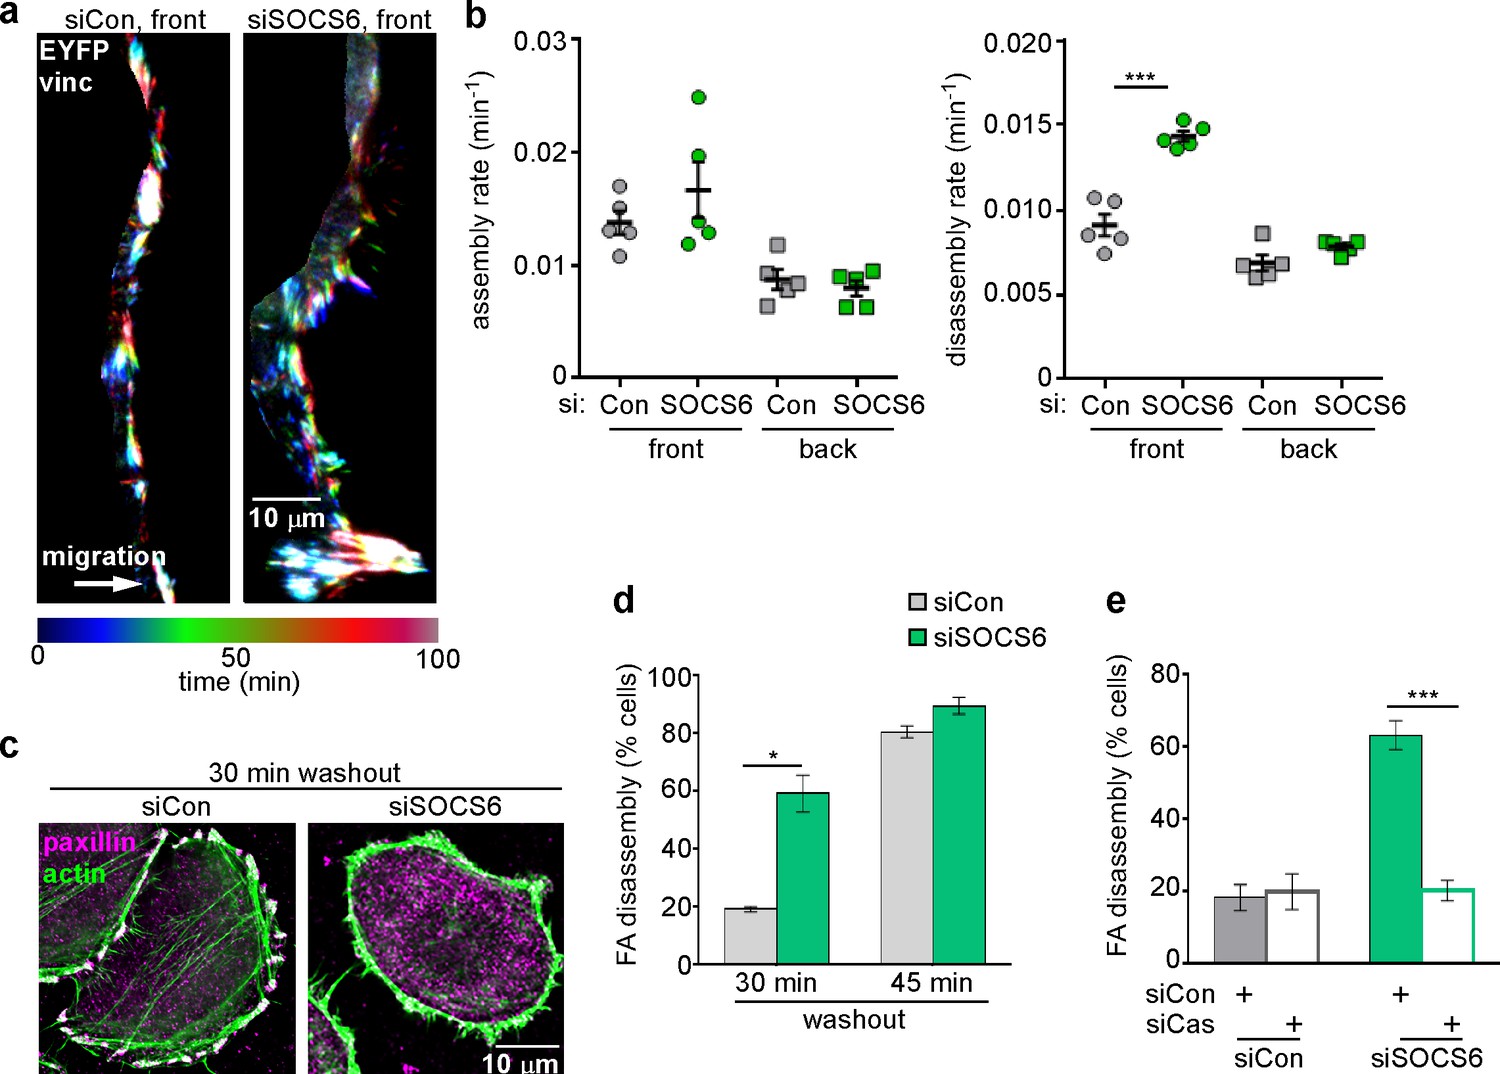
FA disassembly in migrating cells is regulated by SOCS6.
Focal adhesion dynamics of MCF10A cells migrating into a scratch wound in EGF-deficient medium, monitored using EYFP-vinculin and TIRF microscopy. (a) Rainbow color representation of FA appearance and disappearance at the front of control and SOCS6-deficient cells. (b) FA assembly and disassembly rate constants from the front (circles) and back (squares) of control (gray) and SOCS6-deficient (green) cells. Mean and standard error of median rates from each of five time-lapse movies are indicated. ***p<0.001. Student’s t-test, two tailed, unequal variance. (c–e) Nocodazole washout assay as in Figure 2. (c) Staining for paxillin and F-actin in control and SOCS6-deficient HeLa cells 30 min after nocodazole washout reveals accelerated disassembly in SOCS6-deficient cells. Deconvolution microscopy, ventral section. (d) Quantification of FA disassembly in cells depleted for SOCS6. Mean and standard error of three biologically-independent experiments. *p<0.05. (e) Quantification of FA disassembly in cells depleted for SOCS6 and Cas. Cas was required for the accelerated FA disassembly in SOCS6-deficient cells. Mean and standard error of three biologically-independent experiments. ***p<0.001.
Figure 4—figure supplement 1
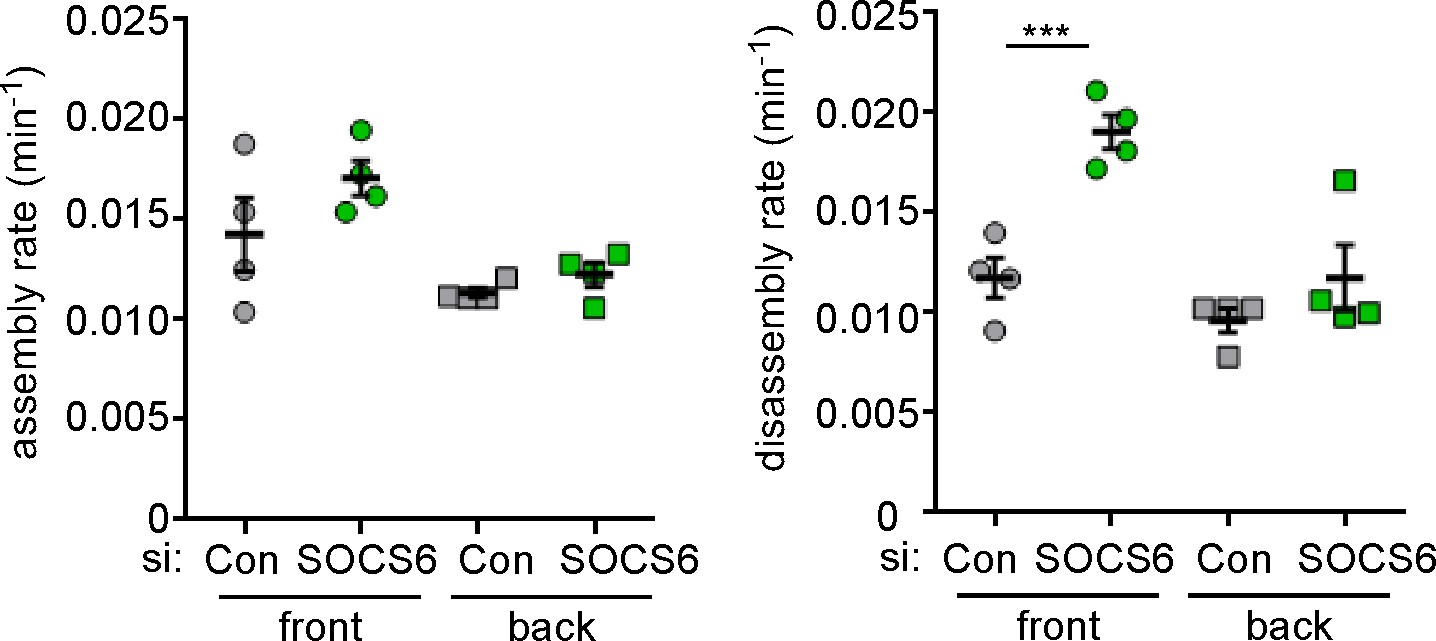
Specificity of SOCS6 knockdown in MCF10A cells.
To control for off-target effects, MCF10A cells were treated with an independent pool of siRNAs against SOCS6 before analysis as in Figure 4b. ***p<0.001. Student’s t-test, two tailed, unequal variance.
Figure 4—figure supplement 2
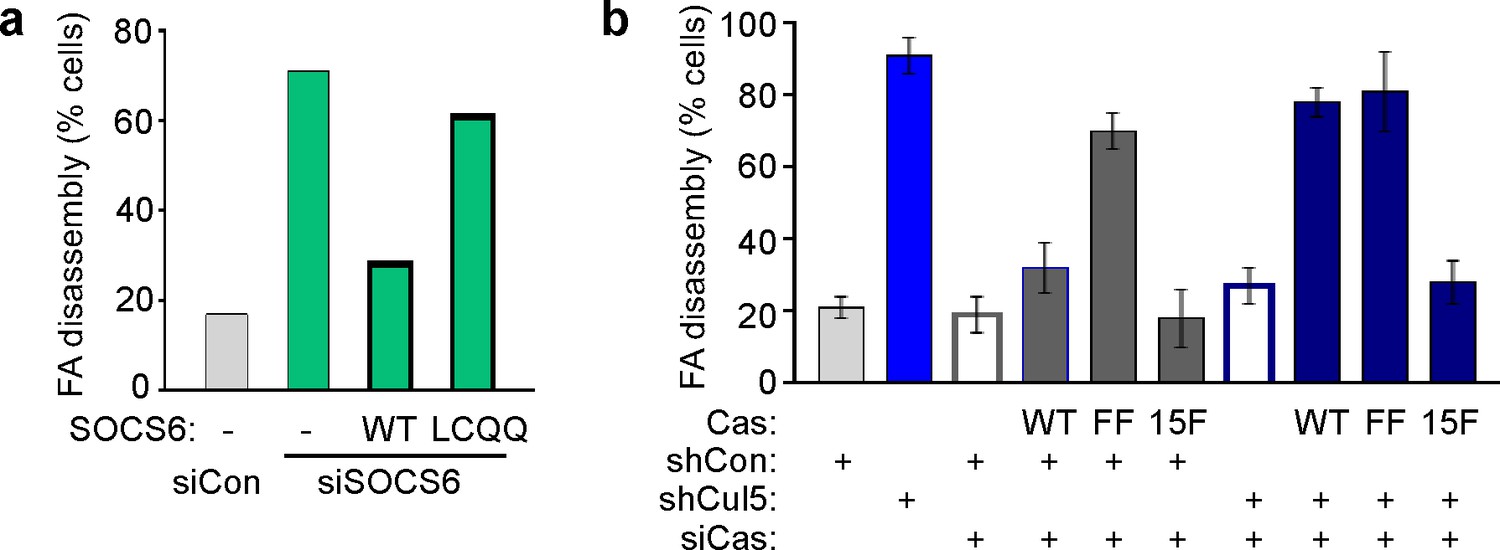
Regulation of FA disassembly requires SOCS6 interaction with CRL5 and Cas.
Microtubule-dependent FA disassembly was assayed in transfected HeLa cells, scoring the percent of cells lacking FAs at 30 min after nocodazole reversal. (a) Rescue of normal FA disassembly by expression of siRNA-resistant mouse SOCS6 wildtype (WT) but not by SOCS box mutant LCQQ. (b) Expression of CasFF, a mutant that does not bind SOCS6, stimulates FA disassembly independent of Cul5, while wildtype Cas only stimulates disassembly when Cul5 is absent and Cas15F, which is unable to bind downstream signaling molecules, is inactive. Mean and standard deviation of two experiments.
Figure 5 with 3 supplements
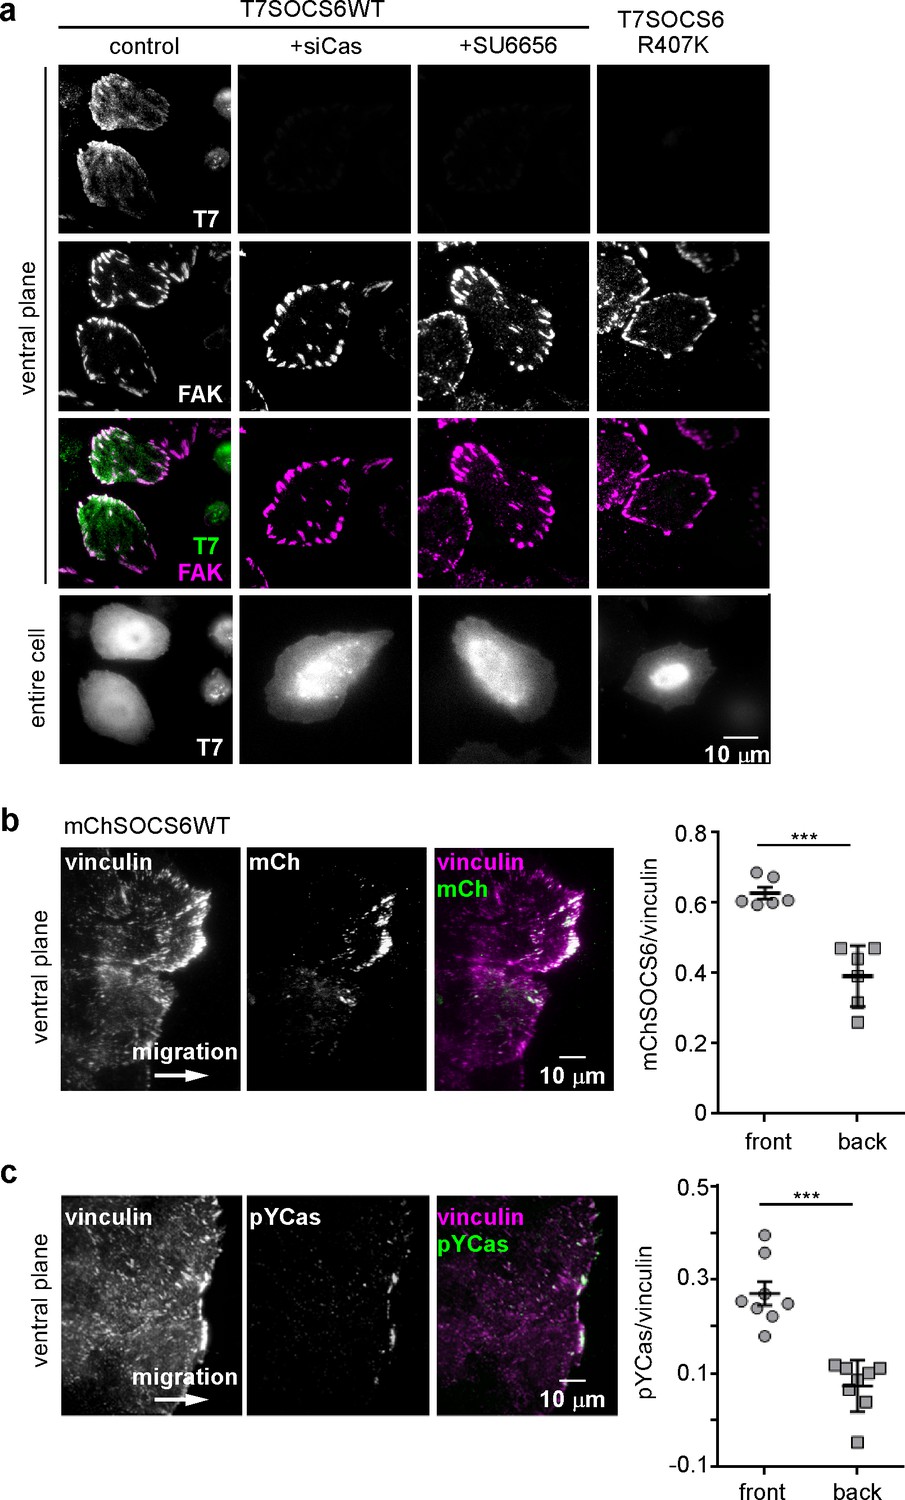
SOCS6 localizes to adhesion sites dependent on pYCas.
(a) SOCS6 localization to FAs requires Cas, SFK activity, and a functional SH2 domain. HeLa cells were transiently transfected with T7-tagged wildtype (WT) or SH2 domain mutant (R407K) SOCS6, treated with or without Cas siRNA, and plated on collagen IV, serum-starved, and incubated with nocodazole for 3 hr to stabilize FAs. One sample was treated with SFK inhibitor SU6656 (10 μM) during nocodazole treatment. Fixed cells were stained with antibodies to T7 (green) and FAK (magenta). Images were collected from the ventral plane using TIRF microscopy, and from the entire cell using epifluorescence. (b,c) SOCS6 and pYCas localization in migrating MCF10A cells. (b) MCF10A cells stably expressing mCherry-tagged SOCS6 (mChS6) were allowed to reach confluence, wounded, and allowed to migrate in the absence of EGF. 5 µM MLN4924 was added at the time of wounding and washed off 6 hr later. Cells were fixed 2 hr later and stained with antibodies against vinculin (magenta). Images were collected using TIRF microscopy. The mean ratio of mCherry to vinculin integrated intensity was calculated for 135 FAs at the front and 528 FAs at the back in ~12 cells in two separate experiments. (c) MCF10A cells were allowed to reach confluence, wounded, and allowed to migrate in the absence of EGF. Cells were stained with antibodies against vinculin (magenta) and pYCas (green). Images were collected using TIRF microscopy. The mean ratio of pYCas to vinculin integrated intensity was calculated for 153 FAs at the front and 896 FAs at the back in ~16 cells in two separate experiments.
Figure 5—figure supplement 1

Focal adhesion localization of SOCS6.
HeLa cells were transiently transfected to express T7-epitope tagged mouse SOCS6 or vector (truncated GFP), plated on collagen IV, serum-starved, and incubated with nocodazole to stabilize FAs. Fixed cells were stained with antibodies to T7 (green) and FAK (magenta). Images were collected from the ventral plane using TIRF microscopy, and from the entire cell using epifluorescence.
Figure 5—figure supplement 2
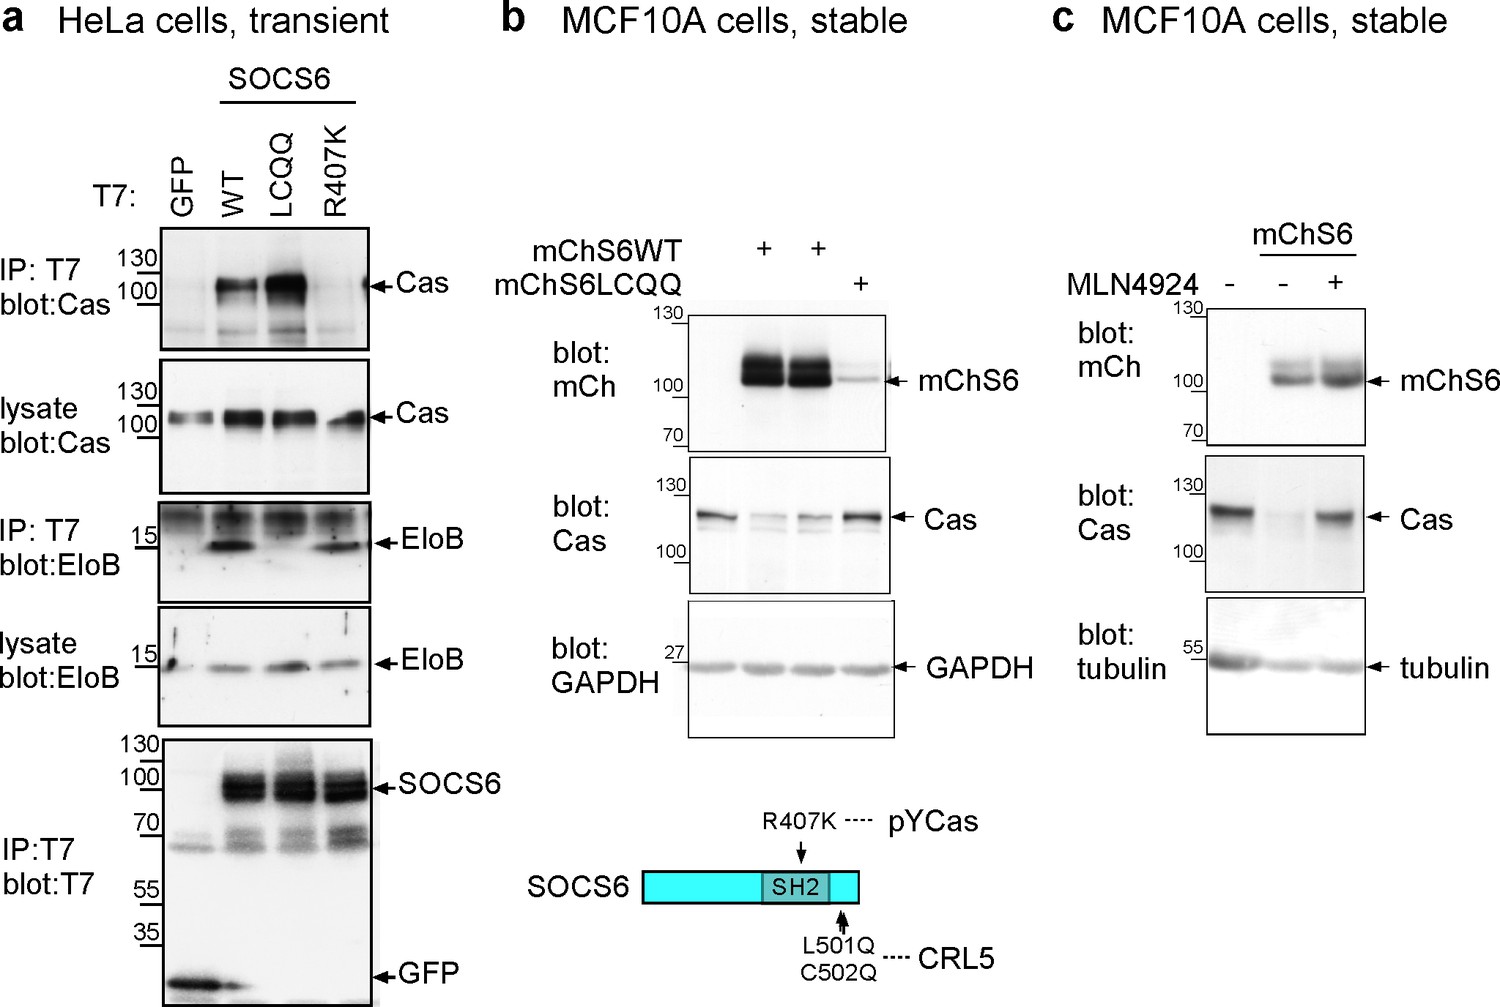
Characterization of SOCS6 mutants.
(a) Transient expression of T7-tagged wildtype (WT) or mutant SOCS6 in HeLa cells. Anti-T7 antibody immunoprecipitates and cell lysates were analyzed by Western blotting with antibodies to Cas, ElonginB and T7. Mutation of the SOCS box (LC to QQ) prevents binding of SOCS6 to ElonginB (CRL5) but not Cas, whereas mutation of the SH2 domain (R407K) prevents binding of SOCS6 to Cas but not ElonginB. (b,c) Stable expression of mCherry-tagged (WT) or SOCS box mutant (LCQQ) in MCF10A cells. (b) Steady state levels of mChSOCS6 and Cas in two independent cell lines expressing mChSOCS6WT and one line expressing mChSOCS6LCQQ. Note that mChSOCS6WT inhibits expression of endogenous Cas while mChSOCS6LCQQ is poorly expressed. (c) Partial rescue of Cas levels in cells expressing mChSOCS6WT by treatment with MLN4924 for 6 hr and washout for 2 hr.
Figure 5—figure supplement 3

Cul5 knockdown increases pYCas in FAs.
(a) HeLa cells, stably knocked down for Cul5 with shRNA, were plated on collagen IV, serum-starved, and treated with nocodazole to stabilize FAs. Cells were stained for paxillin (magenta) and pYCas (green). The mean ratio of pYCas to paxillin intensity (integrated) was calculated for 1343 FAs in ~20 control and 1502 FAs in ~20 Cul5-deficient cells. (b) MCF10A cells, stably knocked down for Cul5 with shRNA, were allowed to reach confluence, wounded, and allowed to migrate in the absence of EGF. Cells were stained for vinculin (magenta) and pYCas (green). The mean ratio of pYCas to vinculin intensity (integrated) was calculated for >700 FAs (front) and >2000 FAs (back) of ~12 cells for each condition.
Figure 6 with 1 supplement

SOCS6, Cullin and proteasome activity are required during FA disassembly
(a) Light-regulated localization of SOCS6. (b) Localization of CRY2mChS6 in nocodazole-treated HeLa cells. In the dark, CRY2mChS6 was detected in the cytosol as well as co-localizing with FAK in FAs. However, under blue light illumination, CRY2mChS6 co-localized with CIBNGFPmito at the mitochondria and was not detected in FAs. Entire cell: z-projection, Deconvolution microscopy; ventral section: single plane, TIRF. (c) SOCS6 slows FA disassembly only if it has access to FAs during the disassembly process. Cells were plated on collagen IV-coated coverslips, serum-starved overnight, and incubated with nocodazole for 3 hr to induce microtubule disassembly and stabilize FAs. Cells were either kept in the dark during all steps of the assay or illuminated with blue light for 30 min before and during nocodazole washout (‘light’). Cells expressing both CRY2mChS6 and CIBNGFPmito were identified by epifluorescence and FA disassembly scored by immunofluorescence for FAK. Mean and standard deviation of three biologically independent experiments. *p<0.05; ***p<0.001. (d) Brief treatment with Cullin inhibitor MLN4924 or proteasome inhibitor epoxomicin stimulates FA disassembly. Nocodazole washout assay as in Figure 2. Cells were treated with 5 µM MLN4924 or 10 µM epoxomicin 1 hr before washout. Mean and standard deviation of three biologically independent experiments. ***p<0.001
Figure 6—figure supplement 1
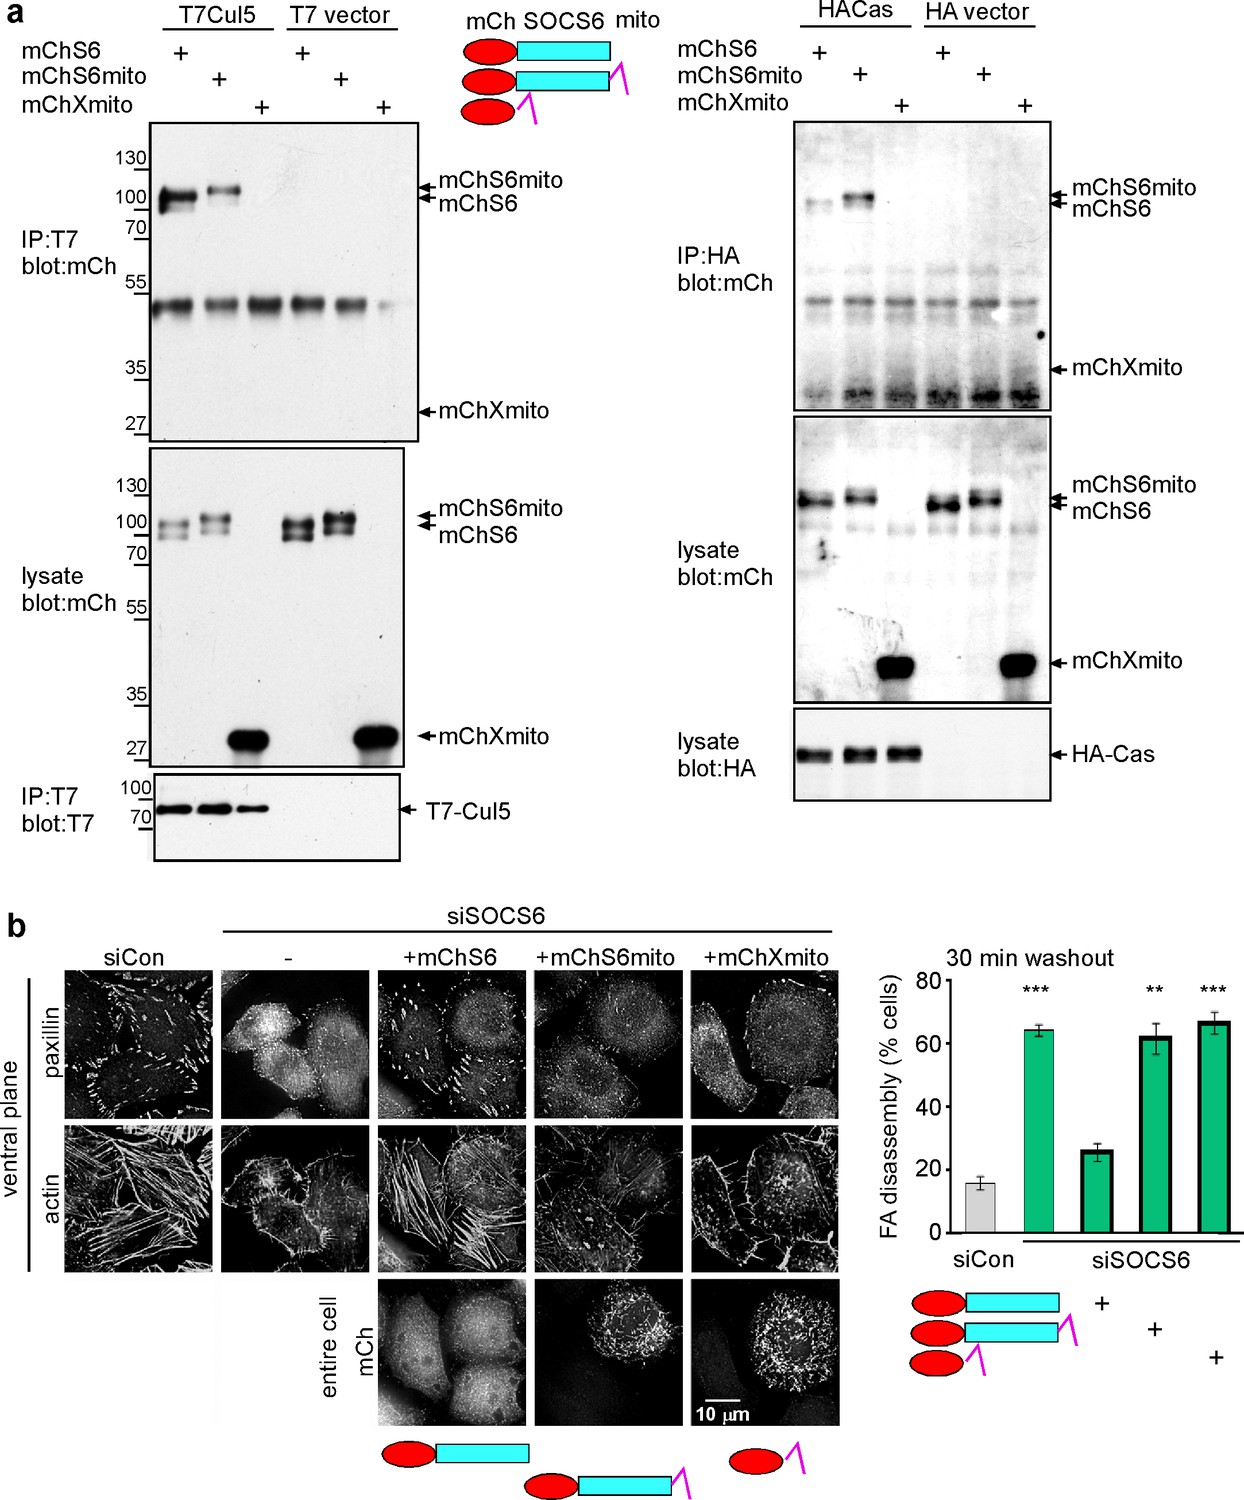
Restricting the access of SOCS6 to FAs speeds FA disassembly.
(a) Biochemical properties of mitochondrial-targeted SOCS6. Plasmids encoding mCherry-SOCS6 (mChS6), mCherry-SOCS6-mito (mChS6mito) or mCherry-mito (mChXmito) were transiently transfected into HeLa cells together with (left) T7-tagged Cul5KR (mutated to inhibit Cullin activity) or (right) HA-tagged Cas. Following 30 min stimulation with 2 mM pervanadate to inhibit tyrosine phosphatases, cell lysates were analyzed by immunoprecipitation and Western blotting. (b) Cytosolic mChS6 rescues normal rates of FA disassembly but mitochondrion-associated mChS6mito does not rescue. Sample images and quantification from a nocodazole washout assay. Mean and standard error of three biologically-independent experiments. ***p<0.001.
Figure 7
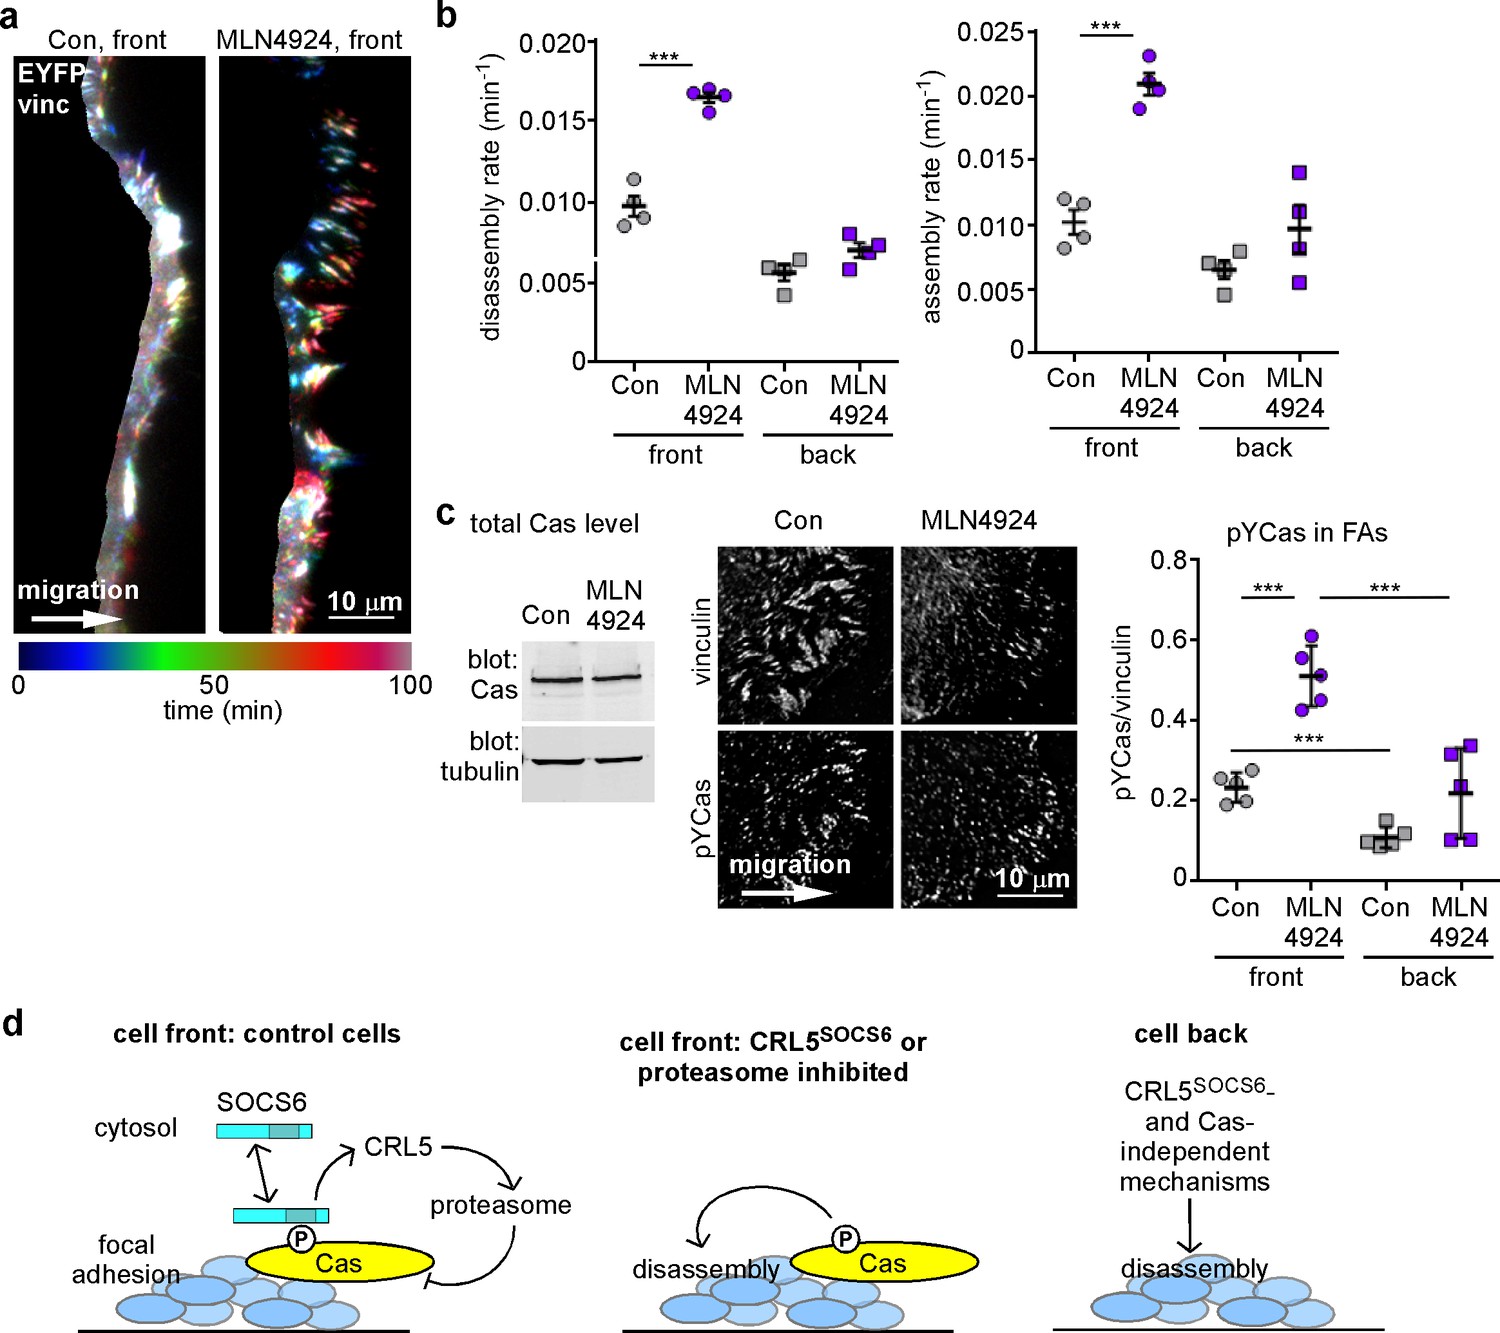
FA turnover is inhibited by Cullin and proteasome activity.
(a,b) Focal adhesion dynamics of control and MLN4924-treated MCF10A cells migrating into a scratch wound in EGF-deficient medium, monitored using EYFP-vinculin and TIRF microscopy. 5 µM MLN4924 was added to cells 2 hr before imaging. (a) Rainbow color representation of FA appearance and disappearance at the front of control and MLN4924-treated cells. (b) FA assembly and disassembly rate constants from the front (circles) and back (squares) of control (gray) and MLN4924-treated (purple) cells. Mean and standard error of median rates from each of four time-lapse movies are indicated. (c,d) MLN4924 increases pYCas locally in FAs at the leading edge but does not increase overall Cas levels. (c) Western blot of total cell lysate. 5 µM MLN4924 was added 4 hr before lysis. Cas was not increased on MLN4924 treatment. (d) MCF10A cells were allowed to reach confluence, wounded, and allowed to migrate in the absence of EGF. 5 µM MLN4924 was added to cells 4 hr before fixing. Cells were stained with antibodies against vinculin and pYCas. Deconvolution microscopy, ventral section. The mean ratio of pYCas to vinculin intensity (integrated) was calculated for >500 FAs at the front and >1800 FAs at the back in ~16 cells for each condition. (e) Summary model. Cas is phosphorylated specifically in FAs at the front of the cell. SOCS6 binds to pYCas in the FAs and locally inhibits pYCas via CRL5 and the proteasome. In cells lacking SOCS6 or Cul5, or in which SOCS6 cannot access FAs or cullins or the proteasome is inhibited, then pYCas stimulates FA disassembly, dependent on microtubules (MTs). In other parts of the cell, slow FA disassembly may occur by MT and clathrin-dependent mechanisms.
Videos
Video 1
EYFP-vinculin in migrating MCF10A cells (siCon) imaged every 2 min on a 100× TIRF objective, starting approximately 6 hr after wounding.
Length of movie 120 min.
Video 2
EYFP-vinculin in migrating MCF10A cells (siCul5) imaged every 2 min on a 100× TIRF objective, starting approximately 6 hr after wounding.
Length of movie 120 min.
Tables
Table 1
Summary of first-order rate constants for FA assembly and disassembly.
Conditions | Region | Assembly | Disassembly | # of movies | # of FAs |
|---|---|---|---|---|---|
(X 10−2 min−1) | (X 10−2 min−1) | ||||
siCon | front | 1.3 (±0.2) | 0.8 (±0.03) | 4 | 64 |
| siCul5 | front | 2.9 (±0.1) p=0.0002 | 2.1 (±0.9) p=0.00004 | 6 | 263 |
siCon | back | 1.2 (±0.2) | 0.9 (±0.1) | 4 | 667 |
siCul5 | back | 1.3 (±0.05) | 1.3 (±0.5) p=0.04 | 6 | 811 |
siCon | front | 1.1 (±0.1) | 0.8 (±0.1) | 5 | 142 |
siCul5 | front | 3.0 (±0.4) p=0.008 | 1.9 (±0.08) p=0.00008 | 4 | 444 |
siCas | front | 1.6 (±0.3) | 0.7 (±0.1) | 6 | 151 |
siCul5+siCas | front | 1.1 (±0.2) | 0.8 (±0.07) | 5 | 137 |
siCon | back | 0.8 (±0.04) | 0.7 (±0.09) | 5 | 632 |
siCul5 | back | 0.9 (±0.08) | 0.8 (±0.08) | 4 | 505 |
siCas | back | 0.8 (±0.05) | 0.6 (±0.08) | 6 | 484 |
siCul5+siCas | back | 0.7 (±0.1) | 0.5 (±0.05) | 5 | 541 |
shCon | front | 1.0 (±0.1) | 1.0 (±0.1) | 4 | 105 |
shCul5 | front | 2.0 (±0.1) p=0.0012 | 2.0 (±0.09) p=0.0015 | 4 | 217 |
shCas | front | 0.9 (±0.1) | 1.0 (±0.06) | 4 | 126 |
shCul5+shCas | front | 1.0 (±0.2) | 0.8 (±0.07) | 4 | 152 |
shCon | back | 0.9 (±0.06) | 0.7 (±0.8) | 4 | 701 |
shCul5 | back | 0.8 (±0.04) | 0.9 (±0.1) | 4 | 497 |
shCas | back | 0.6 (±0.06) | 0.9 (±0.1) | 4 | 559 |
shCul5+shCas | back | 0.7 (±0.1) | 0.8 (±0.4) | 4 | 608 |
siCon | front | 1.4 (±0.1) | 0.9 (±0.06) | 5 | 185 |
siSOCS6 | front | 1.7 (±0.2) | 1.4 (±0.03) p=0.0004 | 5 | 201 |
siCon | back | 0.9 (±0.09) | 0.7 (±0.04) | 5 | 620 |
siSOCS6 | back | 0.8 (±0.07) | 0.8 (±0.01) | 5 | 469 |
siCon | front | 1.4 (±0.2) | 1.0 (±0.1) | 4 | 254 |
siSOCS6 (alternate) | front | 1.7 (±0.08) | 1.9 (±0.08) p=0.0007 | 4 | 179 |
siCon | back | 1.1 (±0.02) | 1.0 (±0.06) | 4 | 640 |
siSOCS6 (alternate) | back | 1.2 (±0.05) | 1.2 (±0.1) | 4 | 600 |
Con | front | 1.0 (±0.09) | 1.0 (±0.06) | 4 | 76 |
MLN4924 | front | 2.0 (±0.08) p=0.00016 | 1.6 (±0.03) p=0.0004 | 4 | 111 |
Con | back | 0.6 (±0.07) | 0.6 (±0.05) | 4 | 182 |
MLN4924 | back | 1.0 (±0.2) | 0.7 (±0.04) | 4 | 293 |
-
Rate constants are reported as mean ± SEM
Table 2
Target sequences and sources of si and shRNA constructs.
| Reagent | Target | Source |
|---|---|---|
| Cul5 shRNA | 5'-GCTGCAGACTGAATTAGTAG-3' | (Teckchandani et al., 2014) |
| Cul5 siRNA pool | 5'-GACACGACGTCTTATATTA-3' 5'-CGTCTAATCTGTTAAAGAA-3' 5'-GATGATACGGCTTTGCTAA-3' 5'-GTTCAACTACGAATACTAA-3' | GE Dharmacon, Lafayette, CO |
| Cas shRNA | 5'-GGTCGACAGTGGTGTGTA-3' | (Teckchandani et al., 2014) |
| Cas siRNA pool | 5'-AAGCAGTTTGAACGACTGGA-3' 5'-CTGGATGGAGGACTATGACTA-3' 5'-CCAGGAATCTGTATATATTTA-3' 5'-CAACCTGACCACACTGACCAA-3'* | Qiagen |
| SOCS6 siRNA pool | 5'-CAGCTGCGATATCAACGGTGA-3' 5'-TAGAATCGTGAATTGACATAA-3' 5'-CGGGTACAAATTGGCATAACA-3' 5'-TTGATCTAATTGAGCATTCAA-3' | Qiagen |
| SOCS6 siRNA pool (alternate)† | 5'-GAACATGTGCCTGTCGTTA-3' 5'-GAAAGTATGCGCTGTCATT-3' 5'-TTTAAGCTTGAGCTTTCGCTC-3' | GE Dharmacon Thermo Fisher Scientific |
| CHC siRNA pool | 5'-GAAAGAATCTGTAGAGAAATT-3' 5'-GCAATGAGCTGTTTGAAGATT-3' 5'-TGACAAAGGTGGATAAATTTT-3' 5'-GGAAATGGATCTCTTTGAATT-3' | GE Dharmacon |
| siConsh Scrm | 5'-AATTCTCCGAACGTGTCACGT-3' 5'-TCGAGCGAGGGCGACTTAACC-3 | Qiagen this paper |
-
*Also targets mouse Cas. Not used in rescue experiments
-
†Used in Figure 4—figure supplement 1.
Download links
A two-part list of links to download the article, or parts of the article, in various formats.
Downloads (link to download the article as PDF)
Open citations (links to open the citations from this article in various online reference manager services)
Cite this article (links to download the citations from this article in formats compatible with various reference manager tools)
The ubiquitin-proteasome system regulates focal adhesions at the leading edge of migrating cells
eLife 5:e17440.
https://doi.org/10.7554/eLife.17440


