Enforcement of developmental lineage specificity by transcription factor Oct1
- University of Utah School of Medicine, United States
- The Broad Institute of MIT and Harvard, United States
- Howard Hughes Medical Institute, Massachusetts Institute of Technology, United States
Figures
Figure 1 with 1 supplement
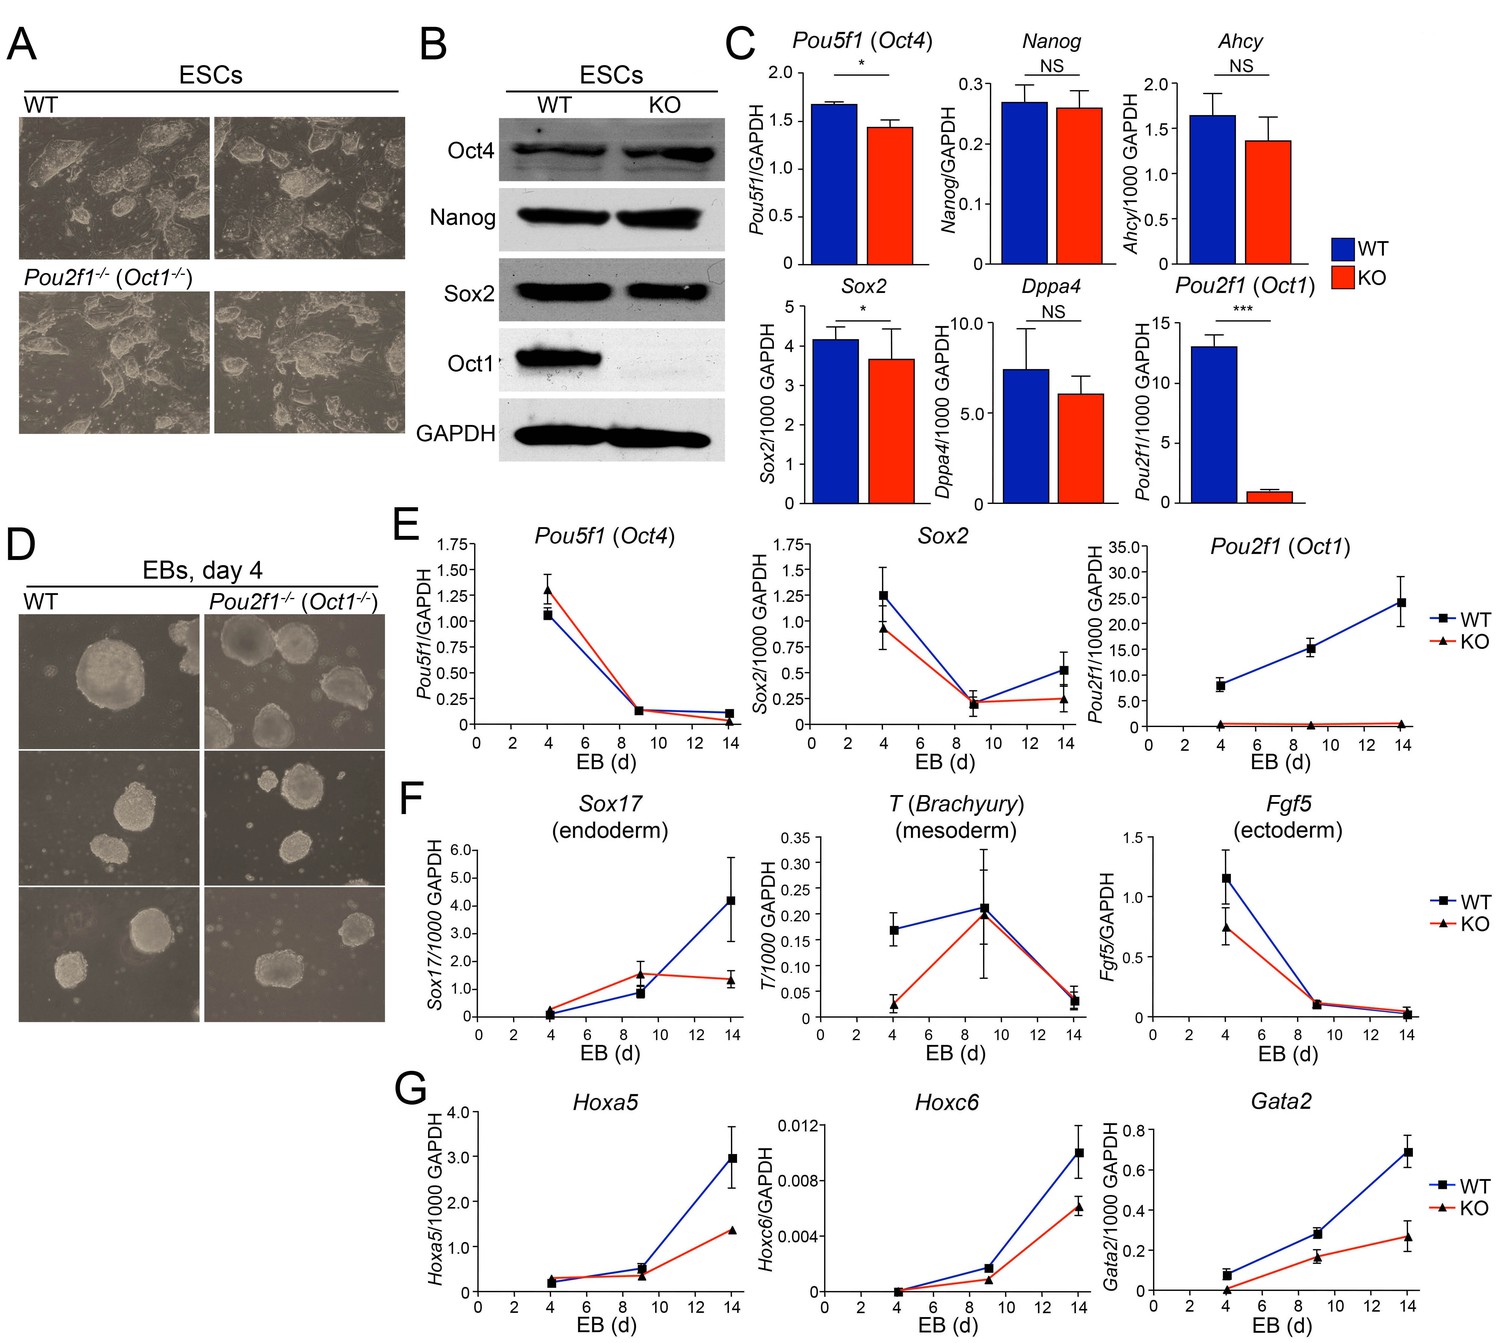
Abnormal developmental gene induction in ESCs lacking Oct1.
(A) Phase microscopy images of four ESC lines (two Oct1 deficient, two WT littermate controls) derived from Pou2f1-/+ intercrosses. Passage 5 ESCs on feeder fibroblasts are shown. (B) Immunoblot comparing lysates of a WT control line and littermate Oct1-deficient line. GAPDH is shown as a loading control. (C) mRNA expression of six genes in WT control and littermate Oct1-deficient ESC lines. Data were obtained by RT-qPCR using three biological replicates of a single line of each genotype. Error bars denote standard deviations. p-values: NS=non-significant, * < 0.05, ** < 0.01, *** < 0.001. (D) Phase microscopy images of 4-day EBs derived from ESCs ±Oct1. Three representative images of each genotype from wells of a 96-well plate are shown. (E) EBs were collected at 4, 9, and 14 days, and cDNA was prepared and subjected to RT-qPCR. Expression levels were normalized to GAPDH. Pluripotency genes (Pou5f1, Sox2) and Pou2f1 were tested. Three biological replicates were performed. Error bars denote ±standard deviation. (F) Additional genes representative of all three germ layers, Sox17, T ,and Fgf5, were tested as in E. (G) Three known poised Oct4 target genes, Hoxa5, Hoxc6, and Gata2, were tested as in E.
Figure 1—figure supplement 1

Abnormal morphology in differentiating Oct1-deficient cells manifests by day 5 of EB formation.
(A) Phase microscopy images of WT and Oct1-deficient ESCs aggregating into EBs. Top: 1 day of culture. Bottom: day 2. (B) Day 5. EBs are in low attachment dishes.
Figure 2 with 1 supplement
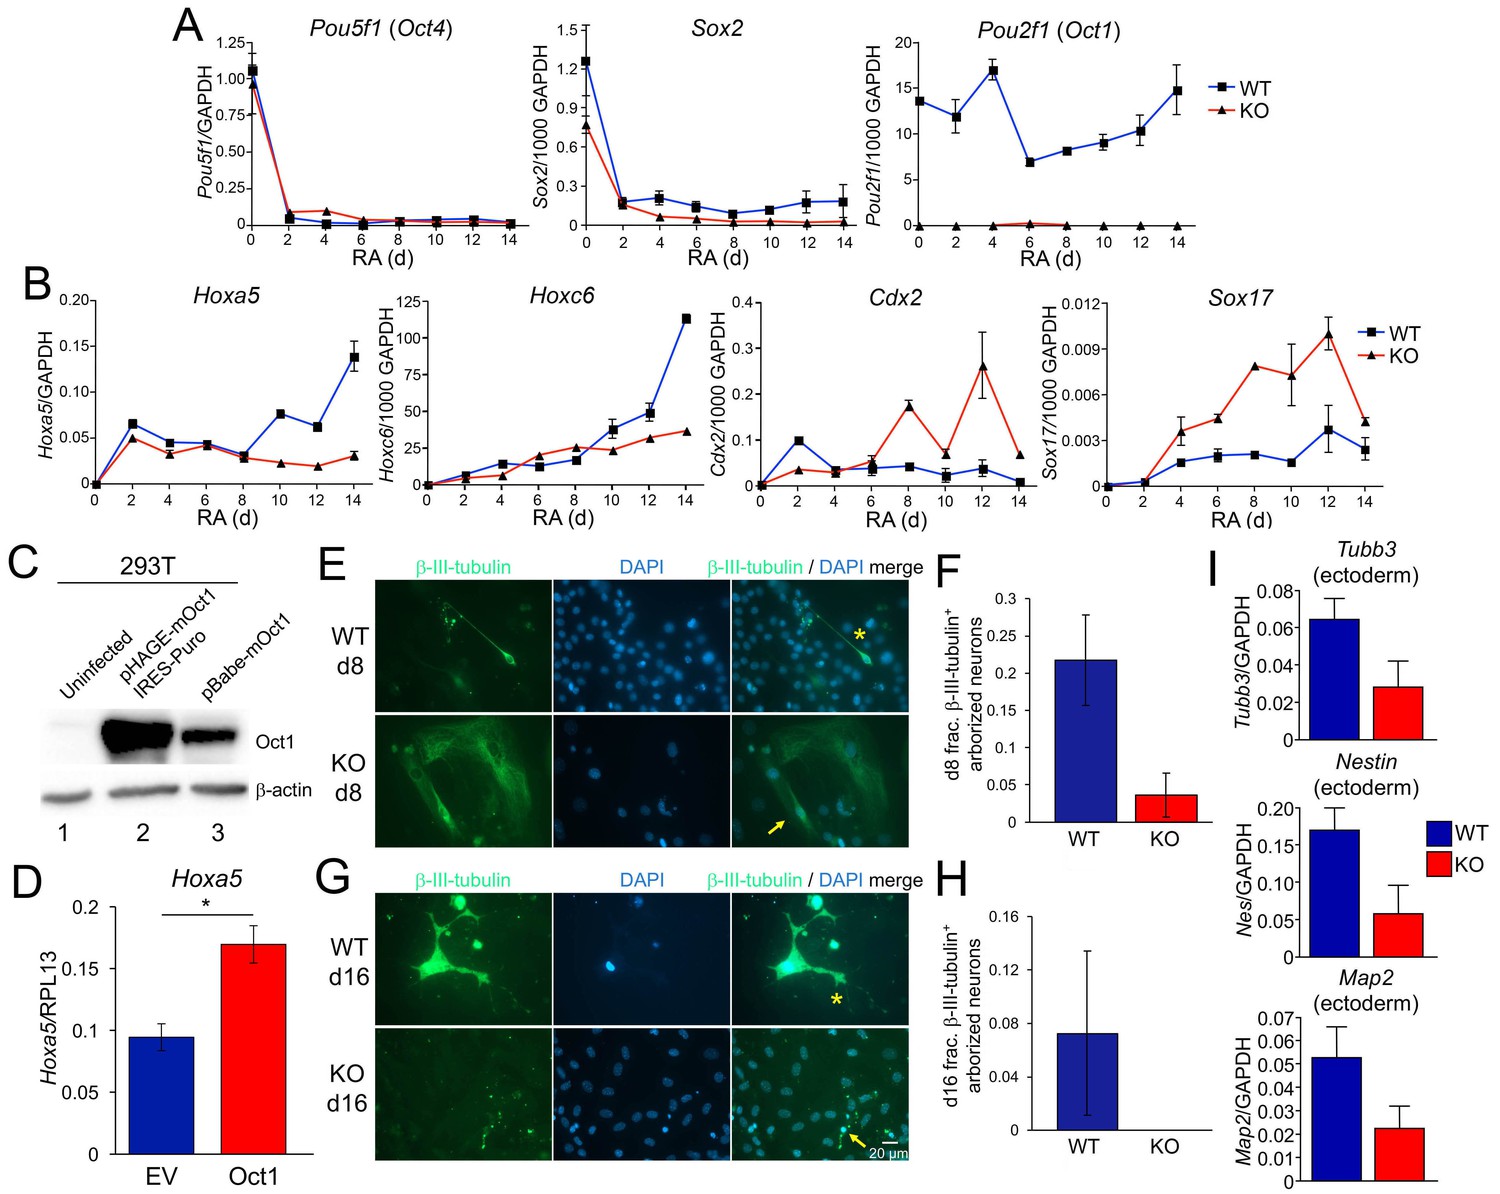
Effect of Oct1 loss on RA-mediated differentiation and neurogenesis.
(A) Quantitative RT-PCR results are shown for Pou5f1 (Oct4), Sox2, and Pou2f1 (Oct1) mRNA relative to a GAPDH standard. Average of three biological replicates ±standard deviation is shown. (B) Similar analysis performed for the Oct4 targets Hoxa5, Hoxc6, Cdx2, and Sox17. (C) 293 T cells were transiently transfected with a lentiviral vector (pHAGE) expressing mouse Oct1. Lysates were prepared 48 hr later and immunoblotted for Oct1. Un-transfected cells are shown as a negative control (lane 1). Oct1 is not visible in these cells because of the lightness of the exposure. The same cells transduced with a retroviral vector encoding Oct1 (lane 3) are shown as a positive control. β-actin is shown as a loading control. (D) Oct1-deficident ESCs were differentiated using RA for 14 days. 4 days into the timecourse, cells were infected with lentiviruses expressing Oct1 and a puromycin resistance cassette, or an empty vector (EV) control. Cells were selected with puromycin for the remainder of the timecourse. cDNAs from the endpoint cultured were used to study expression of Hoxa5 relative to an RPL13 ribosomal protein internal standard. Cells were prepared in triplicate for each condition. Error bars denote ±standard deviation. *denotes p<0.05. (E) Immunofluorescence images of WT and Oct1-deficient ESCs differentiated into neurons. Cells were cultured as EBs for 8 days, followed by culture for a further 8 days in neuralizing media (see Materials and methods). β-tubulin III and DAPI staining are shown. (F) Quantification of 300–400 cells from three individual differentiation experiments. Error bars denote ±standard deviation. (G) Similar to (E) except cells were cultured for eight additional d in neuralizing media. (H) Similar to (F) except using cells cultured for eight additional d. (I) 16 d-differentiated neuron cultures of similar genotypes were pooled and subjected to RT-qPCR using primers specific for Tubb3, Nestin, and Map2. Expression was assessed relative to GAPDH. Averages of three biological replicates are shown. Error bars denote ±standard deviation.
Figure 2—figure supplement 1
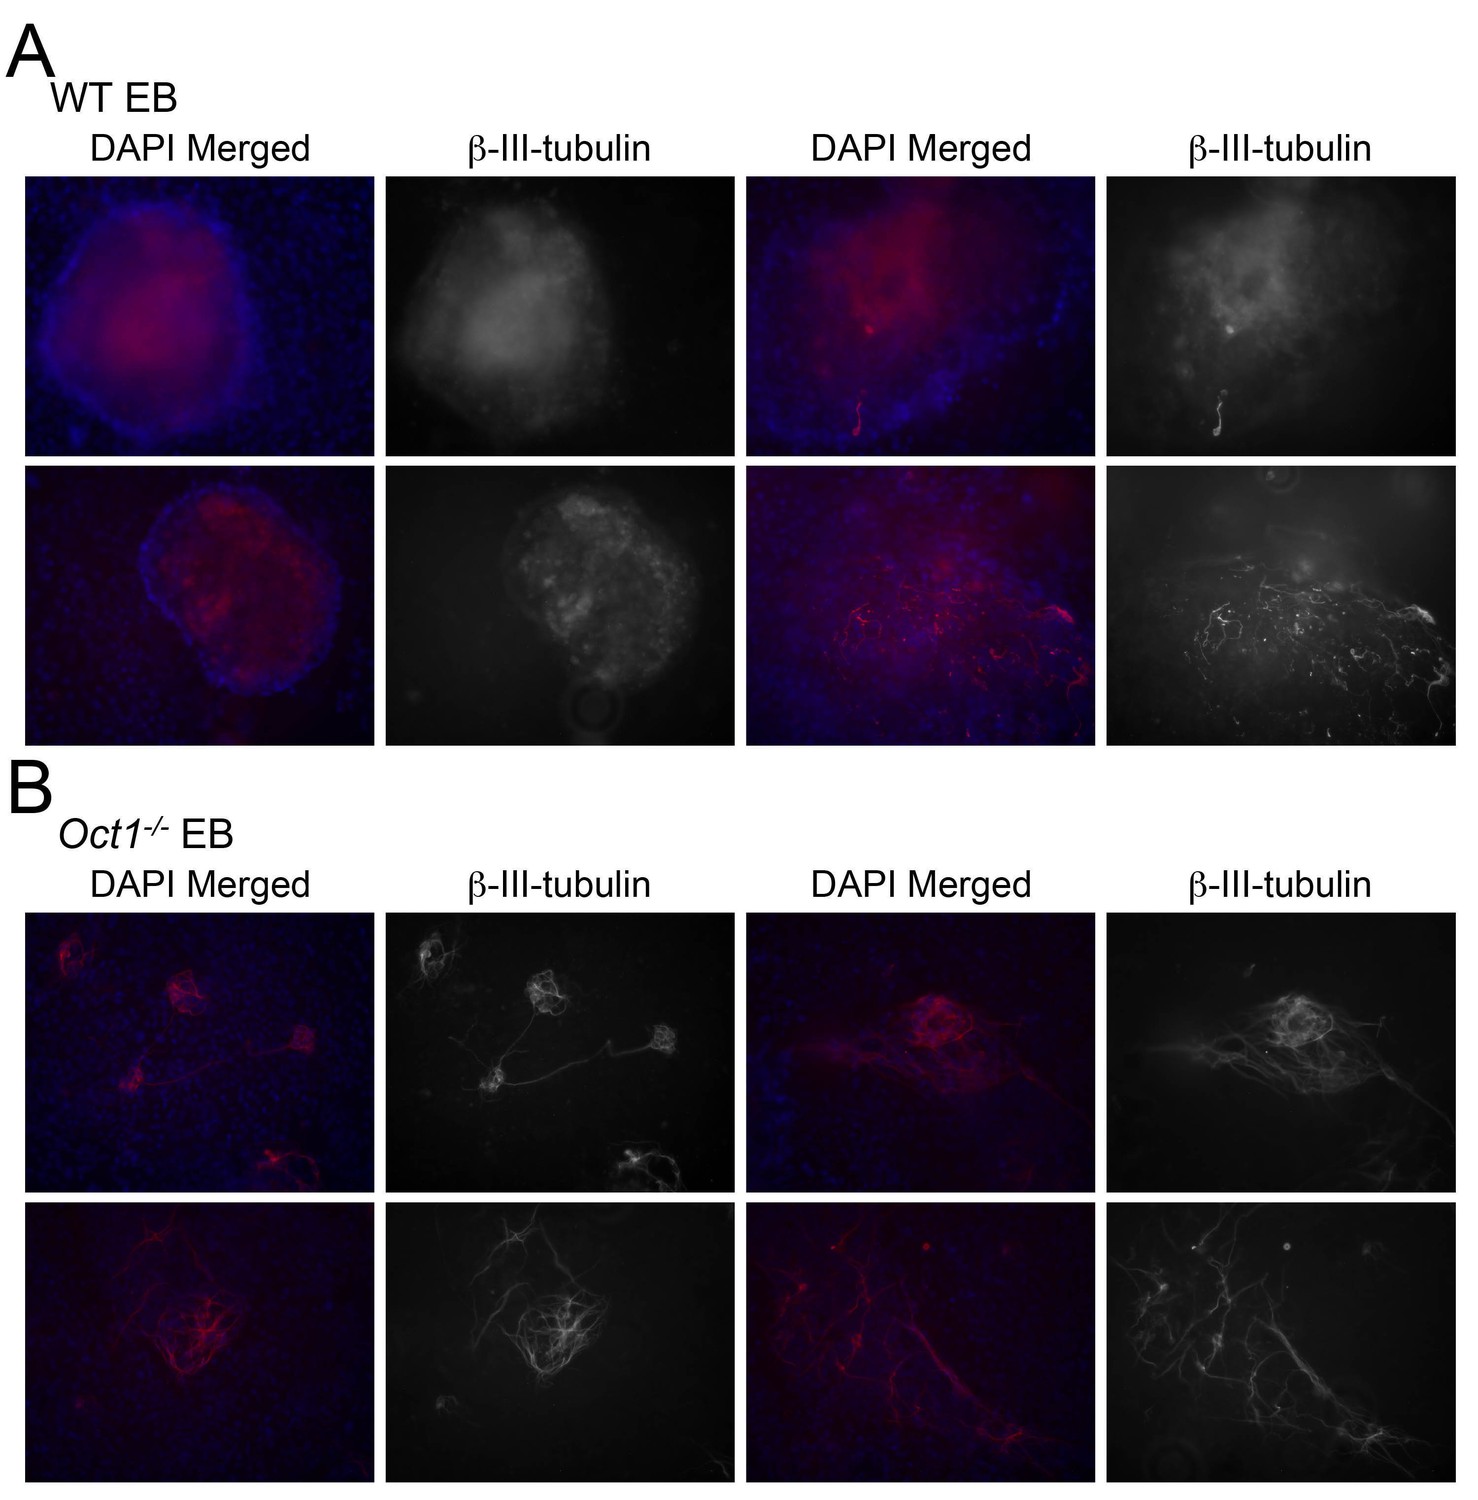
β-tubulin III staining of neuralizing WT and Oct1-deficient EBs.
(A) WT cells. (B) Oct1-deficient cells. Two day-old EBs were used.
Figure 3
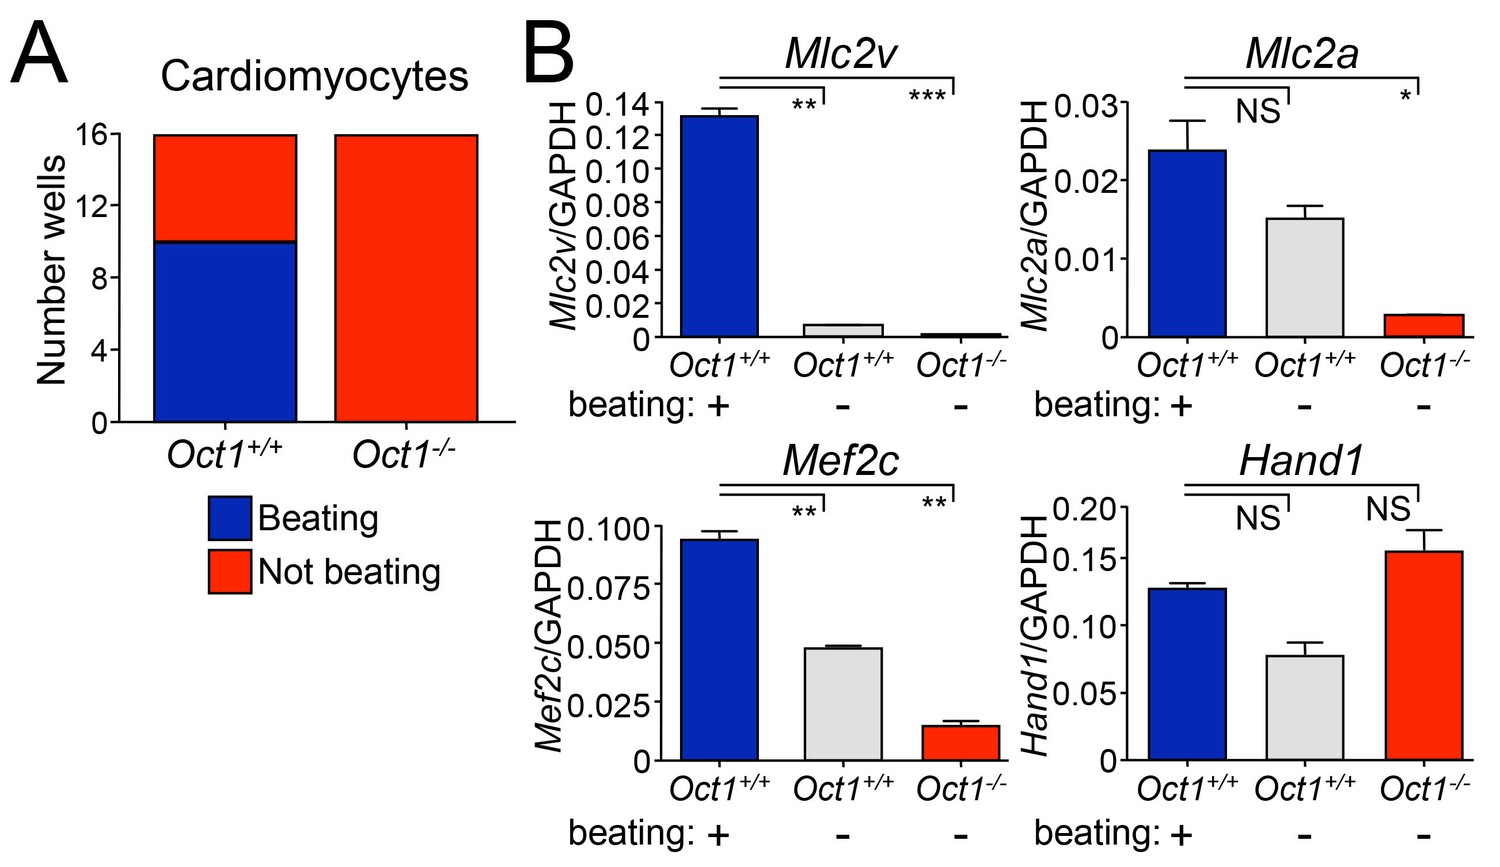
Defective cardiomyocyte differentiation in ESCs lacking Oct1.
(A) Cardiomyocytes were generated from individual EBs using 24-well dishes with gelatin. Functionality (±beating) was assessed for each well (16 per genotype) and plotted. (B) The wells assessed in (A) were pooled according to genotype and function (beating WT, non-beating WT and non-beating Oct1 deficient), cDNA was prepared and used for RT-qPCR using primers for Mlc2v, Mlc2a, Mef2c and Hand1. Averaged results from three replicates are shown. Error bars denote standard deviation. p-Values: NS=non-significant, * < 0.05, ** < 0.01, *** < 0.001.
Figure 4 with 2 supplements

Gene expression defects upon differentiation of Oct1 inducible-conditional ESCs.
(A) YFP-epifluorescence and phase microscopy images of inducible-conditional ESCs. Top: parent Pou2f1fl/fl cells were treated with 500 nM 4-OHT for 24 hr. A colony with good morphology and variegated YFP expression was picked, trypsinzed, replated and expanded. Bottom: derived Pou2f1Δ/Δ ESCs. (B) PCR genotyping of parent (C2) and derived (13-1, 13-2) lines. Feeder fibroblasts were depleted by two serial 1 hr platings on plastic. The residual WT band in lane two is due to feeder contamination. The rightmost lane (lane 4) shows control tail DNA from a Pou2f1fl/+ (top) or Pou2f1fl/Δ animal. (C) Epifluorescence and phase microscopy images of single colonies. Images were taken at the same magnification. (D) Immunoblots comparing lysates of vehicle-treated parent ESCs and derived KO cells. GAPDH is shown as a loading control. (E) Feeder-depleted ESCs were treated continuously with RA on gelatin-coated plates in the absence of LIF for 14 days. Media was changed every other day. cDNA was prepared every other day and used in RT-qPCR with primers against Pou5f1 and Sox2. Averages of three biological replicates ±standard deviation are shown. Methodologically, the experiments were performed identically to Figure 2A–B. (F) Additional RT-qPCR using primers against the Oct4 target genes Hoxa5, Hoxc6 and Cdx2. (G) Pou2f1Δ/Δ ESCs were differentiated into neurons as in Figure 2C–G by forming EBs for 8 days followed by 8 day in medium containing insulin, transferrin and selenium. Cells were fixed and used for immunofluorescence using DAPI and antibodies against YFP and β-tubulin III. (H) Immunofluorescence images were quantified based on arborized morphology. Approximately 700 total cells were analyzed. (I) Similar to (G) except parent Pou2f1fl/fl, ESCs were used and after 4 days in culture cells were treated with 500 nM 4-OHT for 24 hr to delete Oct1 and induce YFP. Two representative images are shown. (J) Immunofluorescence images were quantified based on YFP and β-tubulin III positivity. Percent total cells showing single or double staining, or percent β-tubulin III+ cells with and without YFP are shown. Approximately 700 total cells were analyzed.
Figure 4—figure supplement 1
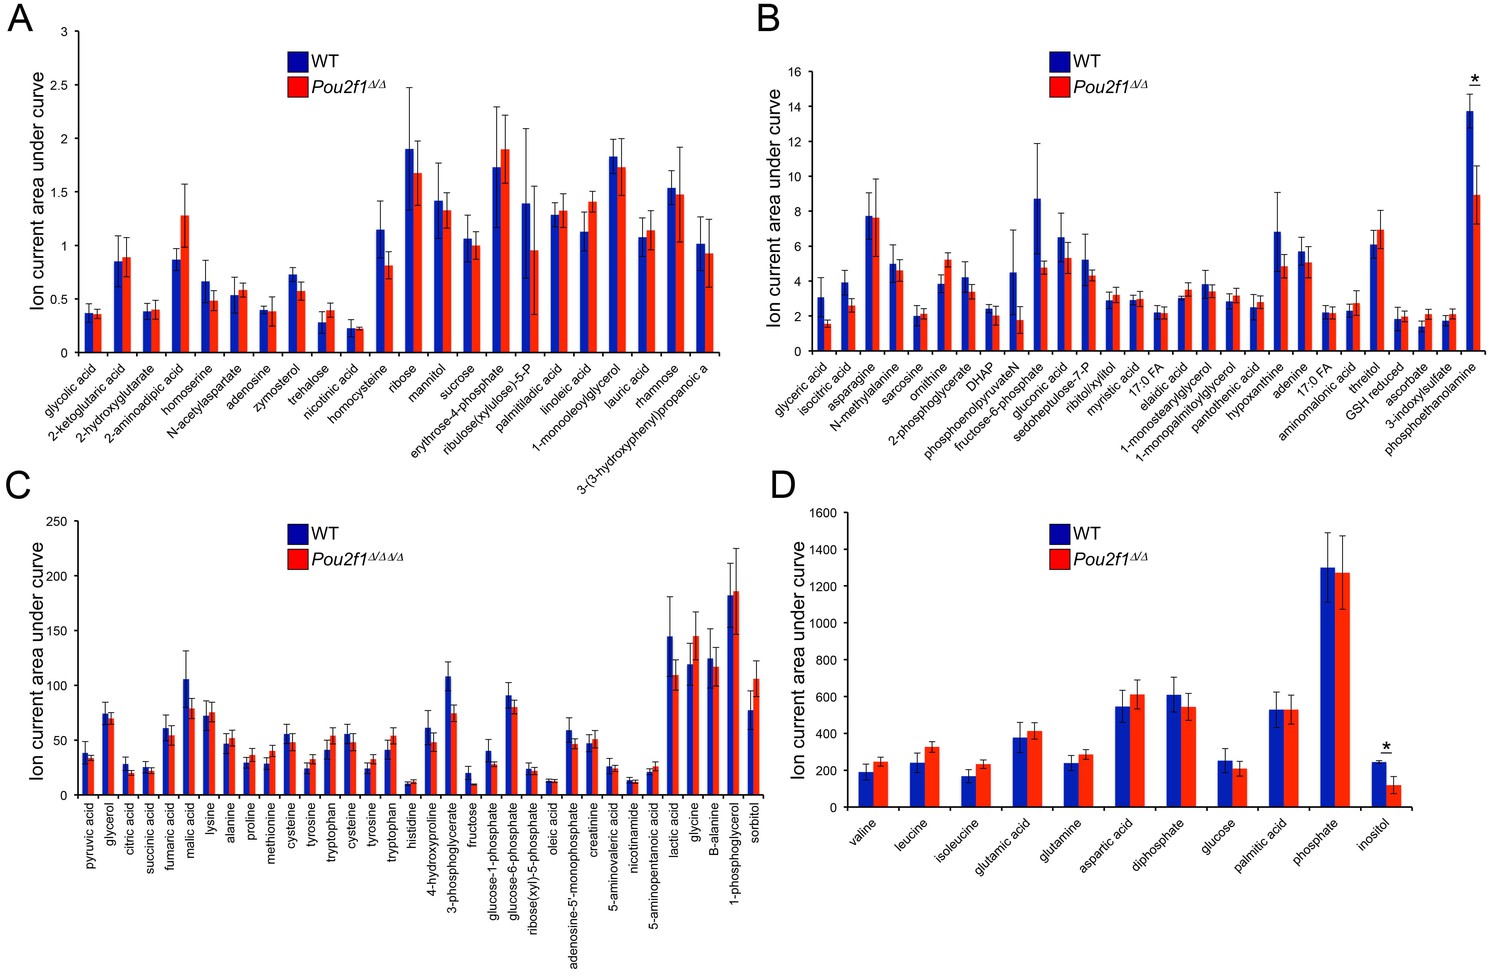
Steady-state metabolite levels in parental WT and 4-OHT-treated Pou2f1Δ/Δ ESCs as determined by GC-MS.
(A) Identified metabolites with total ion current (TIC) levels between 0.25 and 2.5. Normalization were achieved by setting the total ion current area under curve for all metabolites equal to each other. Average of four biological replicates is shown. Error bars depict ±standard deviation. (B) TICs between 1 and 15. * denotes student T-test p<0.05. (C) TICs between 10 and 200. (D) TICs between 100 and 1500.
Figure 4—figure supplement 2

Images of parental WT and 4-OHT-treated KO ESCs differentiating in the presence of RA.
Left: phase microscopy images. Right: epifluorescence images taken using a YFP filter.
Figure 5 with 1 supplement
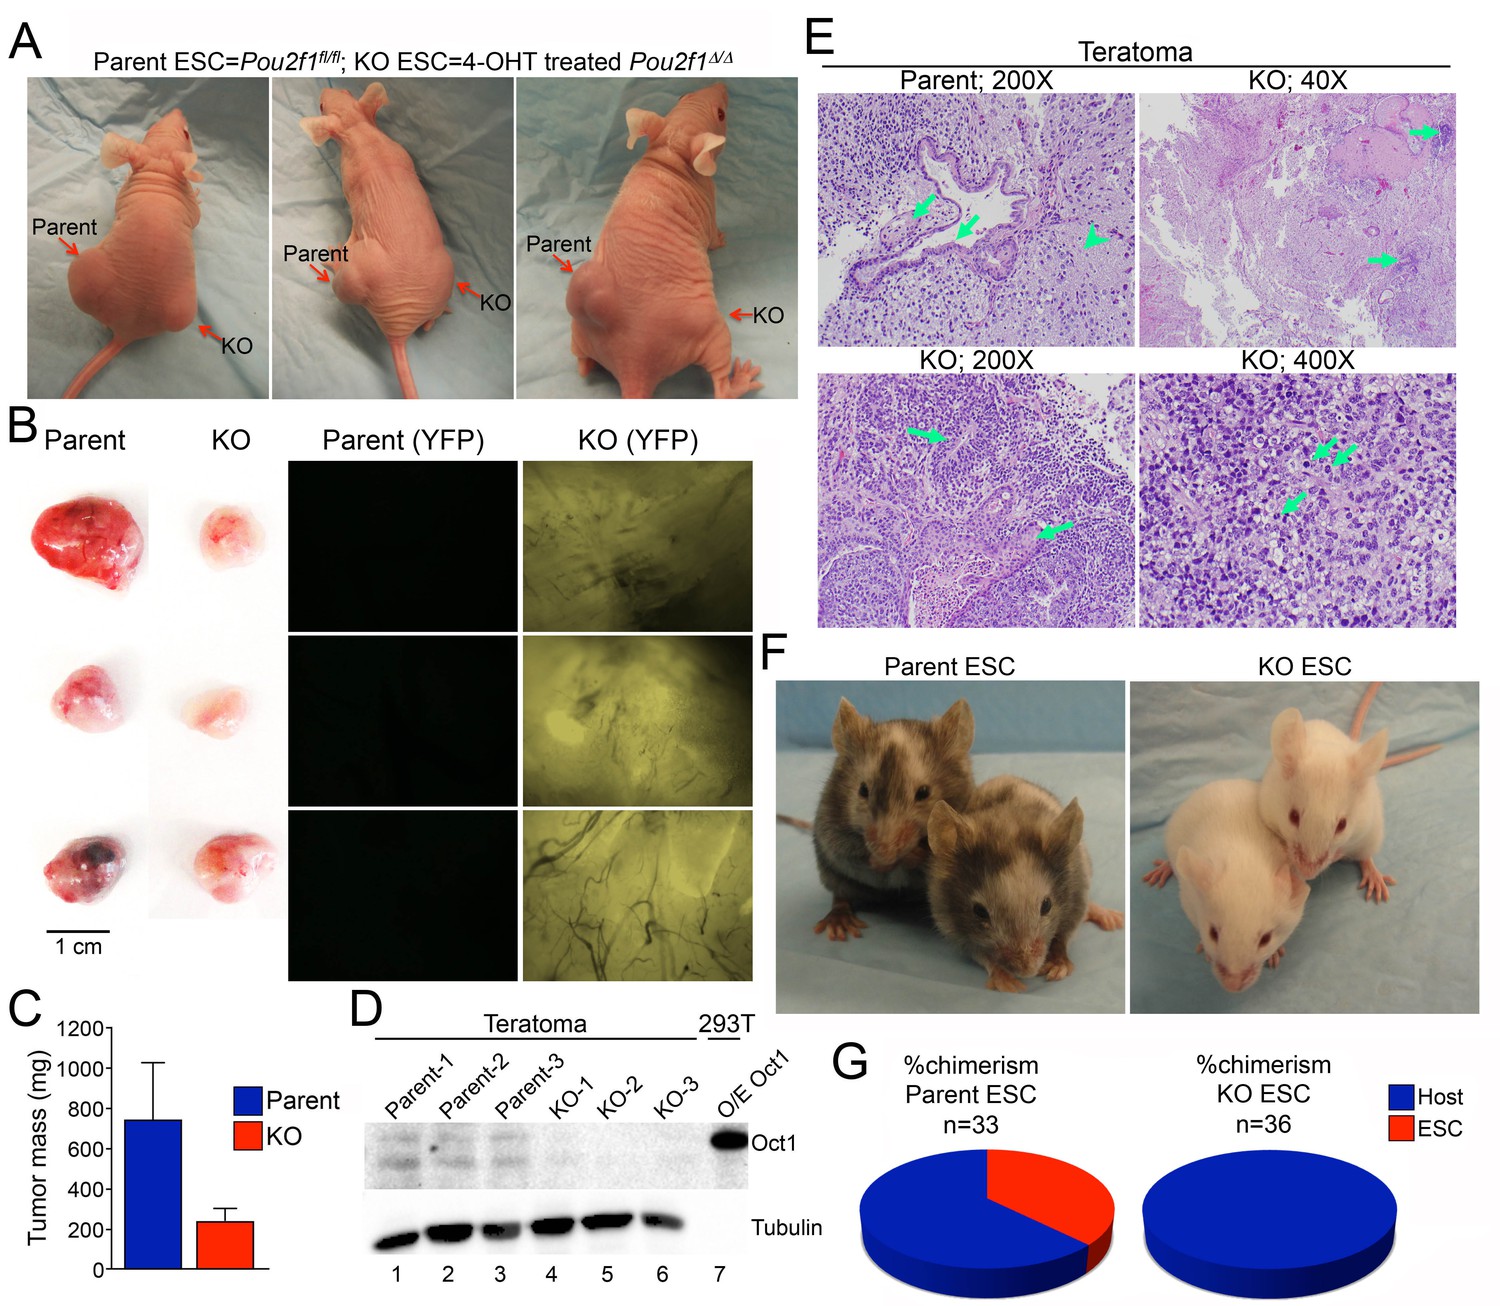
Smaller, less differentiated teratomas and lack of contribution to adult mouse tissues in Pou2f1Δ/Δ ESCs.
(A) 1 × 10⁶ ESCs were injected into flanks (left flank: control Pou2f1fl/fl parent cells, right flank: derived Pou2f1Δ/Δ ESCs) of NCr Nude mice. Images are shown at 4 weeks. (B) Images of dissected teratomas. Left side: white light. Scale in cm shown on the right. Right side: YFP fluorescence. (C) The mass from ten tumors was averaged and plotted. Error bars denote standard deviation. (D) Immunoblots are shown for Oct1 in lysates prepared from part of the individual teratomas. Lane 7: extracts from 293 T cells transiently over-expressing recombinant Oct1. α-Tubulin is shown as a loading control. The lack of α-Tubulin in lane seven arises from the fact that less protein was loaded due to high levels of recombinant Oct1. (E) H and E images of parent and KO teratomas. Top left: normal teratoma morphology comprised of mature elements, e.g glial tissue (arrowhead), mature squamous (left arrow) and ciliated glandular epithelial (right arrow). Top right: teratoma comprised predominantly of mature elements, but with immature elements (approximately 5% of the tumor, arrows). Bottom left: teratoma with both mature and immature elements represented. Mature squamous epithelium (right arrow) is abundant, while immature neuroepithelium (left arrow) is noted focally. Bottom right: tumor comprised almost entirely of a primitive malignant neoplasm that does not recapitulate any recognizable line of differentiation. Arranged in sheets and irregular nests, these cells exhibit marked cytologic atypia, with nuclear pleomorphism and coarsely-clumped chromatin. Nucleoli are variably prominent. Mitotic activity is brisk (arrows). (F) Parent ESCs (left side) or derived KO cells (right side) were injected into albino C57BL/6 blastocysts and implanted in pseudo-pregnant animals. Representative images are shown. (G) Average contribution is shown for the two cell types. ESCs contribution was assessed subjectively based on dark coat and eye color. 33 animals were tested in the case of the parent line and 36 animals were assessed in the case of the derived Pou2f1Δ/Δ line.
Figure 5—figure supplement 1
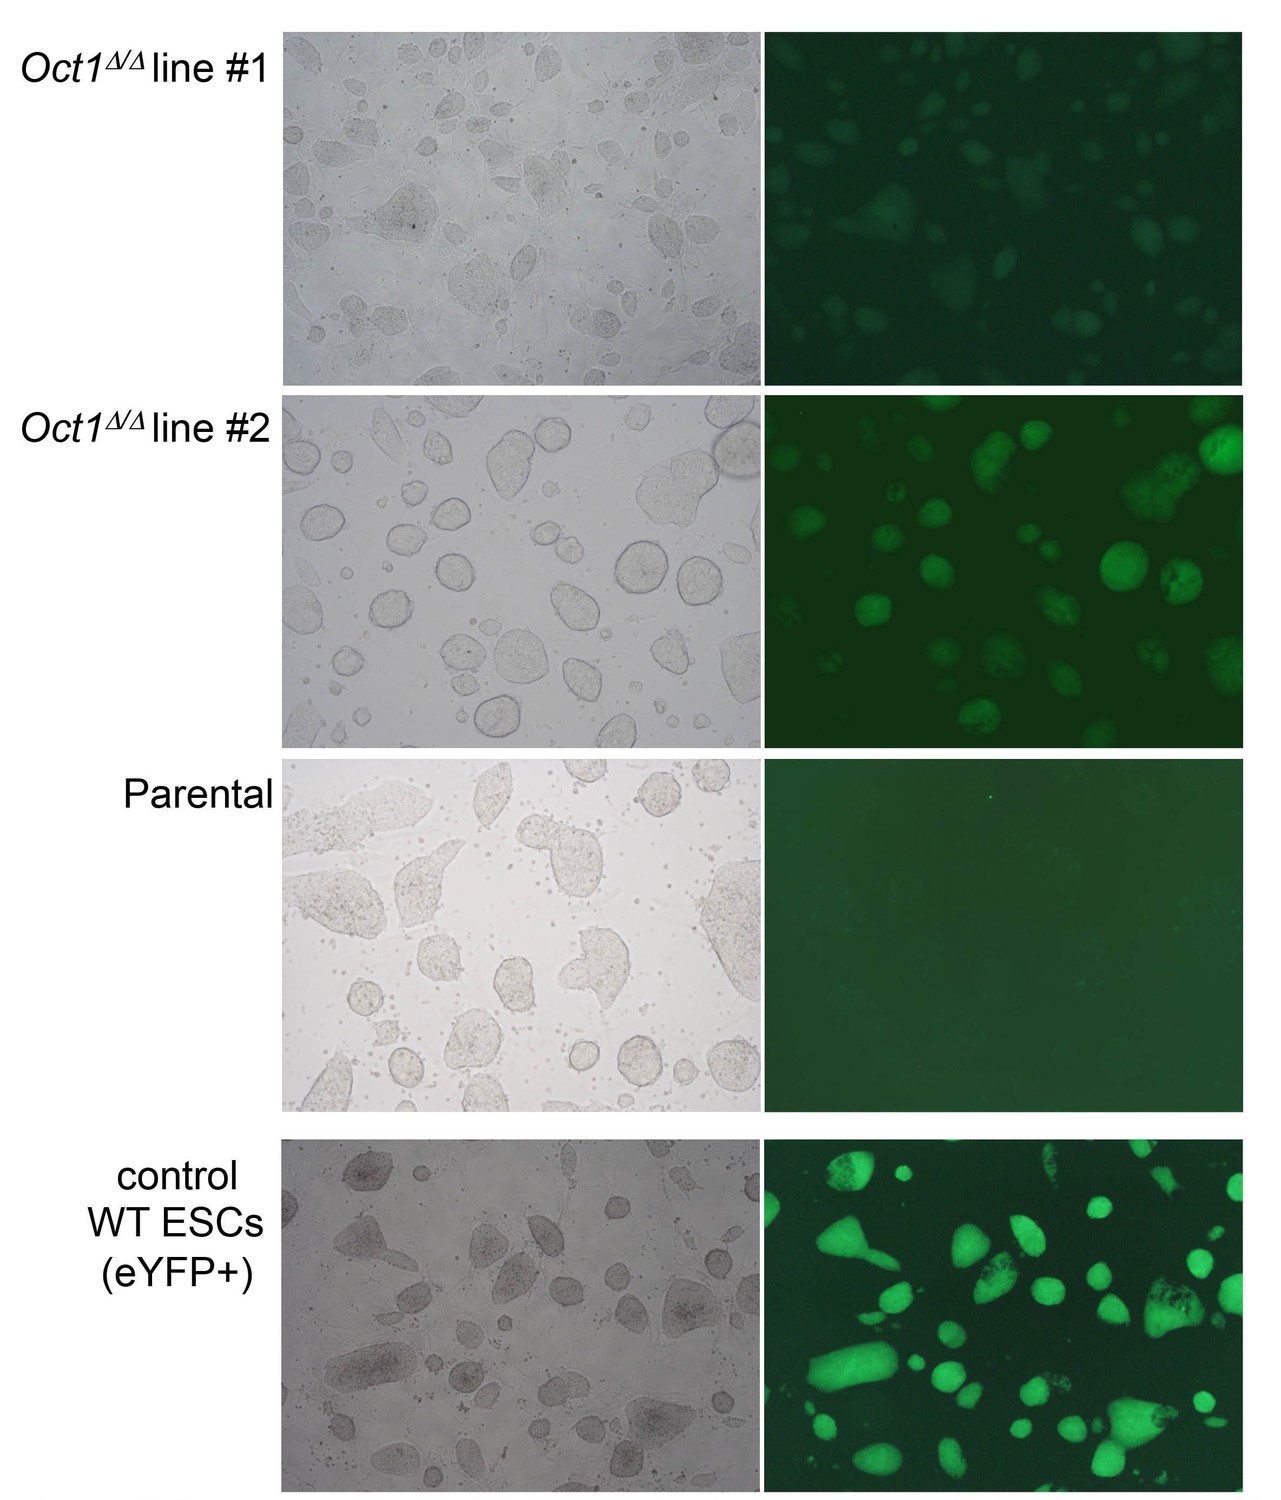
Pluripotent phenotype of ESCs immediately prior to blastocyst injection.
Microscopy images of parental WT and two derived 4-OHT-treated, YFP-expressing, Pou2f1Δ/Δ ESC lines cultured in the absence of feeder fibroblasts. Images were taken by the University of Utah Transgenic Core Facility immediately prior to injection. An established WT eYFP-expressing ESC line (which fluoresces more brightly) is shown as a positive control.
Figure 6 with 2 supplements
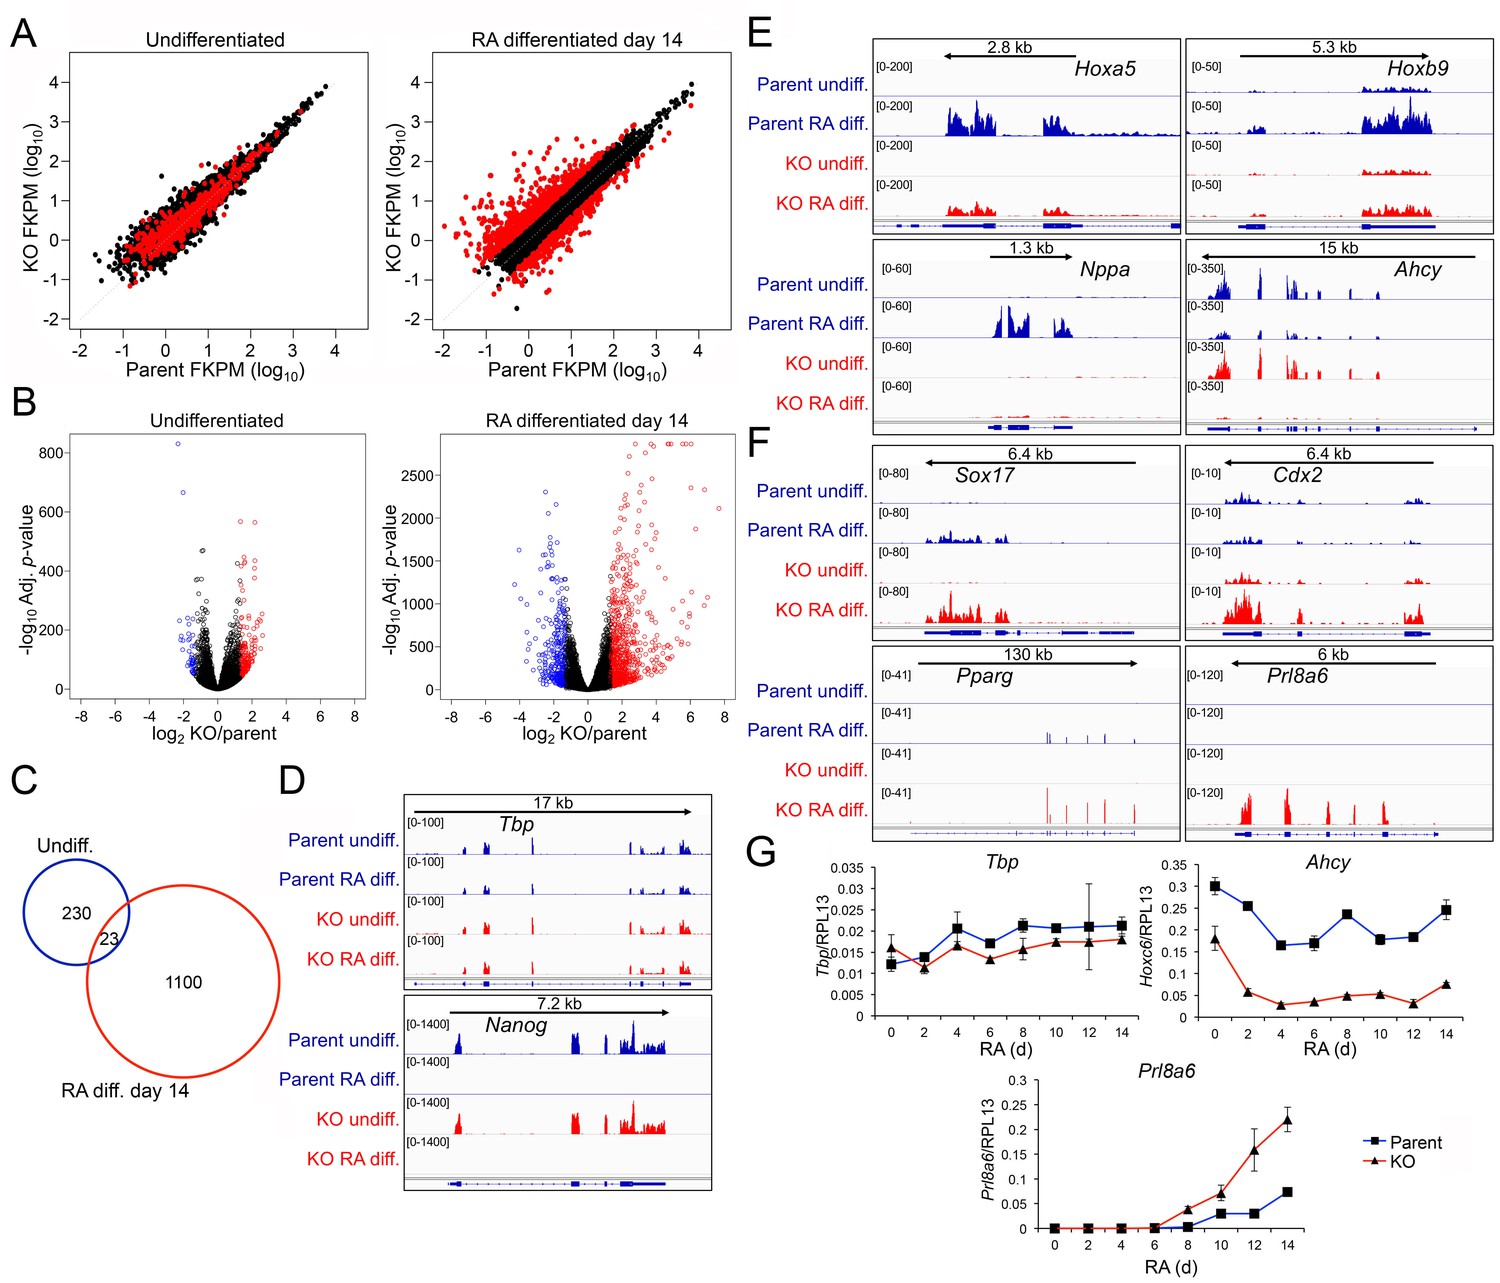
Genome-wide changes in developmental gene expression following differentiation of Oct1 conditional-inducible deficient ESCs.
(A) For each gene, averaged RNAseq FKPM (aligned Fragments Per Kilobase per Million aligned reads) values from three undifferentiated or 14-day RA-differentiated parent and KO ESCs were plotted on a log10 scale. Red genes signify significantly changed gene expression (Adj. p<0.01, fold change >2.5) at d 14. For each timepoint, genes showing <50 total reads in both genotypes conditions were called unexpressed and are not displayed. (B) Volcano plots showing log2 averaged difference in gene expression vs. –10×log10 significance. Significantly altered genes (Adj. p<0.01, 2.5-fold change) are shown in blue (down-regulated) or red (up-regulated). (C) Venn diagram showing total numbers of significantly (p<0.01) differentially expressed (>2.5 fold) genes in undifferentiated and 14-day RA-differentiated Oct1-deficient ESCs. Overlap shows genes differentially expressed at both timepoints. (D) Genome tracks of averaged RNAseq read densities (genome build mm10) for two control genes: Tbp (a constitutively expressed gene), and Nanog (expressed in pluripotent but not differentiated conditions). Arrows show directionality of gene transcription and size of the transcription unit. (E) Additional genome tracks are shown of three genes with poor induction in the KO condition: Hoxa5, Hoxb9, and Nppa. Ahcy is also shown, which becomes more strongly down-regulated in the differentiated condition. Hoxa5 physically overlaps with Hoxa3, Hoxaas3, and Hoxa6, which are not highlighted. (F) Additional genome tracks are shown of genes showing ectopic expression in the differentiated condition: Sox17, Cdx2, Pparg, and Plr8a6. (G) RT-qPCR validations of additional genes identified by RNAseq, Ahcy and Prl8a6. Tbp is shown as a control. Average of three biological replicates ±standard deviation is shown.
Figure 6—figure supplement 1
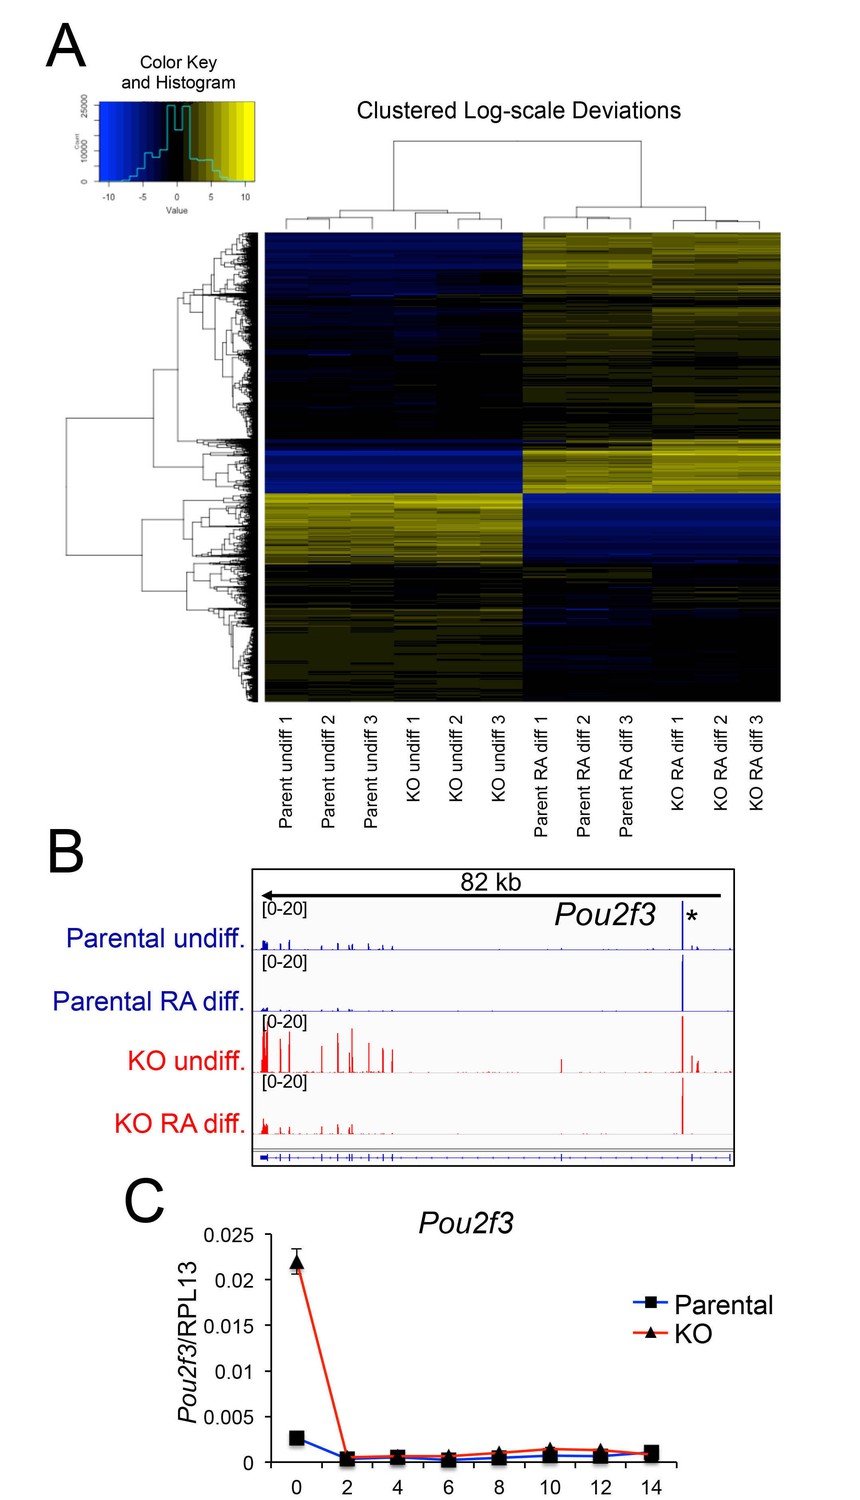
Differences in gene expression in differentiated Oct1 deficient cells revealed by RNAseq.
(A) Heat map of gene expression differences across all biological replicates generated using unsupervised hierarchical clustering. 10,500 genes that vary at least fourfold across all samples were used. Color shows Log2 deviation of each gene from its average value across all the samples. Yellow= above average. Blue=below average. Each unit in the color key represents a doubling in intensity. Input values were log-scale FPKMs for each gene in each sample. (B) Genome tracks of Pou2f3. Asterisk: spurious background signal sometimes seen with poorly expressed genes. (C) RT-pPCR of Pou2f3 expression. Average of three biological replicates ±standard deviation is shown.
Figure 6—figure supplement 2
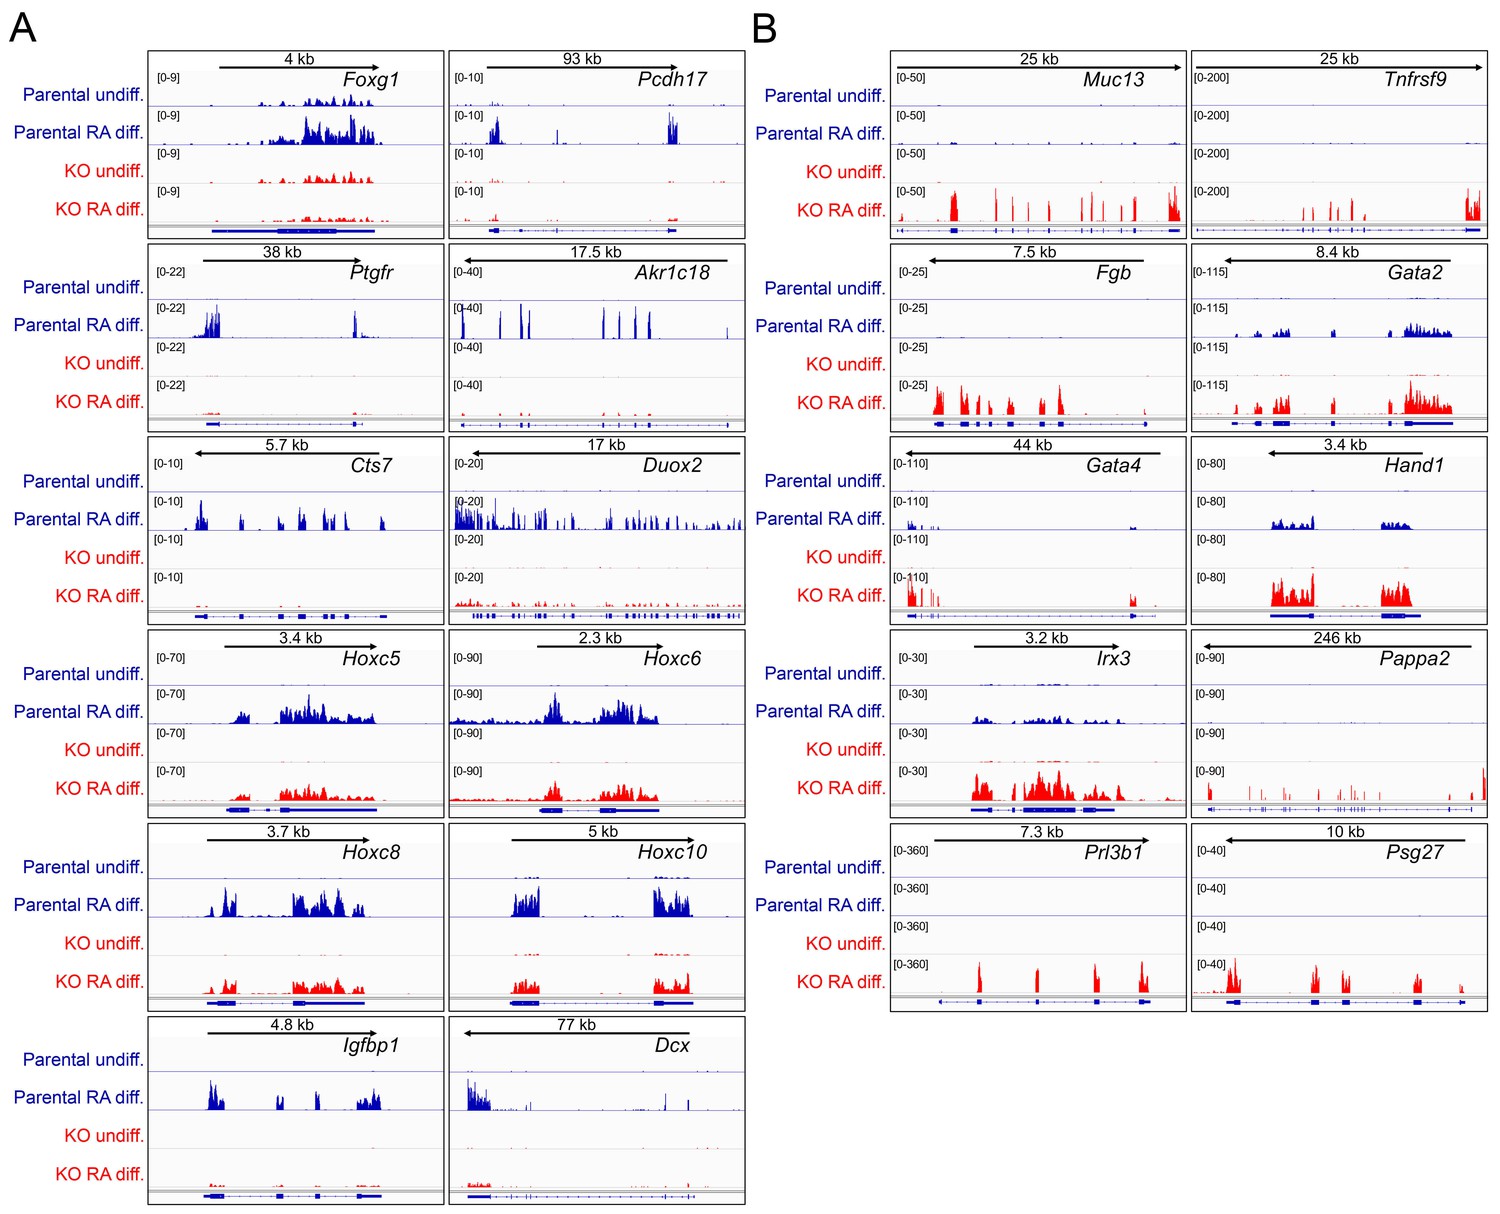
Differences in gene expression in differentiated Oct1 deficient cells revealed by RNAseq.
(A) Genome tracks of additional genes showing decreased expression in the differentiated state identified by RNAseq. (B) Genome tracks of elevated genes.
Figure 7 with 1 supplement
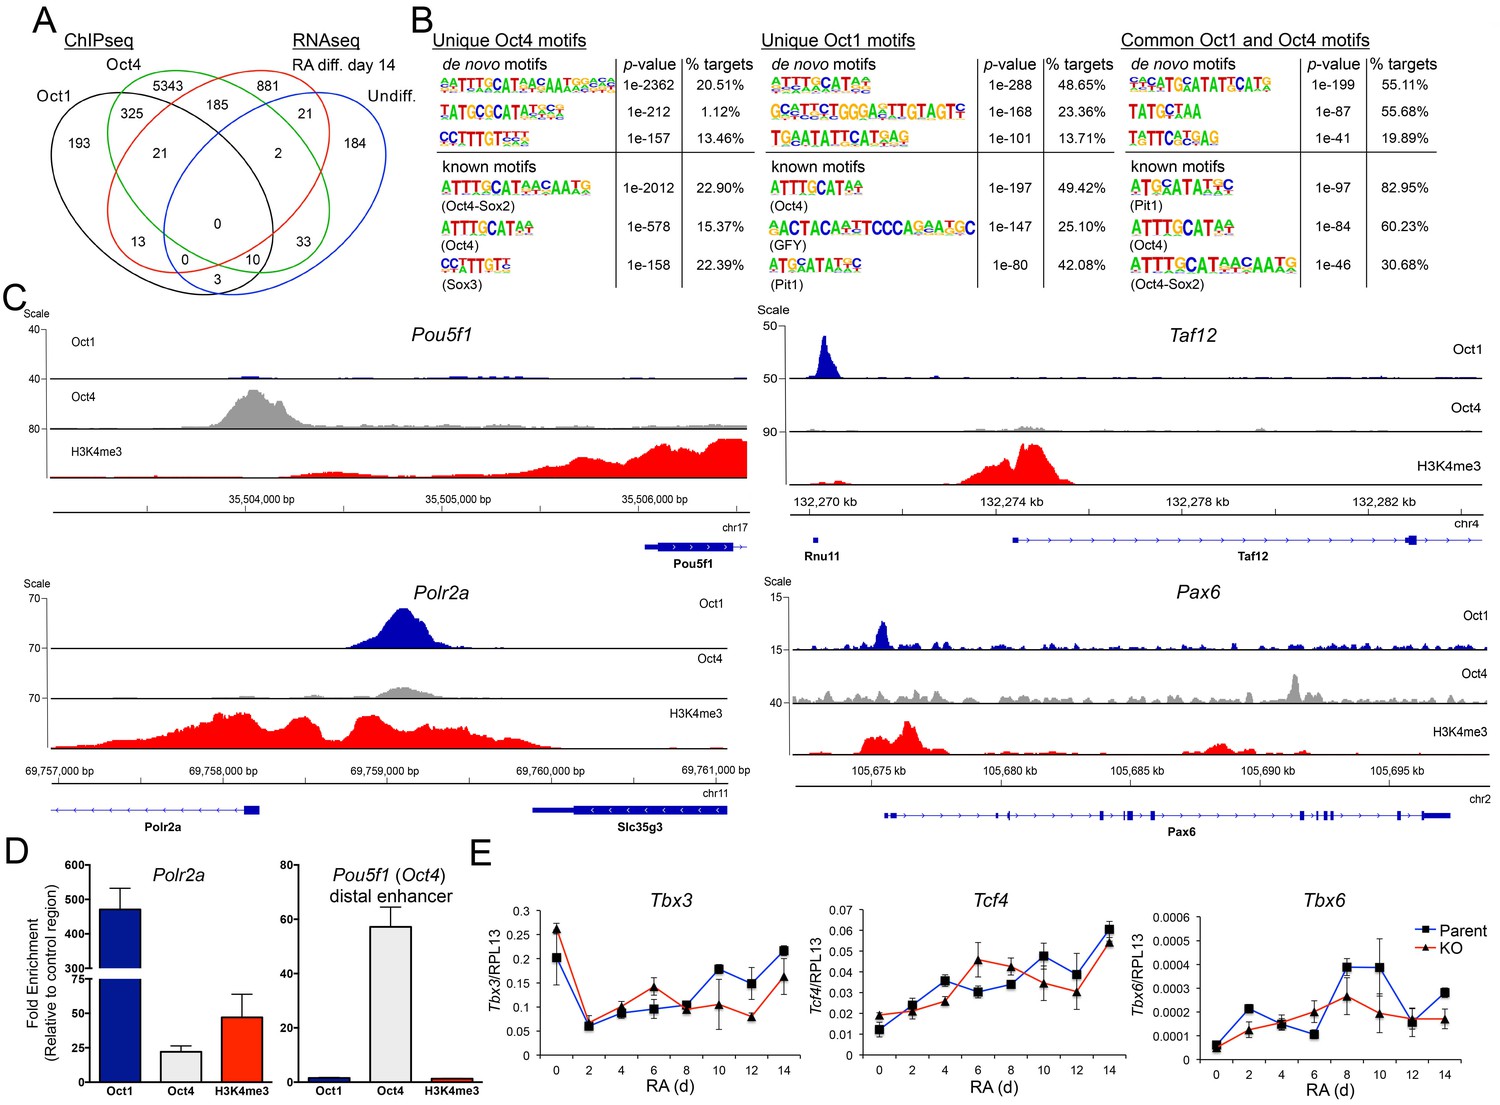
Unique and common Oct1 and Oct4 targets in ESCs.
(A) Venn diagram illustrating Oct1 and Oct4 target gene profile and intersection with RNAseq gene set. (B) Motif analysis for peaks occupied uniquely by Oct1 or Oct4, and for peaks occupied by both proteins. Top shows best consensus sequences associated with binding. Bottom shows best matches to annotated weight matrices. In the case of known motifs, deviation of physiological binding sites from consensus causes recurring sequences meet threshold criteria for the compound ‘Oct4-Sox2’ site but not for a simple octamer site (‘Oct4’). This is why the percentage of target sites computationally associated with ‘Oct4-Sox2’ is higher than for ‘Oct4.’ (C) Genome tracks showing ChIPseq enrichment for Oct1 (blue), Oct4 (gray) or H3K4me3 (red). Target gene and orientation is shown at the bottom of each track. Pou5f1, Polr2a, Taf12 and Pax6 are shown. (D) ChIP-qPCR validation of select ChIPseq targets. Fold enrichments using Oct1 and Oct4 antibodies at Polr2a and Pou5f1 are shown. (E) RT-qPCR for three identified Oct1 target genes, Tbx3, Tcf4 and Tbx6 at 0, 2, 4,6, 8, 10, 12 and 14 d of differentiation. Expression was normalized to the control ribosomal gene RPL13. Three biological replicates were performed. Error bars denote ±standard deviation.
Figure 7—figure supplement 1
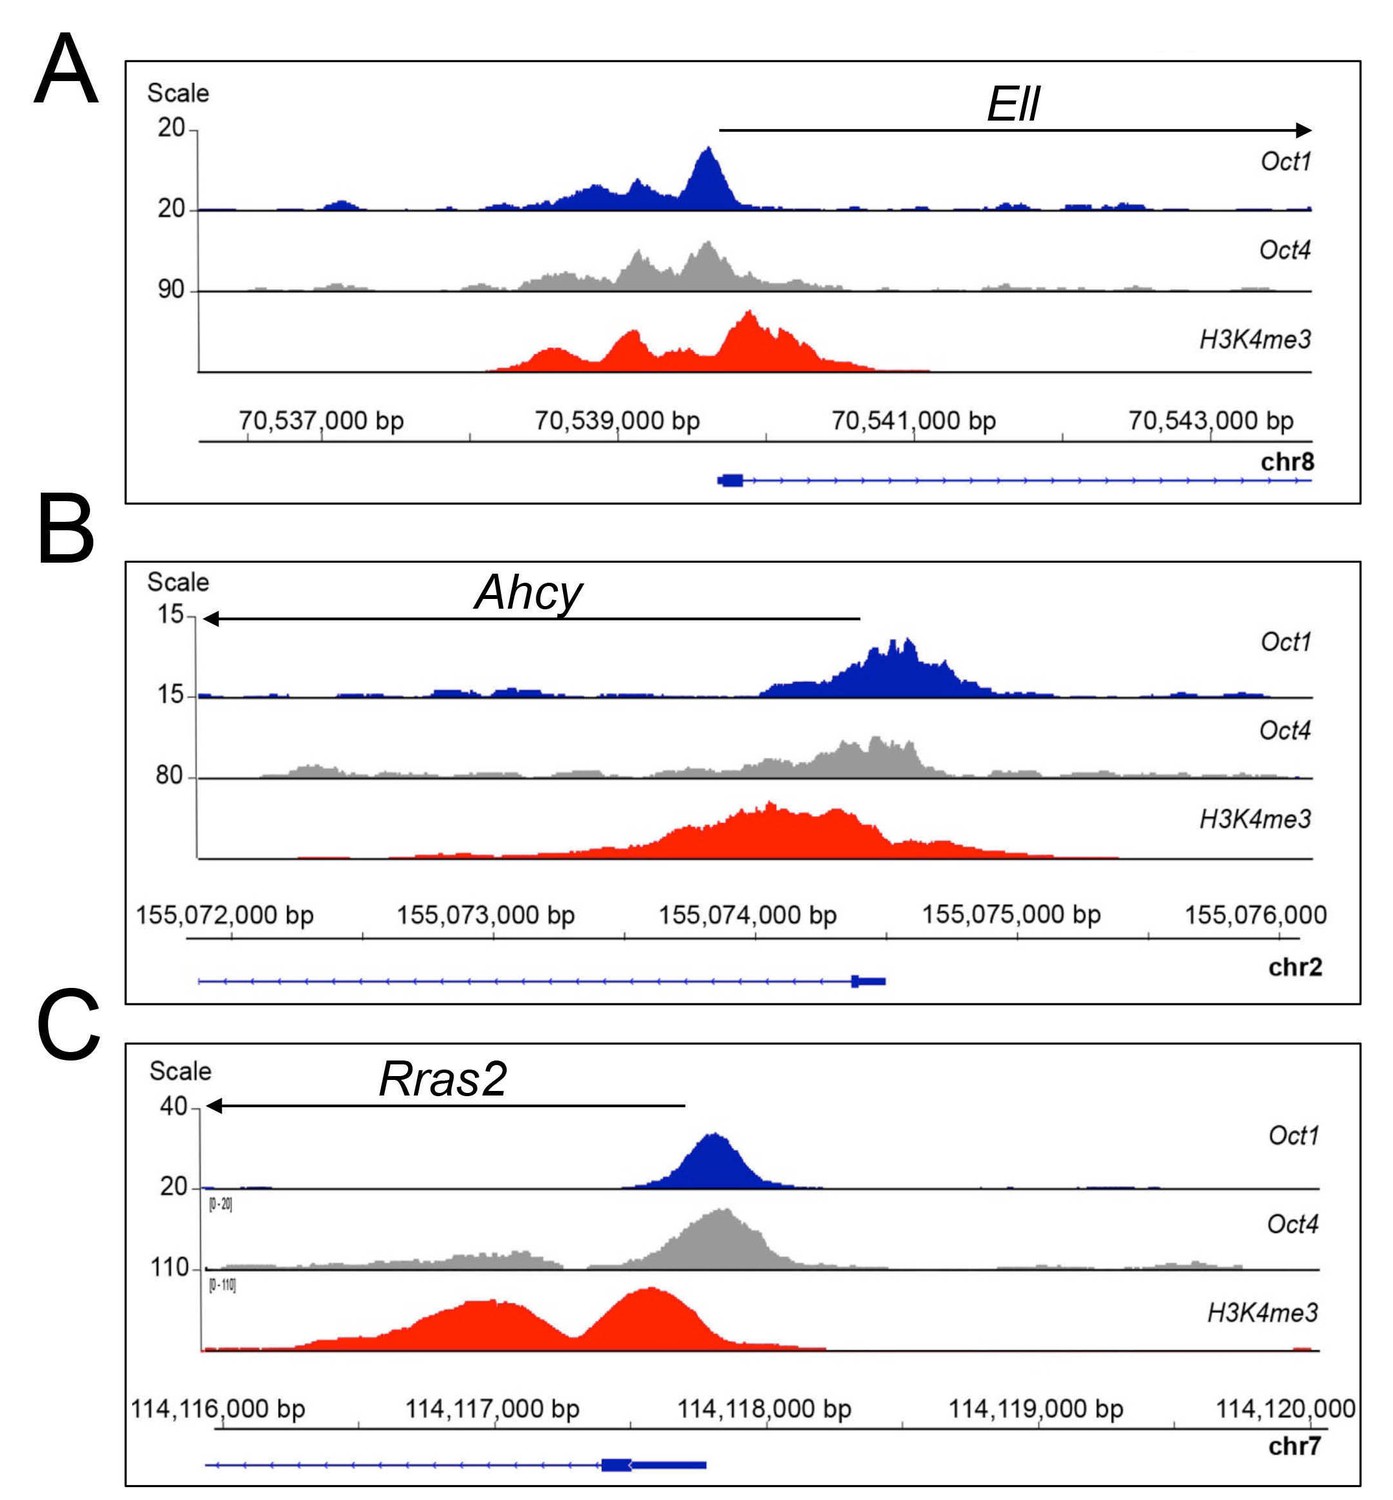
Oct1 and Oct4 ChIPseq read density at example co-bound genes.
(A) Genome tracks of Oct1 and Oct4 enrichment at Ell in ESCs. (B) Ahcy. (C) Rras2.
Figure 8

Oct1/Oct4 co-binding to MOREs in ESCs, and inducible Oct1 binding to poised targets upon differentiation.
(A) Conserved MOREs at two genes (Ahcy and Polr2a) co-bound by Oct1 and Oct4 in ESCs. The top co-bound de novo motif from Figure 7B is shown at top. The MORE sequence (Reményi et al., 2001; Tomilin et al., 2000) is shown at bottom. Mammalian (mouse, human, dog) conservation is shown. MORE position relative to TSS is shown in parentheses. Polr2a contains two adjacent MOREs (Kang et al., 2009), only one of which is shown here. (B) Parent and derived KO ESCs were treated with 2 mM H2O2 for the indicated times. Ahcy and Polr2a log2 mRNA levels were assessed by RT-qPCR. Three biological replicates were performed. Error bars denote ±standard deviation. (C) Microscopic images of the same cells during the treatment timecourse. (D) Conservation of the octamer sequence in the Hoxc5 3’ UTR and Rest/Nrsf upstream region. Mammalian (mouse, human, dog) conservation is shown. Octamer element position relative to TSS is shown in parentheses. (E) Genome tracks showing ChIPseq enrichment at Hoxc5, Rest and upstream of Myf5, for Oct1 (blue), Oct4 (gray) or H3K4me3 (red). (F) ChIP-qPCR differentiation timecourse of four targets that exclusively bind Oct4 in ESCs. Fold enrichments using Oct1 and Oct4 antibodies at Hoxc5, Pou5f1, Rest and Myf5 are shown. (G) Model for Oct1 and Oct4 function in ESCs and their differentiated progeny. The example of neuronal differentiation is shown. In stem cells, Oct1 and Oct4 collaborate at constitutively expressed MORE-containing targets such as Polr2a and Ahcy to insulate them against oxidative stress (red and black short dashed lines). Oct4 poises developmental genes of all embryonic lineages (long dashed black line) and repress trophectoderm-specific genes (solid black block line). Oct4 additionally activates pluripotency genes (solid black arrow). In differentiating cells, Oct1 occupies MORE genes in response to oxidative stress and buffers their expression, as described previously (Kang et al., 2009; Shakya et al., 2011). Oct1 also contributes to eventual lineage-specific developmental gene activation (solid red line), and alternate developmental lineage gene repression (including trophectoderm, solid red block line).
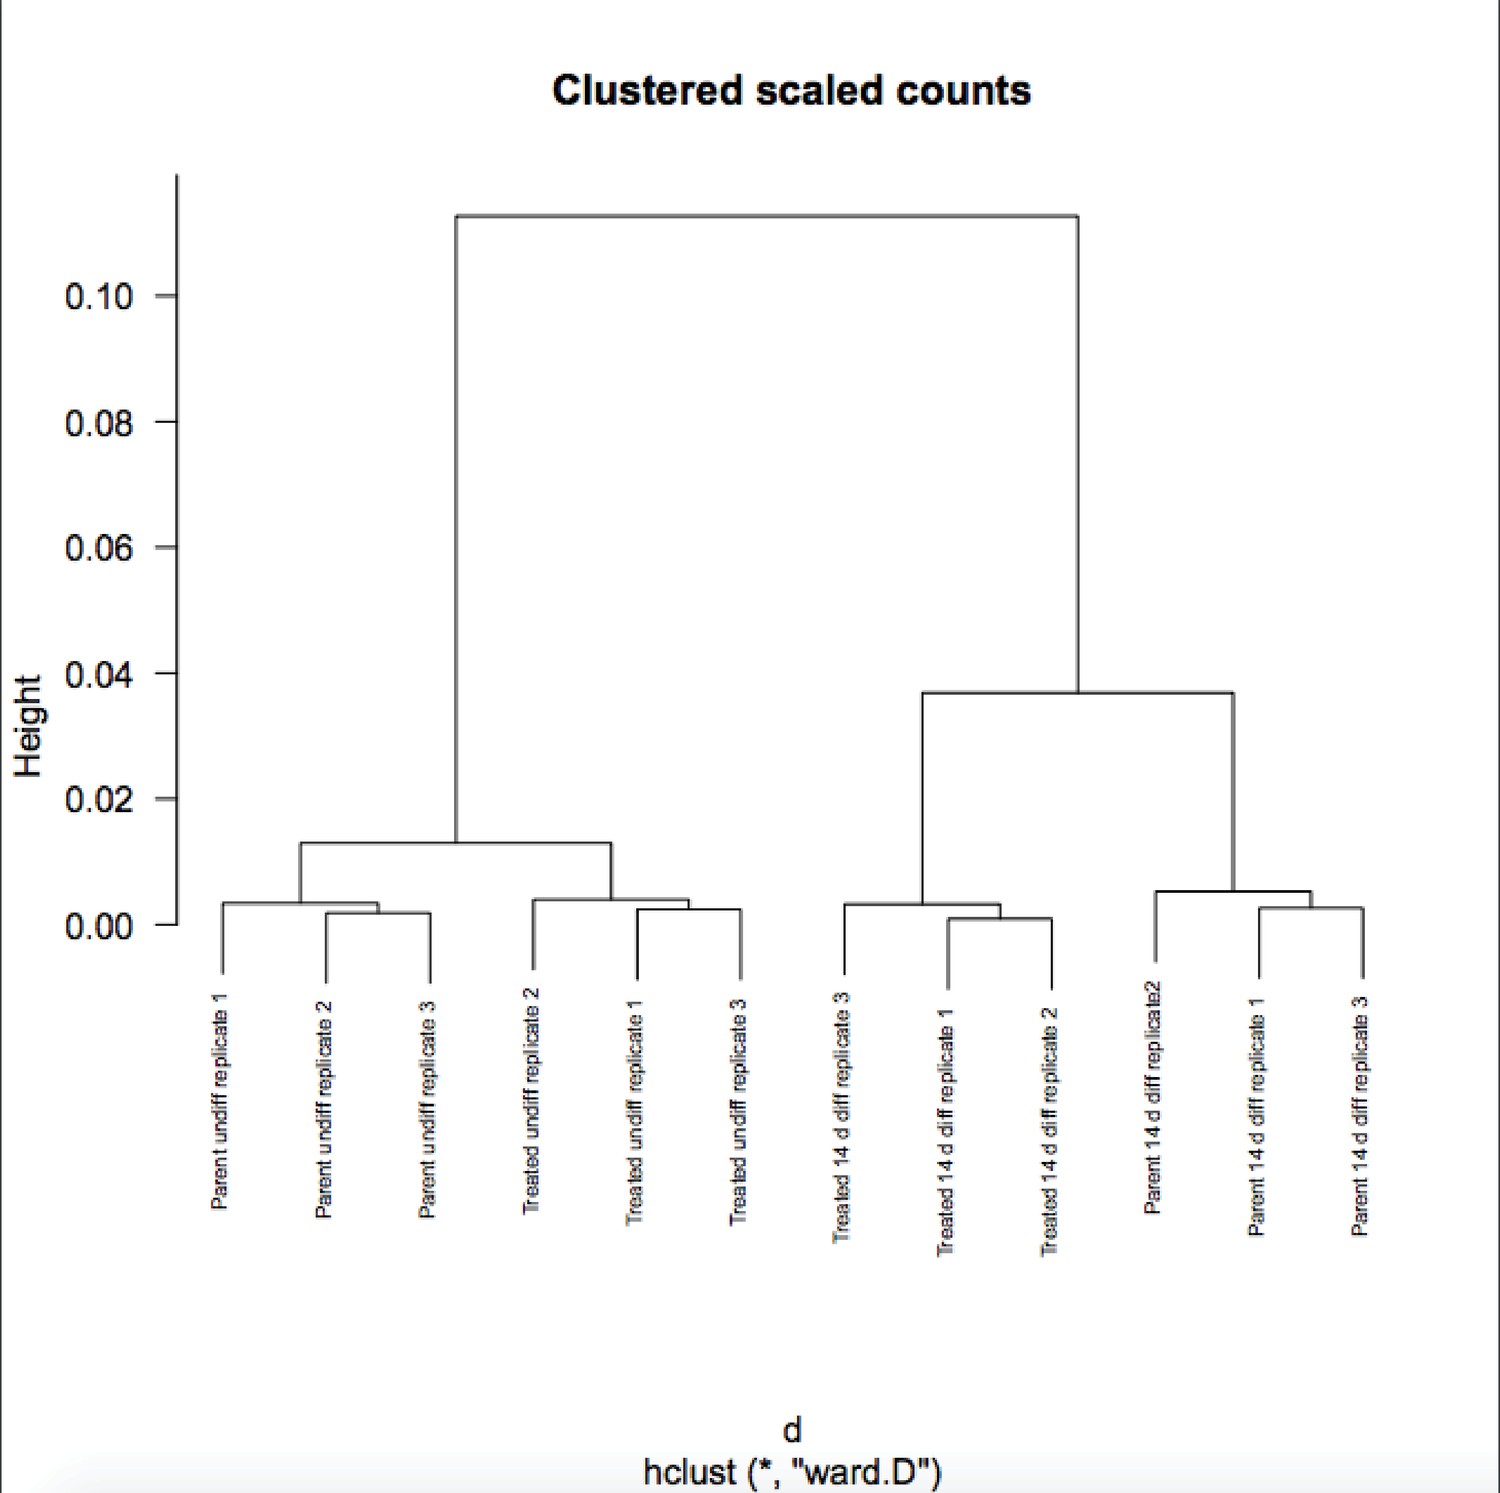
Author response image 1
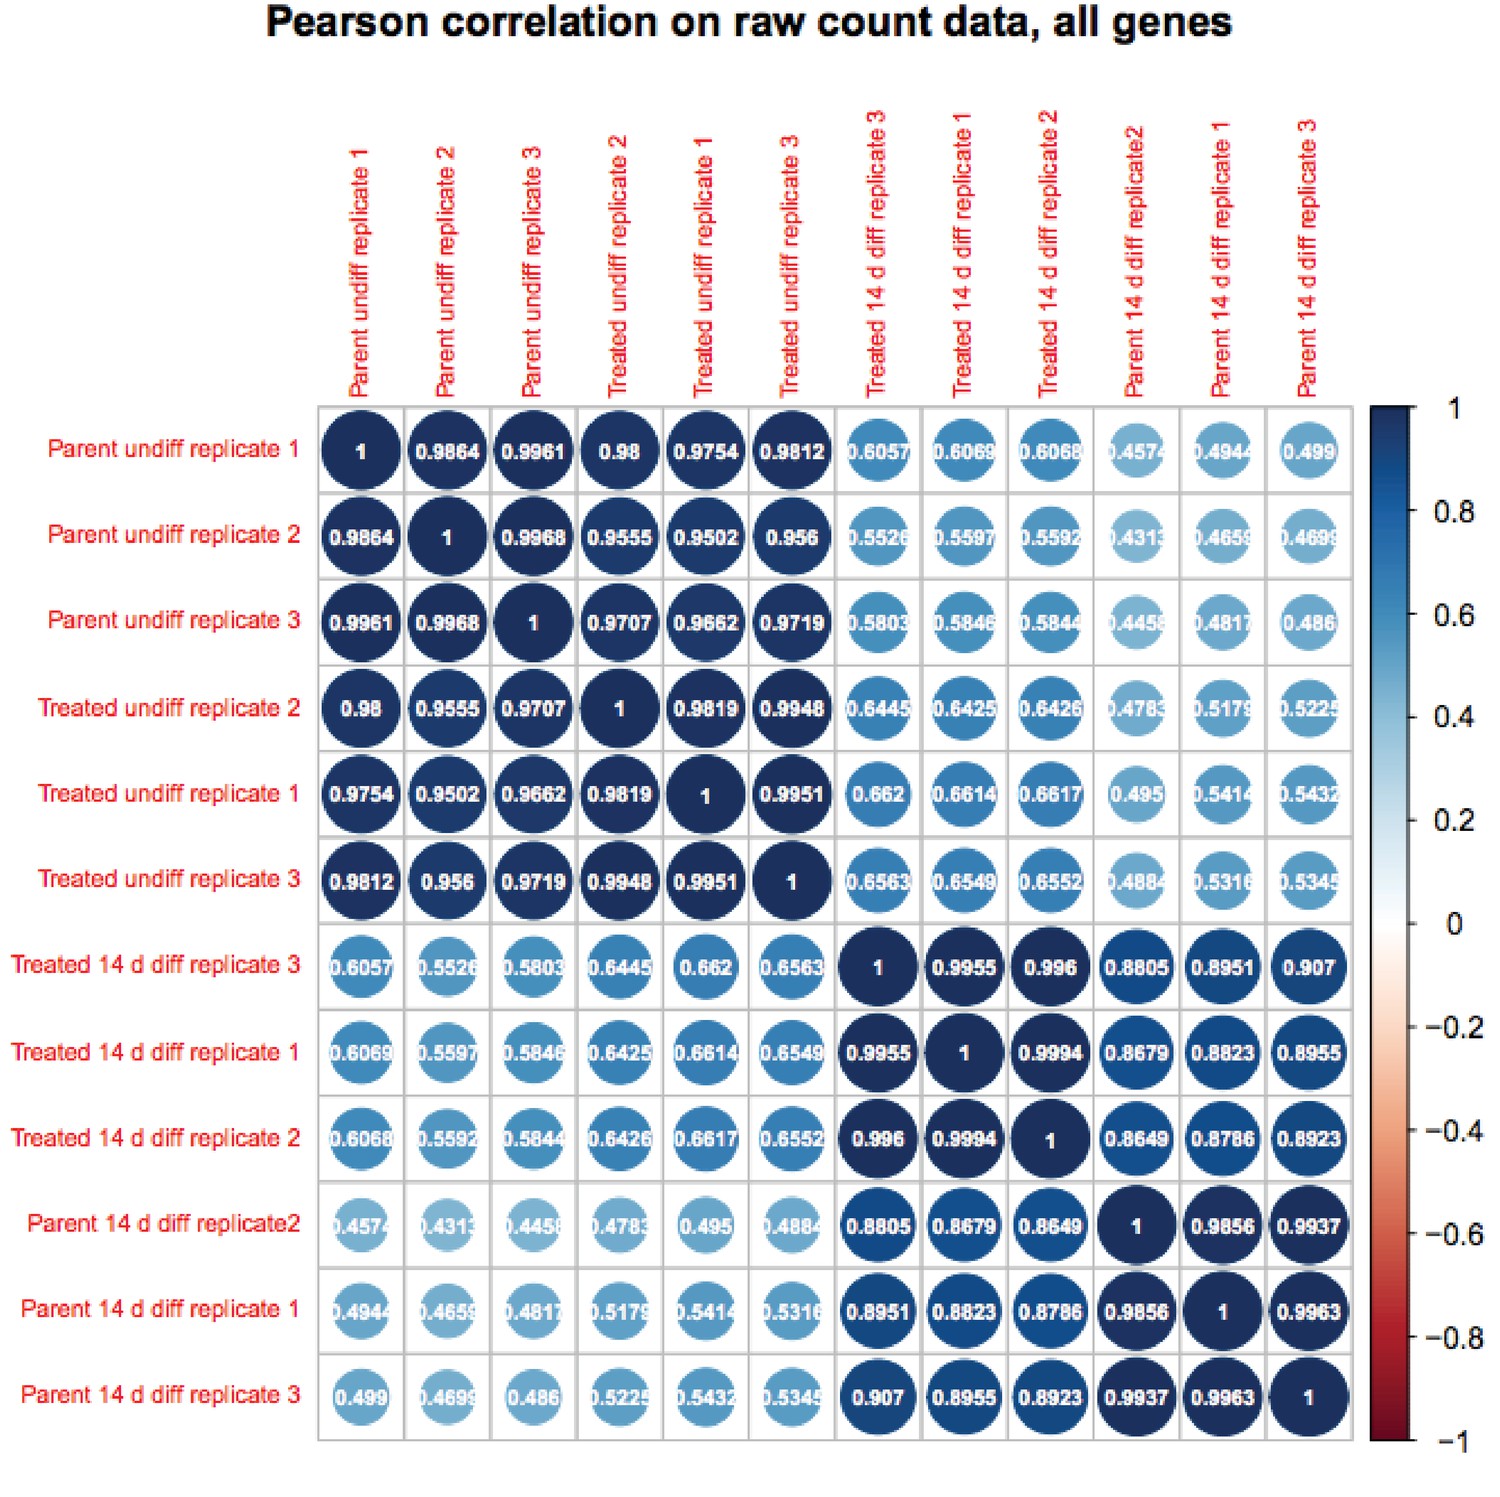
Author response image 2
Videos
Video 1
Example WT ESC line cardiomyocyte differentiation 1.
https://doi.org/10.7554/eLife.20937.008
Video 2
Example WT ESC line cardiomyocyte differentiation 2.
https://doi.org/10.7554/eLife.20937.009
Video 3
Example WT ESC line cardiomyocyte differentiation 3.
https://doi.org/10.7554/eLife.20937.010
Video 4
Example WT ESC line cardiomyocyte differentiation 4.
https://doi.org/10.7554/eLife.20937.011
Video 5
Example WT ESC line cardiomyocyte differentiation 5.
https://doi.org/10.7554/eLife.20937.012
Video 6
Example WT ESC line cardiomyocyte differentiation 6.
https://doi.org/10.7554/eLife.20937.013
Video 7
Example WT ESC line cardiomyocyte differentiation 1.
https://doi.org/10.7554/eLife.20937.014
Video 8
Example WT ESC line cardiomyocyte differentiation 2.
https://doi.org/10.7554/eLife.20937.015
Video 9
Example WT ESC line cardiomyocyte differentiation 3.
https://doi.org/10.7554/eLife.20937.016
Video 10
Example WT ESC line cardiomyocyte differentiation 4.
https://doi.org/10.7554/eLife.20937.017
Video 11
Example WT ESC line cardiomyocyte differentiation 5.
https://doi.org/10.7554/eLife.20937.018
Video 12
Example WT ESC line cardiomyocyte differentiation 6.
https://doi.org/10.7554/eLife.20937.019Additional files
-
Supplementary file 1
Normalized RNAseq gene expression changes.
- https://doi.org/10.7554/eLife.20937.031
-
Supplementary file 2
Genes identified by ChIPseq in comparison to RNAseq data.
- https://doi.org/10.7554/eLife.20937.032
-
Supplementary file 3
Oligonucleotides for RT-qPCR and ChIP.
- https://doi.org/10.7554/eLife.20937.033
Download links
A two-part list of links to download the article, or parts of the article, in various formats.
Downloads (link to download the article as PDF)
Open citations (links to open the citations from this article in various online reference manager services)
Cite this article (links to download the citations from this article in formats compatible with various reference manager tools)
Enforcement of developmental lineage specificity by transcription factor Oct1
eLife 6:e20937.
https://doi.org/10.7554/eLife.20937


