Boundary Dpp promotes growth of medial and lateral regions of the Drosophila wing
- Institute for Research in Biomedicine (IRB Barcelona), Spain
- The Barcelona Institute of Science and Technology (BIST), Spain
- Institució Catalana de Recerca i Estudis Avançats (ICREA), Spain
Figures
Figure 1
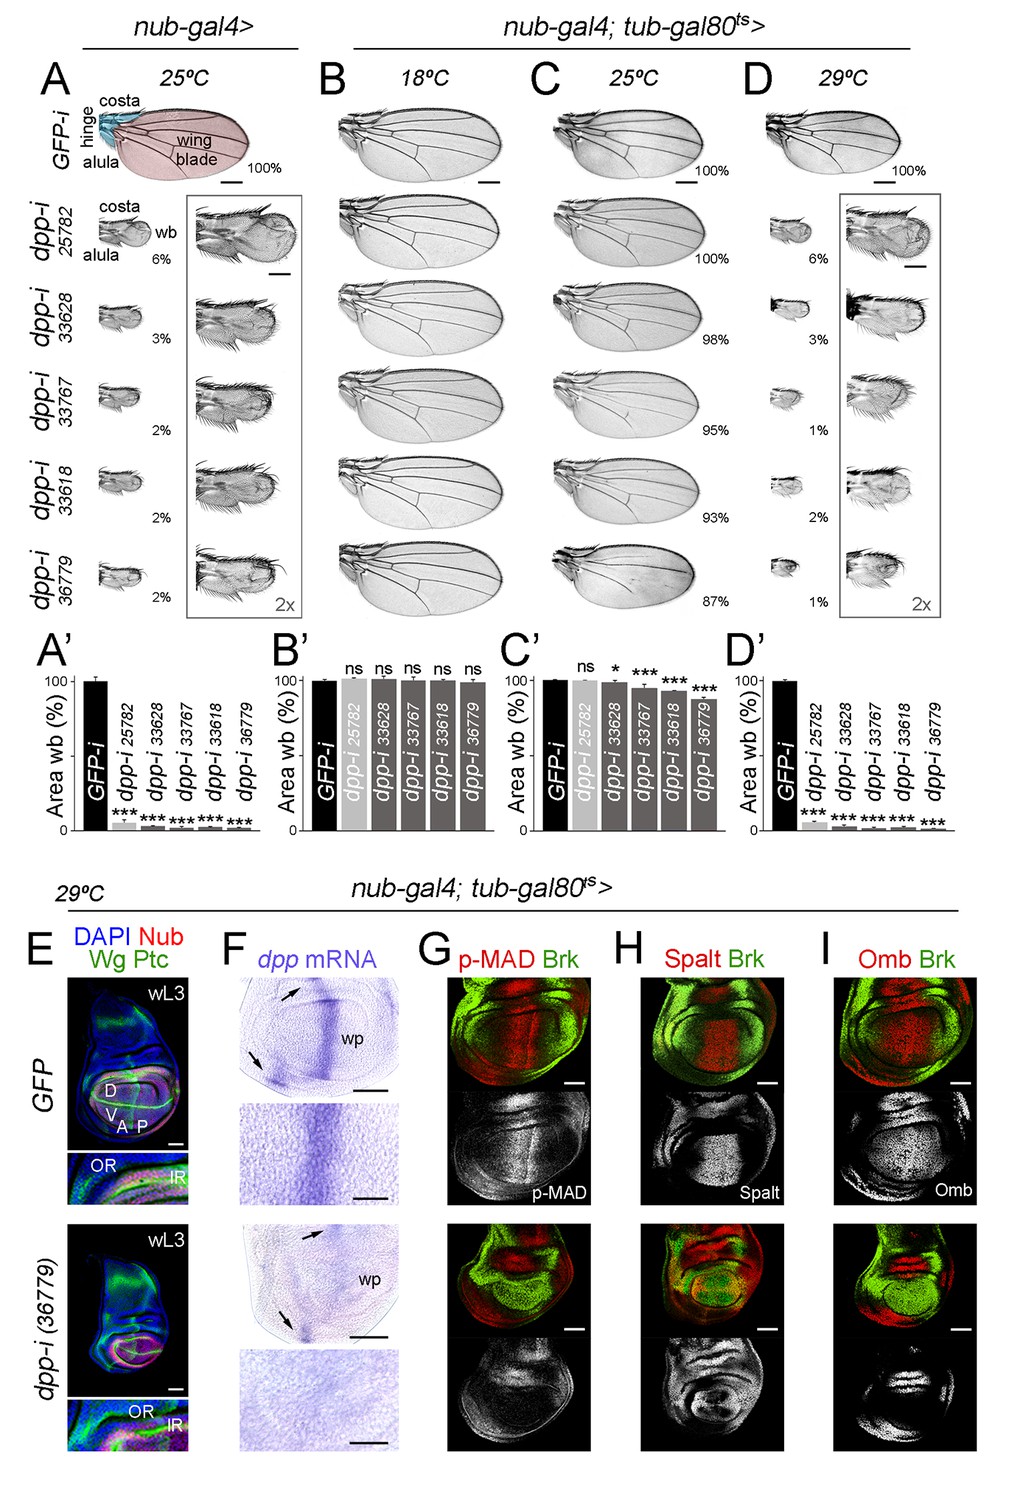
Independent RNAi hairpins to induce temporally controlled depletion of Dpp.
(A–D) Cuticle preparations of male adult wings expressing the indicated RNAi hairpins under the control of nub-gal4 and grown at the indicated temperatures. In B-D, flies carry the tub-gal80ts transgene. High magnification of rudimentary wings are shown in A and D, and percentages of wing size with respect to control GFP-RNAi expressing wings are indicated in A, C, and D. Wing blade (wb, pink) and hinge structures (alula and costa, blue) are shaded in A. Scale bars in A-D, 300 µm. Scale bars in the squared wings in A, D, 150 µm. (A’–D’) Histograms plotting tissue size of the wing blade with the indicated genotypes normalized as a percent of the control wings. Error bars show standard deviation. Number of wings per genotype and temperature >15. ns, not significant; ***p<0.001, *p<0.05. (E–I) Late third instar wing discs of the indicated genotypes, grown at 29°C, and stained for Wg and Ptc (E, green), DAPI (E, blue), Nub (E, red), dpp mRNA (purple, F), p-MAD (G, red), Spalt (H, red), Omb (I, red) and Brk (G-I, green). Scale bars, 50 µm (E–I) or 25 µm (higher magnifications in E, F). Higher magnifications of the dorsal hinge region are shown below each wing disc in panel E. In E, inner (IR) and outer (OR) rings of Wg, and dorsal (D), ventral (V), anterior (A) and posterior (P) compartments are marked. Note that the width of the hinge is largely unaffected by Dpp depletion. In F, dpp mRNA levels are reduced in the wing pouch (wp) when compared to the hinge region (black arrows). Higher magnifications of the wing pouch are shown below each wing disc in panel F.
-
Figure 1—source data 1
Summary of tissue size quantifications.
This file contains numerical data on tissue size quantifications of Figure 1.
- https://doi.org/10.7554/eLife.22013.004
Figure 2
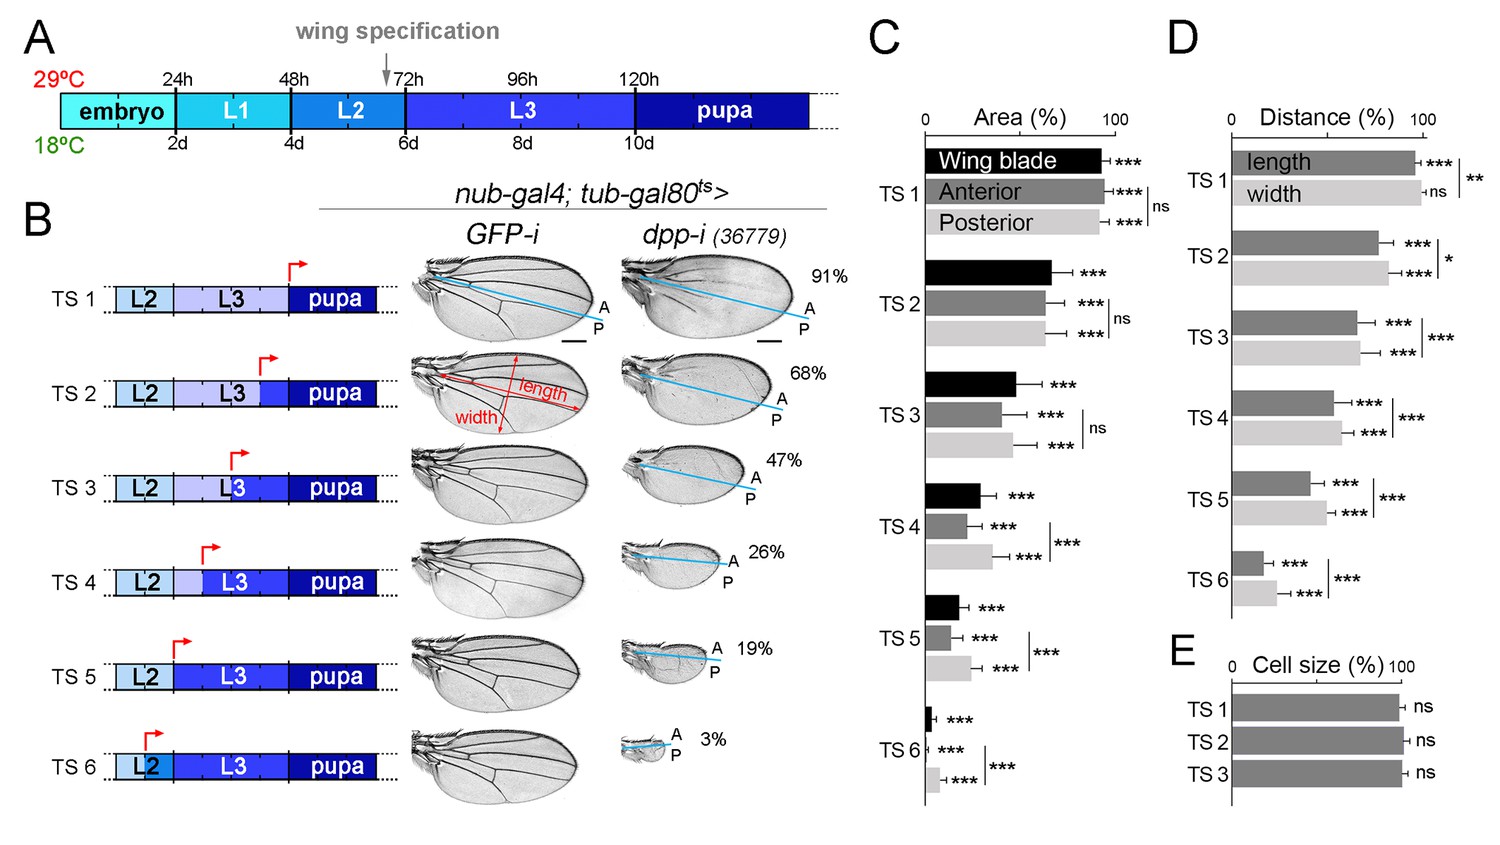
Dpp is continuously required for growth of the wing blade.
(A) Cartoon depicting developmental timing in hours (h) and days (d) at 29°C and 18°C, respectively. Grey arrow marks the developmental timing at which the wing is specified. L1-L3, larval stages. (B) A series of cuticle preparations of male adult wings carrying the tub-gal80ts transgene and the nub-gal4 driver and shifted from 18°C to 29°C at the developmental time points (red arrows) indicated in the corresponding cartoons to initiate expression of GFP- or dpp-RNAi hairpins until adulthood. The percentages of wing size with respect to control GFP-RNAi expressing wings subjected to the same temperature shifts are indicated. Anterior, A, and posterior, P, compartments are marked by blue lines based on the characteristic anterior-posterior pattern of bristles at the wing margin. Scale bars, 300 µm. (C–E) Histograms plotting tissue size (C), proportions (width and length, D), and cell size (E) of adult wings carrying the tub-gal80ts and the UAS-dpp-RNAi transgenes and the nub-gal4 driver, shifted from 18°C to 29°C at the developmental time points TS1-TS6 indicated in the cartoons in B and normalized as a percent of the GFP-RNAi expressing control wings. Error bars show standard deviation. Number of wings per temperature >15. ***p<0.001; ns, not significant.
-
Figure 2—source data 1
Summary of tissue size and width and length quantifications.
This file contains numerical data on tissue size and cell size, and width and length quantifications of Figure 2.
- https://doi.org/10.7554/eLife.22013.006
Figure 3 with 1 supplement
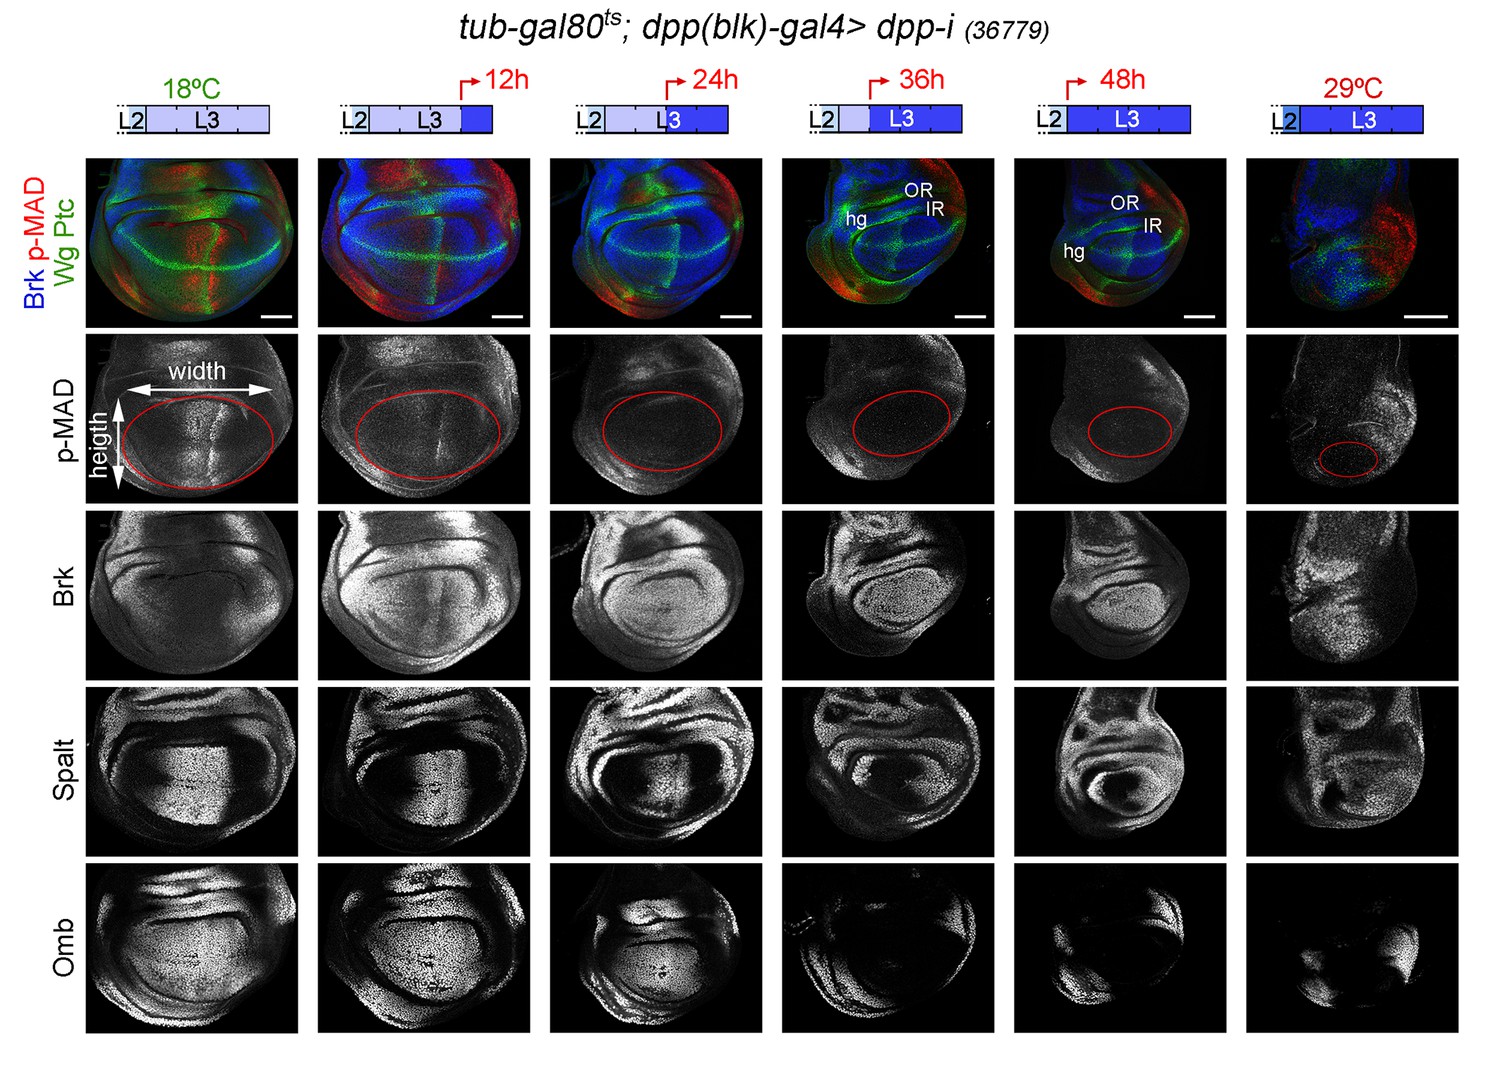
Changes in Dpp signaling and target gene expression upon temporal depletion of boundary Dpp.
Late third instar wing discs of the indicated genotypes, raised at 18°C or 29°C throughout development (left or right panels), or shifted from 18°C to 29°C at the indicated developmental times (red arrows), and stained for Wg and Ptc (green), p-MAD (red or grey), Brk (blue or grey), Spalt (grey) and Omb (grey). A proxy of the wing pouch was marked by a red line. The inner (IR) and outer (OR) rings of Wg, and the hinge (hg) are marked in some wing discs. Note that the width of the hinge is largely unaffected by Dpp depletion. Scale bars, 50 µm. L2, L3, second and third instar.
Figure 3—figure supplement 1
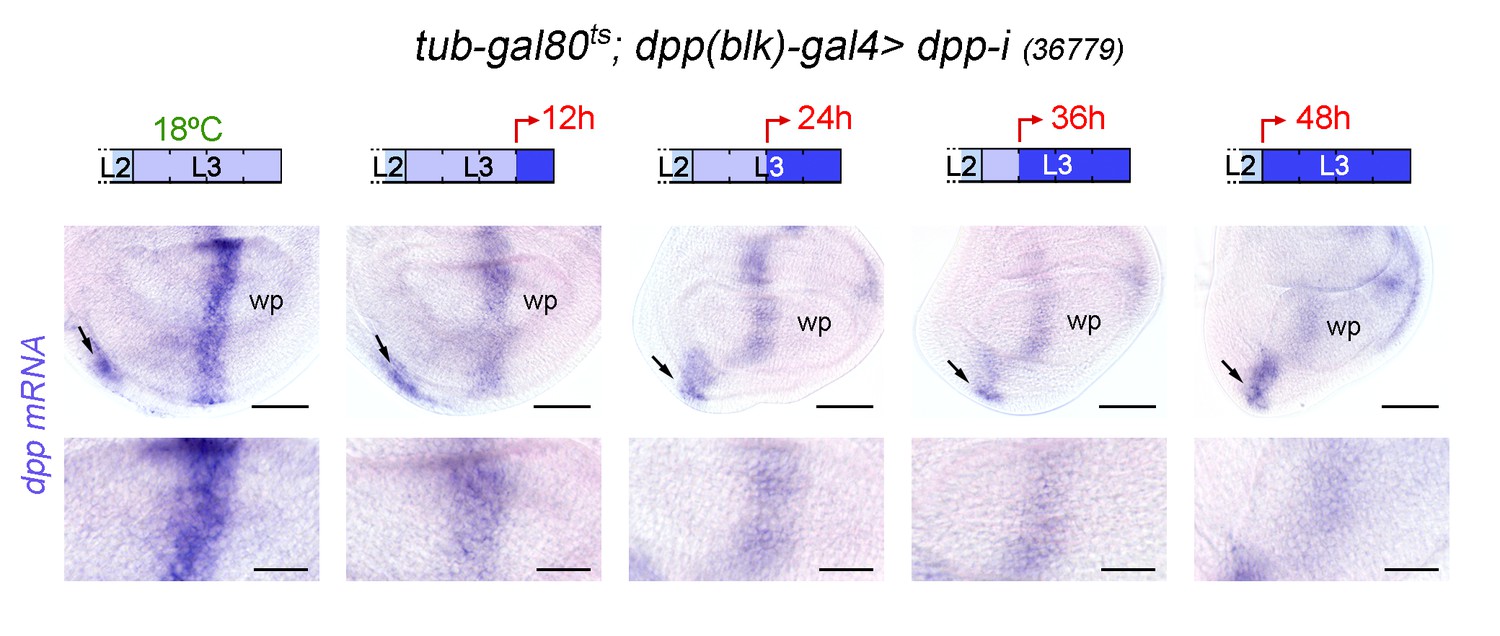
dpp mRNA expression upon temporally controlled expression of dpp-RNAi with the dpp(blk)-gal4 driver.
Late third instar wing discs of the indicated genotype, raised at 18°C throughout development (left panel), or shifted from 18°C to 29°C at the indicated developmental times (red arrows), and stained to visualize dpp mRNA (purple). All samples were processed in parallel. Lower panels show high magnification of the dpp stripe. Scale bars, 50 µm (upper panels), or 25 µm (bottom panels). L2, L3, second and third instar. While dpp mRNA levels are gradually reduced in the wing pouch (wp), they remain largely unaffected in the ventral hinge (arrows), most probably as a consequence of dpp(blk)-gal4 not driving robust expression of dpp-RNAi in this region.
Figure 4 with 3 supplements
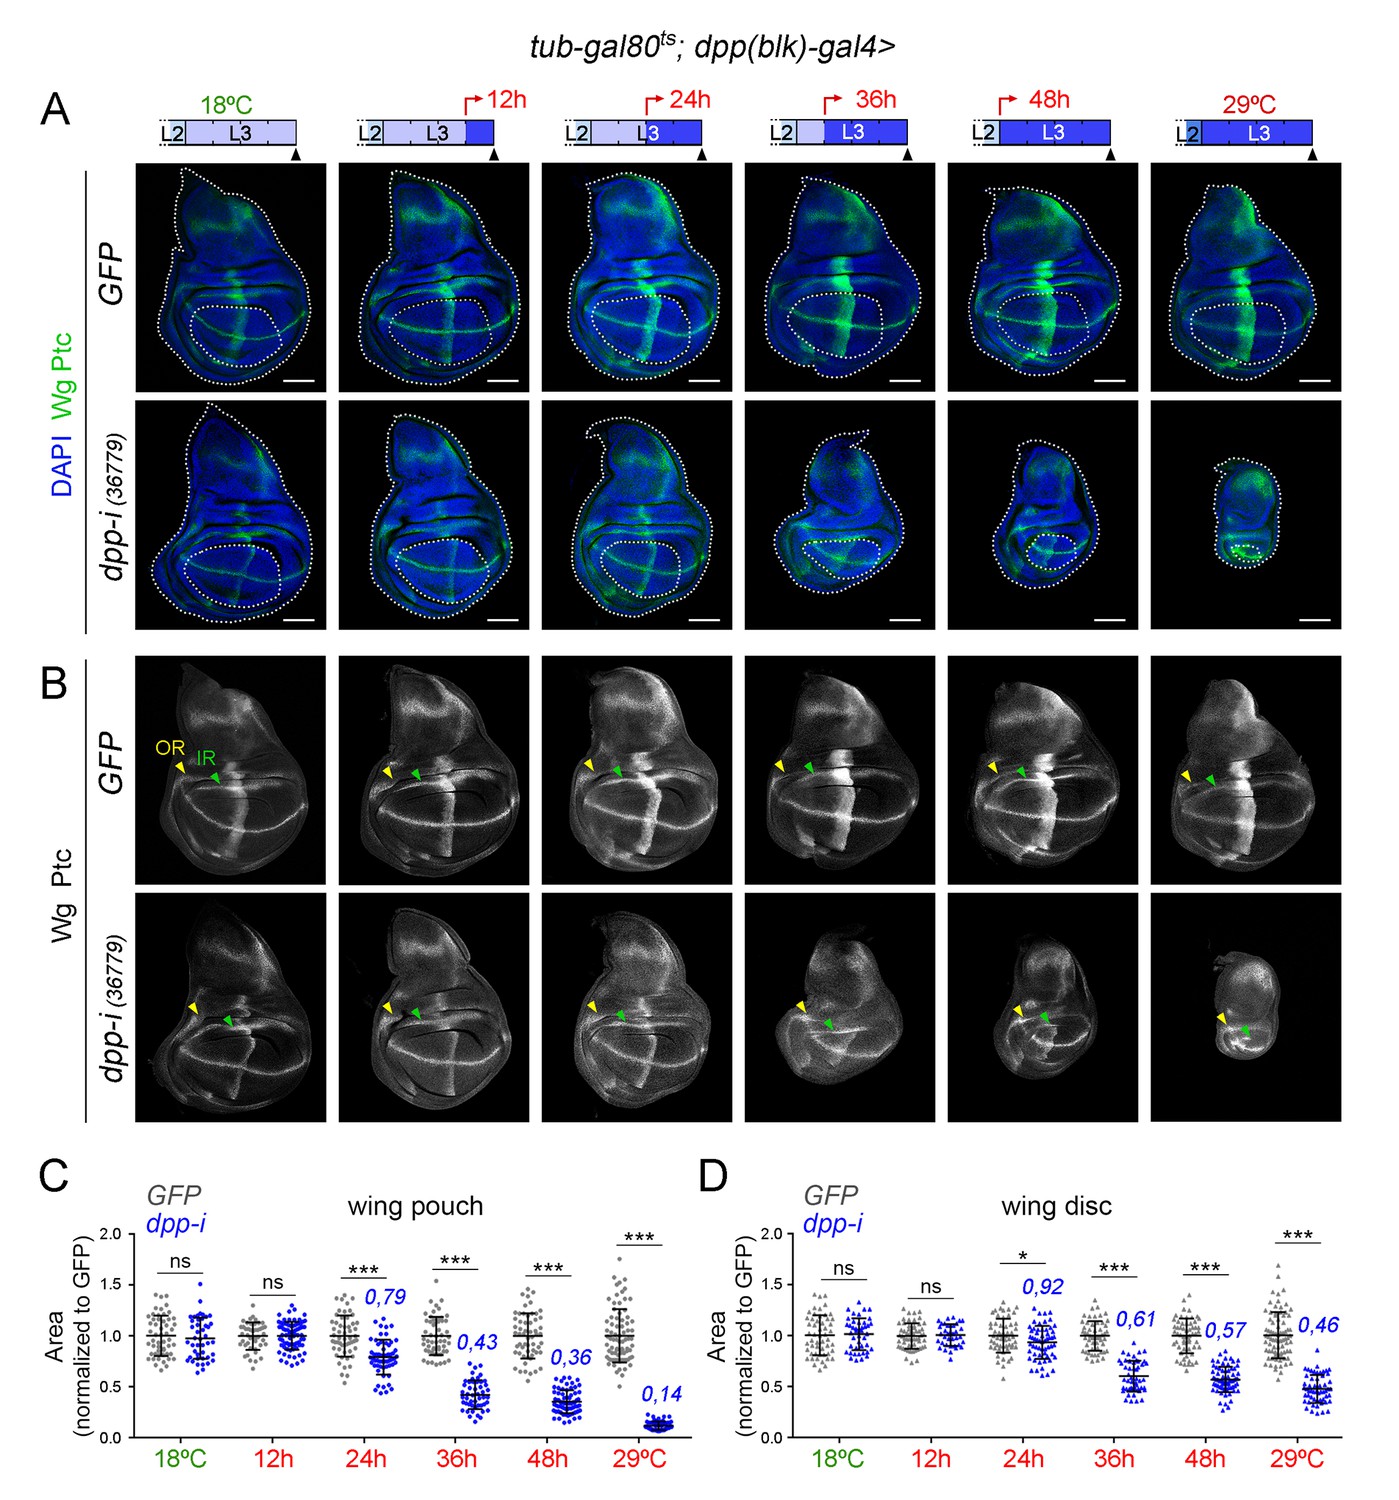
Effects on the size of the wing pouch and wing disc upon temporal depletion of boundary Dpp.
(A, B) Late third instar wing discs of the indicated genotypes, raised at either 18°C or 29°C throughout development (left and right panels) or shifted from 18°C to 29°C at the indicated developmental times (red arrows). Discs were stained for Wg and Ptc (A, green or B, white), and DAPI (A, blue). In A, wing pouch and disc contours are marked by a dotted line. In B, the outer, OR, and inner, IR, rings of Wg are marked by arrowheads and used to delimit the hinge (between the rings). Note the width of the hinge is largely unaffected by Dpp depletion. Scale bars, 100 µm. (C, D) Scatter plots showing the size (normalized to GFP) of the wing pouch (C) and wing disc (D) of the indicated genotypes, raised at either 18°C or 29°C throughout development or shifted from 18°C to 29°C at the indicated developmental times shown in A. Average wing pouch or wing disc areas of dpp-RNAi-expressing individuals (normalized to GFP) are shown in blue. Error bars show standard deviation. Number of wing discs per experiment: n(GFP)=45–75; n(dpp-i)=40–70. ***p<0.001, *p<0.05; ns, not significant.
-
Figure 4—source data 1
Summary of tissue size quantifications.
This file contains numerical data on tissue size quantifications of Figure 4.
- https://doi.org/10.7554/eLife.22013.010
Figure 4—figure supplement 1
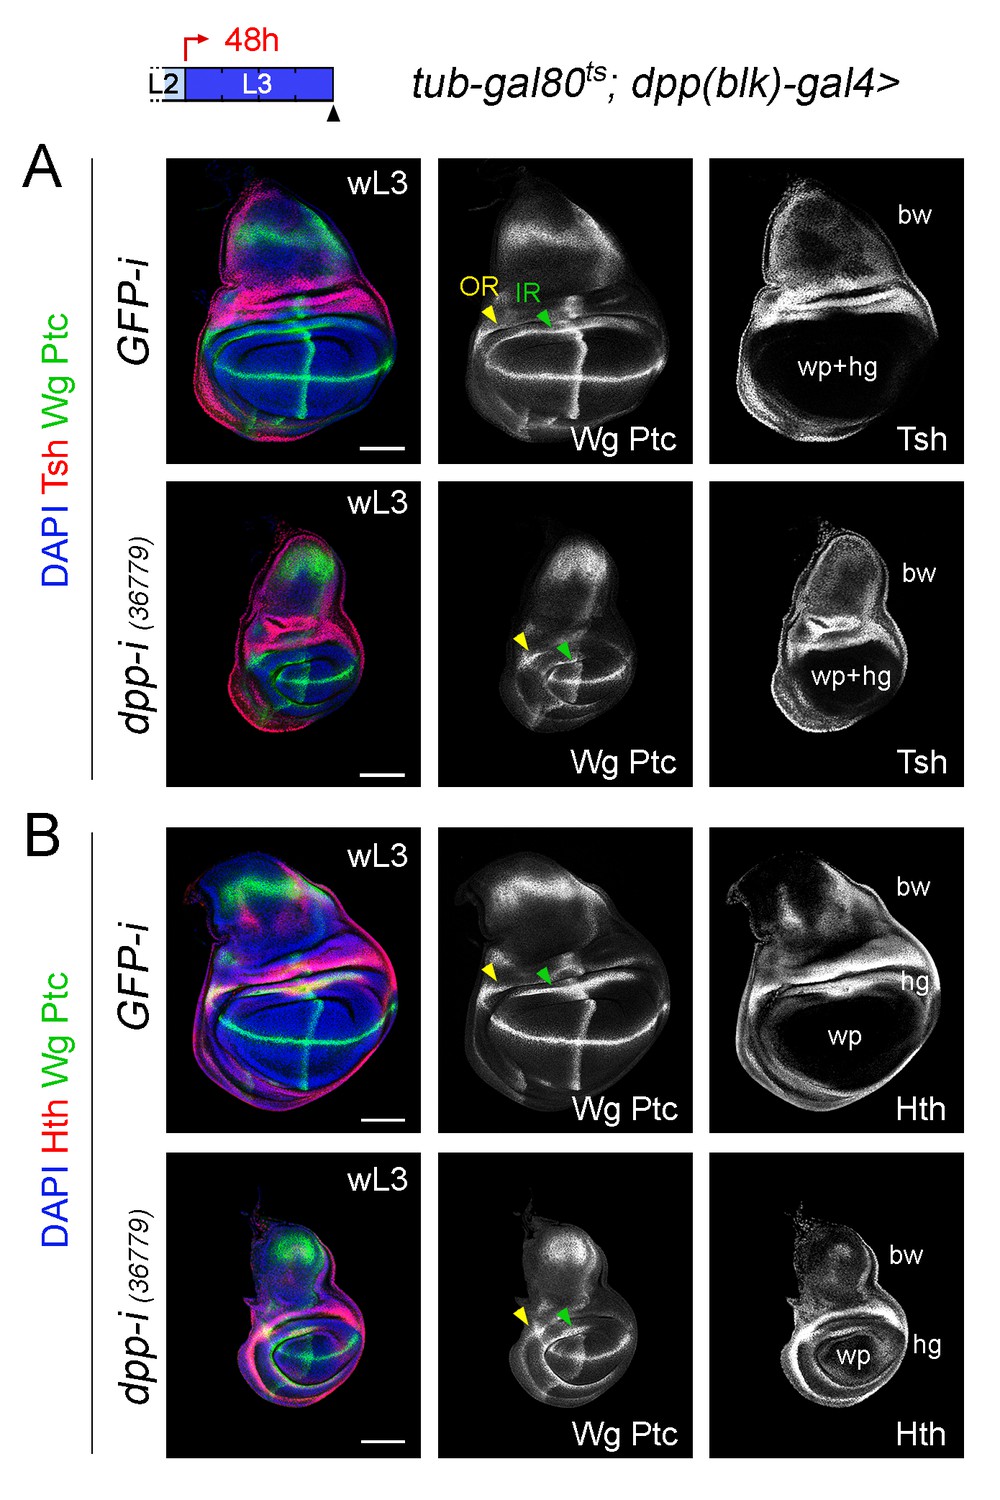
Different effects of Dpp-depletion on the size of the wing pouch and hinge.
(A, B) Late third instar larval wing discs of the indicated genotypes, raised at 29°C during the last 48 hr of larval development and stained for Wg and Ptc protein (green or white), Teashirt (Tsh, red or white, (A), Homothorax (Hth, red or white, (B) and DAPI (blue). Tsh is expressed in the body wall region and contributes to delimit the region that will give rise to the adult wing hinge (hg) and wing pouch (wp) structures. Hth is expressed in the body wall and hinge regions and contributes to delimit the region that will give rise to the adult wing pouch (wp). The two concentric rings of Wingless expression (Outer Ring, IR, and Inner Ring, IR) are marked by arrowheads and are used to delimit the hinge (between the rings). Note that the width of the hinge is largely unaffected by Dpp depletion. Scale bars, 100 µm. L2, L3, wL3: second, third, and late third larval stages.
Figure 4—figure supplement 2
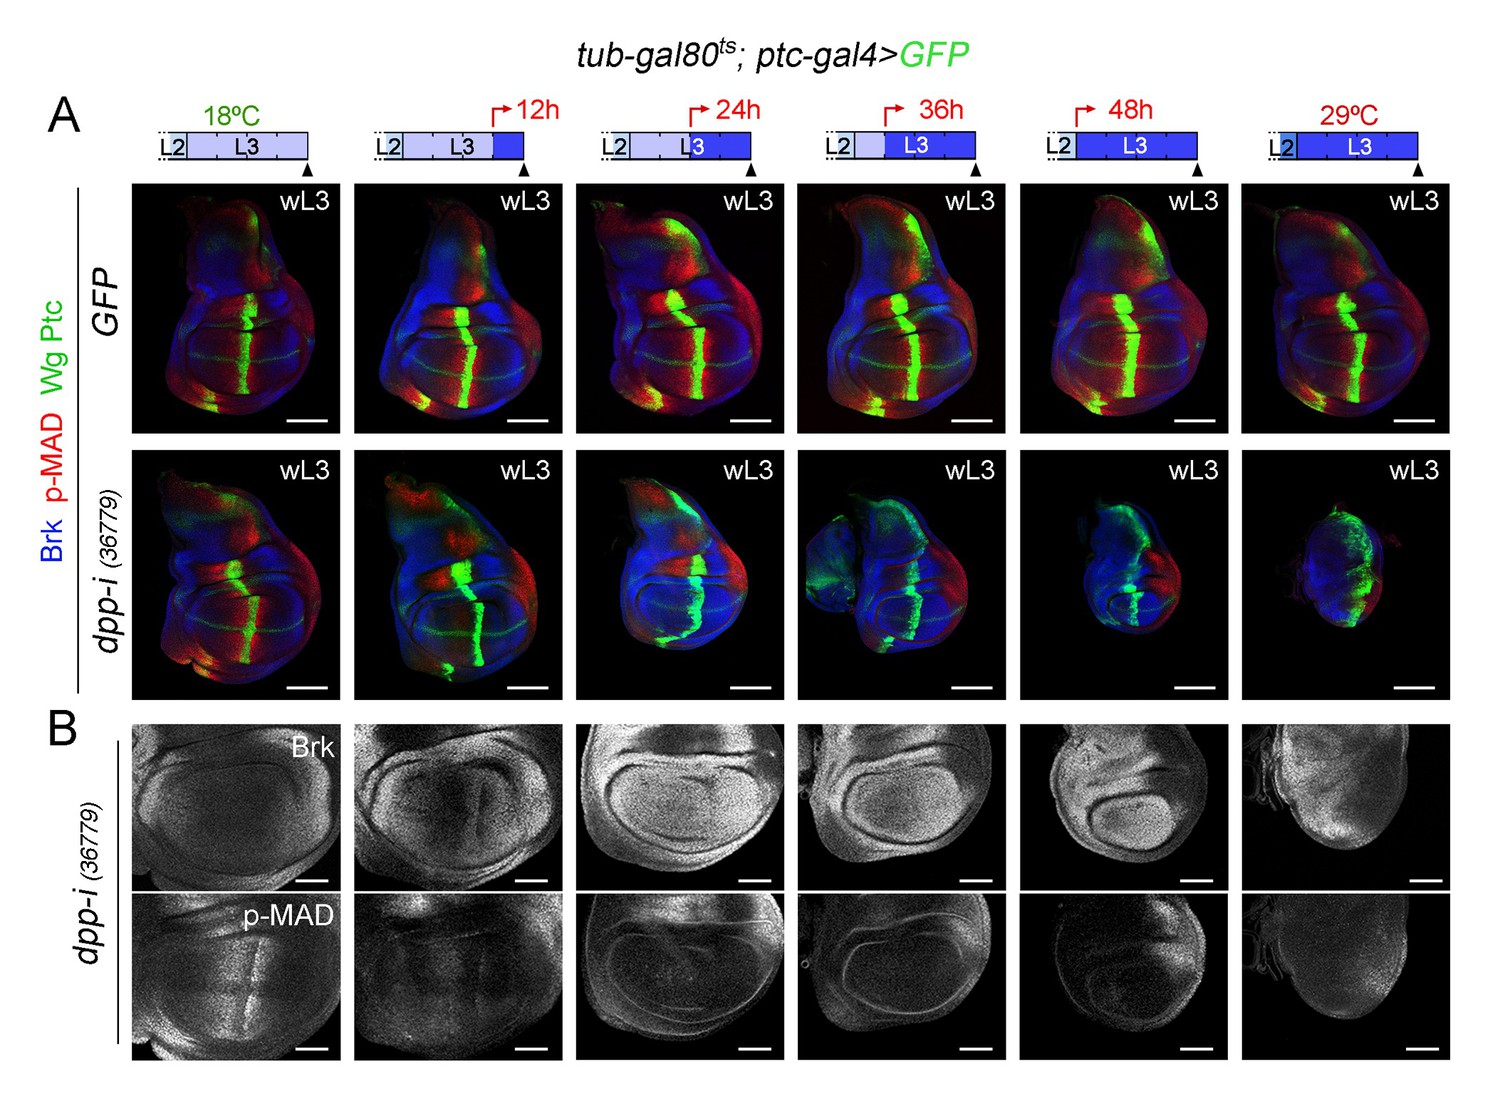
Boundary Dpp is required for growth of the wing disc.
(A) Larval wing discs of the indicated genotypes grown at 18°C or 29°C during whole larval development (left and right examples) or shifted from 18°C to 29°C at the developmental times indicated in the cartoons (red arrows). Discs were dissected in late third instar (wL3) and stained for Wg and Ptc (green), p-MAD (red), and Brinker (Brk, blue). Scale bars, 100 µm. L2, L3, second and third larval stages. (B) Higher magnification of the Dpp-depleted wing pouches of panel A) are shown to visualise p-MAD and Brinker (Brk) in grey. Scale bars, 50 µm.
Figure 4—figure supplement 3
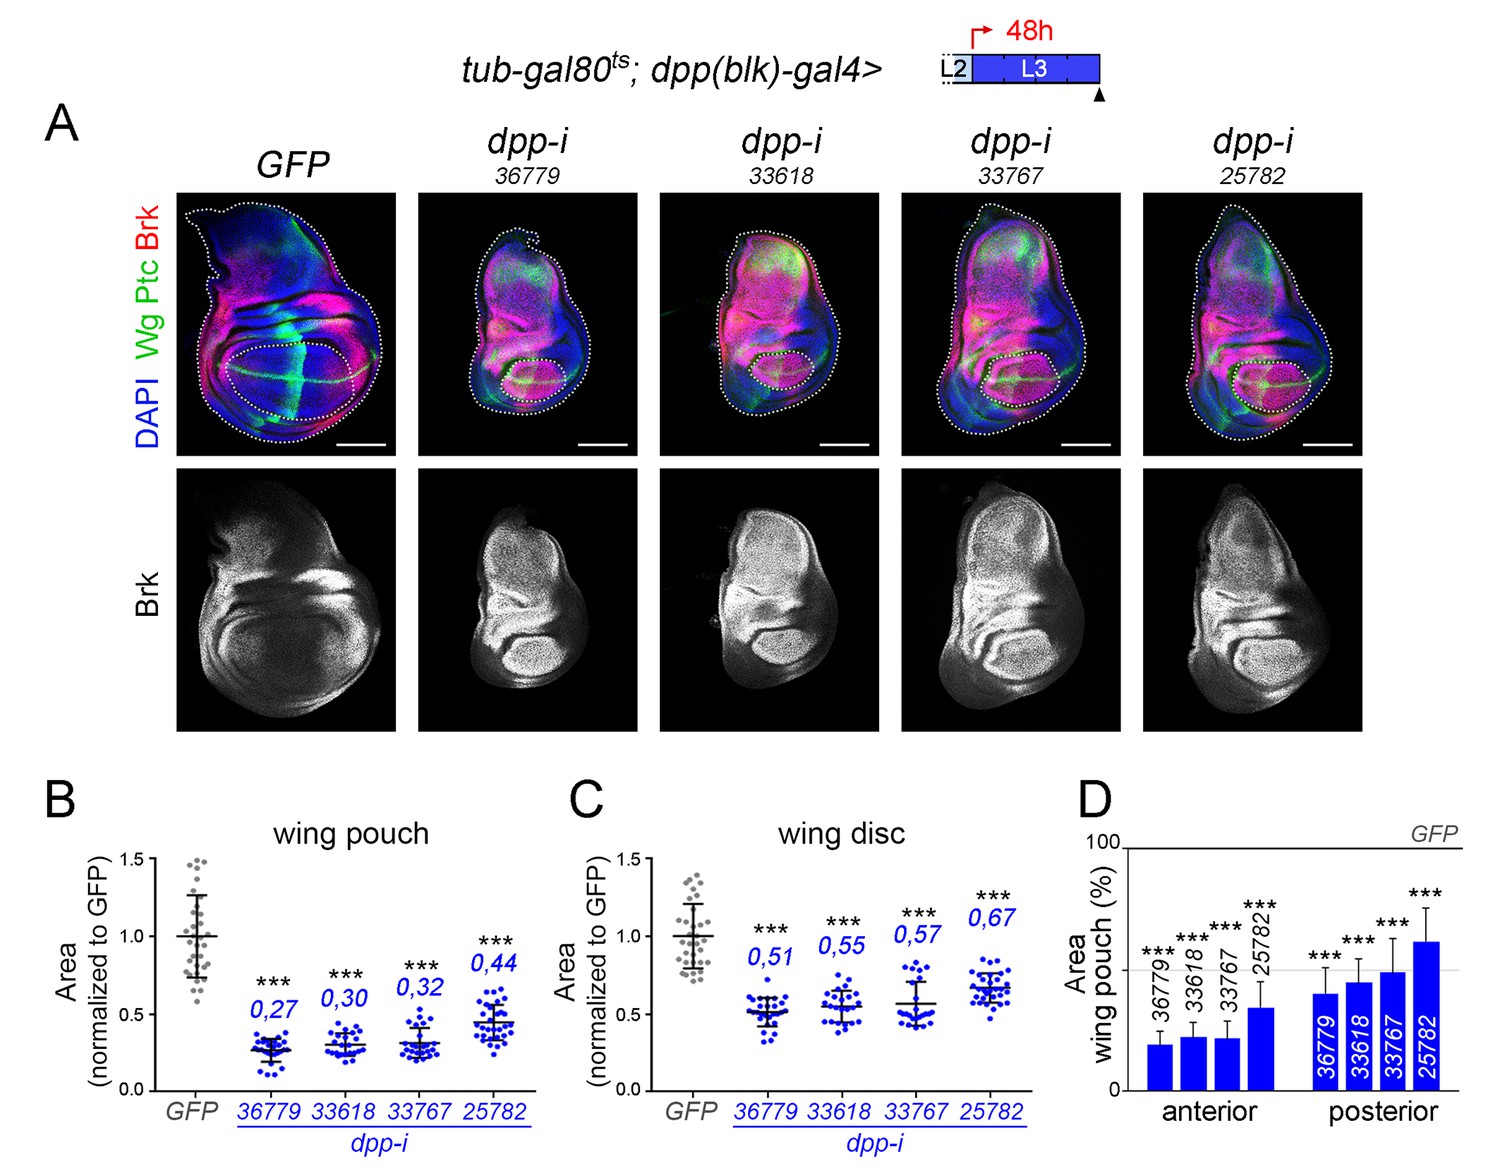
Effects on the size of the wing pouch, wing disc and anterior and posterior compartments upon temporal depletion of boundary Dpp with different dpp-RNAi lines.
(A) Larval wing discs of the indicated genotypes, shifted from 18°C to 29°C 48 hr before dissection (see cartoons with the red arrows), dissected in late third instar (wL3) and stained for Wg and Ptc (green), and Brinker (Brk, red or white) and labelled with DAPI (blue). Scale bars, 100 µm. L2, L3, second and third larval stages. Wing pouch and wing discs contours are marked by dotted lines in the upper panels. (B, C) Scatter plots showing the size (normalized to GFP) of the wing pouch (B) and wing disc (C) of the same genotypes as in A) and subject to the same induction protocol. Average wing pouch or wing disc areas of dpp-RNAi-expressing individuals (normalized to GFP) are shown in blue. Error bars represent standard deviation. Number of wing discs per experiment, n = 24–33. ***p<0.001. (D) Histograms plotting the size of the anterior and posterior compartments regions (normalised to those of control discs expressing GFP) of late third instar wing pouches of the same genotypes as in A) and subject to the same induction protocol. Error bars represent standard deviation, ***p<0.001.
-
Figure 4—figure supplement 3—source data 1
Summary of tissue size quantifications.
This file contains numerical data on tissue size quantifications of Figure 4—figure supplement 3.
- https://doi.org/10.7554/eLife.22013.014
Figure 5 with 1 supplement
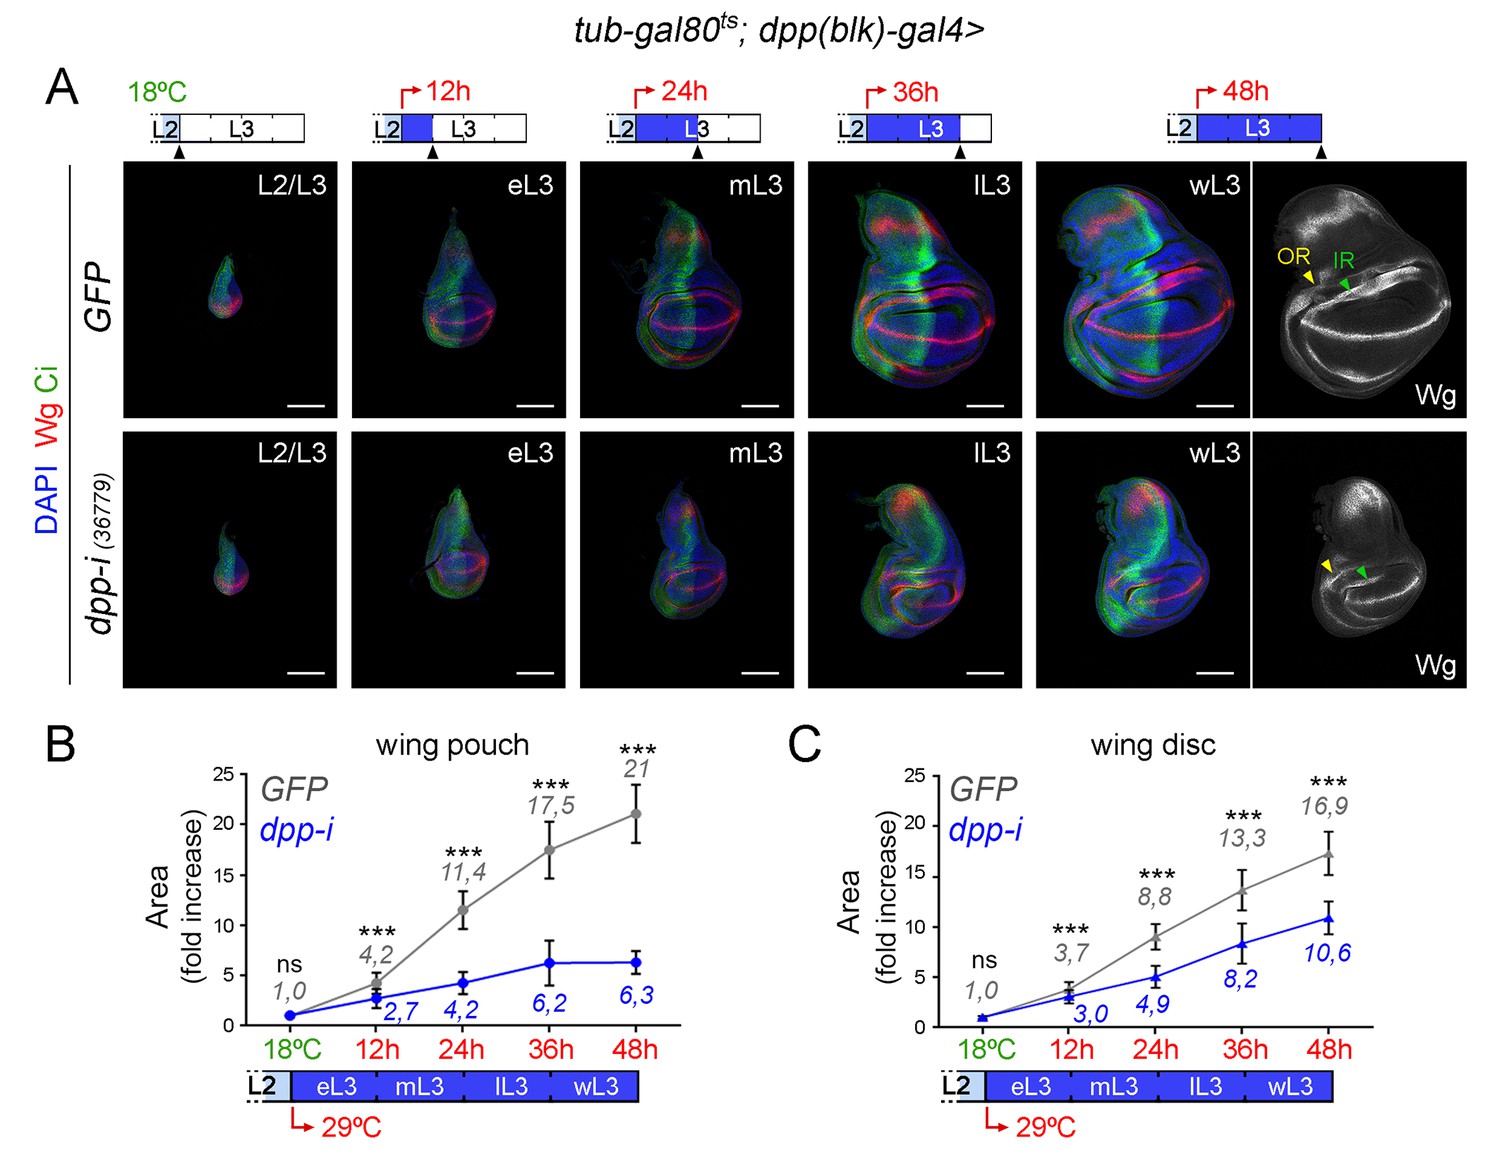
Effects on growth rates in the wing pouch and wing disc upon boundary depletion of Dpp.
(A) Larval wing discs of the indicated genotypes shifted from 18°C to 29°C at the L2/L3 transition (red arrows) and dissected 0, 12, 24, 36 and 48 hr thereafter. Discs stained for Wg (red) and Ci (green), and DAPI (blue). Scale bars, 100 µm. L2, L3, eL3, mL3, lL3, wL3: second, third, early-third, mid-third, late-third and wandering-third larval stages. In the right panel, the outer, OR, and inner, IR, rings of Wg are marked by arrowheads and used to delimit the hinge (between the rings). Note the width of the hinge is affected by Dpp depletion to a lesser extent than the pouch. (B, C) Fold change increase in the size of the wing pouch and wing disc (with respect to the one at the L2/L3 transition) of individuals expressing dpp-RNAi (blue) or GFP (grey) shifted from 18°C to 29°C at the L2/L3 transition (red arrows). The average fold change increases in the area of the wing pouch (B) and wing disc (C) with respect to the values at the beginning of the temperature shift at the L2/L3 transition are indicated. Error bars represent standard deviation. Number of wing discs per developmental point: n (GFP) = 25–45; n (dpp-i) = 30–40. ***p<0.001; ns, not significant.
-
Figure 5—source data 1
Summary of tissue size quantifications.
This file contains numerical data on tissue size quantifications of Figure 5.
- https://doi.org/10.7554/eLife.22013.016
Figure 5—figure supplement 1
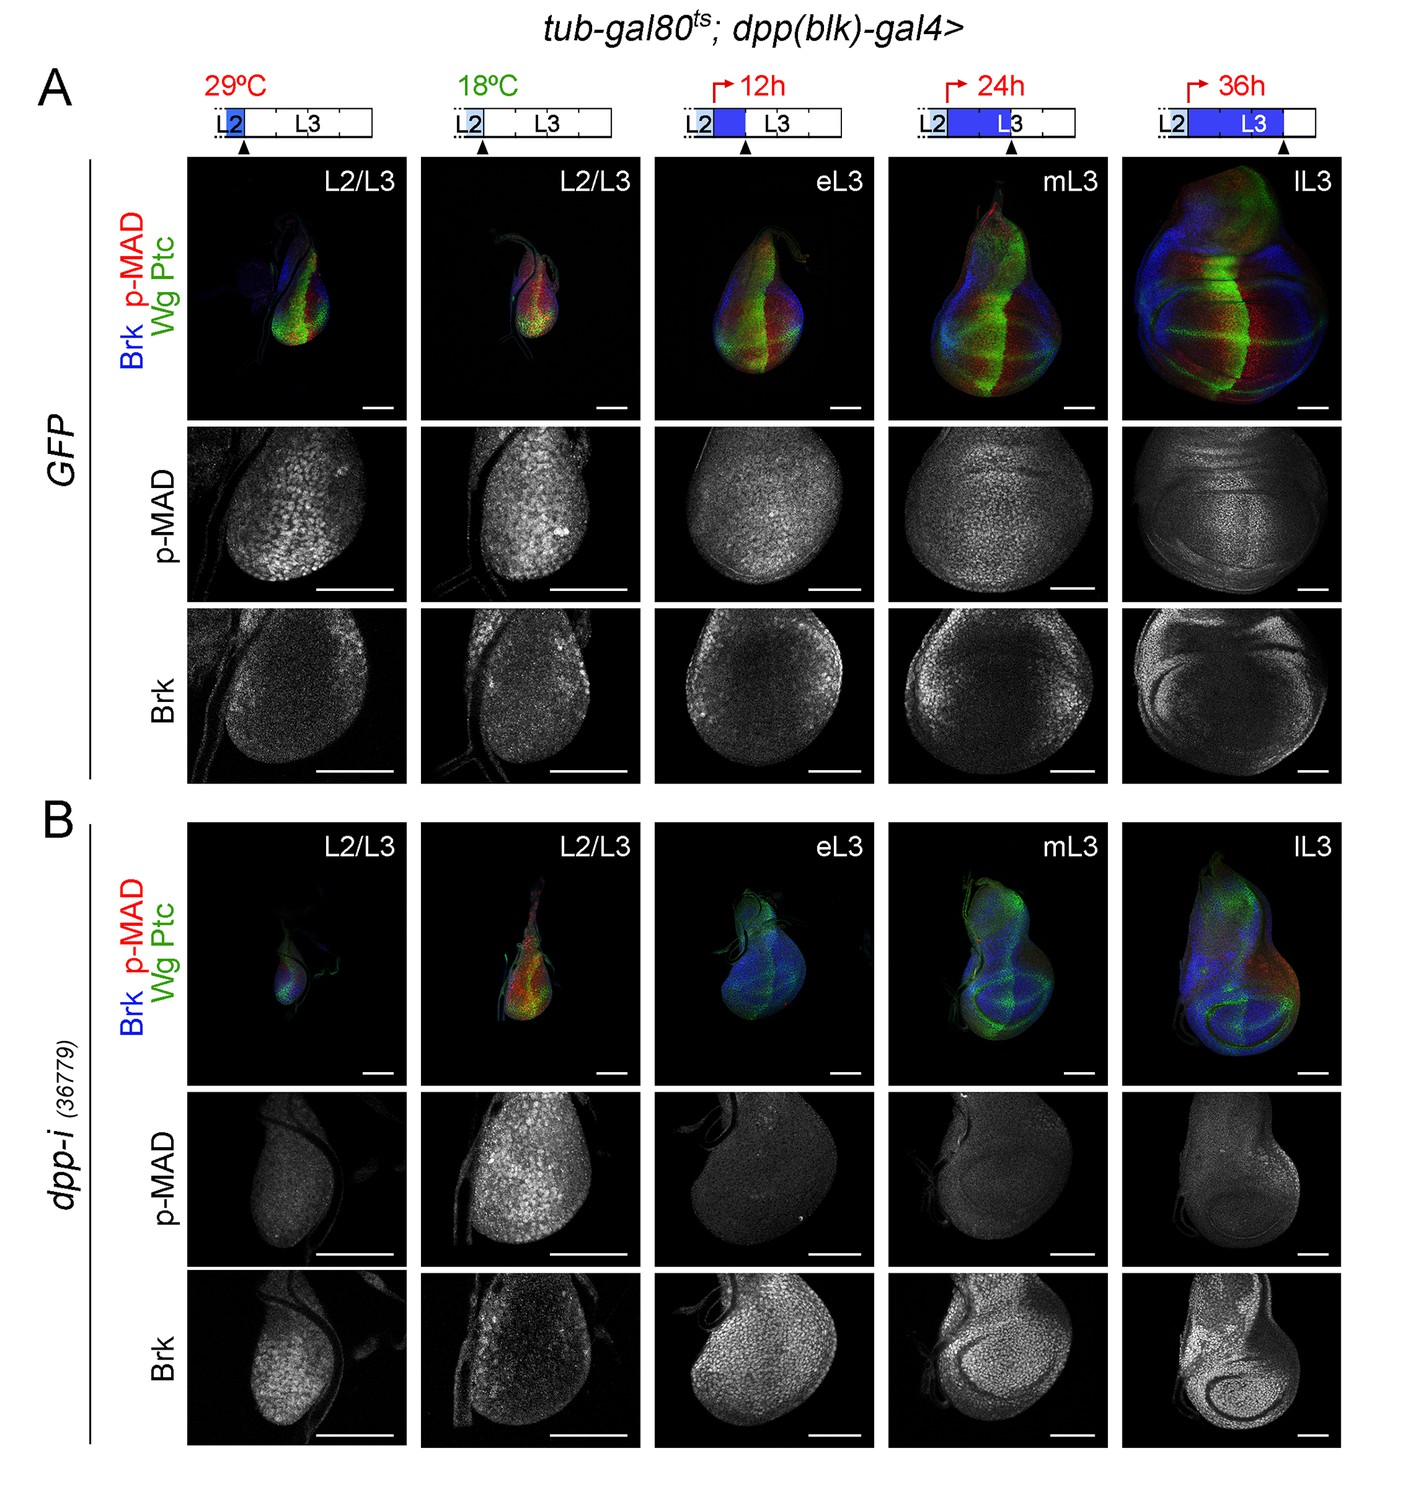
Changes in Dpp signalling in early wing discs upon temporal depletion of boundary Dpp.
(A, B) Larval wing discs of the indicated genotypes raised at 29°C throughout development and dissected at the L2/L3 transition (left column) or shifted from 18°C to 29°C at the L2/L3 transition (red arrows) and dissected 0, 12, 24 and 36 hr thereafter (second to fifth columns). Discs were stained for Wg and Ptc (green), p-MAD (red or grey), and Brk (blue or grey). Higher magnifications of wing pouches are shown to visualize p-MAD and Brk in grey. Scale bars, 50 µm. L2, L3, eL3, mL3, lL3: second, third, early-third, mid-third, and late-third larval stages.
Figure 6
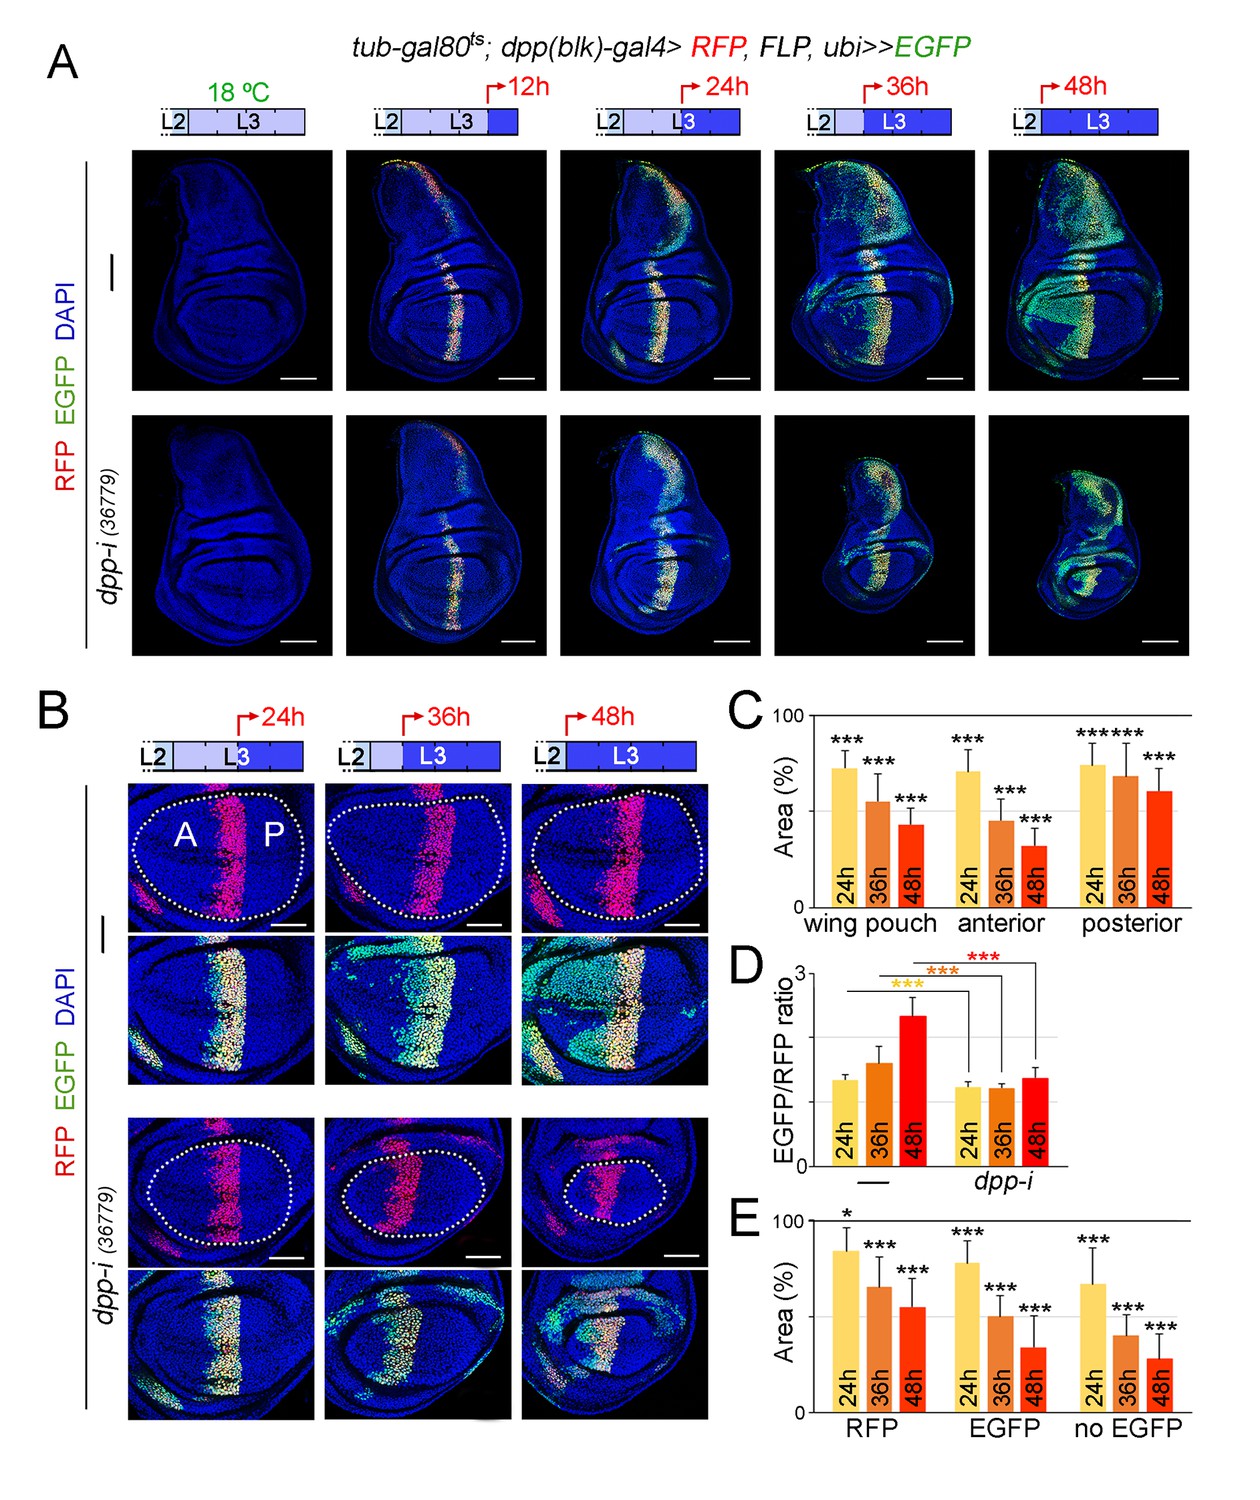
Cell lineage analysis of dpp-RNAi expressing cells and effects on growth rates upon temporal depletion of boundary Dpp.
(A) G-TRACE-mediated cell lineage analysis to irreversibly label all cells born in the dpp-gal4 expressing domain during the last 12, 24, 36 and 48 hr of larval development. Larvae were shifted from 18°C to 29°C at the developmental times indicated in the cartoons (red arrows) to express dpp-RNAi, and late third instar wing discs were stained for RFP (red), EGFP (green) and DAPI (blue). As a proof of concept, larval wing discs were raised at 18°C (left panel). Scale bars, 100 µm. L2, L3, second and third larval stages. (B) G-TRACE to label all cells born in the dpp-gal4-expressing domain during the last 24–48 hr of larval development. Larvae were shifted from 18°C to 29°C at the indicated developmental times (red arrows) and late third instar wing discs were stained for RFP (red), EGFP (green) and DAPI (blue). Wing pouch contours are marked by a dotted line. Scale bars, 50 µm. L2, L3, second and third instar. A, anterior; P, posterior compartments. (C–E) Histograms plotting the size of the indicated regions (normalised to those of control discs not expressing dpp-RNAi, (C, E) or the size ratio between the EGFP- and RFP-expressing domains (D) in late third instar wing pouches (inside dotted line) expressing dpp-RNAi during the last 24–48 hr of larval development. Number of discs per genotype and induction time = 20–35. Error bars represent standard deviation, and *p<0.05; ***p<0.001.
-
Figure 6—source data 1
Summary of tissue size and EGFP/RFP ratio quantifications.
This file contains numerical data on tissue size and EGFP/RFP ratio quantifications of Figure 6.
- https://doi.org/10.7554/eLife.22013.019
Figure 7 with 1 supplement
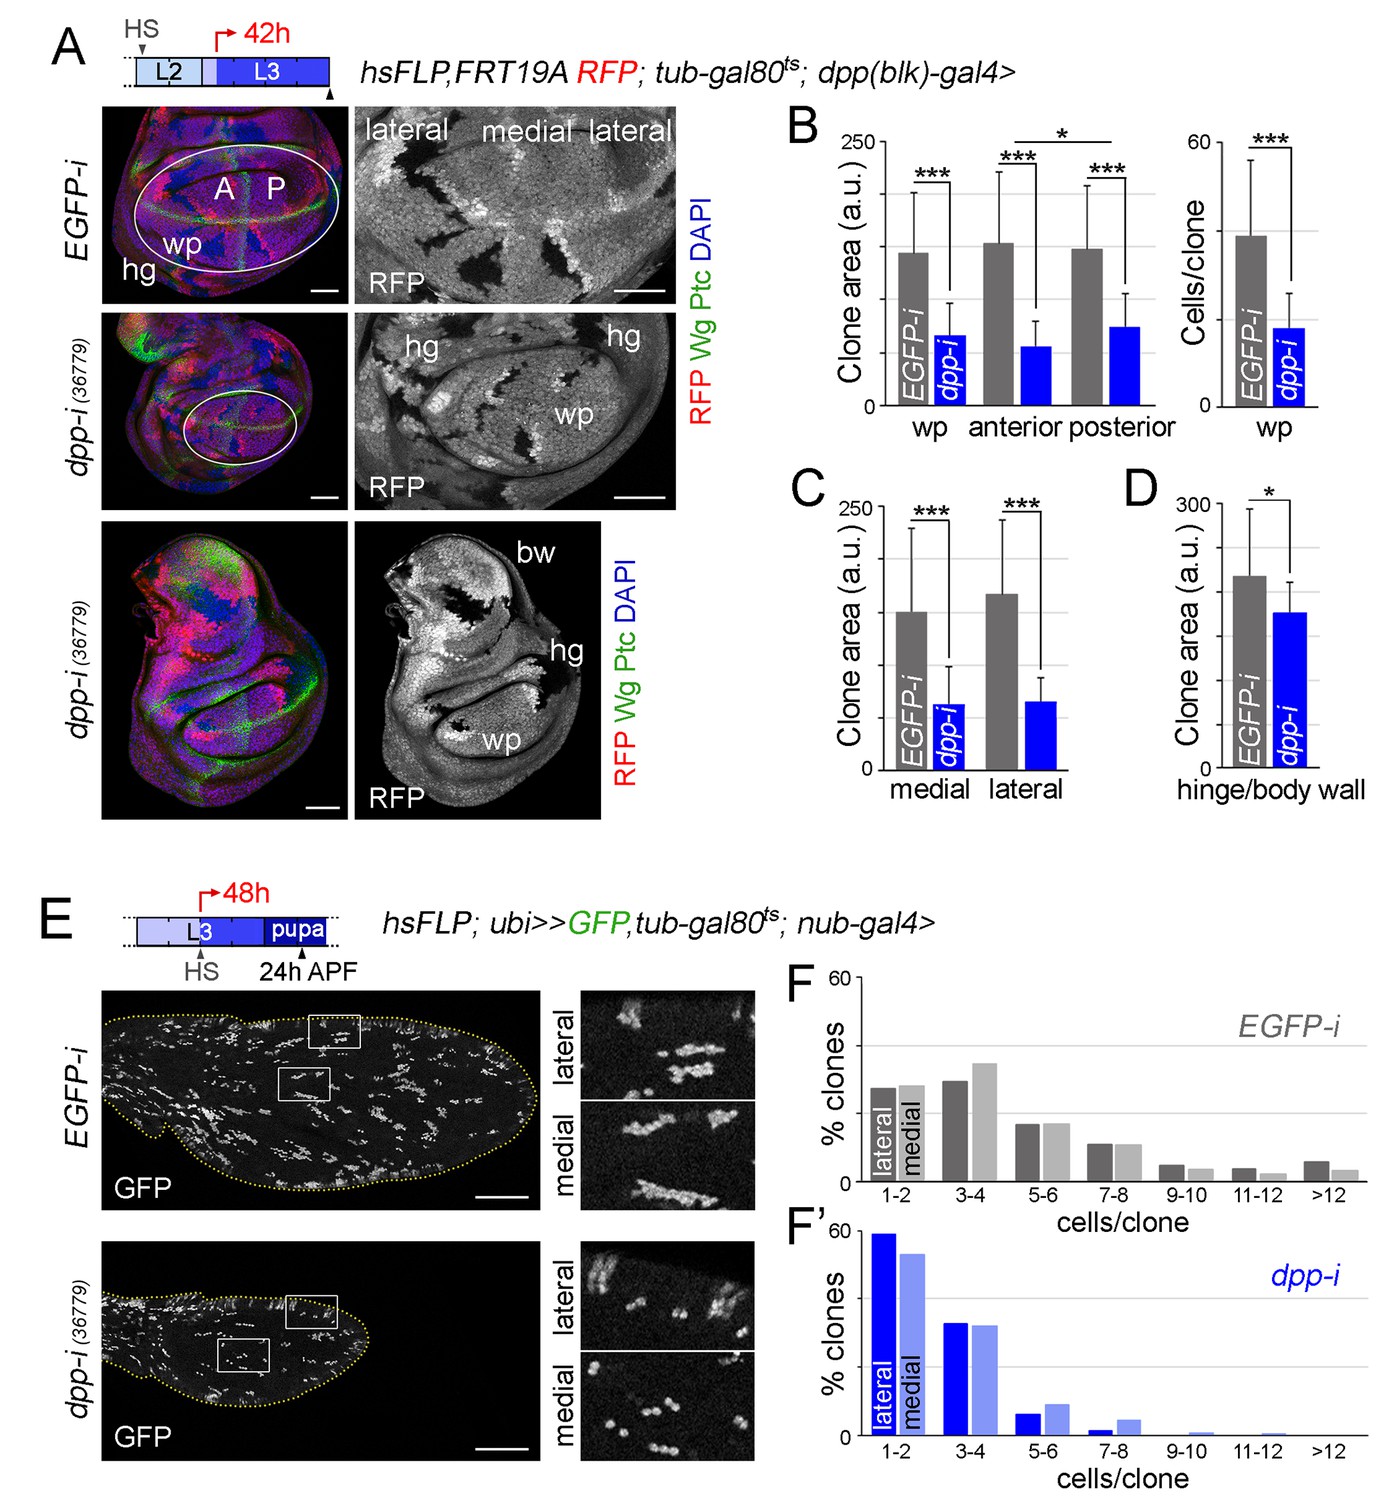
Boundary Dpp regulates growth and proliferation rates equally in medial and lateral regions of the developing wing.
(A, E) Late third instar wing discs (A) or pupal wings (E) expressing the indicated transgenes for 42 hr (A) or 48 hr (E), and bearing neutral clones (labelled by the absence of RFP in red or white in A, or by the expression of GFP in white in E) induced in early second (A) or mid-third (E) instars. In A, discs were stained for Wg and Ptc (green) and DAPI (blue). In E, high magnification of the regions in the white boxes are shown on the right panels. Scale bars, 50 µm (A) or 100 µm (E). L2, L3, second and third instar. A, anterior; P, posterior compartments; wp, wing pouch; hg, hinge; APF, after puparium formation. (B–D) Histograms plotting clone size (in arbitrary units, B–D) or cells per clone (B, right) in the indicated regions of late third instar wing discs expressing the indicated transgenes. Clones were induced in early second instar, transgenes were expressed for 42 hr, and wing discs were dissected in late third instar. Number of clones: n (pouch) = 70–85, n (hinge/body wall)=35–40. Error bars represent standard deviation, and *p<0.05; ***p<0.001. (F, F’) Distribution of cells per clone in the indicated regions of pupal wings expressing the indicated transgenes. Clones were induced in mid-third instar, transgenes were expressed for 48 hr, and pupal wings were dissected 24 hr APF. Number of clones in F: n (lateral) = 427, n (medial) = 855; number of clones in F’: n (lateral) = 337, n (medial) = 404.
-
Figure 7—source data 1
Summary of clone size and number of cells per clone quantifications.
This file contains numerical data on clone size and number of cells per clone quantifications of Figure 7.
- https://doi.org/10.7554/eLife.22013.021
Figure 7—figure supplement 1
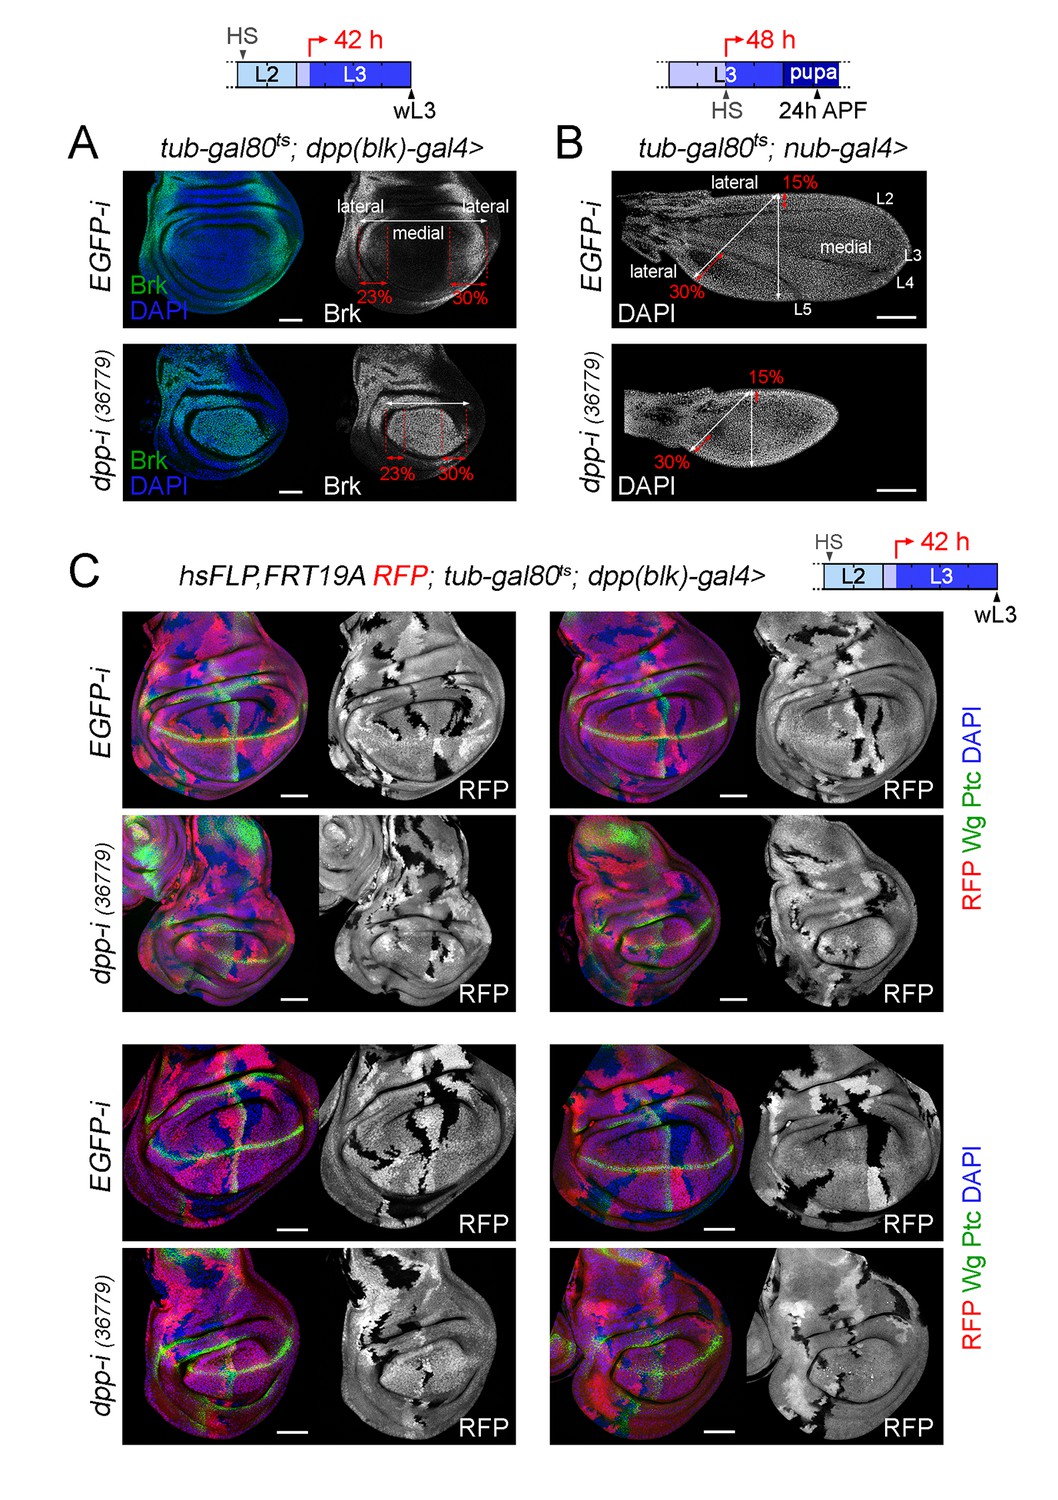
Different effects of Dpp-depletion on the growth rates of wing pouch and hinge cells.
(A, B) Late third instar wing discs (A) and 24 h-after puparium formation (APF) pupal wings (B) of the indicated genotypes and shifted from 18°C to 29°C at the developmental times indicated in the cartoons (red arrows). Discs were stained for Brinker (Brk, green or white, (A) and DAPI (blue in A, white in B). The lateral region of a wild type wing pouch was labelled by the expression of Brinker and covered 23% (in the anterior compartment) or 30% (in the posterior compartment) of the wing pouch width. These numbers were used to demarcate the lateral regions of dpp-depleted wing pouches. The lateral regions of a wild-type pupal wing correspond to the regions located anterior to vein L2 and posterior to vein L5, and covered 15% (in the anterior compartment) or 30% (in the posterior compartment) of the pupal wing width along the axes depicted in panel B. These numbers were used to demarcate the lateral regions of dpp-depleted pupal wings. (C) Late third instar wing discs expressing the indicated transgenes during the last 42 hr of larval development and stained for RFP (red), Wg and Ptc (green), and DAPI (blue). Neutral clones labelled by the absence of RFP were induced in early second instar. Scale bars, 50 µm (A, C) and 100 µm (B). L2, L3: second and third larval stages in the cartoons shown in A-C. L2-L5, longitudinal veins in the pupal wing shown in B.
Figure 8 with 2 supplements
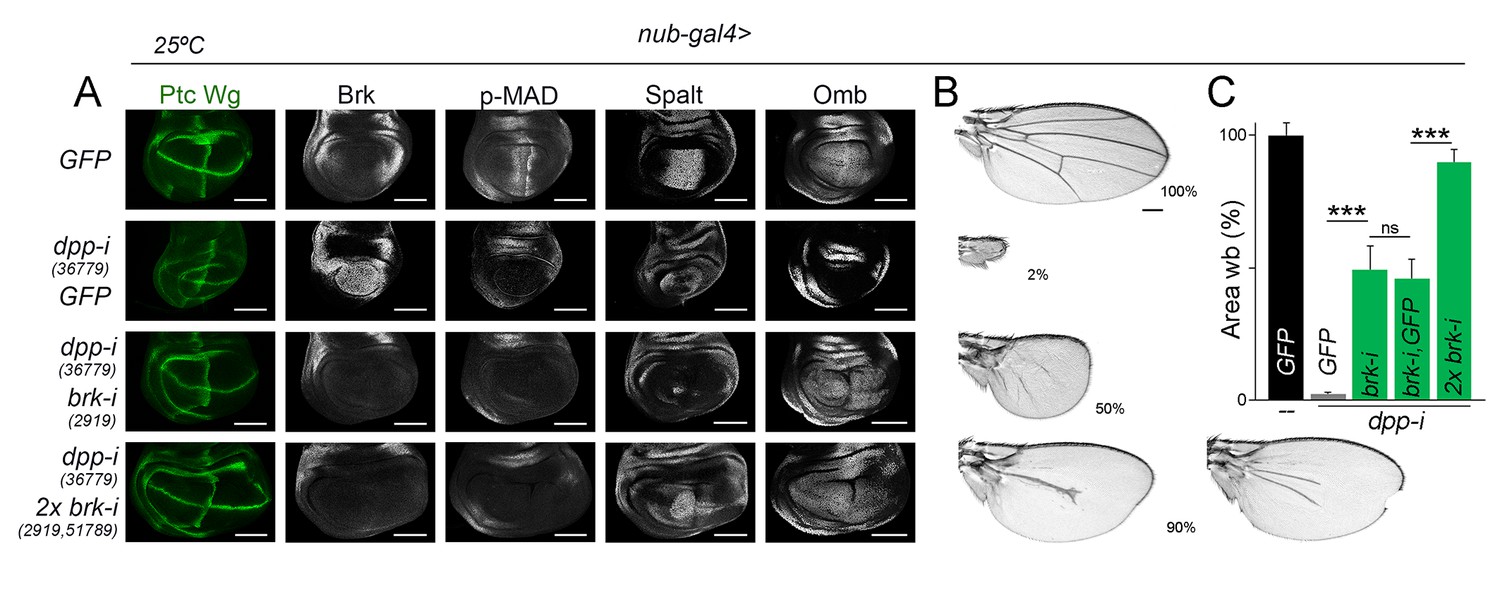
Wing growth in the absence of graded activity of Dpp.
(A) Late third instar wing discs of the indicated genotypes, and stained for Wg and Ptc (green), and Brk, p-MAD, Spalt and Omb (grey). Scale bars, 100 µm. (B) A series of cuticle preparations of male adult wings of the indicated genotypes. Percentages of wing size with respect to control GFP-expressing wings are indicated. Scale bars, 300 µm. (C) Histograms plotting tissue size of adult wing blades (wb) carrying the indicated transgenes and the nub-gal4 driver, and normalized as a percent of the GFP-expressing control wings. Error bars show standard deviation. Number of wings per temperature = 17–30. ***p<0.001; ns, not significant. Individuals were grown at 25°C.
-
Figure 8—source data 1
Summary of tissue size quantifications.
This file contains numerical data on tissue size quantifications of Figure 8.
- https://doi.org/10.7554/eLife.22013.024
Figure 8—figure supplement 1

Wing growth in the absence of graded activity of Dpp.
(A) Late third instar wing discs of the indicated genotypes, and stained for Wg and Ptc (green), GFP (purple), and Brk, p-MAD, Spalt and Omb (grey). Scale bars, 100 µm. (B) A series of cuticle preparations of male adult wings of the indicated genotypes. Percentages of wing size with respect to control GFP-expressing wings are indicated. Scale bars, 300 µm. (C) Histograms plotting tissue size of adult wing blades (wb) carrying the indicated transgenes and the rn-gal4 driver, and normalized as a percent of the GFP-expressing control wings. Error bars show standard deviation. Number of wings per temperature = 12–20. ***p<0.001; ns, not significant. Individuals were grown at 29°C.
-
Figure 8—figure supplement 1—source data 1
Summary of tissue size quantifications.
This file contains numerical data on tissue size quantifications of Figure 8—figure supplement 1.
- https://doi.org/10.7554/eLife.22013.026
Figure 8—figure supplement 2
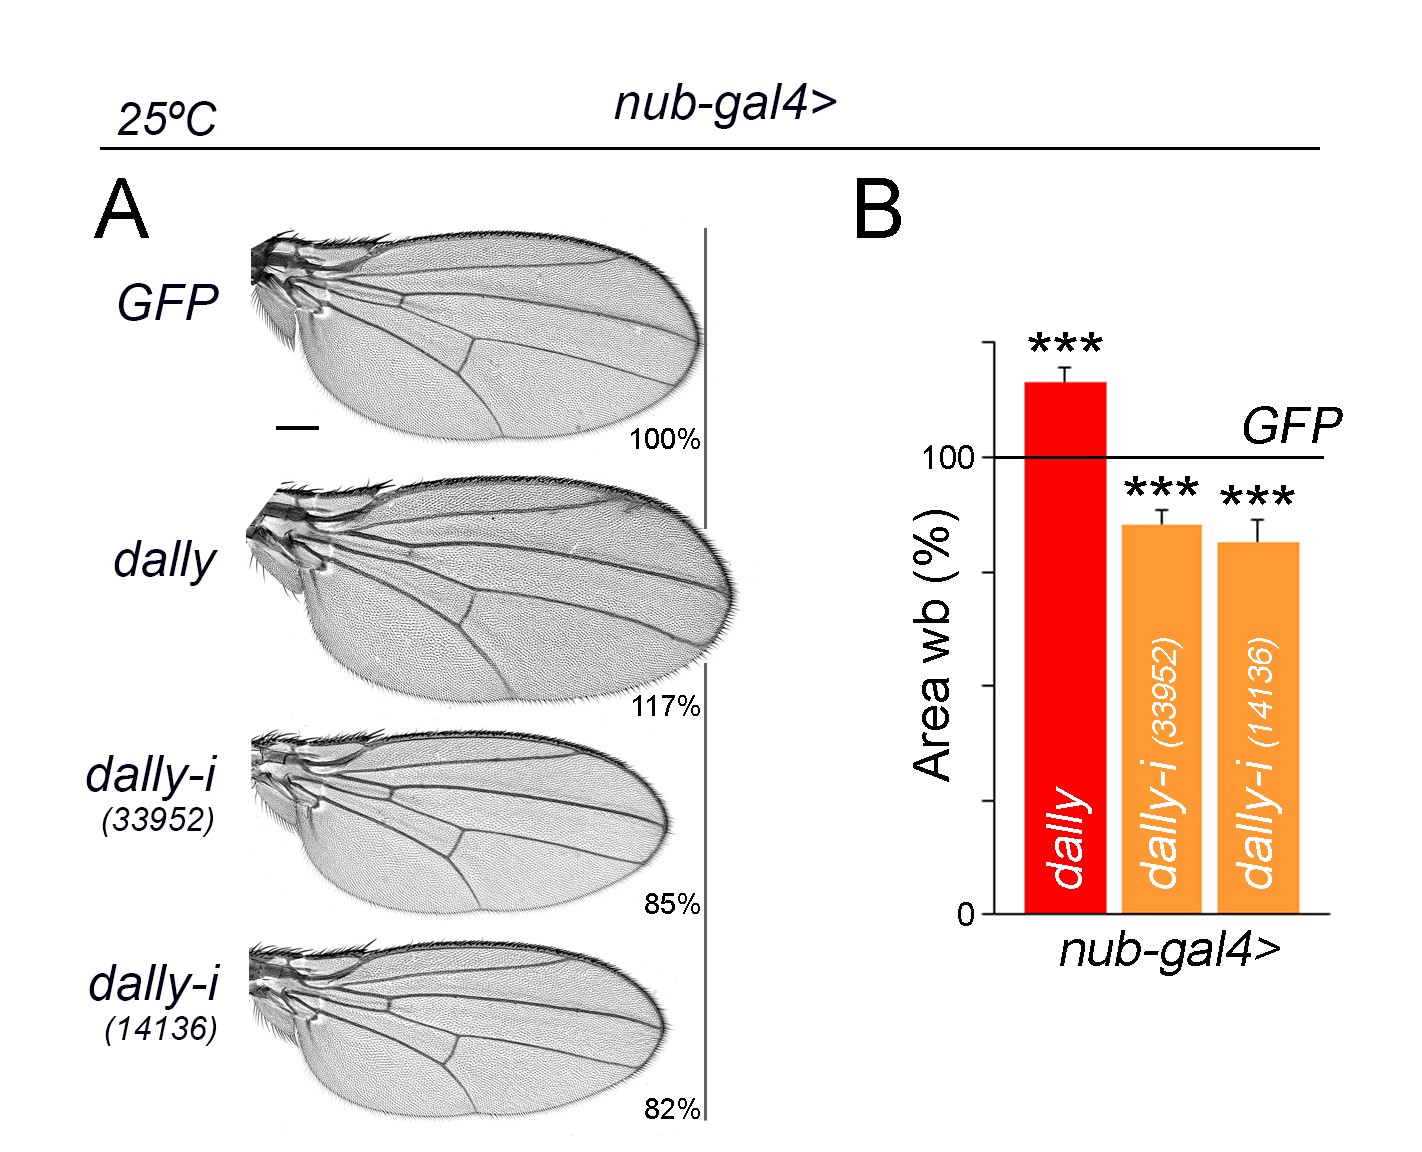
Dpp spreading and wing growth.
(A) A series of cuticle preparations of male adult wings of the indicated genotypes. Percentages of wing size with respect to control GFP-expressing wings are indicated. Scale bars, 300 µm. (B) Histograms plotting tissue size of adult wing blades (wb) carrying the indicated transgenes and the nub-gal4 driver, and normalized as a percent of the GFP-expressing control wings. Error bars show standard deviation. Number of wings per temperature >15. ***p<0.001; ns, not significant. Individuals were grown at 25°C.
-
Figure 8—figure supplement 2—source data 1
Summary of tissue size quantifications.
This file contains numerical data on tissue size quantifications of Figure 8—figure supplement 2.
- https://doi.org/10.7554/eLife.22013.028
Download links
A two-part list of links to download the article, or parts of the article, in various formats.
Downloads (link to download the article as PDF)
Open citations (links to open the citations from this article in various online reference manager services)
Cite this article (links to download the citations from this article in formats compatible with various reference manager tools)
Boundary Dpp promotes growth of medial and lateral regions of the Drosophila wing
eLife 6:e22013.
https://doi.org/10.7554/eLife.22013


