Polycystin-2 is an essential ion channel subunit in the primary cilium of the renal collecting duct epithelium
- Howard Hughes Medical Institute, Boston Children's Hospital, United States
- Harvard Medical School, United States
- Northwestern University, Feinberg School of Medicine, United States
- Boston Children’s Hospital, United States
Figures
Figure 1 with 2 supplements
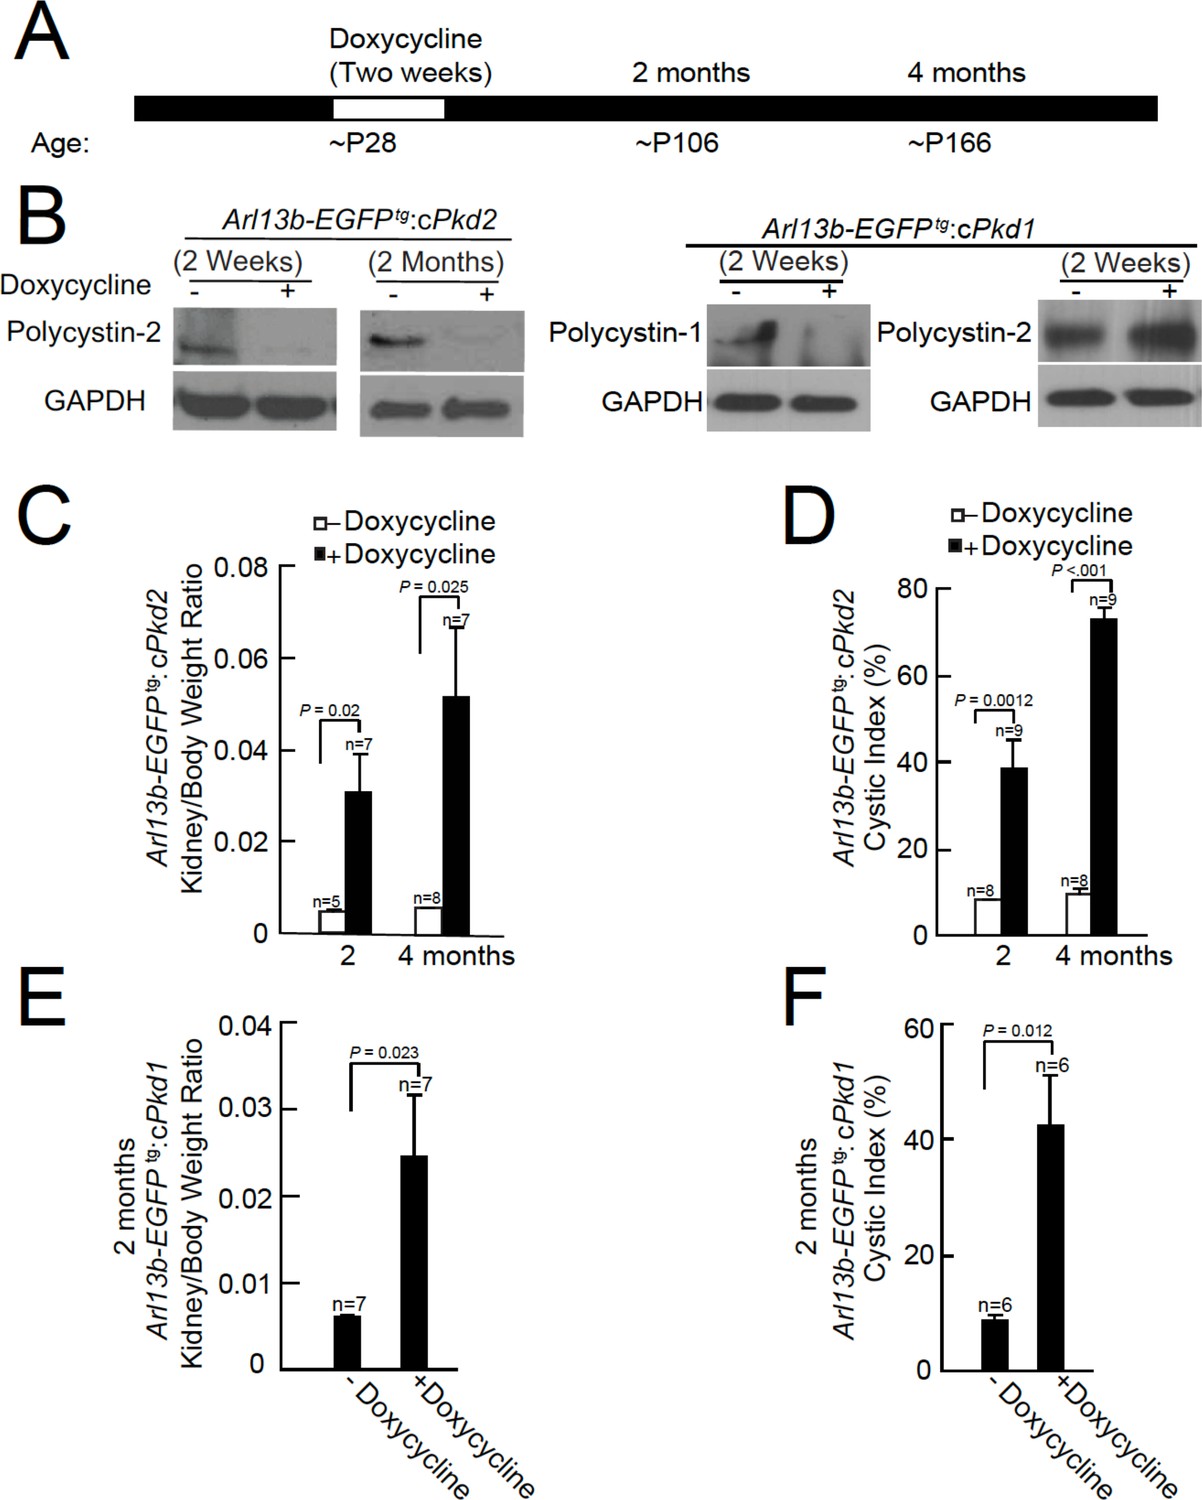
Onset of kidney tubule cyst formation in Arl13b-EGFPtg:cPkd1 and Arl13b-EGFPtg:cPkd2 animals.
(A) Study design to assess cyst formation after genetic ablation of either Pkd1 or Pkd2. One protocol is shown that assesses polycystin-1 or polycystin-2 at P28 in the conditional knockout mouse. (B) Loss of polycystin-1 and polycystin-2 protein expression as assessed by immunoblot, 2 weeks and 2 months after doxycycline removal. Whole cell lysates were prepared from pIMCD cells and subjected to western blot analysis (three independent experiments). A trace amount of polycystin-2 (first row, faint band at 2 weeks after doxycycline removal) is similar to that previously reported (Ma et al., 2013). The band at the left edge (cPkd1, 2 weeks + Doxycycline, first row), appears to be nonspecific, although we cannot rule out polycystin-1 contamination from non-tubule cells. (C) Kidney weight/body was increased in Arl13b-EGFPtg:cPkd2 mice with doxycycline treatment compared to control littermates without doxycycline treatment. (D) Cystic index (Materials and methods) shows that cysts increased in Arl13b-EGFPtg:cPkd2 mice. (E) Kidney weight/body was increased in Arl13b-EGFPtg:cPkd1 with doxycycline treatment (2 months after doxycycline removal) compared to control littermates without doxycycline treatment. (F) Cystic index shows increased size and number of cysts in Arl13b-EGFPtg:cPkd1 mice.
Figure 1—figure supplement 1
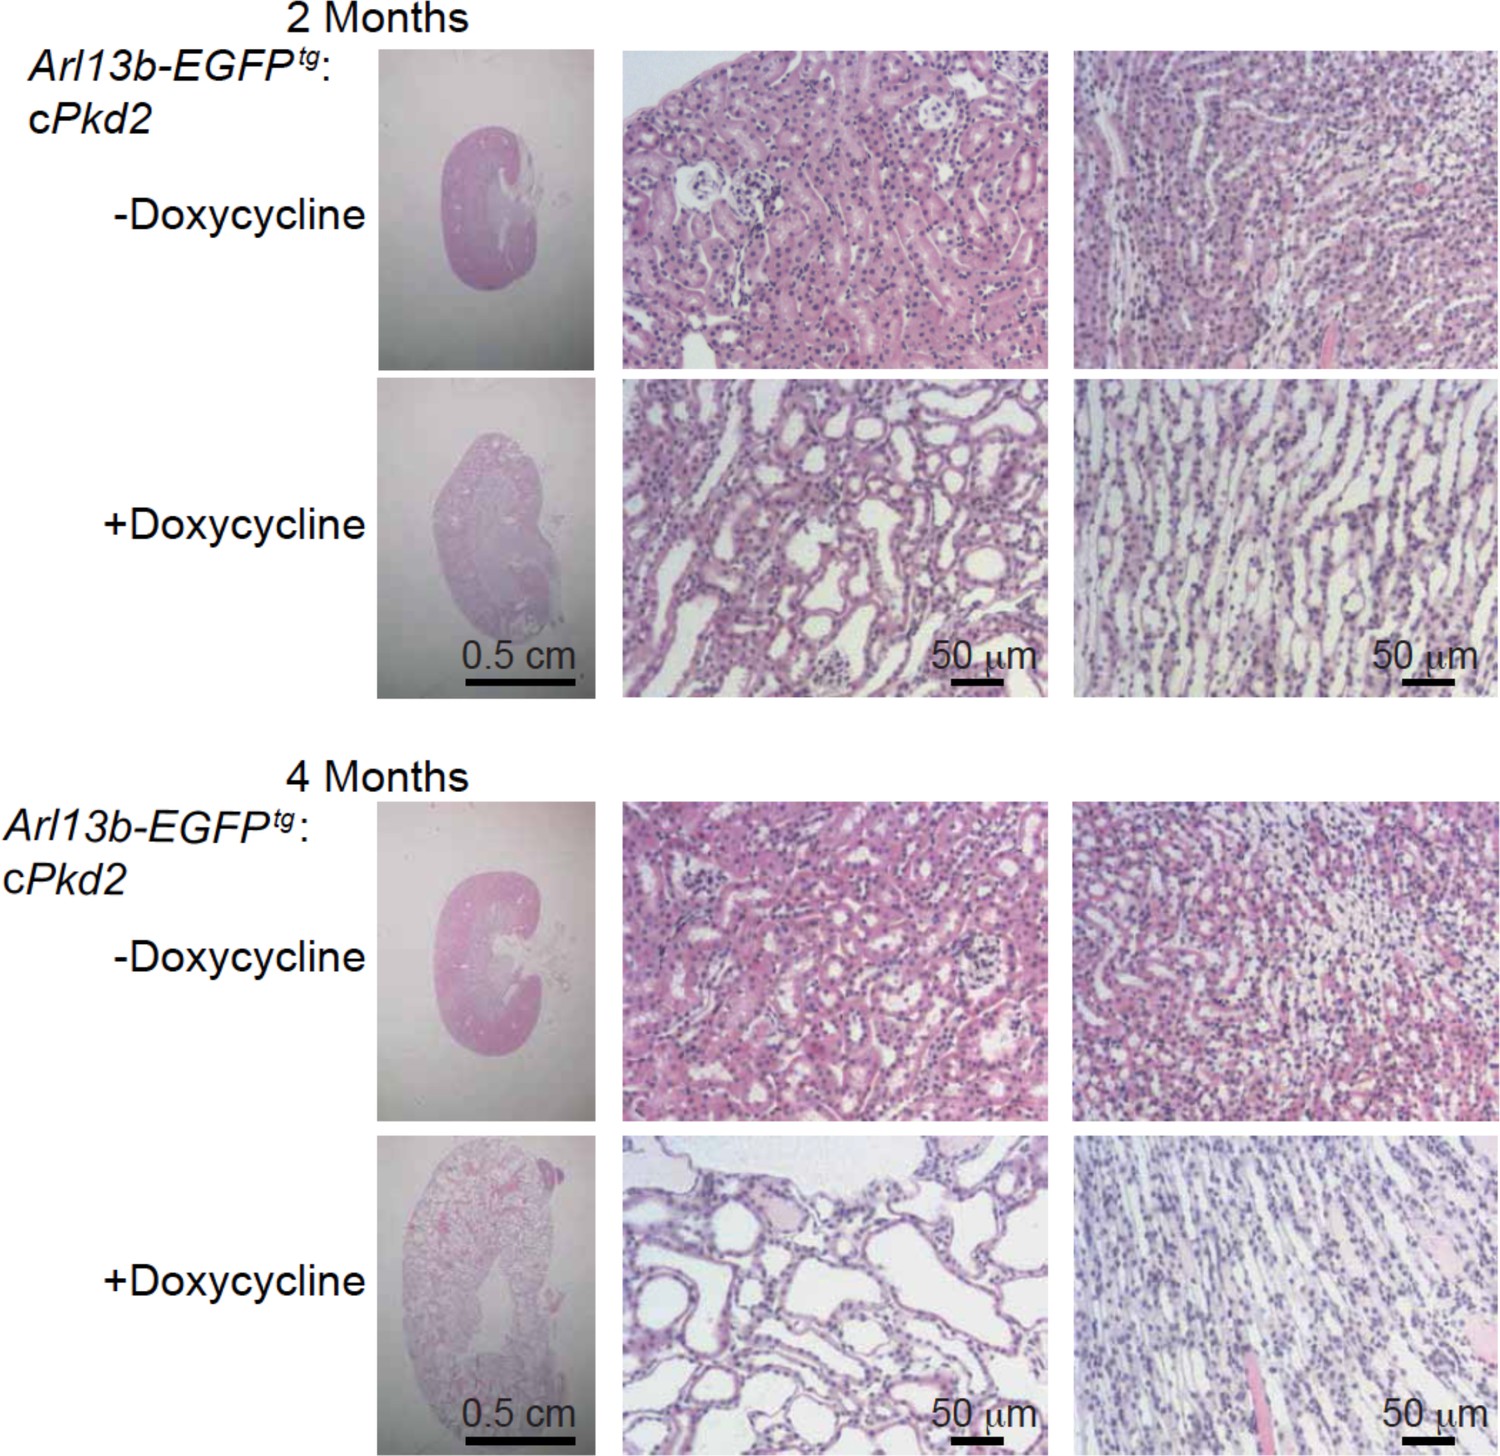
Progression of ADPKD after genetic ablation of Pkd2.
Representative images of H and E staining of kidneys from Arl13b-EGFPtg:cPkd2 mice. Sagittal sections of kidneys (left, scale bar, 0.5 cm) and higher magnification (middle and right, scale bar, 50 μm) are shown at the indicated times; three independent experiments.
Figure 1—figure supplement 2

Progression of ADPKD after genetic ablation of Pkd1.
(A) Schematic diagram of conditional inactivation of Pkd1 in Arl13b-EGFPtg:cPkd1 mice.. (B) Representative images of H and E staining of kidneys from Arl13b-EGFPtg:cPkd1 mice (2 months after doxycycline removal); three independent experiments. Sagittal sections of kidneys (left, scale bar, 0.5 cm) and higher magnification (middle and right, scale bar = 100 μm) are shown at the indicated times. (C) Representative kidney sections from Arl13b-EGFPtg:cPkd1 mice (2 months after doxycycline removal) were immuno-labeled with antibodies against EGFP and acetylated tubulin; three independent experiments. Scale bar, 5 μm. (D) Cilia length increased with the progression of cyst formation from kidney sections of Arl13b-EGFPtg:cPkd1 mice (2 months after doxycycline removal). (E) Genomic PCR for pIMCD cells isolated from Arl13b-EGFPtg:cPkd1 mice (2 weeks after doxycycline removal); three independent experiments. The PCR product for the floxed allele,~400 bp; for wt,~200 bp; for the Deletion alleles (exons 2–4 of Pkd1 deleted) of Del,~650 bp; for non-Del,~1650 bp. The weak band at ~1650 bp in the far right lane is the residual amount of intact Pkd1, which may be due to the contamination of non-tubule cells or tubule cells from S3 straight segment. The bands larger than 200 bp, both before and after doxycycline treatment, are non-specific bands (absent at shorter PCR extension times).
Figure 2
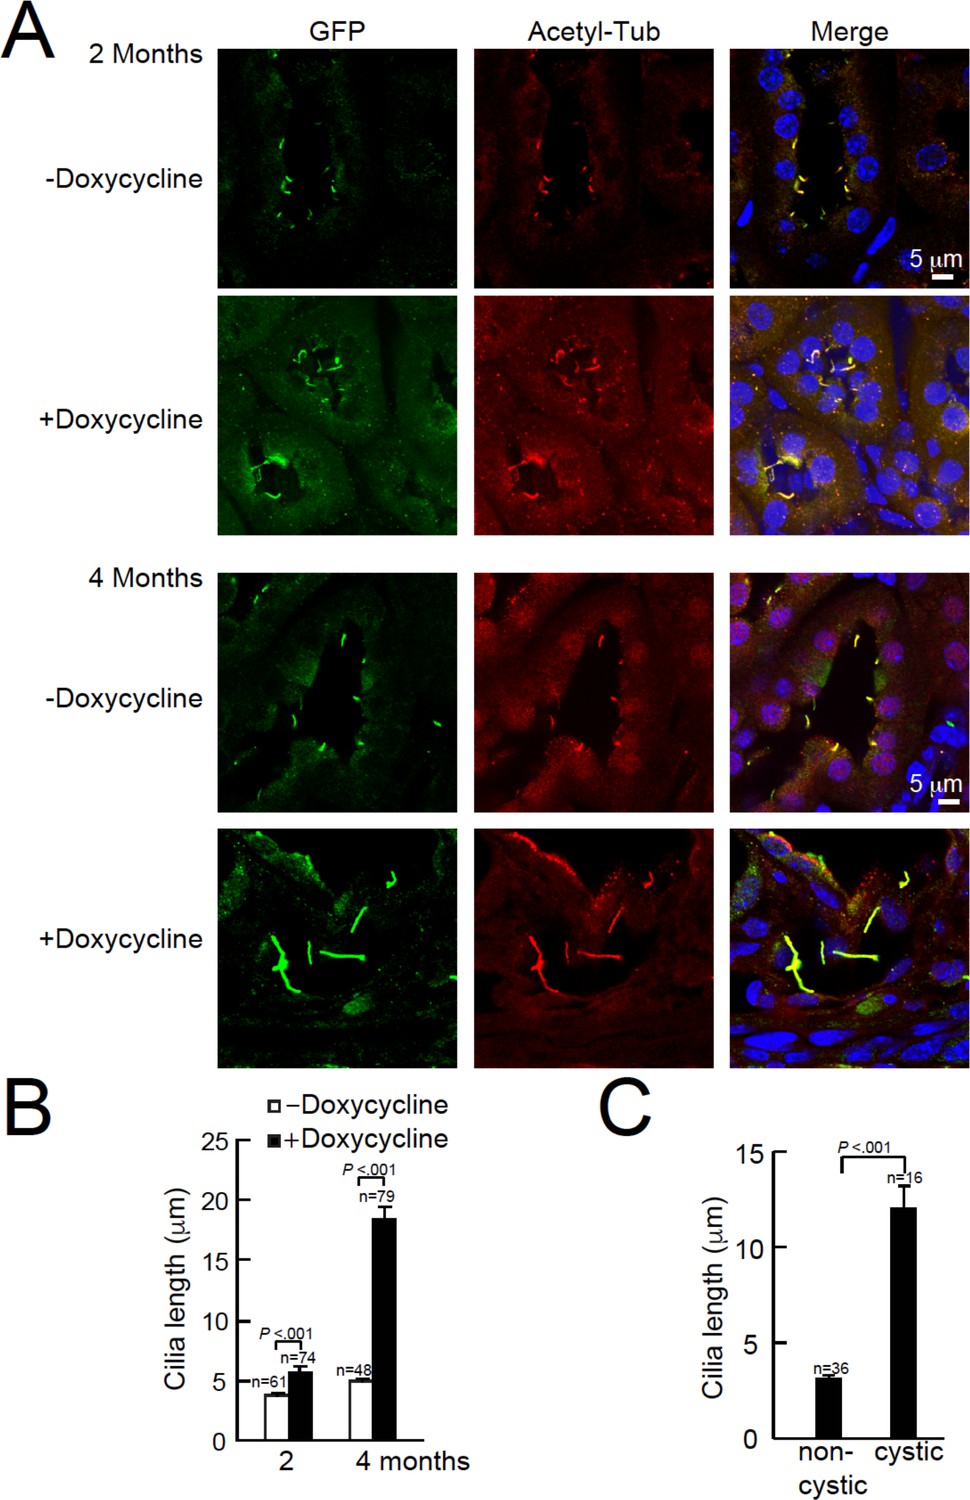
Cystic kidney cilia are abnormally long compared to unaffected tubules after genetic ablation of Pkd2.
(A) Representative kidney sections from Arl13b-EGFPtg:cPkd2 mice were immunolabeled with antibodies against EGFP and acetylated tubulin. Three independent experiments were performed. Scale bars, 5 μm. (B) Cilia length was measured with the progression of cyst formation from kidney of Arl13b-EGFPtg:cPkd2 mice. (C) Cilia length was measured in cystic and non-cystic areas from the Arl13b-EGFPtg:cPkd2 mice after 2 months of doxycycline removal.
Figure 3
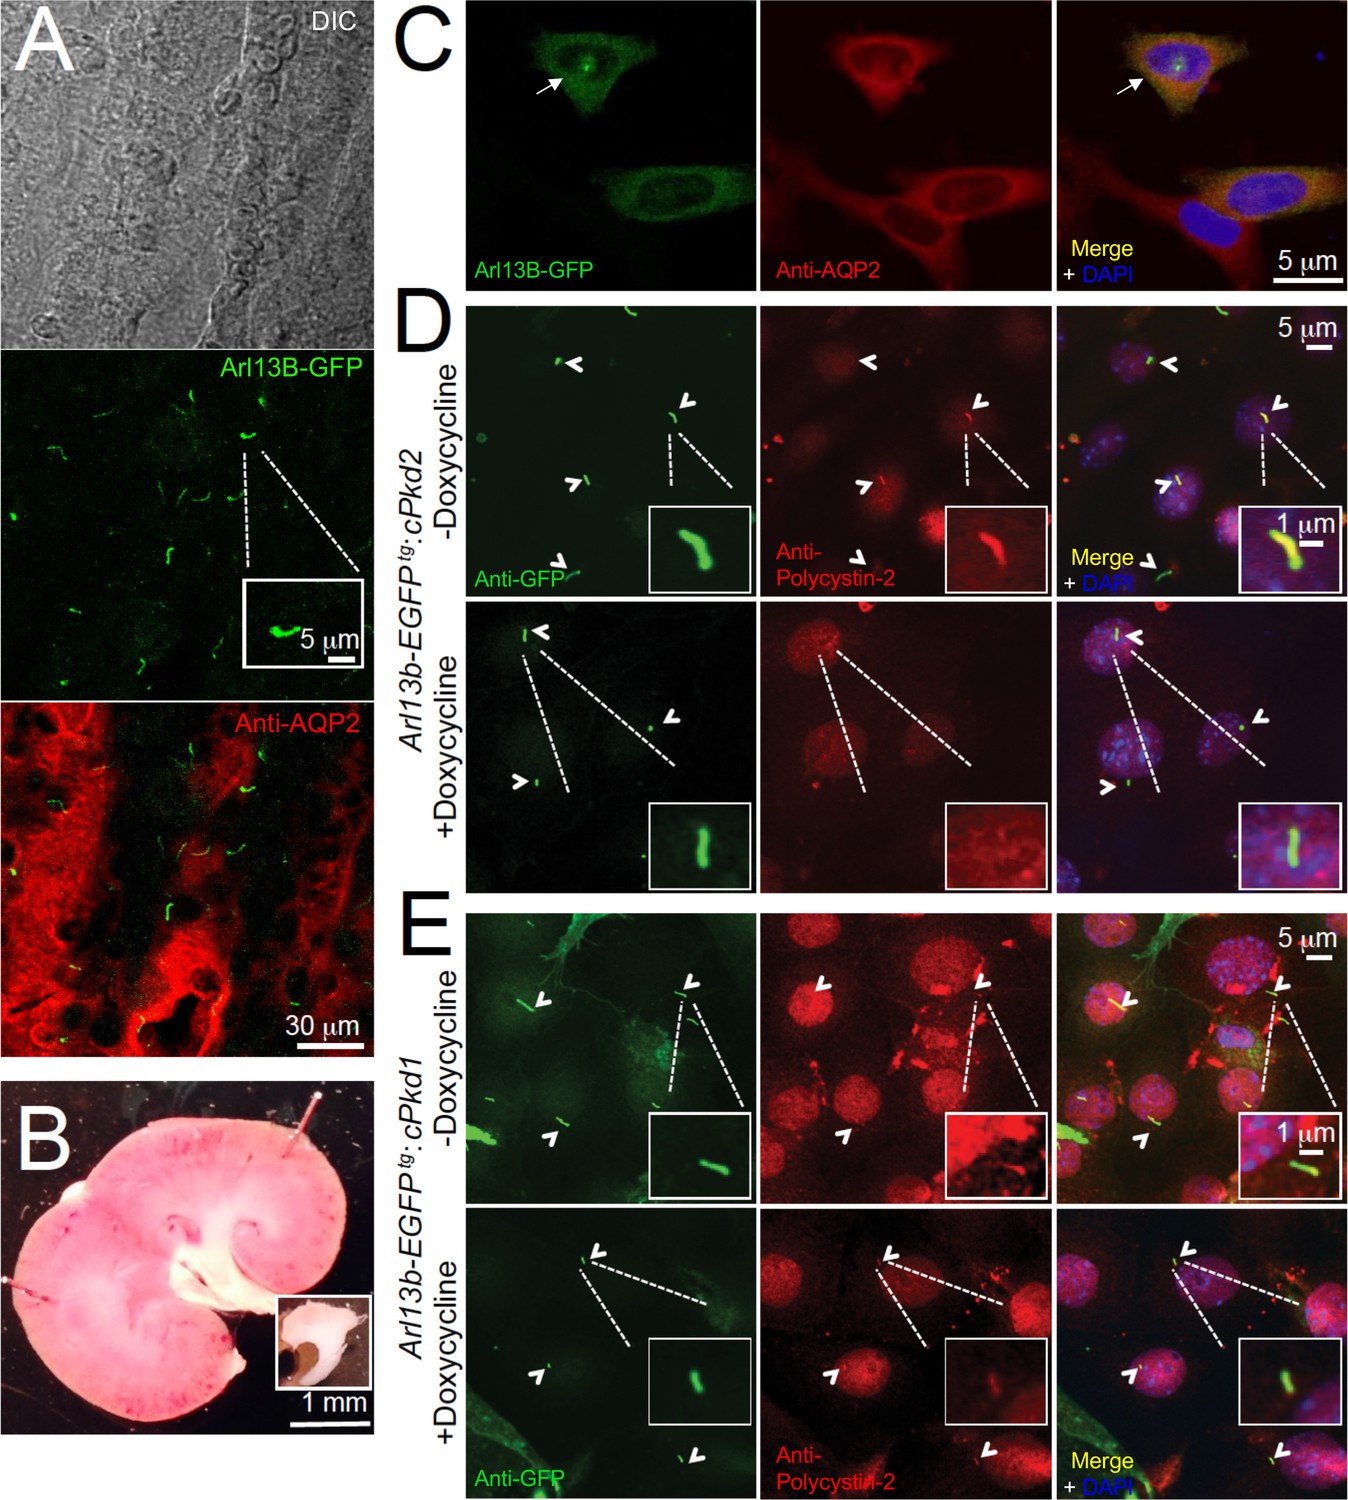
In situ and in vitro detection of ciliary polycystin-2 in Arl13b-EGFPtg pIMCD cells.
(A) Confocal images from a 100 μm-thick fixed kidney slice: DIC image in grey; aquaporin 2 (kidney collecting duct epithelial cell epitope) labeled with Alexa-569 (red); Cilia Arl13b-EGFPtg (green). Three independent experiments were performed. Scale bar = 30 μm, inset image scale bar = 5 μm. (B) Sagittal section of 3-month-old mouse kidney with the inner medulla removed (bottom inset). Three independent experiments were performed. Scale bar = 1 mm. (C) Confocal images of fixed primary collecting duct epithelial cells after two days in culture, immunostained with anti-aquaporin 2 antibody in A). Three independent experiments were performed. Scale bar = 5 μm. (D) Immunofluorescence using anti-GFP (green) and anti-polycystin-2 (red) showing the loss of polycystin-2 in pIMCD cells isolated from kidney papillae of Arl13b-EGFPtg:cPkd2 mice (2 weeks after doxycycline removal; three independent experiments; 5 mice were used for each group). Arrowheads point to primary cilia. Scale bar = 5 μM, inset image scale bar = 1 μm. (E) Immunofluorescence with anti-GFP (green) and anti-polycystin-2 (red), showing ciliary polycystin-2 in pIMCD cells isolated from kidney papillae of Arl13b-EGFPtg:cPkd1 mice. Three independent experiments; 5 mice for each group. Arrowheads point to primary cilia. Scale bar = 5 μM, inset image scale bar = 1 μm.
Figure 4
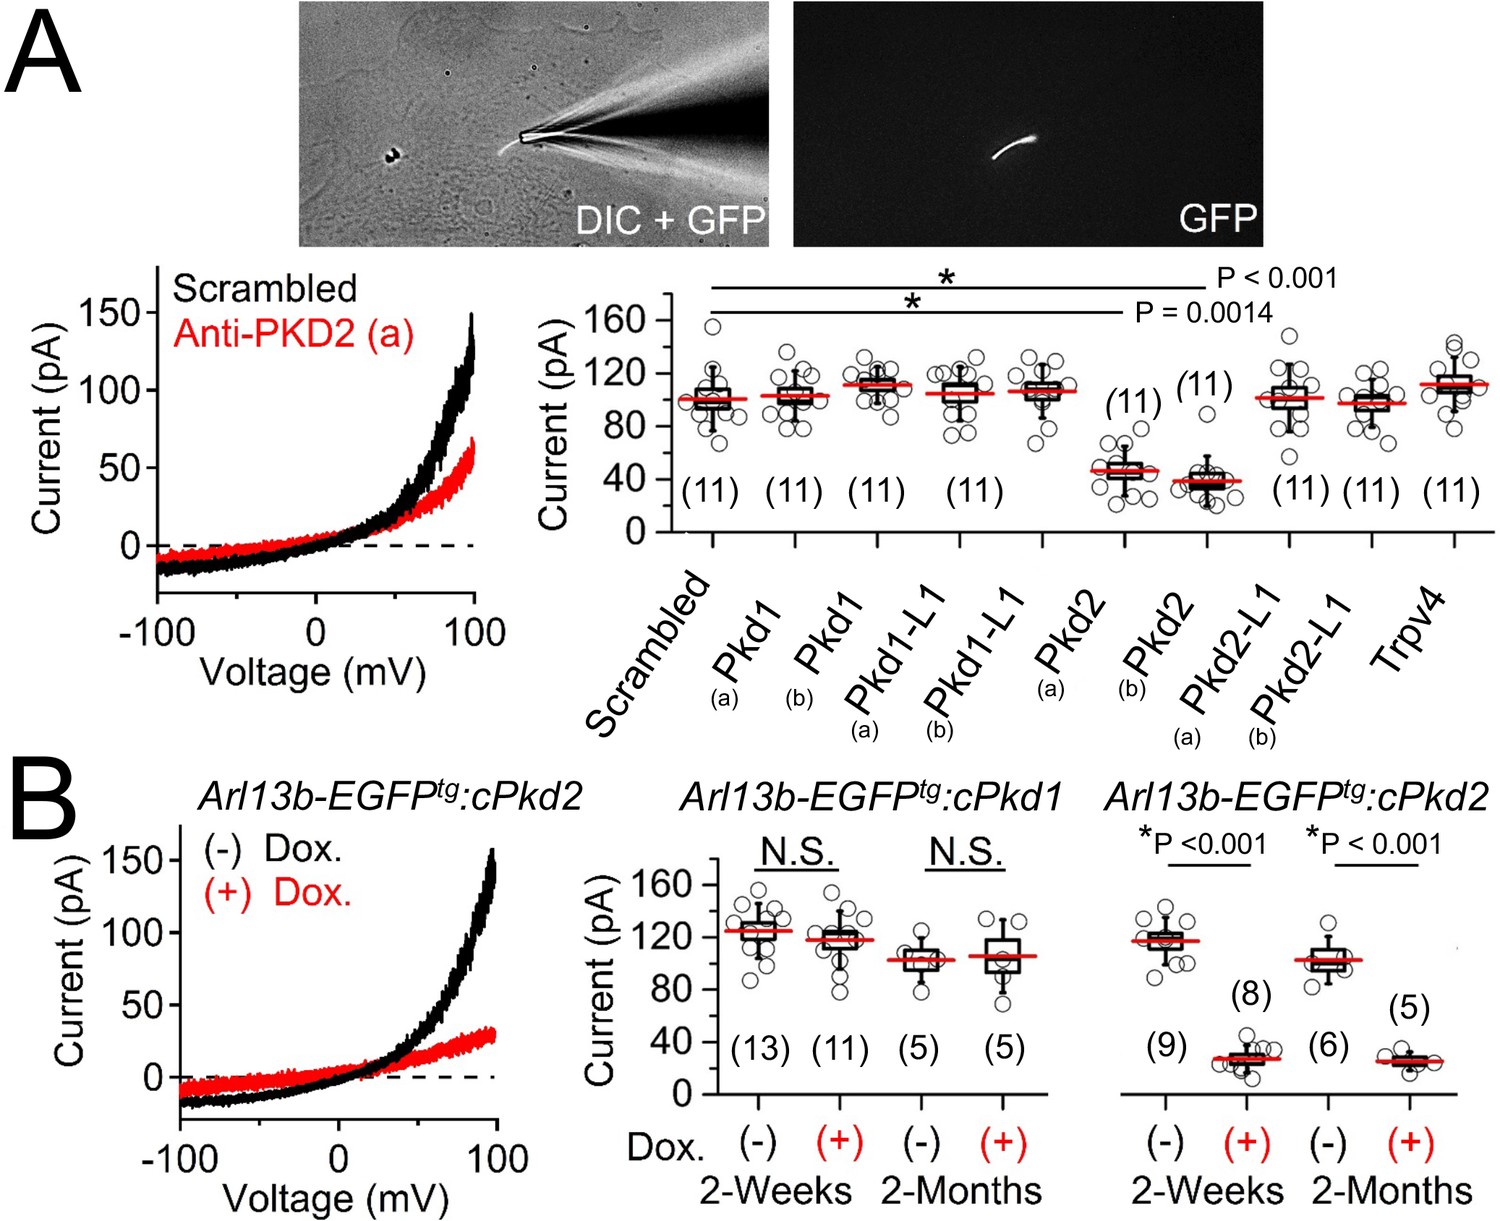
Polycystin-2 is required for the ciliary ion channel conductance of the primary inner medullary collecting duct epithelial cells (pIMCDs).
(A) siRNA screen of potential Icilia candidates. Top, light microscope image of a patched cilium. Left, example ciliary currents measured from cells treated with either scrambled siRNA or one targeted to polycystin-2. Right, box (mean ± S.E.M.) and whisker (mean ± S.D.) plots of cilia total outward current (+100 mV) measured 48–72 hr after double-siRNA treatment. Pkd1, Pkd1-L1, Pkd2, and Pkd2-L1 mRNAs were targeted by two siRNAs specific for two different regions (A, B) of the target transcript (listed in Table 1). Averages are indicated by the red lines. Student’s t-test P values comparing treatment groups to scrambled siRNA. See Figure 4—source data 1-ciliary current amplitudes: siRNA screen of TRP proteins in cilia. (B) Conditional knockout of the whole-cilia current. Left, exemplar cilia currents from pIMCD epithelial cells isolated from conditional Pkd2 knockout (Arl13b-EGFPtg:cPkd2) transgenic mice. Right, box and whisker plots comparing the total outward cilia current (+100 mV) from control littermates and doxycycline-treated animals (Arl13b-EGFPtg:cPkd1 and Arl13b-EGFPtg:cPkd2). Number of cilia; italic numeral in parentheses for each group genotype and treatment group. Student’s t-test P values compare the outward cilia current from the untreated and doxycycline-treated animals. See Figure 4—source data 2- whole ciliary current amplitudes in Pkd1 or Pkd2-knockout primary cells.
-
Figure 4—source data 1
Ciliary current amplitudes: siRNA screen of TRP proteins in cilia.
Ciliary outward currents (pA) were measured at 100mV after knockdown of Pkd1, Pkd1-L1, Pkd2, Pkd2-L1 and Trpv4.Except for Trpv4, the mRNAs the genes tested were targeted by two siRNAs specific for two different regions, as labeled A and B.
- https://doi.org/10.7554/eLife.33183.008
-
Figure 4—source data 2
Whole ciliary current amplitudes in Pkd1 or Pkd2-knockout primary cells.
Ciliary outward currents (pA) were measured at 100 mV from pIMCD epithelial cells isolated from doxycycline-treated and -untreated mice. Cells were tested 2 weeks and 2 months after removal of treatment (or controls) using Arl13b-EGFPtg:cPkd1 and Arl13b-EGFPtg:cPkd2 transgenic mice
- https://doi.org/10.7554/eLife.33183.009
Figure 5 with 2 supplements
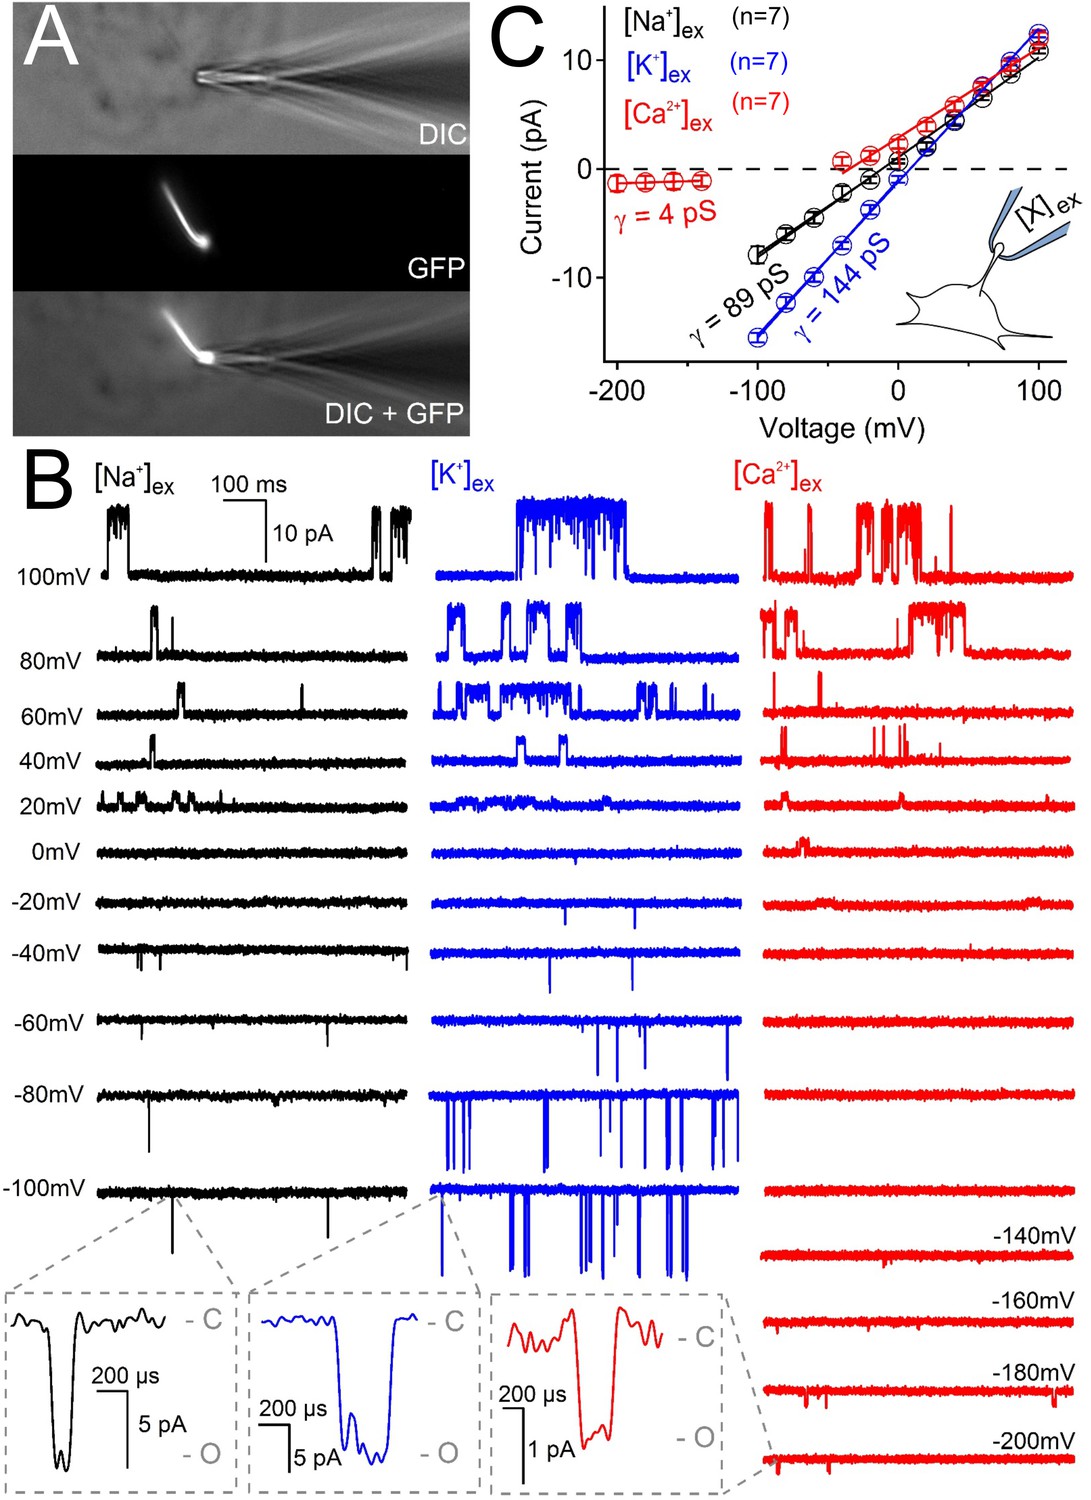
Ciliary polycystin-2 single channel currents conducted by sodium, potassium and calcium ions.
(A) Image of a cilia patched without breaking into the cilioplasm (‘on-cilium’ configuration). (B) Exemplar currents recorded with the indicated cation (110 mM) in the patch electrode. Expanded time scales in the grey boxes show that inward single channel currents are brief, often opening (O) and closing (C) within 1 ms. (C) Average single channel current amplitudes. Conductance (γ) estimated by fitting the average single channel currents to a linear equation. Note that the inward single channel events are small (~0.8 pA at −200 mV) when Ca2+ is used as the charge carrier in the pipette (inset, patch diagram); note outward currents are much larger. Outward conductances of 90 pS, 99 pS and 117 pS, and inward conductances of 4 pS, 89 pS, and 144 pS were measured when the pipette contained Ca2+, Na+ and K+, respectively. Inset, a cartoon of the ‘on-cilium’ patch configuration where cations within the patch electrode ([X+]) are exclusively capable of conducting inward currents.
Figure 5—figure supplement 1

The pIMCD ciliary polycystin-2 cilia membrane is highly permeable to K+ and Na+.
(A) Selectivity of the ciliary polycystin-2 current. Left, Example cilia current traces measured under different external cationic bi-ionic conditions. Middle, Time course of the magnitudes of inward (−100 mV, black circles) and outward (100 mV, white circles) currents with changes in the external solution. Right, Relative permeability of cations to Na+ through the polycystin-2 channel. (B) Attenuation of inward polycystin-2 sodium current in response to external calcium ([Ca]ex). Left, the effect of external calcium on the outwardly rectifying polycystin-2 cilia current measured in symmetrical sodium. Middle, corresponding time course of the magnitudes of inward (−100 mV, black circles) and outward (100 mV, white circles) currents upon changes in the extracellular solution. Right, relationship between external calcium concentration and percent block of the inward sodium current (Iinward) fit to the Hill equation. Number of cilia tested are indicated by the italicized number in parentheses.
Figure 5—figure supplement 2
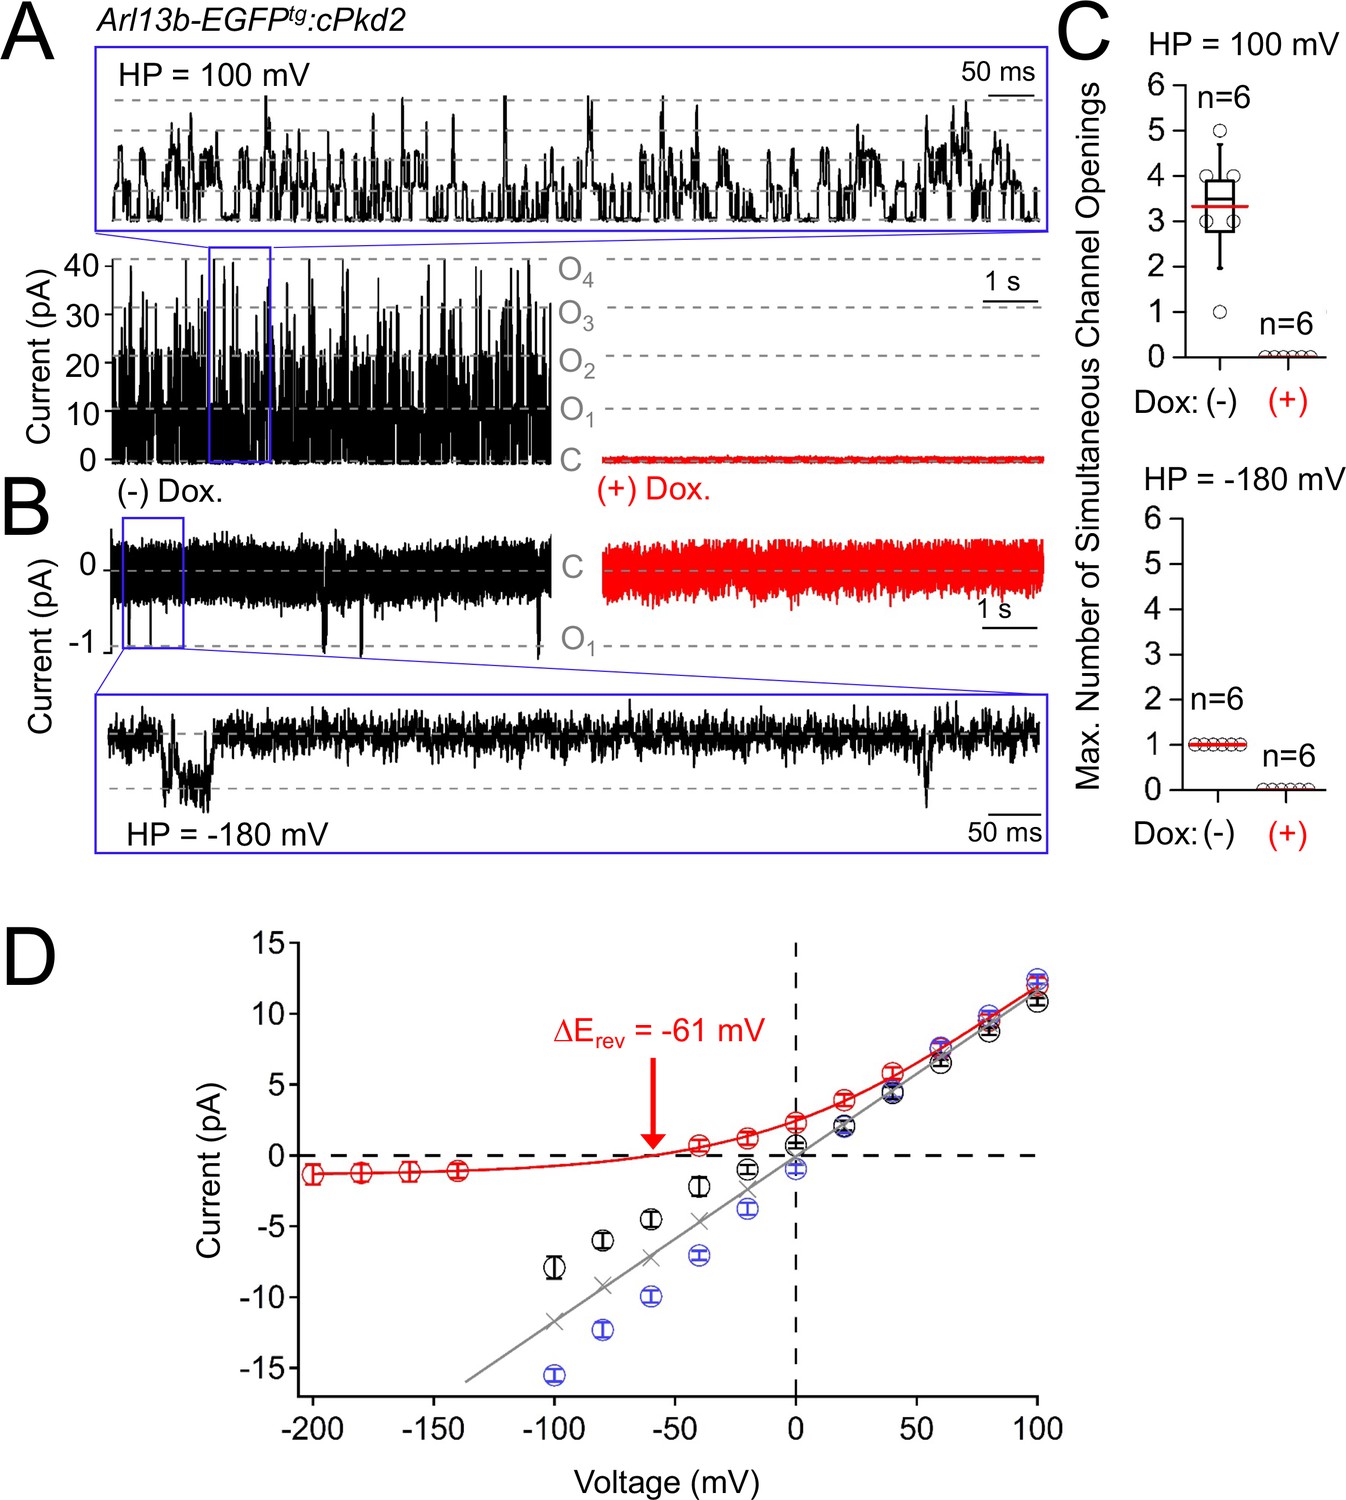
pIMCD single channel events are dependent on polycystin-2 expression.
(A) Outward and B) inward single channel ciliary currents recorded from pIMCD cells harvested from doxycycline treated (red traces) and untreated (black traces) Arl13b- EGFPtg:cPkd2 transgenic mice. Pipette electrodes contained 100 mM CaCl2 and the ciliary membrane potentials were held at 100 and −100 mV for up to 60 s (exemplars of 10 s of recording are shown) to record the number of simultaneous open events (grey, (O1–O4). Expanded time scales are shown in the blue boxes. (C) Box and whisker plots comparing the maximum number of simultaneous open channels observed from the two treatment groups. Six cilia were tested for each treatment group. (D) Derived from Figure 5, the reversal potential for average single channel calcium currents. The change in reversal potential ΔErev (−61 mV) was calculated by subtracting the ECa (- 59 mV) from the monovalent (Emono; 2 mV) reversal potentials, shown in grey.
Figure 6 with 1 supplement
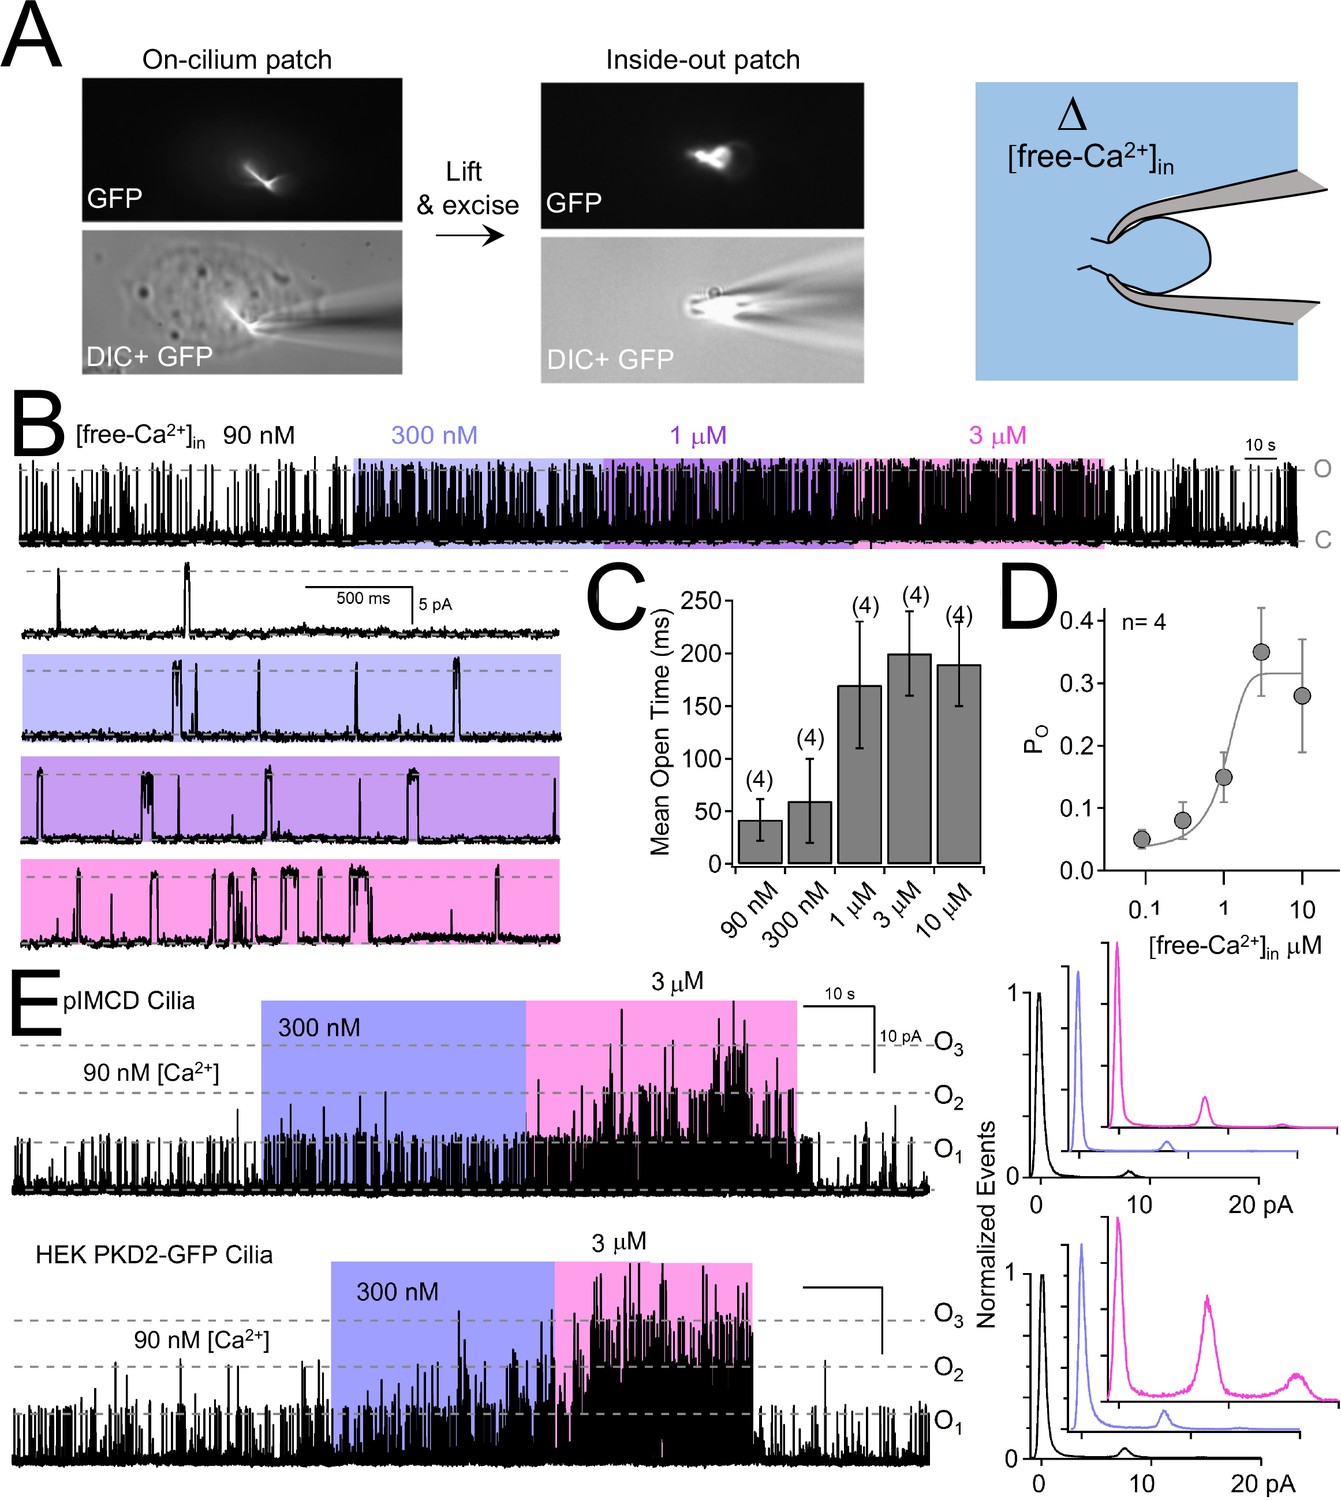
Internal [free-Ca2+] potentiates polycystin-2 channels.
(A) Images recorded while establishing an inside-out cilium patch. Left, a high-resistance seal is formed on the cilium; Middle, the electrode is then lifted, ripping the cilium from the cell body (see Materials and methods); Right, cartoon depicting the inside of the cilium exposed to bath saline (blue) in which [Ca2+] can be adjusted. (B) pIMCD polycystin-2 single channel events recorded in the inside-out configuration. The membrane potential was held at +100 mV in symmetrical [Na+] while the internal [Ca2+] was altered for 40–60 s intervals. (C) The average open time duration relative to internal [Ca2+] (mean ± S.D.). (D) Average open probability as a function of internal [Ca2+], fit to the Hill equation (described in Materials and methods, mean ± S.D.). (E) Left, exemplar inside-out cilium patch records from pIMCD cilia and HEK-293 cilia with heterologously expressed polycystin-2 channels. Right, current histograms capturing multiple open channel events under high internal [Ca2+] conditions. Currents were normalized to the closed (0 pA) state amplitude for each internal [Ca2+].
Figure 6—figure supplement 1
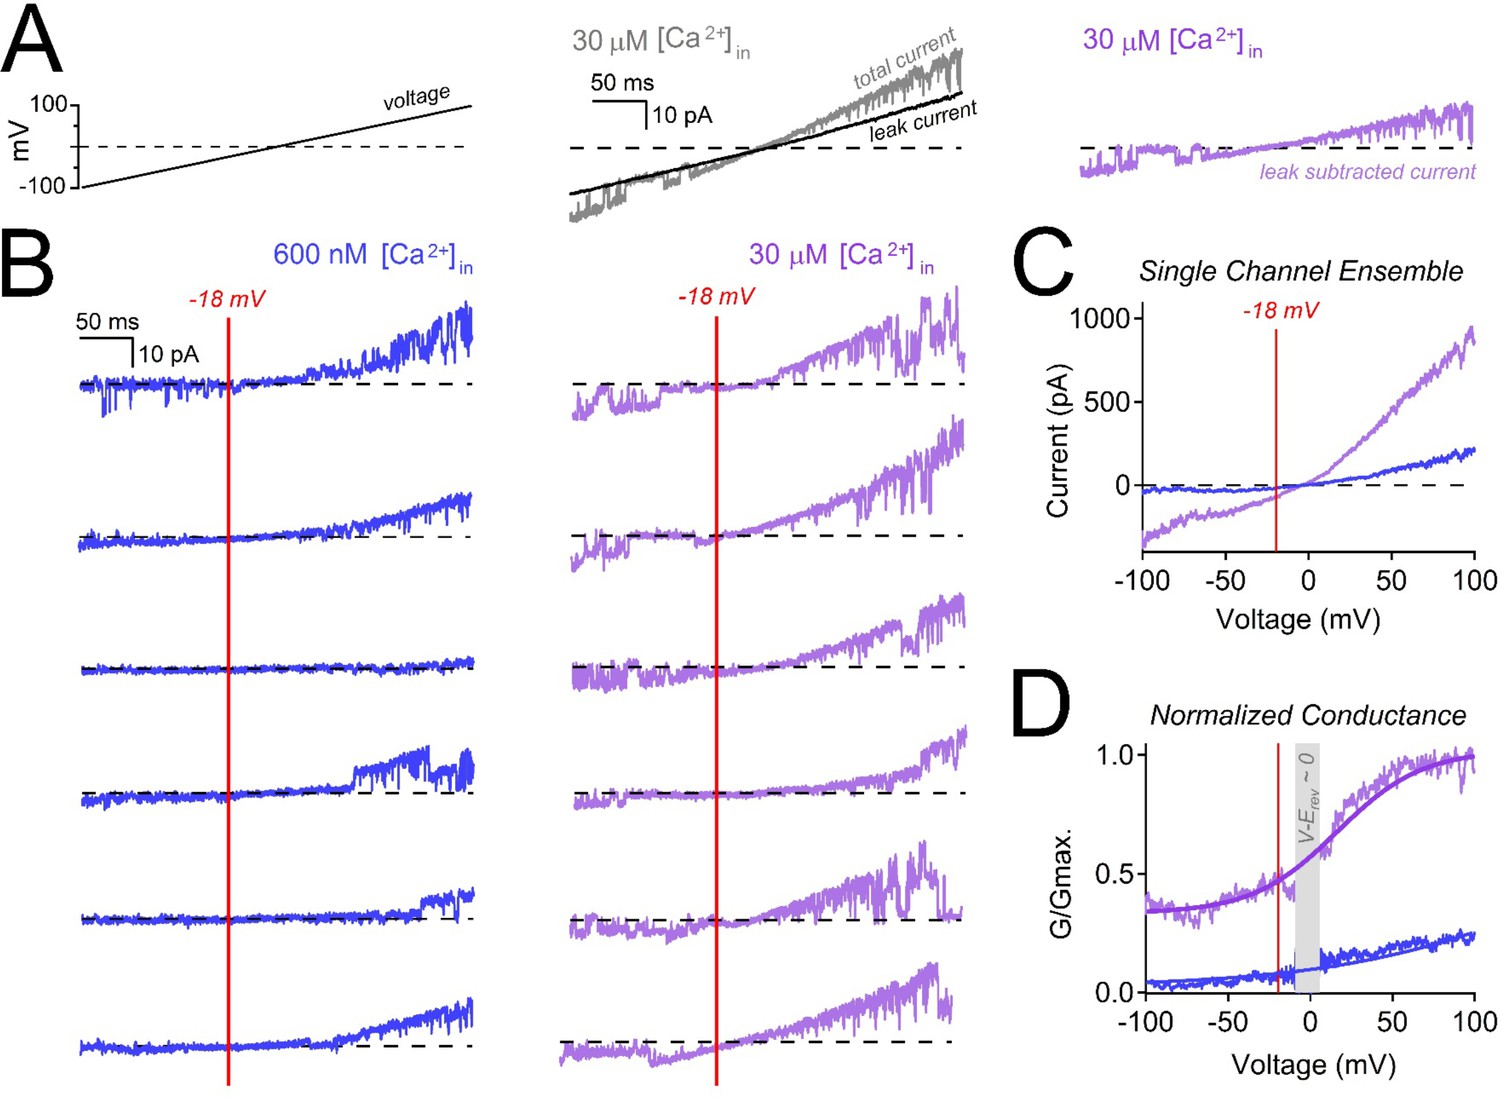
Internal calcium hyperpolarizes polycystin-2’s voltage dependence.
(A) Inside-out cilia current traces captured before (left) and after leak subtraction (right). After 1–2 min in 30 μM internal calcium, the polycystin-2 currents inactivate, leaving only the leak current remaining. We averaged the leak current from five ramps (black) and subtracted it from the total current (grey), yielding the leak subtracted single channel currents (purple). (B) Six exemplar leak-subtracted single channel currents measured in 600 nM (left) and 30 μM (middle) internal calcium. For reference, the red line at −18 mV indicates the average expected cilia resting membrane potential. (C) Ensemble average of single channel currents recorded from 40 ramps. (D) Polycystin-2 conductance normalized to the maximum conductance measured in 30 μM internal calcium (top trace, purple). Conductance-voltage relationships were fit to a Boltzmann equation. Grey bar indicates where V-Erev approaches 0 mV. The V1/2 in 600 nM and 30 μM internal calcium were 158 mV and 15 mV, respectively.
Figure 7 with 3 supplements
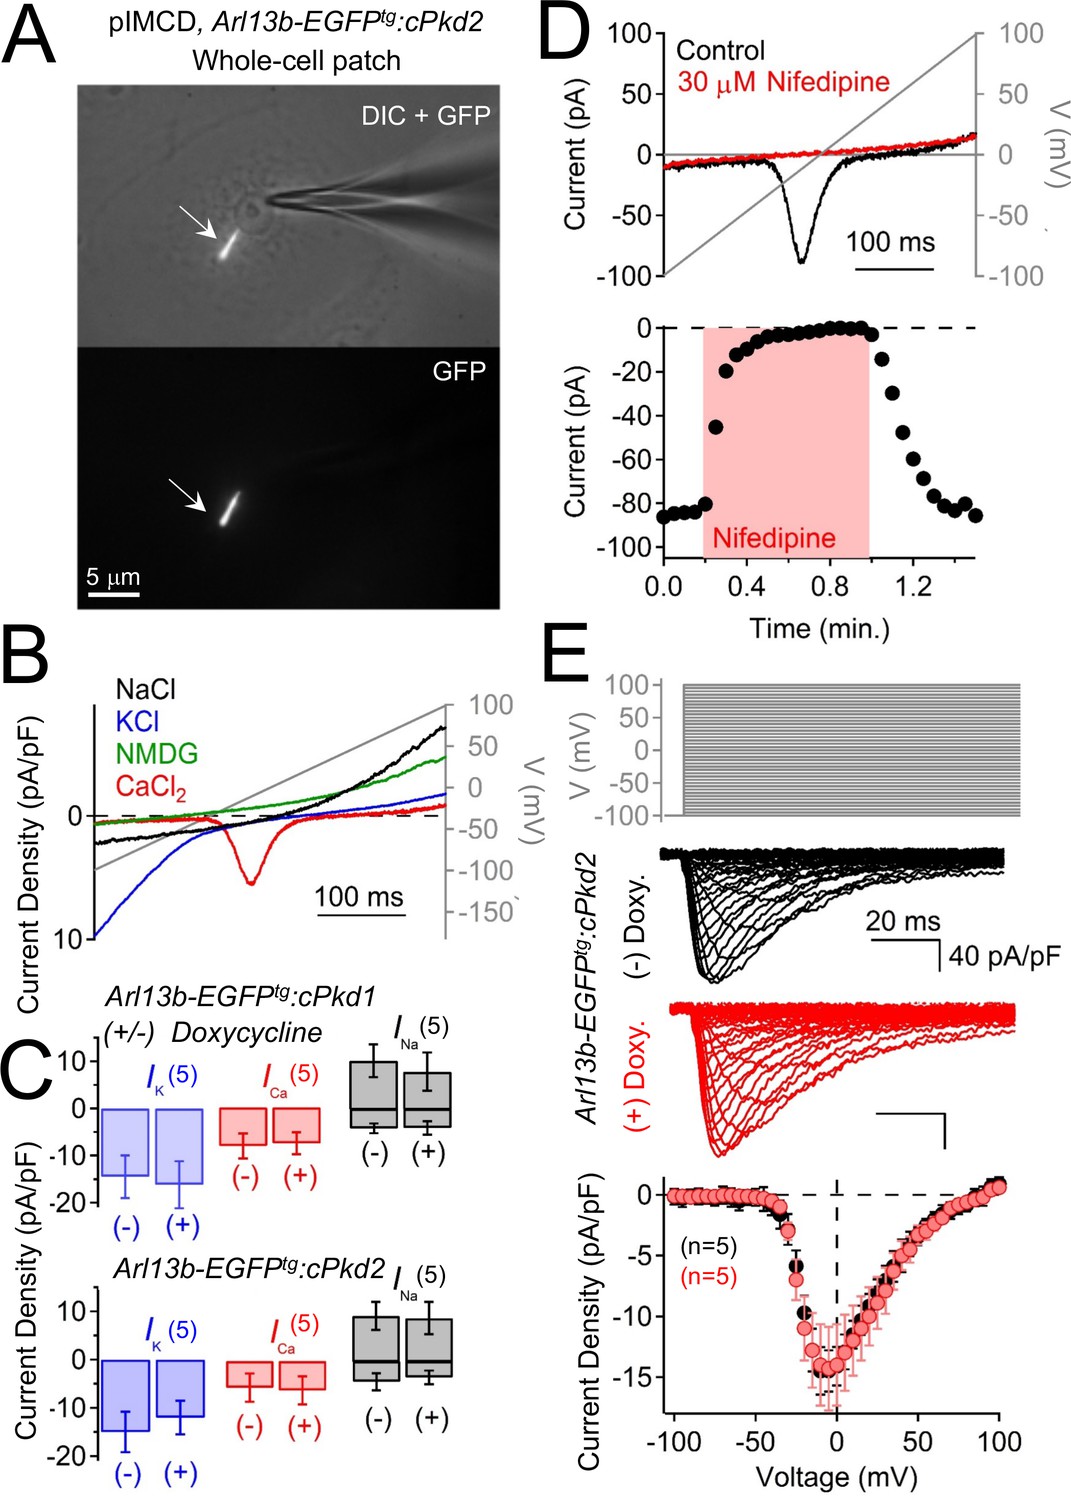
Polycystin-2 does not generate a significant current in the plasma membrane of pIMCD cells.
(A) Images of a ciliated pIMCD epithelial cell patch-clamped on the plasma membrane (whole-cell mode). Scale bar = 5 μM. (B) Example plasma membrane ionic currents activated by a voltage ramp (grey line) while changing the extracellular saline conditions. (C) Average plasma membrane current density of Arl13b-EGFPtg:cPkd2, where animals treated with doxycycline was compared to untreated animals. Note that the average magnitudes of the plasma membrane currents were not significantly altered (mean ± S.E.M.). (A). (D) Pharmacological blockade of the voltage-gated calcium channel in the plasma membrane; three independent experiments. Top, exemplar calcium currents blocked by nifedipine. Bottom, time course of block and recovery of CaV currents. (E) Conditional polycystin-2 knockout does not alter the steady state voltage-gated calcium currents measured from the plasma membrane. Top, voltage protocol used to activate the calcium currents. Middle, exemplar leak-subtracted voltage-gated calcium currents from doxycycline-treated (red) and –untreated (black) Arl13b-EGFPtg:cPkd2 animals. Resulting plasma membrane average CaV densities compared from doxycycline-treated and control littermates.
Figure 7—figure supplement 1
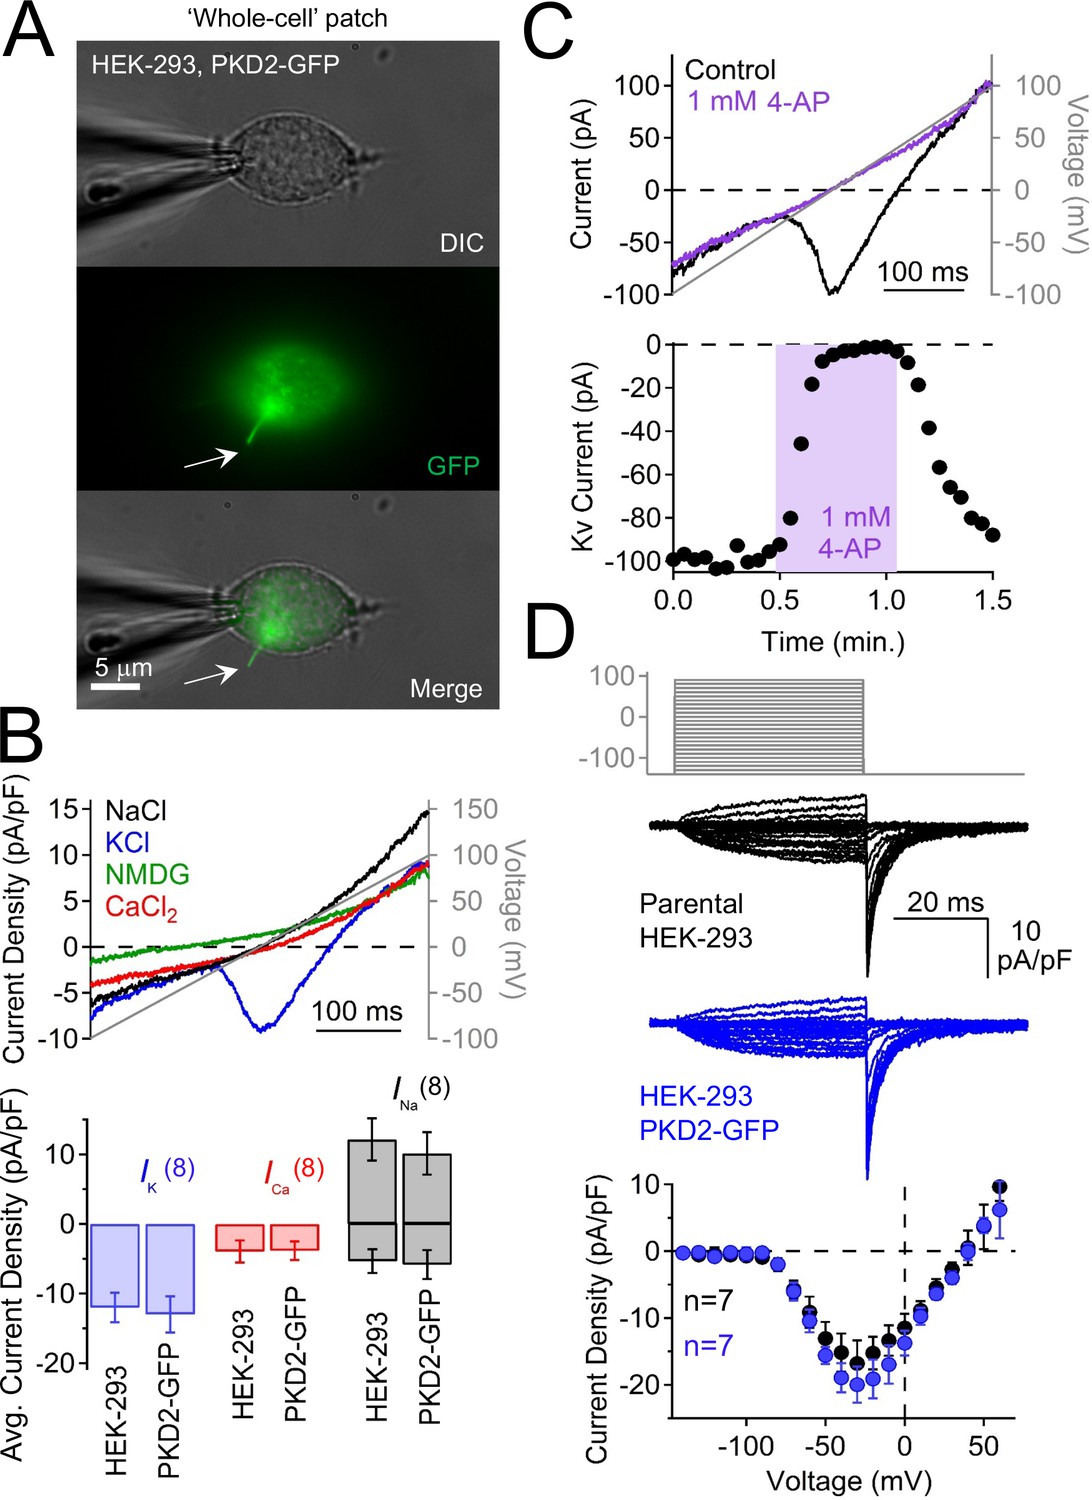
Characterization of plasma membrane currents measured from HEK-293 cells stably expressing polycystin-2-GFP.
(A) Image of a voltage-clamped HEK-293 cell stably expressing polycystin-2-GFP. Note that the GFP signal is present in the primary cilium (arrow) and that the patch electrode is sealed onto the plasma membrane. Scale bar = 5 μM. (B) Top, resulting currents activated by a voltage ramp (grey line) under the indicated cationic conditions (in mM). Bottom, average current density for HEK-293 cells and those stably overexpressing polycystin-2-GFP. The current densities do not differ between the two cell types. (C) Pharmacological blockade of the voltage-gated potassium current (Kv) in the HEK-293 plasma membrane; three independent experiments. Top, Example Kv currents recorded before and after 4-aminopyridine (4-AP) exposure. Bottom, time course of block and recovery of Kv currents. (D) Overexpressed polycystin-2 does not increase Kv current. Steady-state Kv currents measured from the plasma membrane. Top, voltage protocol used to activate Kv currents. Middle, exemplar leak-subtracted Kv currents from HEK-293 and those stably expressing polycystin-2-GFP. Bottom, Kv current density of HEK-293 and HEK-293 polycystin-2-GFP cells. Note that Kv current measured from HEK-293 cells is not different in HEK-293 cells overexpressing polycystin-2-GFP.
Figure 7—figure supplement 2
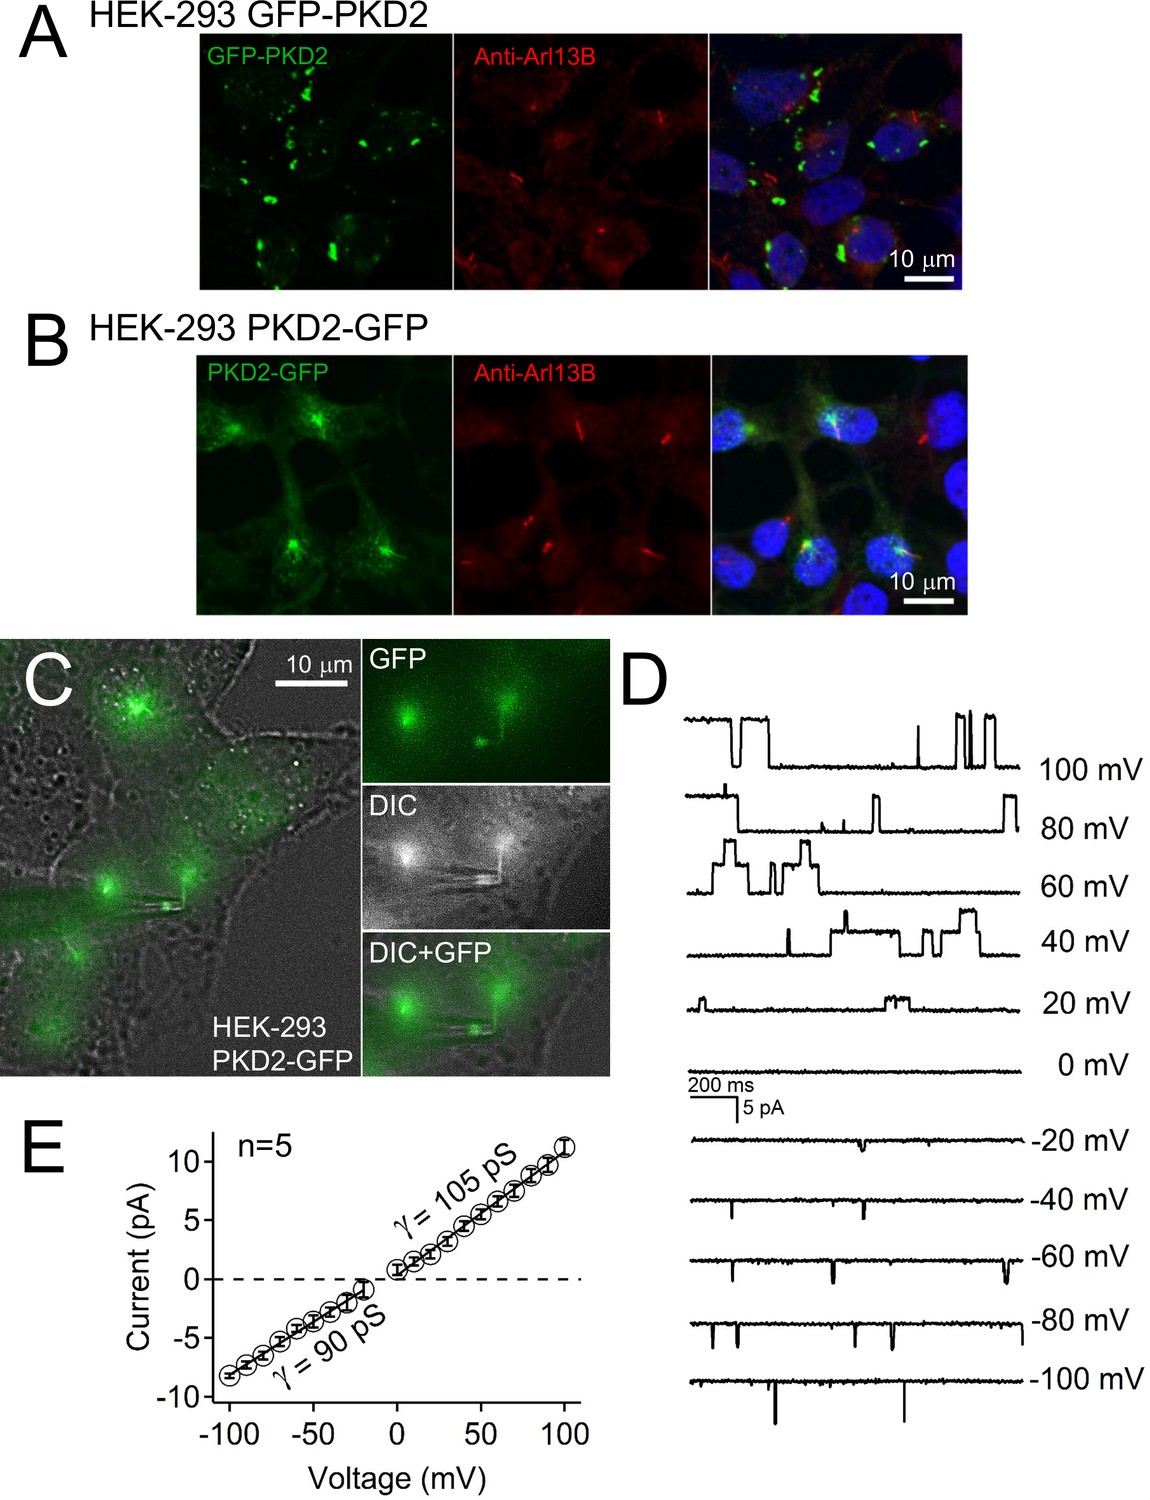
Single channel events recorded from cilium of polycystin-2-GFP overexpressing HEK-293 cells.
(A) Stably expressing GFP-polycystin-2 HEK-293 cells were fixed, immunolabeled with rabbit anti-Arl13B primary antibody, and detected by a secondary conjugated anti-rabbit Alexa 569 antibody (red). Nuclei were stained with Hoechst 33342; three independent experiments. Scale bars = 10 μm. (B) Stably-expressing polycystin-2-GFP HEK-293 cells were fixed, immunolabeled with rabbit anti-Arl13B primary antibody, and detected by a secondary conjugated anti-rabbit Alexa 569 antibody (red). Nuclei were stained with Hoechst 33342; three independent experiments. Note that the Arl13B and polycystin-2-GFP signal colocalized to the cilium. (C) Live-cell image of an HEK-293 polycystin-2-GFP-labelled cilium patched in the on-cilium configuration. Note: the cilium’s tip is engulfed in the lumen of the electrode. Scale bars = 10 μM. (D) Exemplar single-channel currents recorded with a 100 mM NaCl-containing patch electrode. (E) Resulting outward and inward conductances (γ) estimated by fitting the single-channel currents to a linear equation.
Figure 7—figure supplement 3

Overexpressed polycystin-2 forms an ion channel in the HEK-293 cilium.
(A) Image of a voltage-clamped cilium from HEK-293 cells stably expressing polycystin-2-GFP. Note that the GFP signal and/or cilia is not always present on HEK-293 cells. Scale bar = 10 μM. (B) The selectivity of the ciliary current measured from HEK-293 polycystin-2-GFP cells. Left, Example ciliary current traces measured under different extracellular cationic bi-ionic conditions. Right, relative permeability of cations to Na+ through the polycystin-2 channel. (C) The majority of the ciliary current is conducted through the ciliary membrane. Right, Average current traces from five voltage ramps acquired before and after the cilia is disconnected from the cell membrane. Left, time course of peak current amplitudes before (white circles) and after (red circles) the cilia is separated from the cell. (D) Left, average current traces from cells treated with scrambled or polycystin-2-mRNA-targeted siRNAs. Right, Box (mean ± S.E.M.) and whisker (mean ± S.D.) plots of ciliary total outward (+100 mV) current amplitude. Averages are indicated by the red lines. See Figure 7—figure supplement 3—source data 1- ciliary current amplitudes of cells treated with PKD2-mRNA-targeted siRNAs . The GFP signal was noticeably reduced in antisense-treated polycystin-2 cells. Few cilia had as similarly intense fluorescence as the patched cilia (data not shown).
-
Figure 7—figure supplement 3—source data 1
Ciliary current amplitudes of cells treated with PKD2-mRNA-targeted siRNAs.
Ciliary outward currents (pA) were measured at 100 mV from PKD2-GFP stably-expressing HEK-293 cells treated with two PKD2-mRNA-targeted siRNAs.
- https://doi.org/10.7554/eLife.33183.022
Videos
Video 1
Movie of the pIMCD Arl13b cilium patch configuration.
The glass pipette patch electrode (right) is sealed onto a primary cilium above the pIMCD cell. The focal plane was moved along the z-axis (~9 µm) to visualize the cell and cilium. The electrode is moved along the y-axis while adjusting the focal plane to demonstrate that the patch electrode is sealed on the tip of the cilia membrane, not the cell membrane. The light source(s) are indicated in the lower left corner of the image: white light and 488 nm light to illuminate the specimen. Differential interference contrast (DIC) or fluorescent images were captured using a Hamamatsu Orca Flash CCD camera on an Olympus IX73 inverted microscope; 60x objective, 2x photomultiplier. Scale bar = 5 μm.
Video 2
Visualization of a plasma membrane patch from a ciliated pIMCD Arl13b-GFP cell.
Same method as Video 1. The cell membrane is being sealed by the patch electrode (right) and the primary cilium (left) is not in contact with the electrode. Scale bar = 10 µm.
Video 3
A plasma membrane patch established on a polycystin-2-GFP HEK-293 cell.
Here the whole-cell configuration is formed by the patch electrode (left) on the cell body and the primary cilium (lower left) is not in contact with the electrode. The electrode is moved along the y-axis while adjusting the focal plane to demonstrate that the cell membrane is sealed on the patch electrode, not the cilia membrane. Scale bar = 5 μm.
Video 4
Ciliary co-localization of polycystin-2-GFP with immunolabeled acetylated tubulin.
Paraformaldehyde-fixed HEK-293 cells stably expressing polycystin-2-GFP (green) were immunolabeled with anti-acetylated tubulin antibody (red). The images were captured using Structured Illumination Microscopy (SIM; Nikon N-SIM scope) and 3D images rendered using Imaris software (Oxford Instruments). Scale bar = 3 μm.
Video 5
Cilia co-localization of polycystin-2-GFP with immunolabeled adenylyl cyclase 3.
Paraformaldehyde-fixed HEK-293 cells stably expressing polycystin-2-GFP (green) were immunolabeled with anti-adenylyl cyclase three antibody (red). The images were recorded using a Nikon N-SIM scope and 3D images rendered using Imaris software (Oxford Instruments). Scale bar = 3 μm.
Tables
Table 1
siRNAs used to screen for ciliary ion channel genes.
https://doi.org/10.7554/eLife.33183.011| siRNA gene target M, Mus musculus; h, human | ThermoFisher Silencer ID | siRNA location | % Knockdown efficiency |
|---|---|---|---|
| mPkd1 (a) | 151949 | 999 | 75 ± 3 |
| mPkd1 (b) | 151951 | 7303 | 73 ± 3 |
| mPkd1-L1 (a) | n398242 | 1075 | 76 ± 2 |
| mPkd1-L1 (b) | n398244 | 806 | 72 ± 3 |
| mPkd2 (a) | 150154 | 1089 | 83 ± 2 |
| mPkd2 (b) | 63551 | 488 | 81 ± 2 |
| mPkd2-L1 (a) | 101318 | 350 | 84 ± 2 |
| mPkd2-L1 (b) | 101422 | 830 | 82 ± 2 |
| mTrpv4 | 182203 | 778 | 80 ± 2 |
| hPKD2 (a) | 104317 | 1100 | 74 ± 2 |
| hPKD2 (b) | 143288 | 3069 | 71 ± 3 |
Table 2
Transmembrane reversal potentials (Erev) measured from pIMCD and HEK-293 PKD2-GFP cilia.
https://doi.org/10.7554/eLife.33183.012| External solution | pIMCD, whole-cilium | HEK-293 PKD2-GFP, whole-cilium | ||
|---|---|---|---|---|
| ΔErev (mean ± S.D.) | Px/PNa (mean ± S.D.) | ΔErev (mean ± S.D.) | Px/PNa (mean ± S.D.) | |
| NaCl | 0 | 1 | 0 | 1 |
| NaMES | −2 ± 3 mV | 0.96 | Not tested | - |
| KCl | 26 ± 3 mV | 2.4 ± 0.3 | 23 ± 4 mV | 2.4 ± 0.4 |
| CaCl2 | −49 ± 4 mV | 0.06 ± 0.04 | −48 ± 3 mV | 0.09 ± 0.04 |
| NMDG | −57 ± 4 mV | 0.04 ± 0.02 | −58 ± 4 mV | 0.04 ± 0.02 |
Table 3
Primers used to detect gene expression using qPCR*.
https://doi.org/10.7554/eLife.33183.027| Gene, m, Mus musculus; H, human | Forward primer 5’−3’ | Reverse primer 5’−3’ |
|---|---|---|
| mPkd1 | CTGGGTGATATTTTGGGACGTAA | GCGTGGCAGTAGTTATCTGCT |
| mPkd1-L1 | ATGCCACTCTTGAAGTGAGCA | CCAGGCAGTGTATCTTCTTCCA |
| mPkd2 | TACAGCGACCCTCCTTCCC | CCTCTGATGCTCCGACAGATATG |
| mPkd2-L1 | CGTGGACATACCATTCCCAGA | ACGGAGAAGTCGATAAAGACCA |
| mTrpv4 | ATGGCAGATCCTGGTGATGG | GGAACTTCATACGCAGGTTTGG |
| hPKD2 | CGTGCCCCAGCCCAGTC | TTCCAGTACAGCCCATCCAATAAG |
-
*Athanasia Spandidos, Xiaowei Wang, Huajun Wang, Stefan Dragnev, Tara Thurber and Brian Seed: A comprehensive collection of experimentally validated primers for Polymerase Chain Reaction quantitation of murine transcript abundance. BMC Genomics 2008, 9:633.
Additional files
-
Transparent reporting form
- https://doi.org/10.7554/eLife.33183.028
Download links
A two-part list of links to download the article, or parts of the article, in various formats.
Downloads (link to download the article as PDF)
Open citations (links to open the citations from this article in various online reference manager services)
Cite this article (links to download the citations from this article in formats compatible with various reference manager tools)
Polycystin-2 is an essential ion channel subunit in the primary cilium of the renal collecting duct epithelium
eLife 7:e33183.
https://doi.org/10.7554/eLife.33183


