Stomach-brain synchrony reveals a novel, delayed-connectivity resting-state network in humans
- École normale supérieure, INSERM, PSL Research University, France
- Fondation Campus Biotech Geneva, Switzerland
- Institut du Cerveau et de la Moelle épinière - ICM, France
Figures
Figure 1
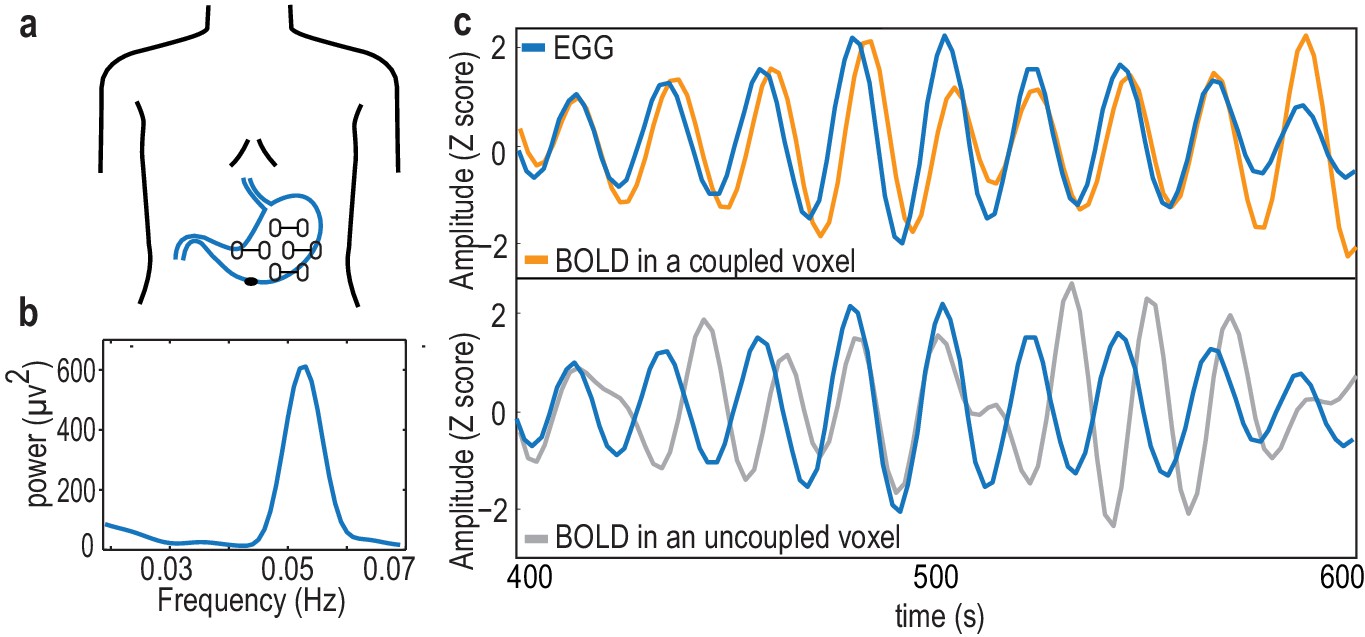
The electrogastrogram (EGG) and gastric-BOLD coupling.
(a) Bipolar electrode montage used to record the EGG. (b) Example of an EGG spectrum in a single participant, with the typical spectral signature in the normogastric frequency range (0.033–0.066 Hz). (c) Example of a 200 s time series of the EGG and BOLD signal filtered at the gastric peak frequency in an EGG-coupled voxel (top), characterized by a stable, non-zero phase relationship between EGG and BOLD, resulting in a high phase-locking value, and in an EGG-uncoupled voxel (bottom) in which no stable phase relationship between EGG and BOLD can be observed.
Figure 2 with 1 supplement
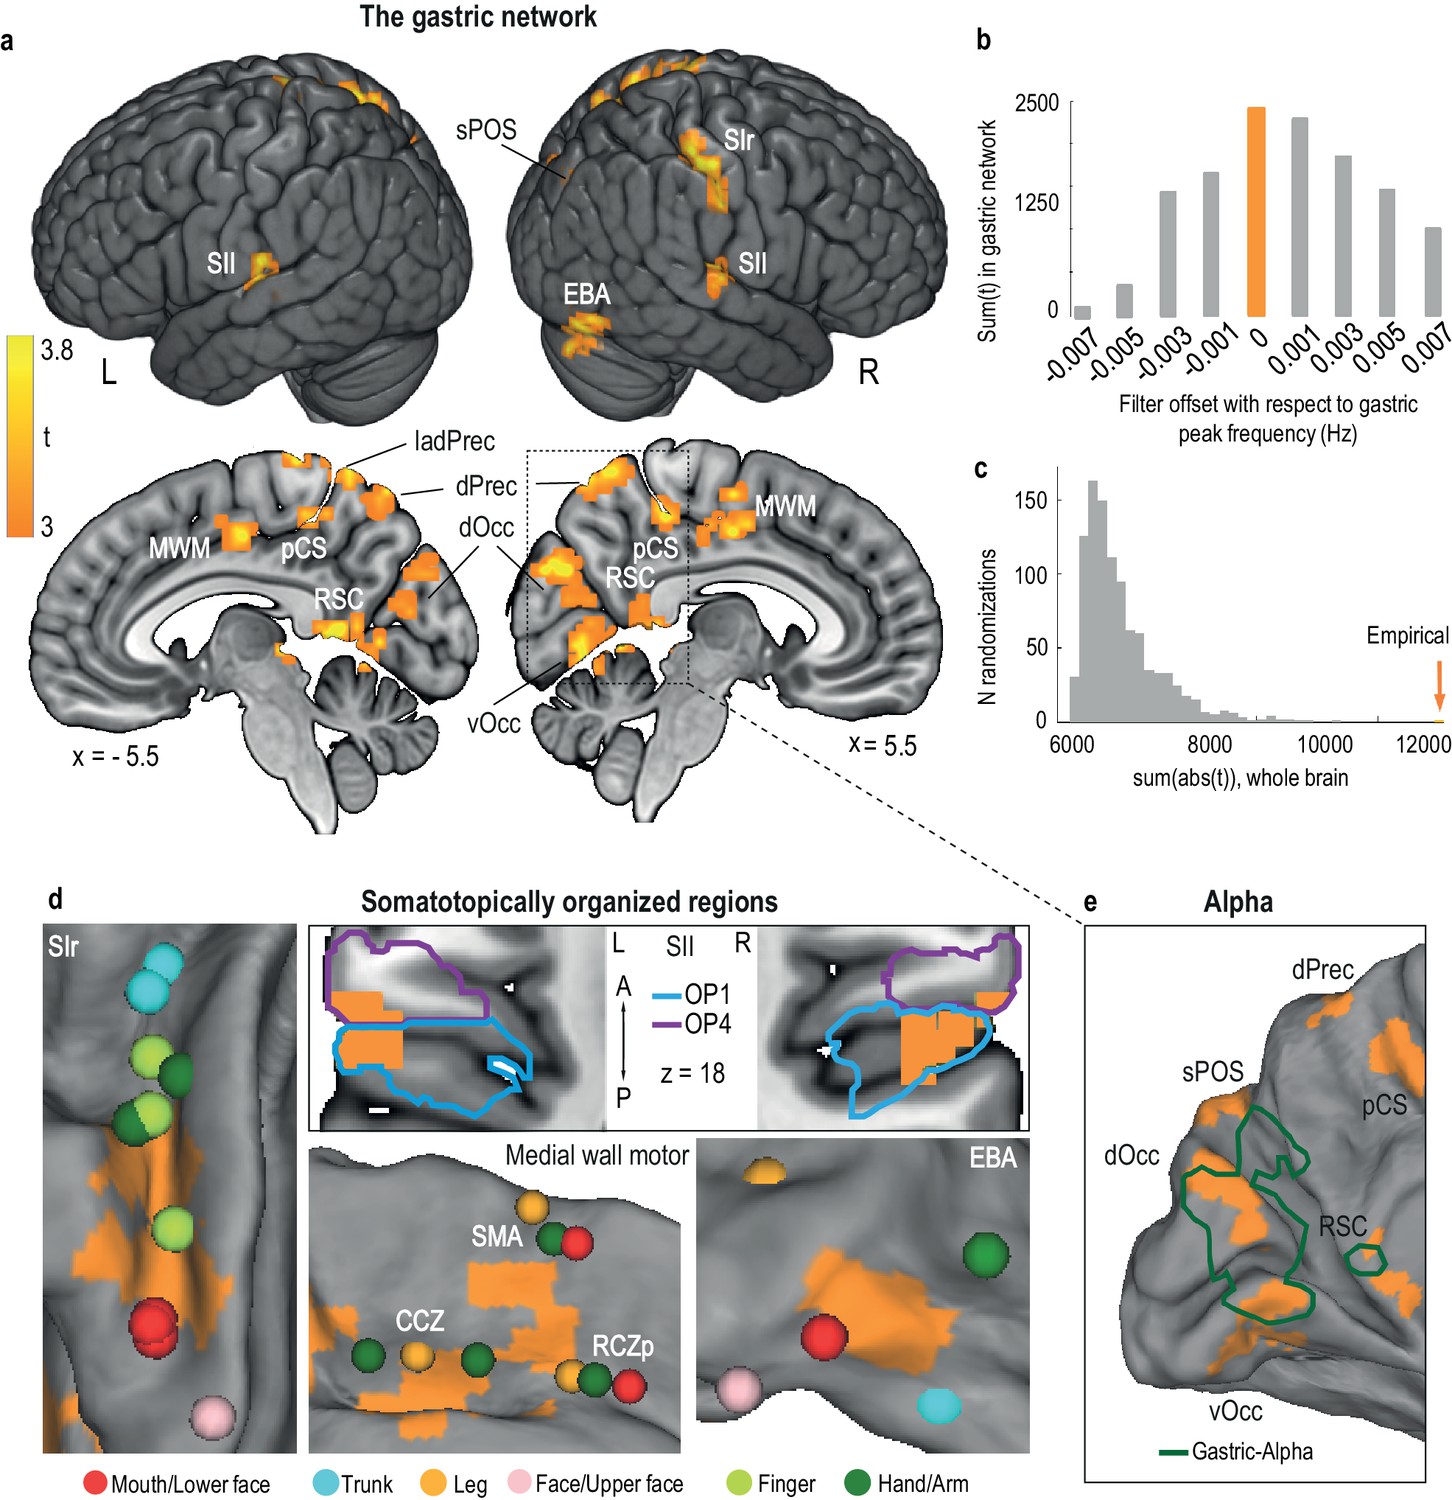
The gastric network.
(a) Regions significantly phase synchronized to gastric rhythm (n = 30, voxel level threshold, p<0.01 two-sided; cluster level threshold, p<0.05, two-sided, intrinsically corrected for multiple comparisons). (b) Gastric-BOLD coupling is specific to gastric frequency. Summary statistics in the gastric network are maximal at the EGG peak frequency (orange) and decrease when offsetting the filter to higher or lower frequencies. (c) Summary statistics distribution under the null hypothesis from 1000 surrogate datasets in which the EGG signal was time-shifted with respect to the BOLD signal. The empirical finding (orange arrow) falls well outside the null distribution. (d) The gastric network (orange) comprises the following somatotopically organized regions: primary somatosensory cortex (Panel SI, with peak activations during stimulation of the trunk and hand (Fabri et al., 2005), finger (Weibull et al., 2008), face (Kopietz et al., 2009), and mouth, that is, teeth (Trulsson et al., 2010), lips and tongue (Miyamoto et al., 2006); secondary somatosensory cortex (Panel SII, cytoarchitectonic subdivisions of SII according to (Scheperjans et al., 2008); OP1, parietal operculum 1 and OP4, parietal operculum 4, presented on a horizontal slice at z = 18); medial wall motor areas (Panel MWM, with peak activations during movement (Amiez and Petrides, 2014) in the caudate cingulate zone (CCZ), posterior rostral cingulate zone (RCZp) and supplementary motor area (SMA)); and extrastriate body area (Panel EBA with peak activations during body part viewing (Orlov et al., 2010), note that because of the visualization on an inflated cortex, the extension of the EBA node to the cerebellum is not visible). (e) Regions in which the alpha and gastric rhythms are coupled (green, modified from [Richter et al., 2017]). Abbreviations are the same as those in Table 1.
-
Figure 2—source data 1
csv file containing the sum of t in gastric network resulting from filtering the EGG and the BOLD signal with an offset with respect to gastric peaking frequency, used for Figure 1b.
- https://doi.org/10.7554/eLife.33321.007
-
Figure 2—source data 2
csv file containing the sum of abs(t) in the whole brain for each randomization of time-shift of the EGG, used for Figure 1c.
- https://doi.org/10.7554/eLife.33321.008
Figure 2—figure supplement 1
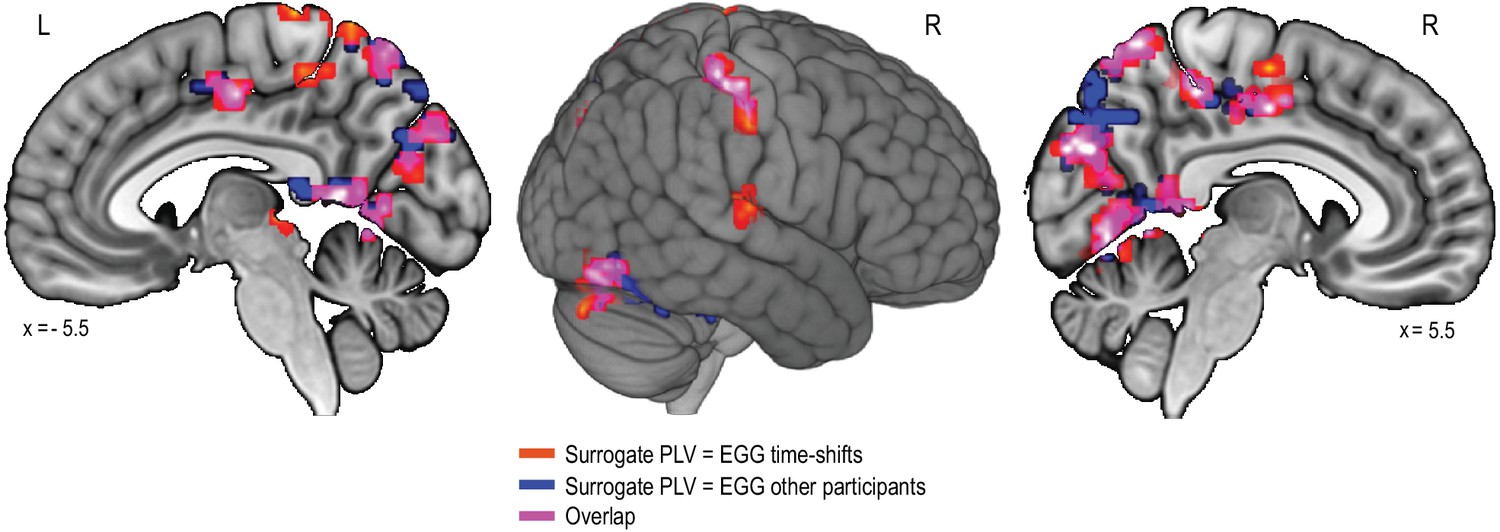
The gastric-network when estimating chance-level PLV by computing gastric-BOLD coupling between the BOLD signal of one participant with the EGG of the other 29 participants.
https://doi.org/10.7554/eLife.33321.006
Figure 3 with 1 supplement

Overlap between the gastric network and regions correlating with heart rate variability and pupil size.
(A) Random effects analysis across participants (N = 30), for the main effects of high- (blue) and low (green)-frequency heart rate variability power fluctuations presented on an inflated brain (pFWE < 0.05 and 30 voxels). The gastric network is represented in orange. (B) Random effects analysis across participants (N = 20), for the main effect of pupil diameter (pink; threshold p<0.001 and 30 voxels). At this threshold, only negative correlations were observed.
-
Figure 3—source data 1
Csv with peak coordinates for group results on high frequency heart rate variability.
- https://doi.org/10.7554/eLife.33321.013
-
Figure 3—source data 2
Csv with peak coordinates for group results on low frequency heart rate variability.
- https://doi.org/10.7554/eLife.33321.014
-
Figure 3—source data 3
Csv with peak coordinates for group results on pupil diameter.
- https://doi.org/10.7554/eLife.33321.015
Figure 3—figure supplement 1
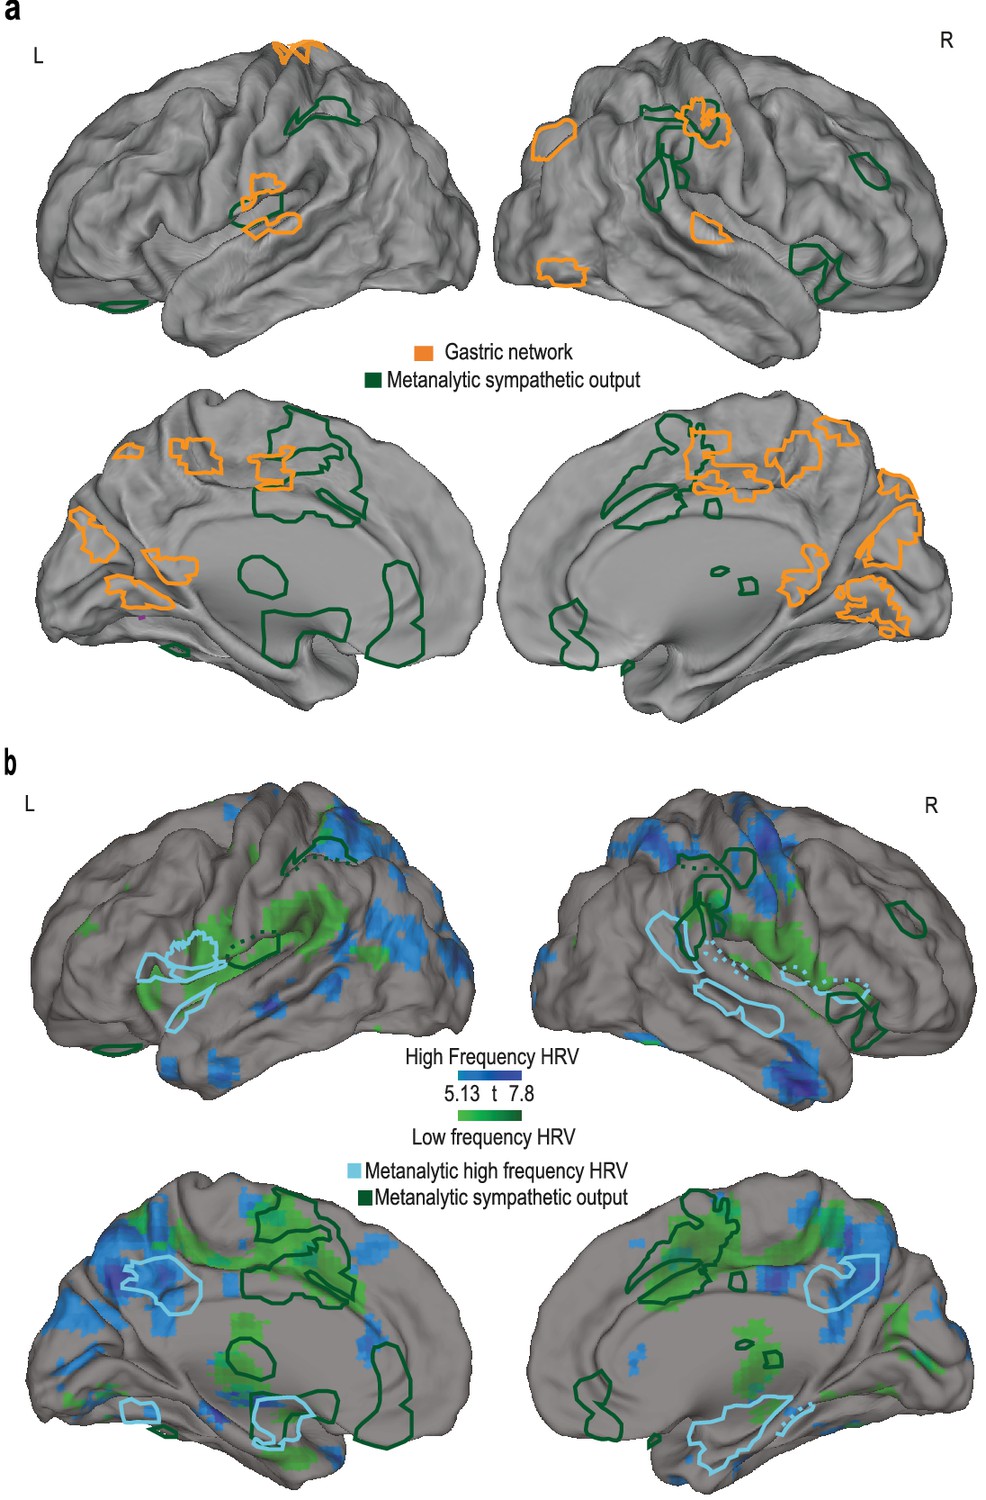
Overlap between the gastric network and meta-analytic sympathetic and parasympathetic regions.
(A) Meta-analytic activations (Beissner et al., 2013) during tasks eliciting sympathetic responses (electrodermal activity, EDA, in green) are superimposed on the gastric network (orange). Dotted lines illustrate the extension of autonomic activity in the depth of the opercular and temporal regions. (B) Comparison of high-frequency (blue) and low-frequency (green) heart rate variability in resting state (n = 30) with a (mostly task-based) meta-analysis (Beissner et al., 2013) of high-frequency variability (light blue) and electrodermal activity (green, same as in A).
Figure 4
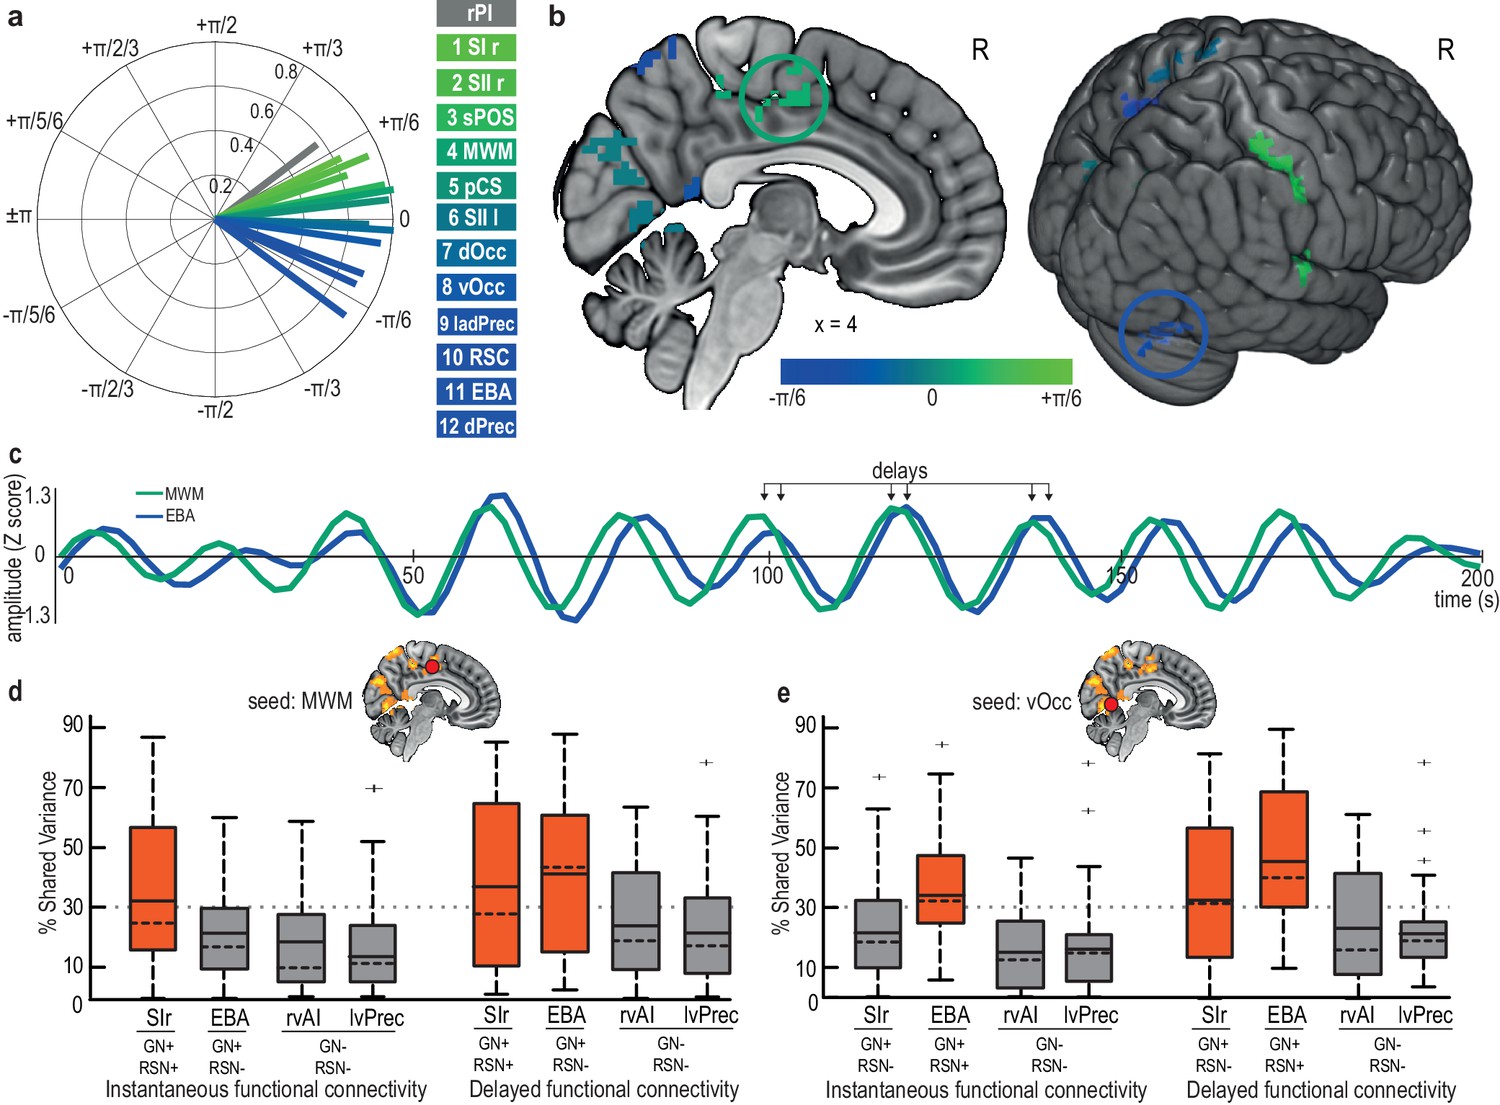
Early and late nodes of the gastric network are functionally connected but with a delay.
(a) Phase-delay consistency of each node of the gastric network. Vector length quantifies the phase consistency across participants, and vector angle indicates phase advance (green) or phase lag (blue) within the gastric network. Temporal delays can reach up to ~3.3 s (±π/6) between the earliest nodes (primary and secondary somatosensory cortices) and the latest nodes (dorsal precuneus and EBA). The right posterior insula (gray) is earlier than any node of the gastric network. (b) Group-averaged phase delays for each cluster in the gastric network. The two circled regions (EBA, blue; MWM, green) are illustrated in C. (c) A 200 s BOLD time series in MWM and EBA in a single participant, showing phase consistency with delays. (d). Group-level functional connectivity across all participants using MWM as a seed, either instantaneous (left) or delayed (right), with regions belonging or not to the gastric network (GN+/-, defined by delayed connectivity) and with regions belonging or not to the same resting-state network (RSN+/-, defined by instantaneous connectivity). Boxes are colored red when the mean FC exceeds 30%. The boxplot presents the mean (full line), median (dashed line), first and third quartiles (box), and extrema (whiskers) excluding outliers (+, defined as exceeding 1.5 interquartile ranges above the third quartile). (e) Group-level functional connectivity across all participants using the vOcc as a seed. Abbreviations: EBA, extrastriate body area; MWM, medial wall motor regions; rSI, right primary somatosensory cortex; rVAI, right ventral anterior insula; lvPrec, left ventral precuneus.
-
Figure 4—source data 1
csv containing the shared variance between MWM time series and SIr, EBA, rvAI and lvPrec time series of each participant using the squared pearson coefficient (columns 1 to 4), and the squared coherence coefficient (columns 5 to 8).
Used for Figure 4d.
- https://doi.org/10.7554/eLife.33321.017
-
Figure 4—source data 2
csv containing the shared variance between vOcc time series and SIr, EBA, rvAI and lvPrec time series of each participant using the squared pearson coefficient (columns 1 to 4), and the squared coherence coefficient (columns 5 to 8).
Used for Figure 4e.
- https://doi.org/10.7554/eLife.33321.018
Figure 5
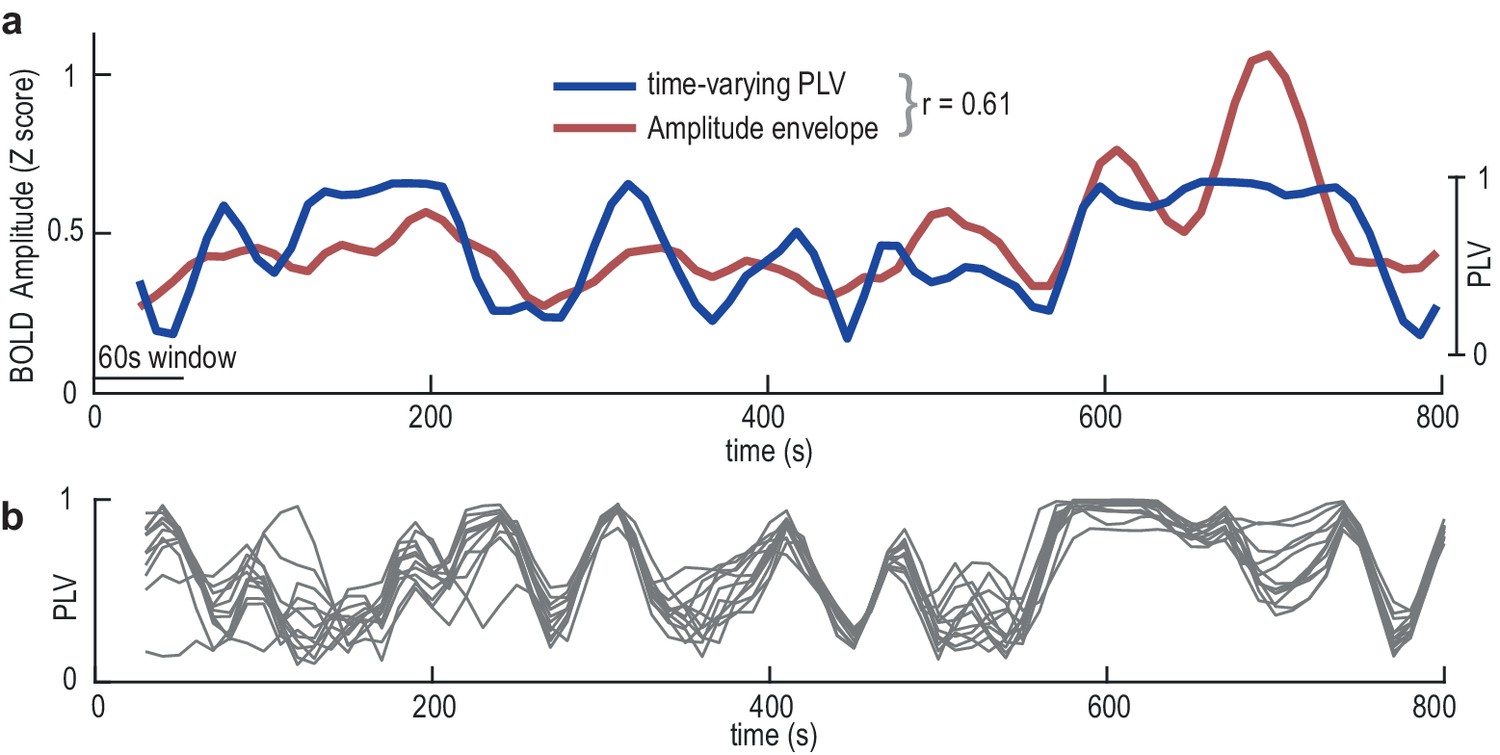
Dynamic fluctuations in EGG-BOLD coupling.
(a) Data from the superior parieto-occipital sulcus in a single participant showing the correlation (r = 0.61) between the time-varying gastric-BOLD coupling (PLV, blue) and the amplitude envelope of the BOLD time series (red). (b) Time-varying PLV at each node of the gastric network in the same participant showing a strong correlation across nodes (average r across all possible node pairs 0.35).
Tables
Table 1
Description of the 12 nodes showing larger-than-chance gastric-BOLD phase coupling.
AAL: Automated Anatomical labeling (Tzourio-Mazoyer et al., 2002). MNI: Montreal Neurological Institute.
| Node name | Monte-Carlo p | Sum (t) | Cluster volume in mm3 | Label AAL | mm3 | % Area in Cluster | Max t | MNI of max t | EGG-BOLD shared Variance ± sem | ||
|---|---|---|---|---|---|---|---|---|---|---|---|
| X | Y | Z | |||||||||
| Primary Somatosensory Right (SIr) | 0.0049 | 216.5 | 180 | Postcentral R | 171 | 8.8 | 4.8 | 45 | −28 | 46 | 12.5% ± 2.0 |
| Secondary Somatosensory Right (SIIr) | 0.0131 | 146.1 | 120 | Rolandic Oper R | 12 | 1.8 | 4.2 | 54 | −22 | 13 | 15.7% ± 2.2 |
| Heschl R | 6 | 4.7 | 3.9 | 51 | −19 | 10 | |||||
| Temporal Sup R | 99 | 6 | 5.3 | 57 | −25 | 13 | |||||
| Secondary Somatosensory Left (SIIl) | 0.0094 | 167.0 | 138 | Postcentral L | 39 | 2.0 | 4.5 | −66 | −22 | 22 | 16.6% ± 2.2 |
| SupraMarginal L | 21 | 3.3 | 3.8 | −60 | −25 | 16 | |||||
| Heschl L | 15 | 13.1 | 3.9 | −54 | −16 | 7 | |||||
| Temporal Sup L | 60 | 5 | 5.2 | −54 | −19 | 7 | |||||
| Medial Wall Motor Regions (MWM) | 0.0036 | 269.5 | 228 | Supp Motor Area L | 30 | 2.7 | 3.8 | 0 | −13 | 49 | 15.8% ± 2.1 |
| Supp Motor Area R | 54 | 4.5 | 4.8 | 9 | -4 | 52 | |||||
| Cingulum Mid L | 66 | 6.7 | 4.9 | 0 | −22 | 43 | |||||
| Cingulum Mid R | 75 | 6.7 | 4.7 | 6 | −10 | 43 | |||||
| Posterior Cingulate Sulcus (pCS) | 0.0061 | 196.7 | 171 | Cingulum Mid L | 39 | 3.9 | 4.2 | -9 | −37 | 52 | 16.9% ± 2.3 |
| Cingulum Mid R | 24 | 2.1 | 4.5 | 6 | −37 | 49 | |||||
| Precuneus L | 21 | 1.2 | 3.9 | 0 | −37 | 55 | |||||
| Precuneus R | 39 | 2.3 | 3.8 | 6 | −40 | 52 | |||||
| Paracentral Lobule R | 39 | 9.1 | 4.1 | 15 | −40 | 55 | |||||
| Dorsal Precuneus (dPrec) | 0.0071 | 186.6 | 156 | Precuneus L | 42 | 2.3 | 4.9 | -3 | −67 | 61 | 12.7% ± 1.9 |
| Precuneus R | 87 | 5.2 | 4.4 | 3 | −64 | 64 | |||||
| Dorsal Precuneus Left Anterior (ladPrec) | 0.0178 | 125.5 | 108 | Precuneus L | 57 | 3.2 | 4.1 | -6 | −55 | 73 | 12.0% ± 2.0 |
| Paracentral Lobule L | 48 | 7.0 | 4.3 | -6 | −34 | 76 | |||||
| Occipital Ventral (vOcc) | 0.0017 | 374.2 | 321 | Calcarine L | 18 | 1.6 | 4.1 | 0 | −64 | 10 | 16.6% ± 2.6 |
| Lingual L | 66 | 6 | 4.4 | 0 | −67 | 7 | |||||
| Lingual R | 108 | 9 | 4.4 | 6 | −70 | -5 | |||||
| Cerebellum 6 R | 21 | 2.3 | 4.3 | 12 | −70 | −14 | |||||
| Vermis 4 5 | 51 | 15.0 | 4.6 | 0 | −61 | -2 | |||||
| Vermis 6 | 9 | 4.8 | 3.7 | 3 | −70 | -8 | |||||
| Occipital Dorsal (dOcc) | 0.0034 | 285.1 | 243 | Calcarine L | 21 | 1.8 | 4 | 3 | −76 | 16 | 16.7% ± 2.7 |
| Cuneus L | 138 | 17.7 | 4.5 | -3 | −85 | 31 | |||||
| Cuneus R | 72 | 9.9 | 4.9 | 6 | −76 | 28 | |||||
| Extrastriate Body Area Right (EBA) | 0.0103 | 163.3 | 138 | Occipital Inf R | 45 | 8.9 | 4.5 | 48 | −76 | −14 | 14.3% ± 2.0 |
| Temporal Inf R | 27 | 1.5 | 4.4 | 57 | −70 | −11 | |||||
| Cerebellum Crus1 R | 33 | 2.4 | 4.8 | 45 | −82 | −26 | |||||
| Superior Parieto-Occipital Sulcus (sPOS) | 0.0245 | 107.1 | 87 | Cuneus R | 21 | 2.9 | 4.6 | 21 | −76 | 43 | 12.5% ± 1.8 |
| Occipital Sup R | 54 | 7.5 | 5.1 | 24 | −79 | 43 | |||||
| Retrosplenial Cortex (RSC) | 0.0084 | 175.6 | 147 | Cingulum Post L | 3 | 1.3 | 3.5 | -6 | −43 | 10 | 15.4% ±2.1 |
| Cingulum Post R | 9 | 5.3 | 3.7 | 6 | −40 | 7 | |||||
| Lingual R | 18 | 1.5 | 4.1 | 9 | −37 | -2 | |||||
| Precuneus L | 36 | 2.0 | 4.4 | -6 | −49 | 7 | |||||
Table 2
Effects of demographical variables on coupling strength at each node.
Statistics are not corrected for multiple comparisons. Bayes factor smaller than 0.33 indicate evidence for the null hypothesis, Bayes factor larger than three indicate evidence for an effect
| Gender | BMI | Stai A | |||||||
|---|---|---|---|---|---|---|---|---|---|
| t | p | Bf | r | p | Bf | r | p | Bf | |
| SI | 1.537 | 0.146 | 0.830 | 0.072 | 0.707 | 0.151 | 0.022 | 0.909 | 0.142 |
| SIIr | 0.476 | 0.642 | 0.375 | 0.187 | 0.322 | 0.230 | −0.084 | 0.657 | 0.156 |
| SIIl | 2.542 | 0.023 | 3.455 | 0.270 | 0.150 | 0.396 | −0.272 | 0.146 | 0.402 |
| RCZp | 1.429 | 0.175 | 0.738 | 0.107 | 0.575 | 0.165 | −0.255 | 0.174 | 0.353 |
| pCS | 2.506 | 0.025 | 3.250 | 0.142 | 0.454 | 0.187 | −0.296 | 0.112 | 0.493 |
| dPrec | 1.265 | 0.227 | 0.628 | 0.035 | 0.853 | 0.144 | −0.243 | 0.196 | 0.324 |
| dPrec la | 1.289 | 0.218 | 0.642 | 0.224 | 0.234 | 0.285 | −0.215 | 0.254 | 0.269 |
| vOcc | 2.342 | 0.034 | 2.487 | 0.342 | 0.065 | 0.769 | 0.003 | 0.988 | 0.141 |
| dOcc | 2.075 | 0.057 | 1.656 | 0.337 | 0.069 | 0.729 | −0.068 | 0.723 | 0.150 |
| EBA | 1.882 | 0.081 | 1.267 | −0.064 | 0.735 | 0.150 | −0.250 | 0.183 | 0.341 |
| sPOS | 2.164 | 0.048 | 1.889 | 0.481 | 0.007 | 5.133 | −0.143 | 0.450 | 0.187 |
| RSC | 1.129 | 0.278 | 0.556 | 0.105 | 0.579 | 0.165 | −0.317 | 0.088 | 0.600 |
-
Table 2–Source data 1
csv with data per subject: gender, trait anxiety, BMI, and coupling strength at each node.
- https://doi.org/10.7554/eLife.33321.010
Additional files
-
Transparent reporting form
- https://doi.org/10.7554/eLife.33321.020
Download links
A two-part list of links to download the article, or parts of the article, in various formats.
Downloads (link to download the article as PDF)
Open citations (links to open the citations from this article in various online reference manager services)
Cite this article (links to download the citations from this article in formats compatible with various reference manager tools)
Stomach-brain synchrony reveals a novel, delayed-connectivity resting-state network in humans
eLife 7:e33321.
https://doi.org/10.7554/eLife.33321


